Abstract
The first evidence of native cyclodextrins fusion was registered using fast scanning calorimetry (FSC) with heating rates up to 40,000 K s−1. The endothermal effects, detected at low heating rates, correspond to the decomposition processes. Upon the increase of the heating rate the onset of these effects shifts to higher temperatures, reaching a limiting value at high heating rates. The limiting temperatures were identified as the melting points of α-, β- and γ-cyclodextrins, as the decomposition processes are suppressed at high heating rates. For γ-cyclodextrin the fusion enthalpy was measured. The activation energies of thermal decomposition of cyclodextrins were determined by dependence of the observed thermal effects on heating rates from 4 K min−1 in conventional differential scanning calorimetry to 40,000 K s−1 in FSC. The lower thermal stability and activation energy of decomposition of β-cyclodextrin than for the other two cyclodextrins were found, which may be explained by preliminary phase transition and chemical reaction without mass loss. The obtained values of fusion parameters of cyclodextrins are needed in theoretical models widely used for prediction of solubility and solution rates and in preparation of cyclodextrin inclusion compounds involving heating.
1. Introduction
Native cyclodextrins (CDs) are pharmaceutically important biomolecules, which applications require a knowledge of their melting parameters. Melting points and fusion enthalpies are essential parameters used in theoretical models for prediction of solubility [1,2,3] and in correlations with dissolution rates [4,5], which are key physical values for pharmaceuticals [6,7]. CDs are used as excipients enhancing the solubility and dissolution rate of active pharmaceutical ingredients [8,9]. So, the melting parameters of CDs may be used to expand the existing predictive approaches also to the solubility and dissolution rates of CDs and their inclusion compounds. The problem is in a limited thermal stability of CDs, which does not allow to study their fusion because CDs decompose long before melting point when studied by conventional methods, e.g., by differential scanning calorimetry (DSC) [10]. So, a special experimental technique is necessary to overcome this problem.
A state-of-the-art method for determination of melting parameters for compounds of low thermal stability is fast scanning calorimetry (FSC) [6,11,12,13]. FSC was used to determine melting properties of thermally labile biomolecules: proteins [14], peptides [15], amino acids [5], pharmaceuticals [16,17], mono and disaccharides [1], and nucleobases [18]. This method uses special chip sensors that are both sample holders and electrical circuits for sample heating and determination of its temperature and heat flow at scanning rates of several thousand K per second due to the extremely low addenda heat capacity and sample size [19]. Due to the rapid heating, the fusion may complete before the decomposition processes of studied compounds [15,18]. Even fastest conventional DSC (Hyper-DSC by Perkin Elmer) used to detect fusion of pharmaceuticals within separate pans [20] with heating rates of a few hundred K min−1 is not suitable to study the melting of cyclodextrins because they have too big and thermally labile molecules. So, in the present work, FSC method was first used to determine melting parameters of native cyclodextrins.
Our approach to the study of CDs melting properties is based on the analysis of their thermal effects dependence on heating rate. In relatively slow thermal analysis, decomposition of cyclodextrins occurs [10]. This process for β-cyclodextrin and other carbohydrates has a significant dependence of decomposition temperature on heating rate [21]. So, conventional DSC method was used in the present work to determine kinetic parameters of thermal decomposition for three native CDs: α-, β-, and γ-cyclodextrin. From these data, the correlation of decomposition temperature with heating rate was estimated. FSC method was applied to find the scanning rate above which this correlation breaks resulting in relatively small further shift of the observed endothermic effect by temperature. Such marginal dependence on heating rate is intrinsic to fusion of biomolecules in FSC studies [1,15,18]. From the onset temperature of main thermal effect in this range of heating rates the melting points of native CDs were determined.
2. Results and Discussion
To study the kinetics of thermal decomposition and fusion of native CDs, the samples of αCD, βCD, and γCD were studied by methods of simultaneous TG/DSC with heating rates of 4, 10 and 30 K min−1 and FSC with the rates of 30–40,000 K s−1. The TG/DSC and FSC curves obtained are shown in Figure 1 for αCD and in Supplementary Information (SI) for βCD and γCD. From these curves the onset temperatures To of the main endothermic peaks were determined for each sample, Table 1.
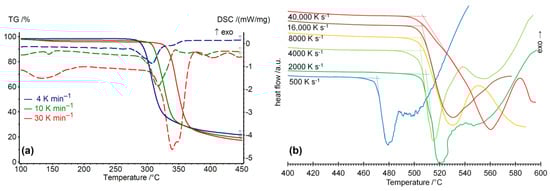
Figure 1.
The influence of heating rates on the curves of thermal analysis of dry α-cyclodextrin: (a) simultaneous TG (solid lines) and DSC (dashed lines), (b) FSC experiment, where the cross-points of dotted lines indicate the onset points To of the main endothermic effect of decomposition or fusion.

Table 1.
Onset temperatures (To) of main endothermic peak for anhydrous natural cyclodextrins at different heating rates (β) *.
The analysis of data obtained indicates that To values significantly increase with the increase in heating rate up to 2000 K s−1, Figure 2a. At higher heating rates β of 2000–40,000 K s−1, To values do not change significantly, Figure 2a. Such behavior can be explained by two different processes corresponding to To. At low heating rates, the values To correspond to the onset points of thermal decomposition. Since this decomposition is a chemical process, To increases significantly with increasing heating rate. At higher heating rates, the nearly constant To values indicate that a fusion occurs first in cyclodextrins, preceding their further decomposition. Thus, for α-, β-, and γ-cyclodextrins, the melting point Tm is 507, 501, and 474 °C, respectively. These values are calculated as the average ones for heating rates 2000–40,000 K s−1.
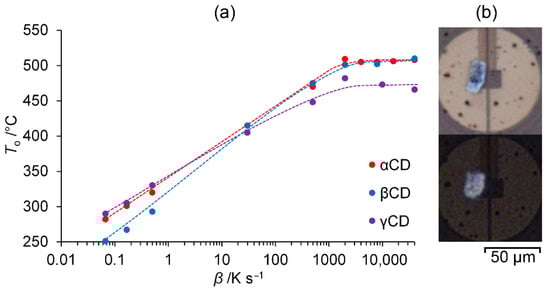
Figure 2.
(a) Correlation of onset temperatures (To) of main endothermic peak with the heating rate β in DSC and FSC experiments for dry native cyclodextrins (the lines are given to guide the eye); (b) the microscope pictures of αCD sample in polarized light before (upper) and after (lower) melting by heating to 520 °C and cooling to room temperature with the rate of 40,000 K s−1.
Melting of αCD was revealed also by polarized light microscopy. Upon heating above its melting point of 520 °C derived from To vs. β correlation and cooling to room temperature at a rate of 40,000 K s−1, the sample of αCD contracts to more round shape remaining colorless and crystalline, Figure 2b, which shows that α-cyclodextrin melts without decomposition at its Tm value found.
The observed differences in melting points of native CDs are consistent with thermodynamic properties of anhydrous CDs. The anhydrous γCD has much more negative enthalpy of solution in water and N,N-dimethylformamide, compared to αCD and βCD [22]. Presuming that all CDs have a similar state in solution, the higher energy of solid γCD can explain its lower melting point.
To calculate the kinetic parameters of CDs decomposition, slope of the plot ‘lgβ vs. 1000/To’ was determined for each studied CD, Figure 3. This correlation is linear for DSC and FSC data for heating rates below 2000 K s−1 for αCD, and below 500 K s−1 for βCD and γCD. According to the Flynn–Wall–Ozawa method [21], its slope gives activation energy Ea of the initial stage of thermal decomposition (SI). The activation energy of this process is equal to 163, 105, and 160 kJ mol−1 for αCD, βCD, and γCD, respectively.
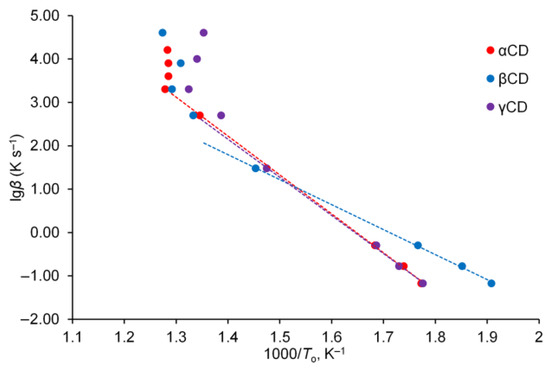
Figure 3.
Fitting by Flynn–Wall–Ozawa method for dependence of To on heating rate.
The TG/DSC data obtained also allow to estimate Ea value from the thermogravimetric data in the wide range of decomposition degree. Approximation of these thermokinetic data by model methods shows that for the native CDs studied the most appropriate kinetic model is CnB which corresponds to the nth order reaction with autocatalysis, the corresponding conversion function is f(α) = (1 − α)n · (1 + Kcatα). In this case, the optimal activation energies Ea are 147, 177, and 156 kJ mol−1, respectively.
The TG data were also analyzed using isoconversional model-free methods: differential Friedman and integral Flynn–Wall–Ozawa. These methods do not require any assumptions of the kinetic equation other than the Arrhenius-type temperature dependence of the reaction rate [23]. In the range of conversion degrees 0.1–0.7, these methods give average Ea, respectively, 149 and 146 kJ mol−1 for αCD, 169 and 174 kJ mol−1 for βCD, 154 and 156 kJ mol−1 for γCD (SI). These Ea values are nearly the same and, in the case of αCD and γCD, are close to the Ea values calculated from DSC and FSC data for the initial stage of decomposition.
The activation energies calculated from calorimetric and TG data are close for αCD and γCD —the difference does not exceed 10–15 kJ mol−1. For βCD, the difference between activation energies calculated by different methods is significant: 65–73 kJ mol−1. Such difference can be explained by the different onset temperatures observed in TG and DSC measurement. For βCD, the average difference between TG and DSC onset points is 33 K, while as for αCD and γCD it is equal to 12 and 6 K, respectively. For βCD, earlier DSC onset can be explained by preliminary phase transition or intramolecular reaction without a change in mass. Moreover, for βCD, a phase transition is observed at 222 °C (SI), which has been observed also elsewhere [10]. All these effects can increase the energy of βCD thus decreasing activation energy of initial step of its main thermal degradation.
The FSC experiment for γCD allows determination of its fusion enthalpy ΔHm. This cyclodextrin has the lower melting point than the other CDs studied, Table 1, and its melting and decomposition peaks are separate at the heating rate of 10,000 K s−1, Figure 4. So, the molar fusion enthalpy ΔHm of γCD can be calculated. For this study, we additionally determined the molar heat capacity Cp,m of this cyclodextrin in the range of 80–220 °C (SI), which is needed to find its sample mass in FSC experiment. The temperature dependence of this parameter is expressed by the equation Cp,m (J mol−1 K−1) = 781 + 9.13T − 0.0043T². At 298 K, this equation gives the value of Cp,m = 1556 J mol−1 K−1, which is in a good agreement with the previously determined value of Cp,m = 1568 J mol−1 K−1 [24]. Two runs of FSC experiments for γCD at a rate of 10,000 K s−1 give molar fusion enthalpy of ΔHm = 221 ± 9 kJ mol−1 (SI). The corresponding molar fusion entropy of γCD (at Tm = 474 °C) is ΔSm = 296 ± 12 J mol−1 K−1.
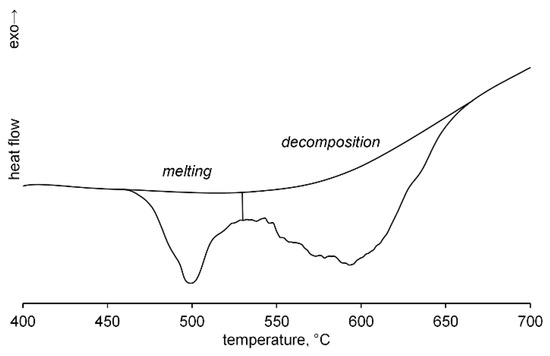
Figure 4.
FSC curve for γ-cyclodextrin at heating rate of 10,000 K s−1.
3. Materials and Methods
3.1. Materials
α-Cyclodextrin and γ-cyclodextrin were obtained commercially from Sigma-Aldrich with Cat. Nos. 28705, 779431, respectively. β-Cyclodextrin was obtained from ICN, Cat. No. 190053.
3.2. Simultaneous TG/DSC Experiment
Before the experiment, all CD samples were dried at 140 °C and 100 Pa in a vacuum oven for 8 h. The residual hydration of CD samples was no more than 2% wt. or 1.1 mol water per mol CD according to TG data.
The device of simultaneous thermogravimetry and differential scanning calorimetry (TG/DSC) Netzsch STA 449 C Jupiter was used to determine thermal decomposition curves of dried cyclodextrins with heating rates of 4, 10, and 30 K min−1 in an argon flow of 75 mL min−1. In this experiment, the CD samples (10–15 mg) were studied in aluminum crucibles (40 μL) with lids having 3 holes of 0.5 mm in diameter. Before heating, the samples were purged with argon at room temperature inside the device until the constant weight.
3.3. Model-Free Methods of Thermokinetic Analysis
Two model-free methods of Friedman [25] and Ozawa–Flynn–Wall [26,27] were used for approximation of the experimental data according to the recommendation of International Confederation for Thermal Analysis and Calorimetry [28].
In Friedman method, for a linear non-isothermal program, the next equation is used:
where Ea is activation energy, β is heating rate, i marks an individual heating rate, A is pre-exponential factor and α is the extent of conversion. The Ea and pre-exponential factor are calculated from the slope of the plots of ln (dα/dT) vs. 1/T.
ln [βi·(dα/dT)α,i] = ln A + ln f(α) − Ea/RTα,i
The Flynn−Wall−Ozawa method is a model-free method that requires the detection of temperatures corresponding to isoconversional values of α from experiments at different heating rates β [23]:
ln β = 5.523 − 1.052(Ea/RT)
Thus, the plot of ln β vs 1/T gives straight line with slope −1.052(Ea/R).
3.4. DSC Experiment
The molar heat capacity Cp,m of dry γ-cyclodextrin was measured using Netzsch DSC204 F1 Phoenix differential scanning calorimeter. This procedure using sapphire disk as a standard sample was described in detail earlier [12].
3.5. Fast Scanning Calorimetry
FSC experiments were performed using Flash DSC2+ (Mettler Toledo, Switzerland) with MultiSTAR UFH1 sensors. Before use, each UFH1 sensor was conditioned and corrected according to the procedure defined by the manufacturer. The measured temperature of the sensors was calibrated using organic compounds having well known melting temperatures as described elsewhere [29]. In FSC experiment, crystal aggregates with a total mass of 20–50 ng were placed at the center of sensor. Temperature scan of these samples was performed in argon dynamic atmosphere with 80 ml/min flow rate.
To get rid of the dehydration thermal effect, which was observed elsewhere at temperatures up to 160 °C [30,31,32], all CD samples were preheated directly on FSC chip to a temperature 200 °C in argon flow. Such heating was repeated several times until the heat flow in FSC curves reached a constant level.
Activation energies of initial stage of CDs decomposition were calculated by Flynn–Wall–Ozawa method described in detail for other carbohydrate biopolymers [21].
The molar fusion enthalpy of γCD was determined using FSC as described elsewhere [11]. In this experiment, the sample of γCD was cyclically heated and cooled 5 times in the range of 70–200 °C before melting. The heating and cooling curves in these runs and the molar heat capacity Cp,m of γCD from the DSC experiment were used to calculate the mass of sample on FSC chip. The molar enthalpy of melting was calculated from the thermal effect in FSC curve for the same sample heated up to 700 °C.
4. Conclusions
The melting points of thermally unstable α-, β-, and γ-cyclodextrin and the kinetic parameters of their thermal decomposition were determined using fast scanning calorimetry, which gives a possibility to shift decomposition temperature of thermally unstable compound above its fusion process using very fast heating rates. The same approach may be extended to crystalline inclusion complexes of native cyclodextrins with various medical drugs. β-Cyclodextrin was found to have a lower activation energy of decomposition what may be explained by preliminary phase transition and the following chemical reaction without loss of mass. Such specific feature of β-cyclodextrin thermal stability must be considered during preparation of its complexes involving heating.
The determined fusion enthalpy and entropy of γ-cyclodextrin may be used to check the theoretical models predicting these properties for organic compounds from structural parameters of their molecules. Melting points and enthalpy obtained in this work are needed for models predicting aqueous solubility of CDs which can be helpful for their applications as excipients enhancing the solubility and dissolution rate of active pharmaceutical ingredients.
Supplementary Materials
The following supporting information (FSC and TG/DSC curves, thermokinetic analysis, molar heat capacity and ΔHm calculations for γ-cyclodextrin) can be downloaded at: https://www.mdpi.com/article/10.3390/ijms232113120/s1. Reference [21] is cited in the supplementary materials.
Author Contributions
A.K.G. conceptualization, formal analysis, writing—original draft; I.A.G. investigation; A.V.B. investigation; M.A.Z. validation, methodology; T.A.M. supervision, writing—review and editing, V.V.G. supervision, writing—review and editing. All authors have read and agreed to the published version of the manuscript.
Funding
The work was supported by the RSF grant No. 22-23-00367.
Institutional Review Board Statement
Not applicable.
Informed Consent Statement
Not applicable.
Data Availability Statement
Not applicable.
Conflicts of Interest
The authors declare no conflict of interest.
References
- Chua, Y.Z.; Do, H.T.; Kumar, A.; Hallermann, M.; Zaitsau, D.; Schick, C.; Held, C. The Melting Properties of D-α-Glucose, D-β-Fructose, D-Sucrose, D-α-Galactose, and D-α-Xylose and Their Solubility in Water: A Revision. Food Biophys. 2022, 17, 181–197. [Google Scholar] [CrossRef]
- Jain, N.; Yalkowsky, S.H. Estimation of the Aqueous Solubility I: Application to Organic Nonelectrolytes. J. Pharm. Sci. 2001, 90, 234–252. [Google Scholar] [CrossRef]
- Manson, A.; Sefcik, J.; Lue, L. Temperature Dependence of Solubility Predicted from Thermodynamic Data Measured at a Single Temperature: Application to α, β, and γ-Glycine. Cryst. Growth Des. 2022, 22, 1691–1706. [Google Scholar] [CrossRef] [PubMed]
- Yoshihashi, Y.; Kitano, H.; Yonemochi, E.; Terada, K. Quantitative Correlation between Initial Dissolution Rate and Heat of Fusion of Drug Substance. Int. J. Pharm. 2000, 204, 1–6. [Google Scholar] [CrossRef]
- Rimer, J.D.; Trofymluk, O.; Navrotsky, A.; Lobo, R.F.; Vlachos, D.G. Kinetic and Thermodynamic Studies of Silica Nanoparticle Dissolution. Chem. Mater. 2007, 19, 4189–4197. [Google Scholar] [CrossRef]
- Do, H.T.; Chua, Y.Z.; Kumar, A.; Pabsch, D.; Hallermann, M.; Zaitsau, D.; Schick, C.; Held, C. Melting Properties of Amino Acids and Their Solubility in Water. RSC Adv. 2020, 10, 44205–44215. [Google Scholar] [CrossRef]
- Wyttenbach, N.; Niederquell, A.; Kuentz, M. Machine Estimation of Drug Melting Properties and Influence on Solubility Prediction. Mol. Pharm. 2020, 17, 2660–2671. [Google Scholar] [CrossRef]
- Saokham, P.; Muankaew, C.; Jansook, P.; Loftsson, T. Solubility of Cyclodextrins and Drug/Cyclodextrin Complexes. Molecules 2018, 23, 1161. [Google Scholar] [CrossRef]
- Viernstein, H.; Wolschann, P. Cyclodextrin Inclusion Complexation and Pharmaceutical Applications. ScienceAsia 2020, 46, 254. [Google Scholar] [CrossRef]
- Hădărugă, N.G.; Bandur, G.N.; David, I.; Hădărugă, D.I. A Review on Thermal Analyses of Cyclodextrins and Cyclodextrin Complexes. Environ. Chem. Lett. 2019, 17, 349–373. [Google Scholar] [CrossRef]
- Abdelaziz, A.; Zaitsau, D.H.; Mukhametzyanov, T.A.; Solomonov, B.N.; Cebe, P.; Verevkin, S.P.; Schick, C. Melting Temperature and Heat of Fusion of Cytosine Revealed from Fast Scanning Calorimetry. Thermochim. Acta 2017, 657, 47–55. [Google Scholar] [CrossRef]
- Safiullina, A.S.; Buzyurov, A.V.; Ziganshina, S.A.; Gerasimov, A.V.; Schick, C.; Gorbatchuk, V.V.; Ziganshin, M.A. Using Fast Scanning Calorimetry to Study Solid-State Cyclization of Dipeptide L-Leucyl-L-Leucine. Thermochim. Acta 2020, 692, 178748. [Google Scholar] [CrossRef]
- Gabdulkhaev, M.N.; Ziganshin, M.A.; Buzyurov, A.V.; Schick, C.; Solovieva, S.E.; Popova, E.V.; Gubaidullin, A.T.; Gorbatchuk, V.V. Smart Control of Calixarene Polymorphic States. CrystEngComm 2020, 22, 7002–7015. [Google Scholar] [CrossRef]
- Cebe, P.; Thomas, D.; Merfeld, J.; Partlow, B.P.; Kaplan, D.L.; Alamo, R.G.; Wurm, A.; Zhuravlev, E.; Schick, C. Heat of Fusion of Polymer Crystals by Fast Scanning Calorimetry. Polymer 2017, 126, 240–247. [Google Scholar] [CrossRef]
- Do, H.T.; Chua, Y.Z.; Habicht, J.; Klinksiek, M.; Hallermann, M.; Zaitsau, D.; Schick, C.; Held, C. Melting Properties of Peptides and Their Solubility in Water. Part 1: Dipeptides Based on Glycine or Alanine. RSC Adv. 2019, 9, 32722–32734. [Google Scholar] [CrossRef]
- Corvis, Y.; Wurm, A.; Schick, C.; Espeau, P. Vitreous State Characterization of Pharmaceutical Compounds Degrading upon Melting by Using Fast Scanning Calorimetry. J. Phys. Chem. B 2015, 119, 6848–6851. [Google Scholar] [CrossRef]
- Kons, A.; Mishnev, A.; Mukhametzyanov, T.A.; Buzyurov, A.V.; Lapuk, S.E.; Bērziņš, A. Hexamorphism of Dantrolene: Insight into the Crystal Structures, Stability, and Phase Transformations. Cryst. Growth Des. 2021, 21, 1190–1201. [Google Scholar] [CrossRef]
- Abdelaziz, A.; Zaitsau, D.H.; Kuratieva, N.V.; Verevkin, S.P.; Schick, C. Melting of Nucleobases. Getting the Cutting Edge of “Walden’s Rule”. Phys. Chem. Chem. Phys. 2019, 21, 12787–12797. [Google Scholar] [CrossRef]
- Mathot, V.; Pyda, M.; Pijpers, T.; Vanden Poel, G.; van de Kerkhof, E.; van Herwaarden, S.; van Herwaarden, F.; Leenaers, A. The Flash DSC 1, a Power Compensation Twin-Type, Chip-Based Fast Scanning Calorimeter (FSC): First Findings on Polymers. Thermochim. Acta 2011, 522, 36–45. [Google Scholar] [CrossRef]
- Petitprez, J.; Legrand, F.-X.; Tams, C.; Pipkin, J.D.; Antle, V.; Kfoury, M.; Fourmentin, S. Huge Solubility Increase of Poorly Water-Soluble Pharmaceuticals by Sulfobutylether-β-Cyclodextrin Complexation in a Low-Melting Mixture. Environ. Chem. Lett. 2022, 20, 1561–1568. [Google Scholar] [CrossRef]
- Thomas, A.; Moinuddin, K.; Tretsiakova-McNally, S.; Joseph, P. A Kinetic Analysis of the Thermal Degradation Behaviours of Some Bio-Based Substrates. Polymers 2020, 12, 1830. [Google Scholar] [CrossRef] [PubMed]
- Danil de Namor, A.F.; Traboulssi, R.; Lewis, D.F.V. Host Properties of Cyclodextrins towards Anion Constituents of Antigenic Determinants. A Thermodynamic Study in Water and in N,N-Dimethylformamide. J. Am. Chem. Soc. 1990, 112, 8442–8447. [Google Scholar] [CrossRef]
- Venkatesh, M.; Ravi, P.; Tewari, S.P. Isoconversional Kinetic Analysis of Decomposition of Nitroimidazoles: Friedman Method vs Flynn–Wall–Ozawa Method. J. Phys. Chem. A 2013, 117, 10162–10169. [Google Scholar] [CrossRef] [PubMed]
- Briggner, L.-E.; Wadsö, I. Heat Capacities of Maltose, Maltotriose, Maltotetrose and α-, β-, and γ-Cyclodextrin in the Solid State and in Dilute Aqueous Solution. J. Chem. Thermodyn. 1990, 22, 1067–1074. [Google Scholar] [CrossRef]
- Friedman, H.L. Kinetics of Thermal Degradation of Char-Forming Plastics from Thermogravimetry. Application to a Phenolic Plastic. J. Polym. Sci. Part C Polym. Symp. 1964, 6, 183–195. [Google Scholar] [CrossRef]
- Flynn, J.H.; Wall, L.A. General Treatment of the Thermogravimetry of Polymers. J. Res. Natl. Bur. Stand. Sect. A Phys. Chem. 1966, 70A, 487–523. [Google Scholar] [CrossRef]
- Ozawa, T. Estimation of Activation Energy by Isoconversion Methods. Thermochim. Acta 1992, 203, 159–165. [Google Scholar] [CrossRef]
- Gatiatulin, A.K.; Osel’skaya, V.Y.; Ziganshin, M.A.; Gorbatchuk, V.V. Smart Control of Guest Inclusion by α-Cyclodextrin Using Its Hydration History. RSC Adv. 2019, 9, 37778–37787. [Google Scholar] [CrossRef]
- Buzyurov, A.V.; Nagrimanov, R.N.; Zaitsau, D.H.; Mukhametzyanov, T.A.; Abdelaziz, A.; Solomonov, B.N.; Schick, C. Application of the Flash DSC 1 and 2+ for Vapor Pressure Determination above Solids and Liquids. Thermochim. Acta 2021, 706, 179067. [Google Scholar] [CrossRef]
- Gatiatulin, A.K.; Osel’skaya, V.Y.; Ziganshin, M.A.; Gorbatchuk, V.V. Size Exclusion Effect in Binary Inclusion Compounds of α-Cyclodextrin. Phys. Chem. Chem. Phys. 2018, 20, 26105–26116. [Google Scholar] [CrossRef]
- Gorbatchuk, V.V.; Gatiatulin, A.K.; Ziganshin, M.A.; Gubaidullin, A.T.; Yakimova, L.S. Unusually High Efficiency of β-Cyclodextrin Clathrate Preparation by Water-Free Solid-Phase Guest Exchange. J. Phys. Chem. B 2013, 117, 14544–14556. [Google Scholar] [CrossRef]
- Li, H.; Zhang, G.; Wang, W.; Chen, C.; Jiao, L.; Wu, W. Preparation, Characterization, and Bioavailability of Host-Guest Inclusion Complex of Ginsenoside Re with Gamma-Cyclodextrin. Molecules 2021, 26, 7227. [Google Scholar] [CrossRef]


Publisher’s Note: MDPI stays neutral with regard to jurisdictional claims in published maps and institutional affiliations. |
© 2022 by the authors. Licensee MDPI, Basel, Switzerland. This article is an open access article distributed under the terms and conditions of the Creative Commons Attribution (CC BY) license (https://creativecommons.org/licenses/by/4.0/).