
High Glycemia and Soluble Epoxide Hydrolase in Females: Differential Multiomics in Murine Brain Microvasculature
 ,
,  , ,
, ,
Abstract
:1. Introduction
2. Results
2.1. Effect of the High Glycemic Diet on the Hippocampal Microvascular Genome
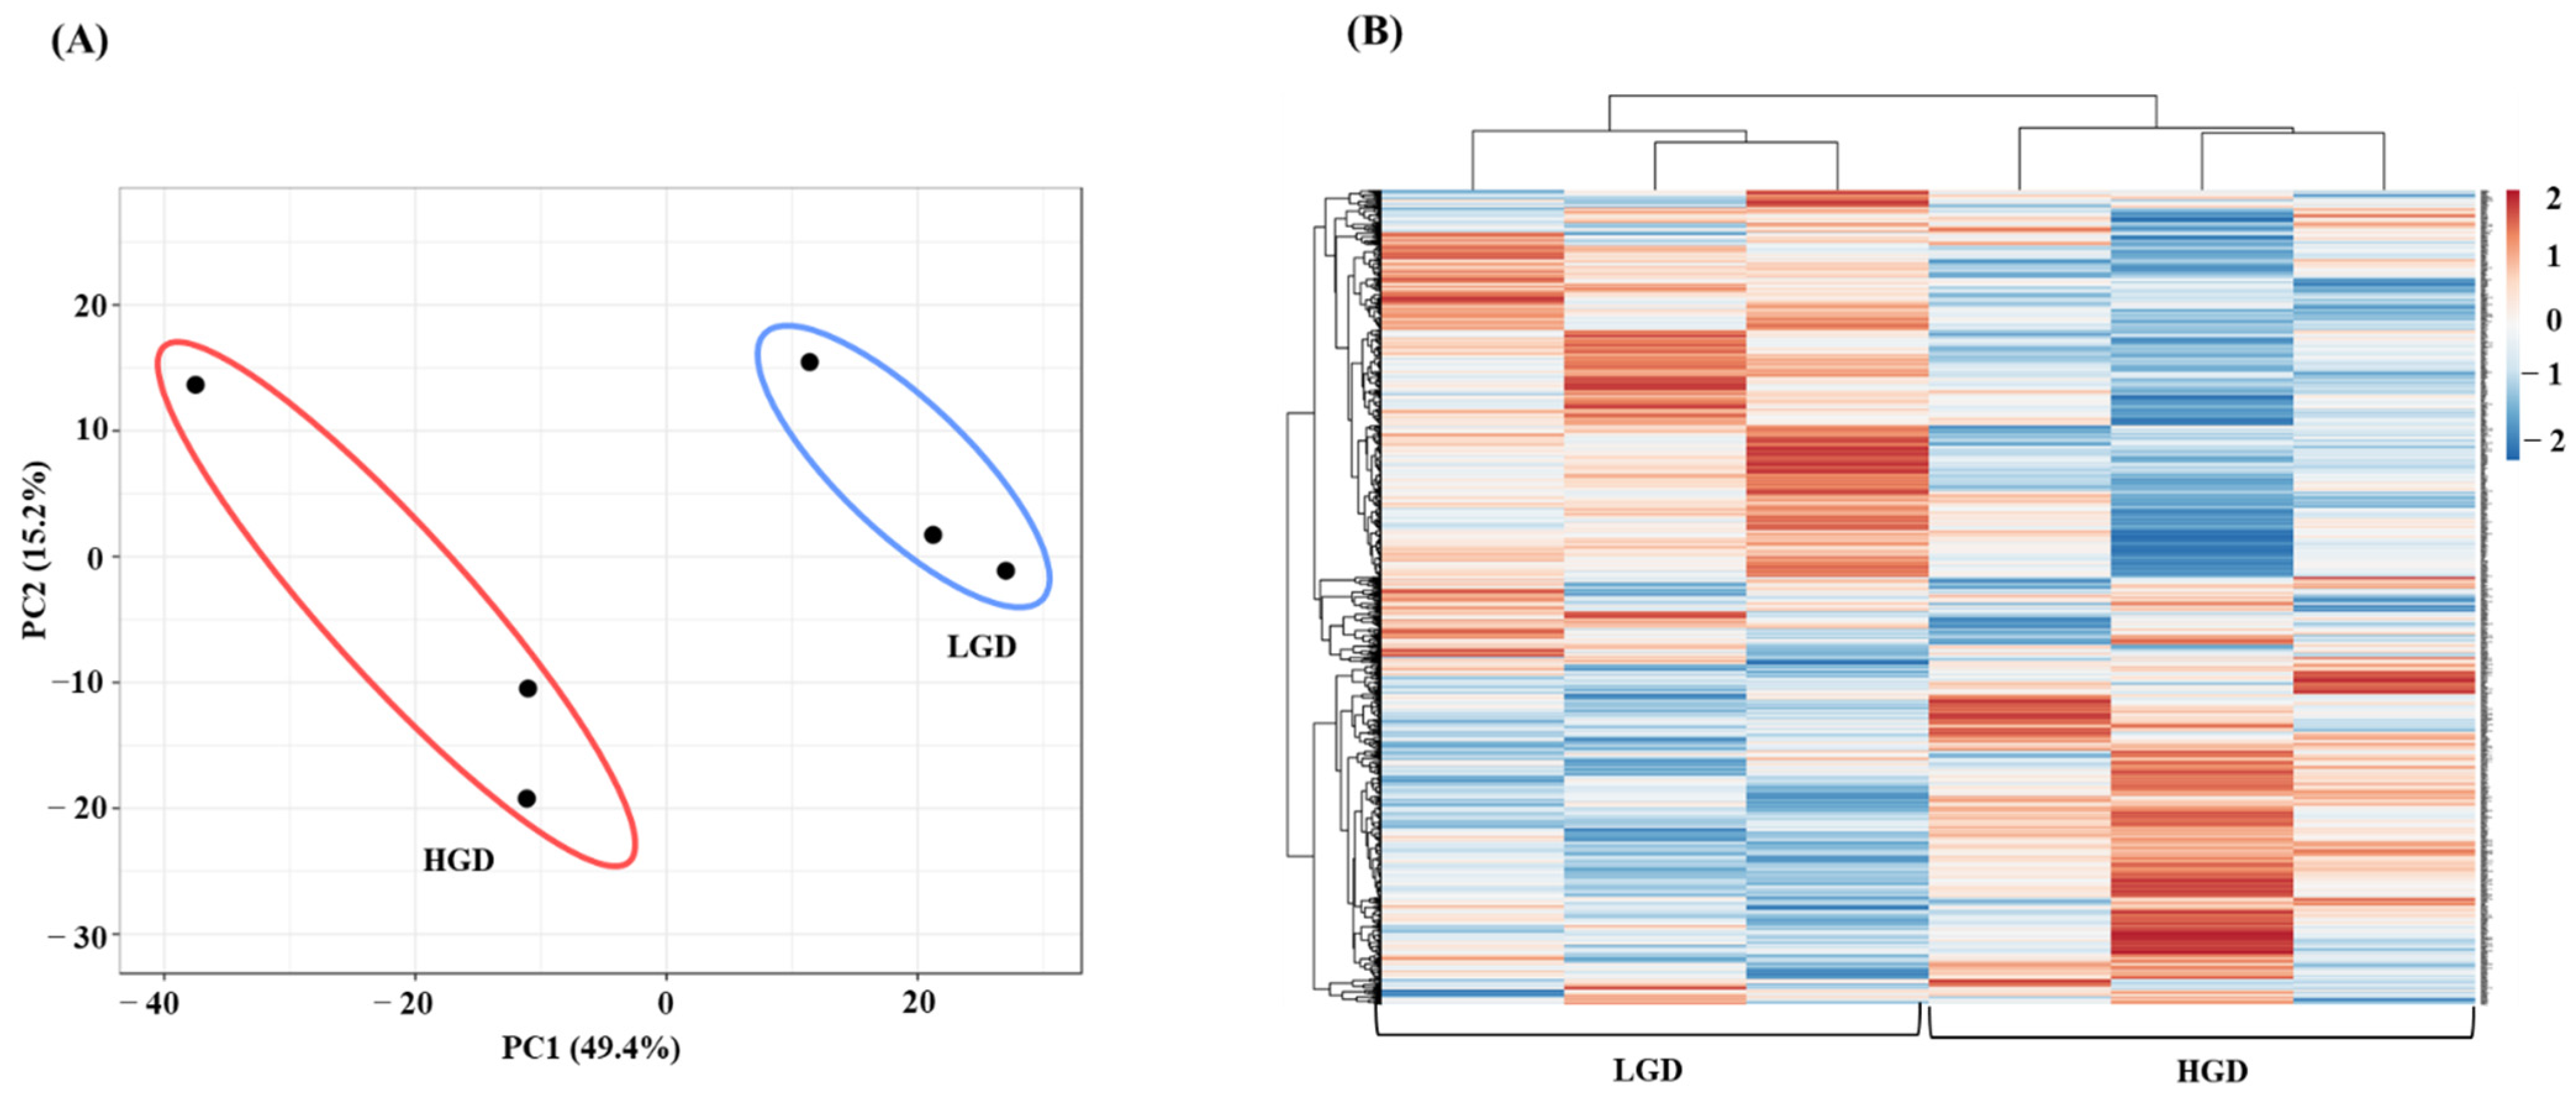
2.1.1. Global Gene Expression and Hierarchical Clustering
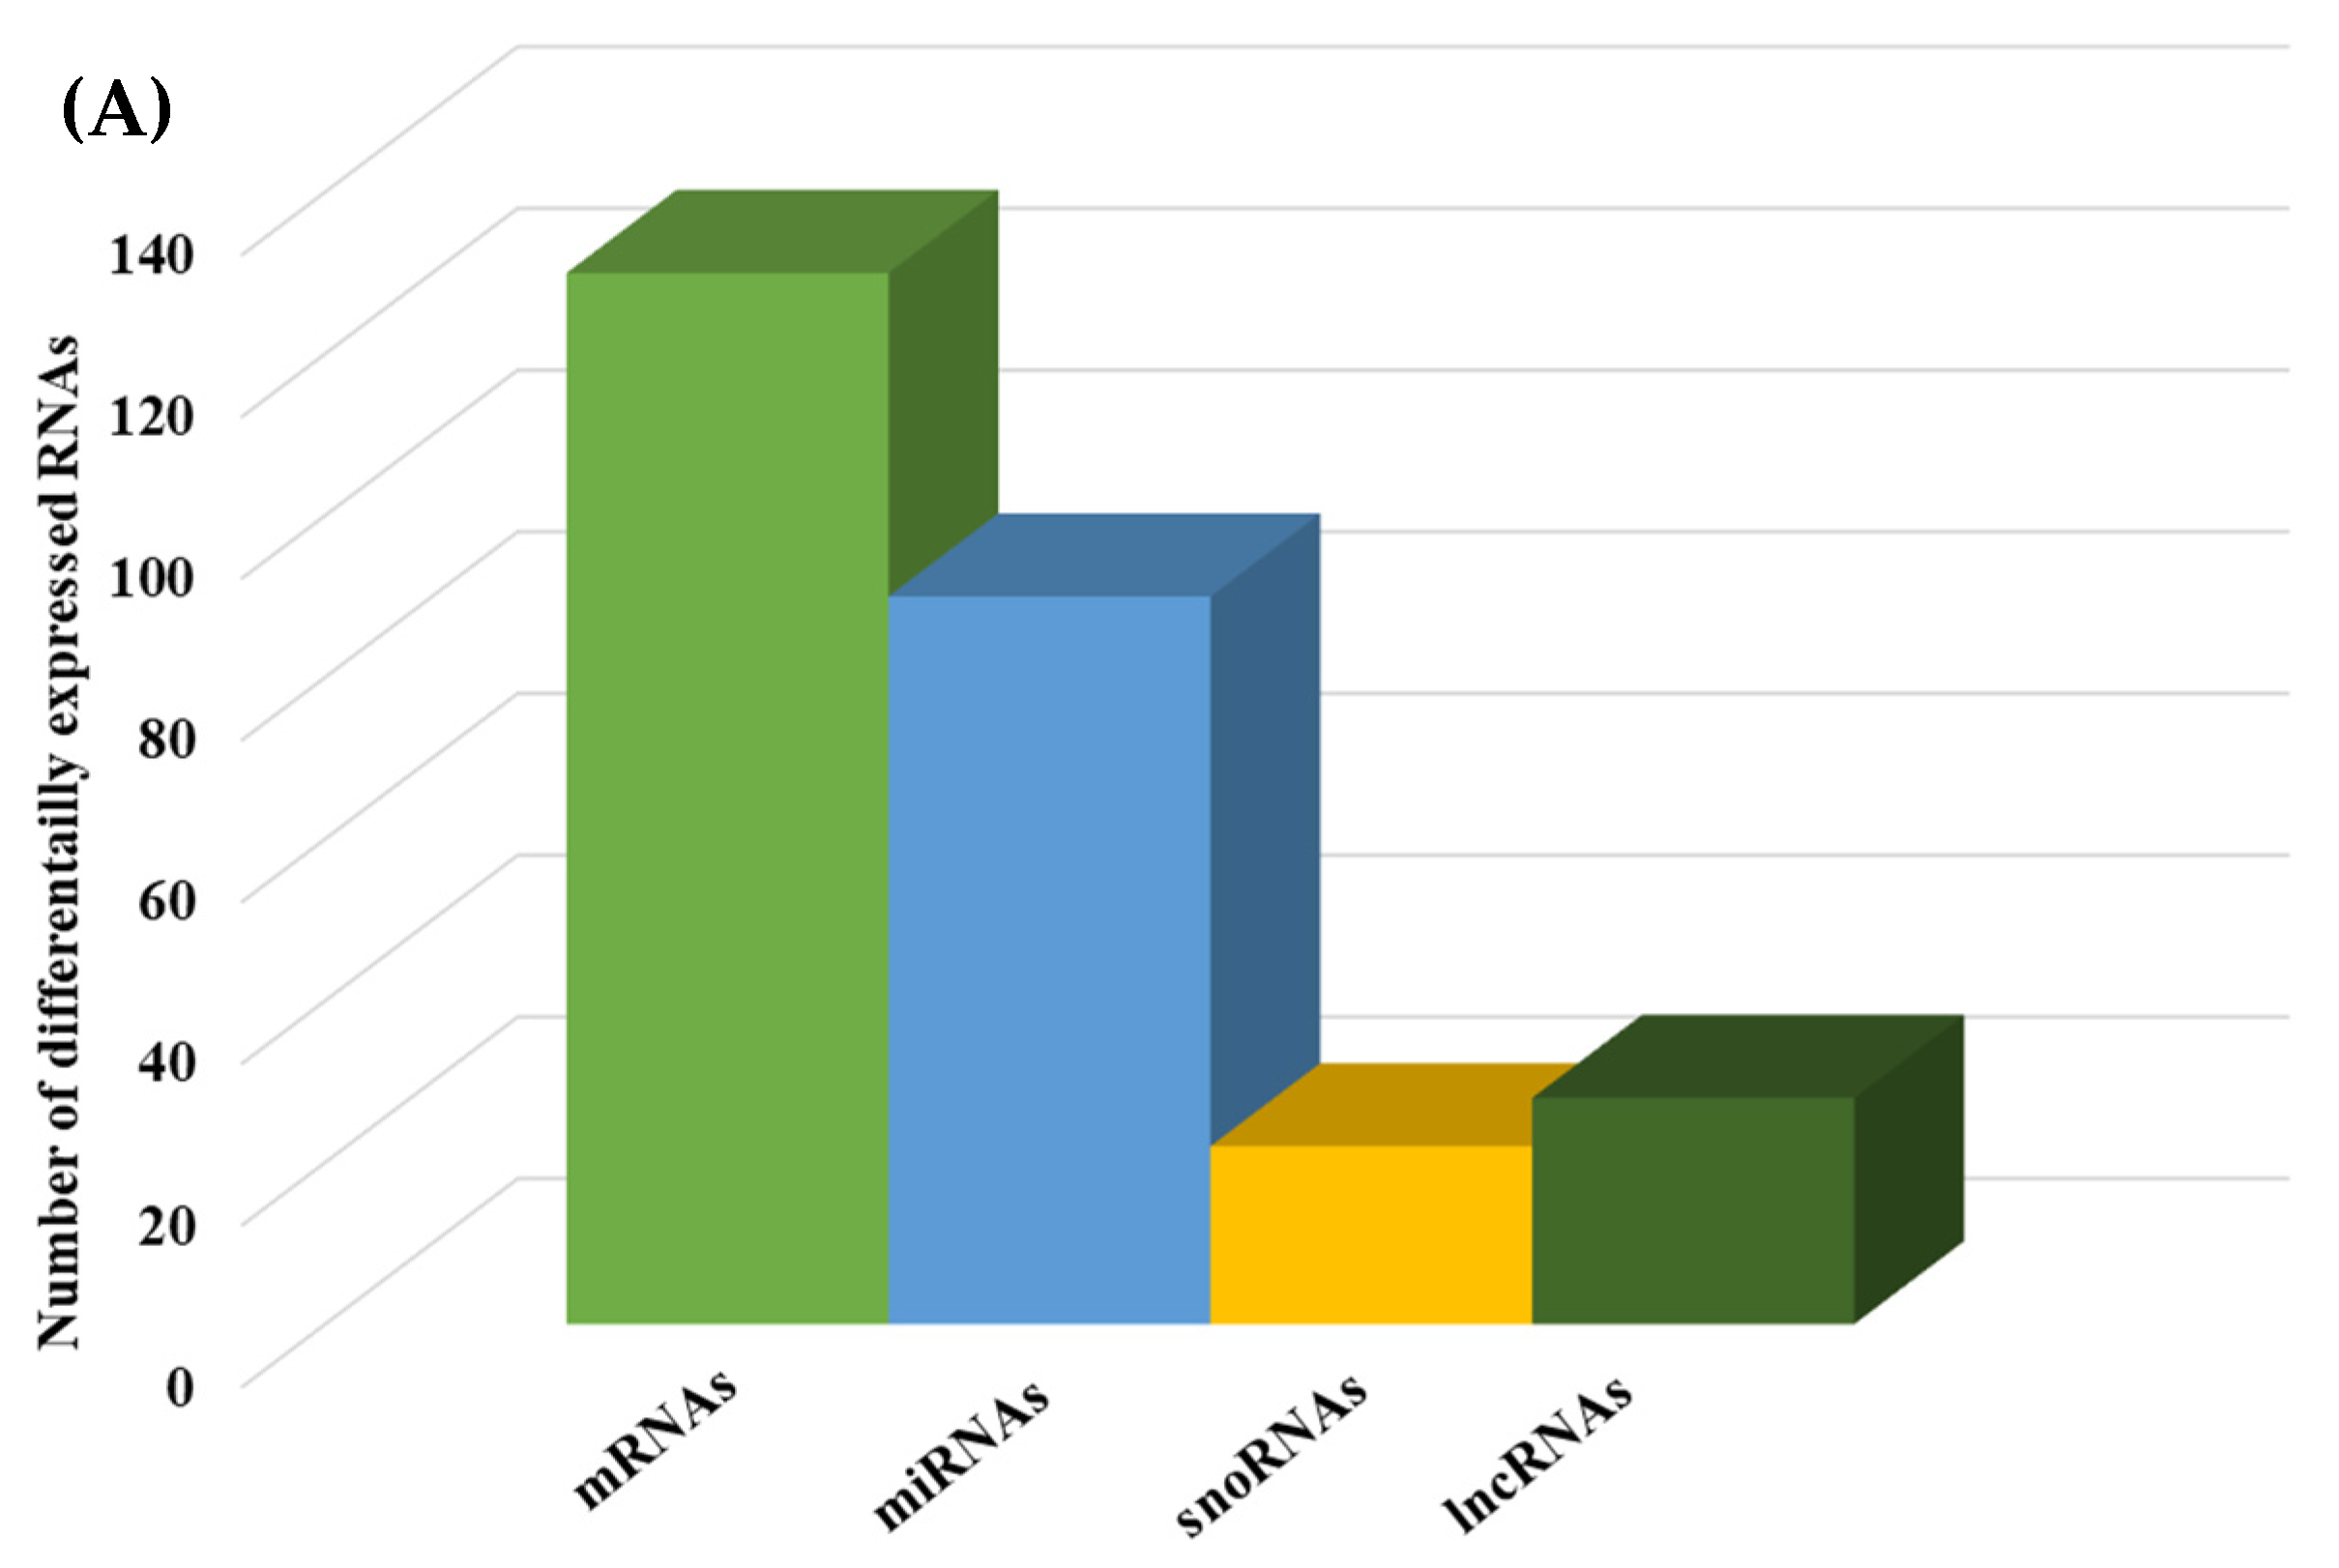
2.1.2. Differential Gene Expression
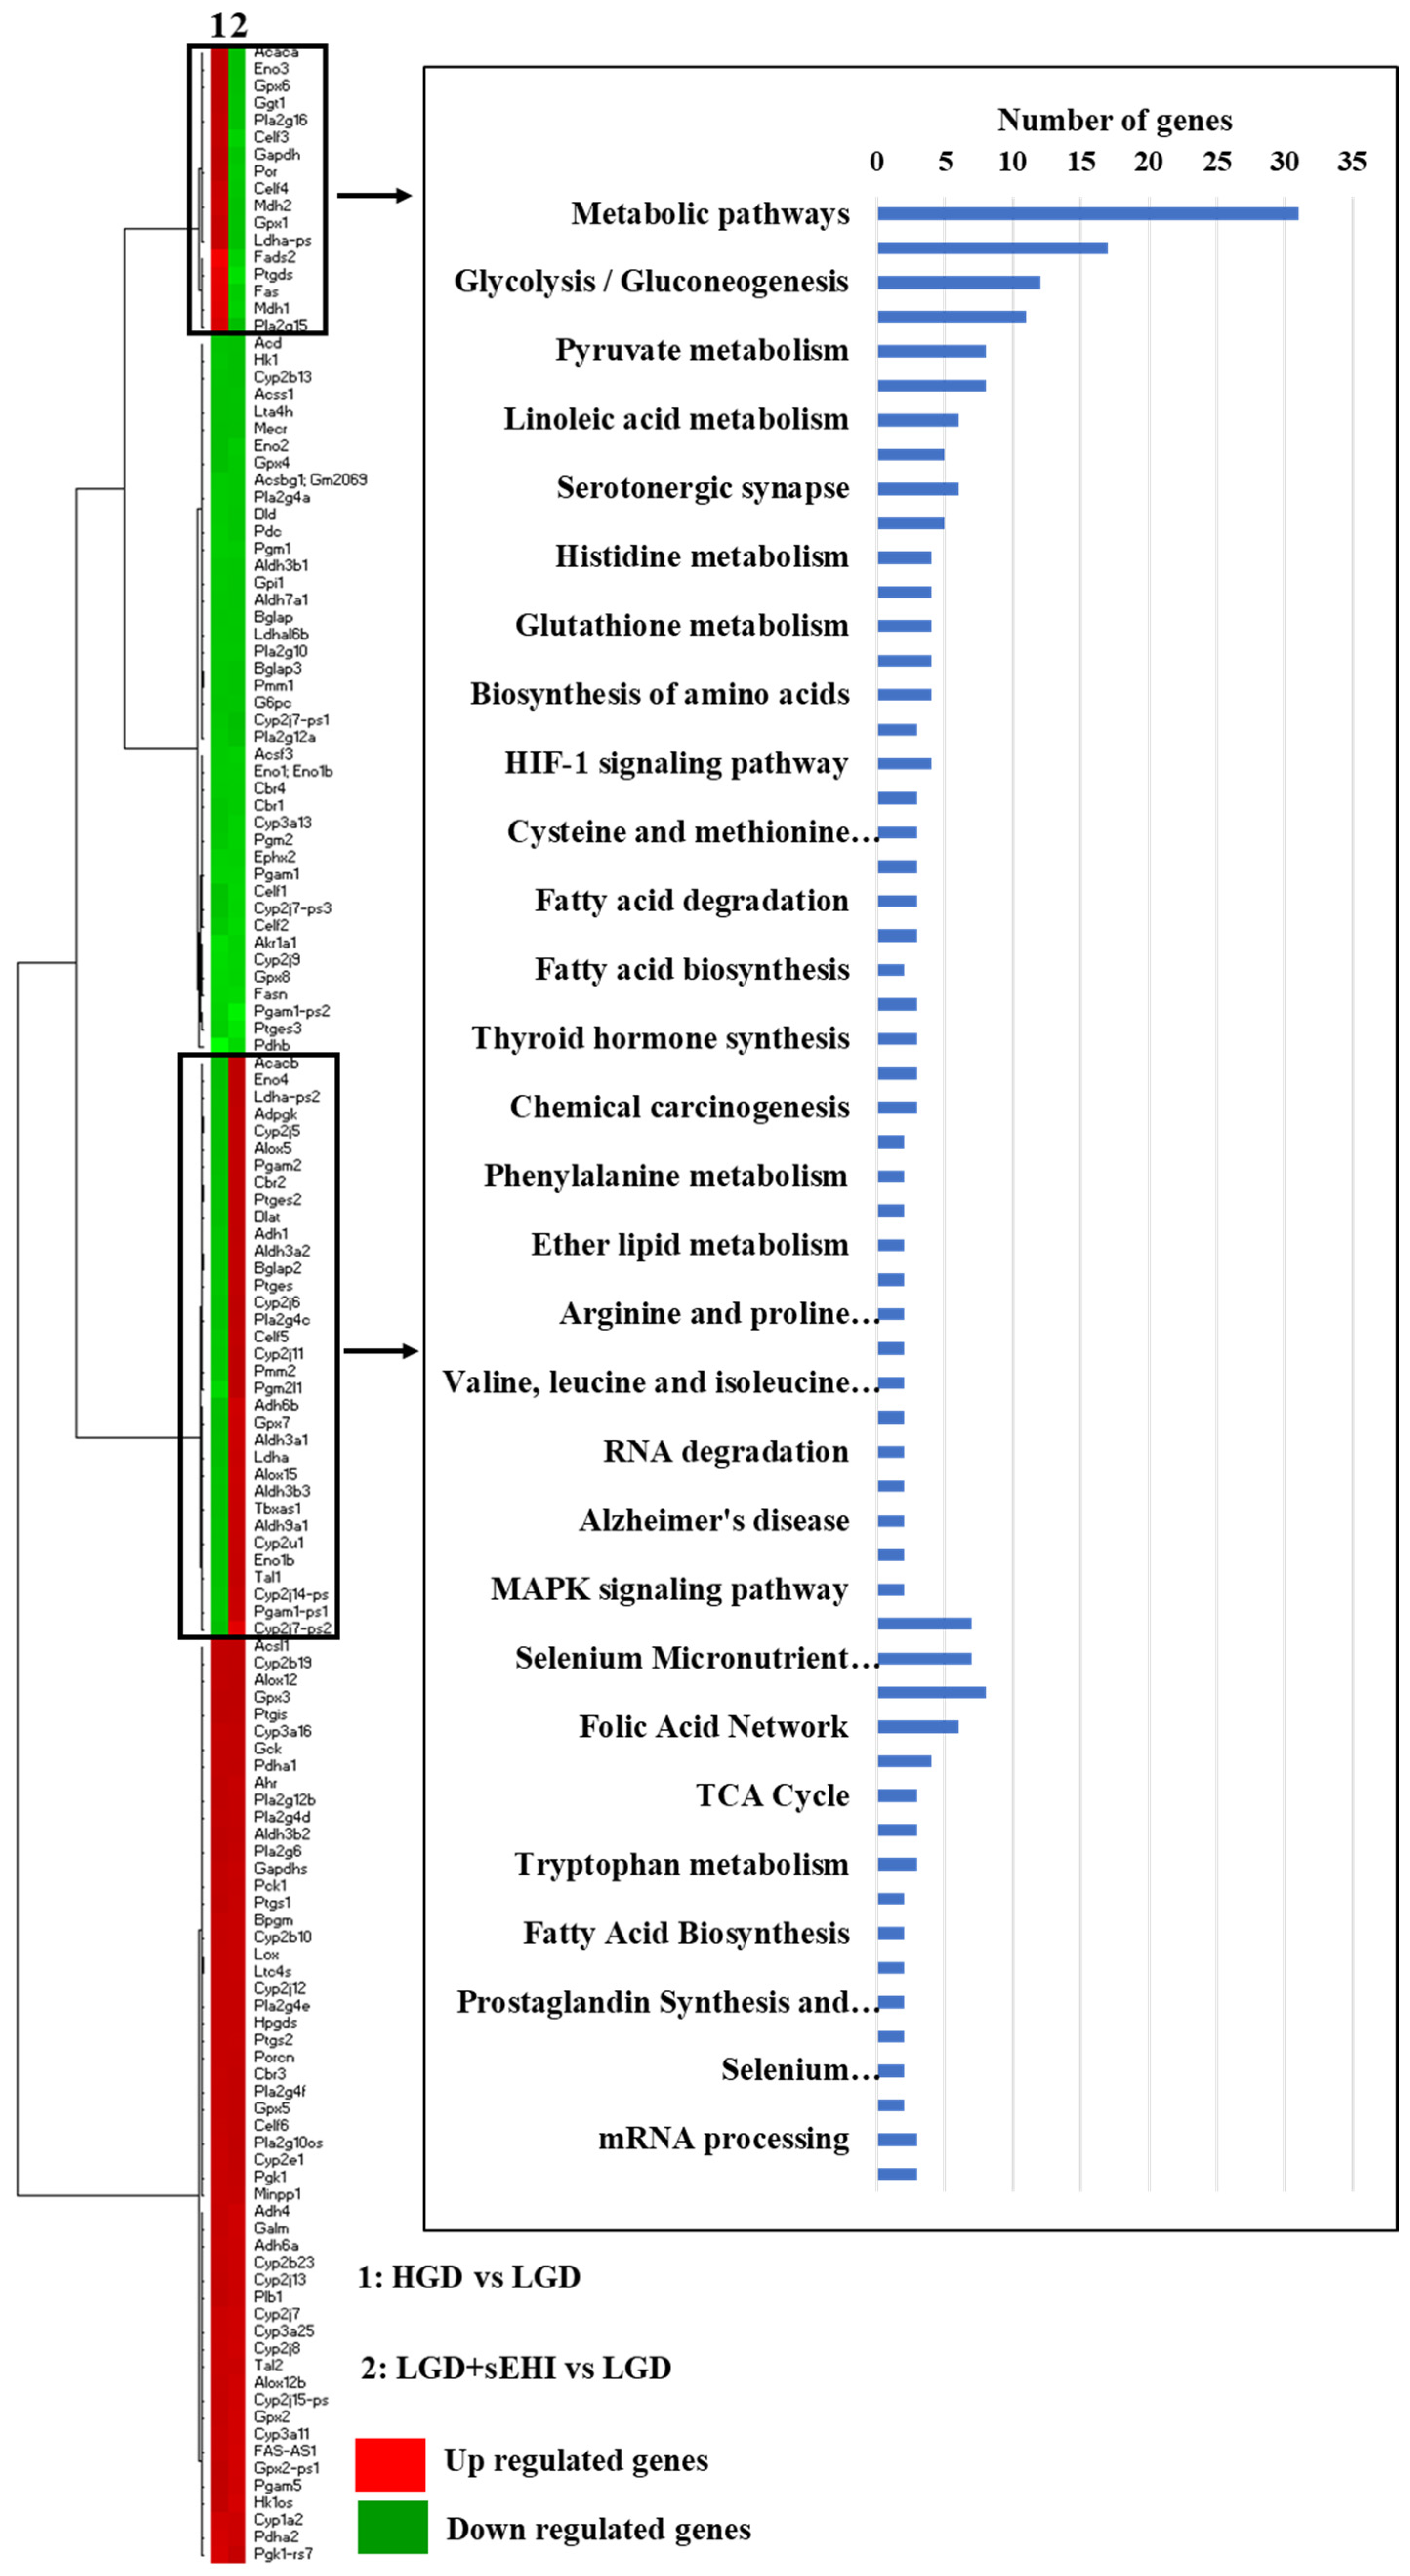
2.1.3. Pathways and Networks for Coding and Non-Coding Differentially Expressed Genes
2.1.4. Integrated Analysis of Differentially Expressed Genes and Key Pathways
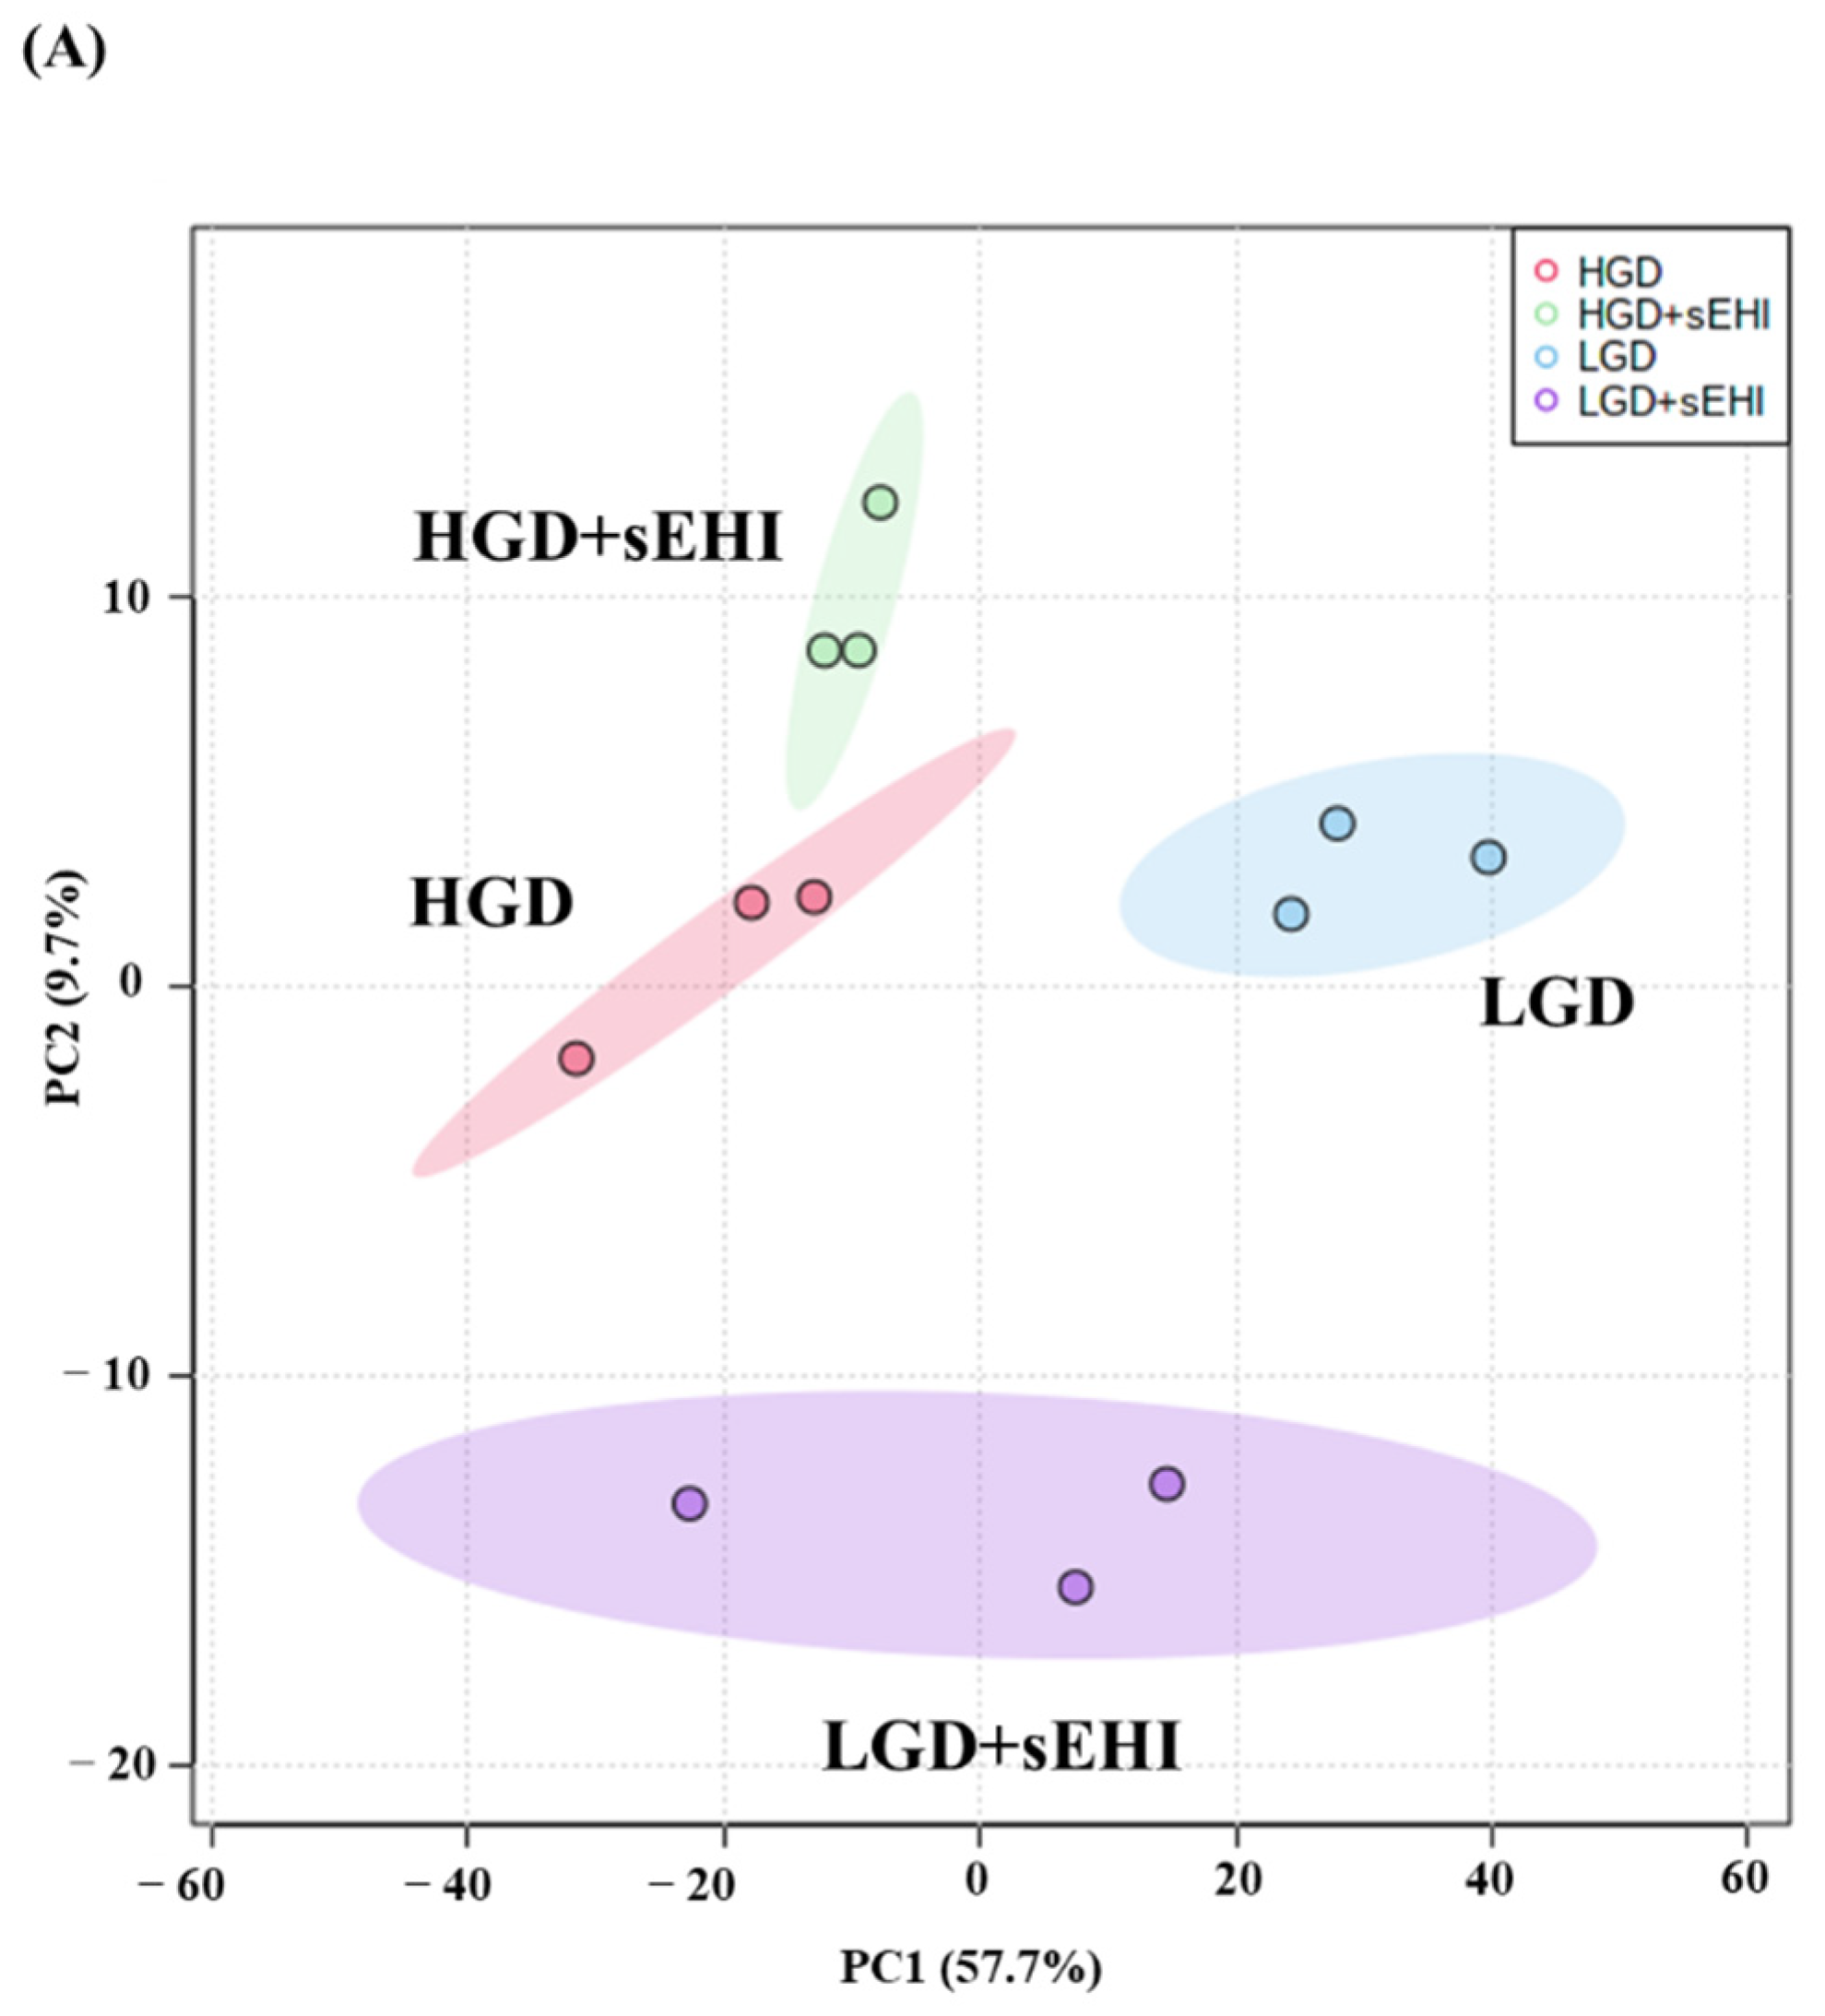
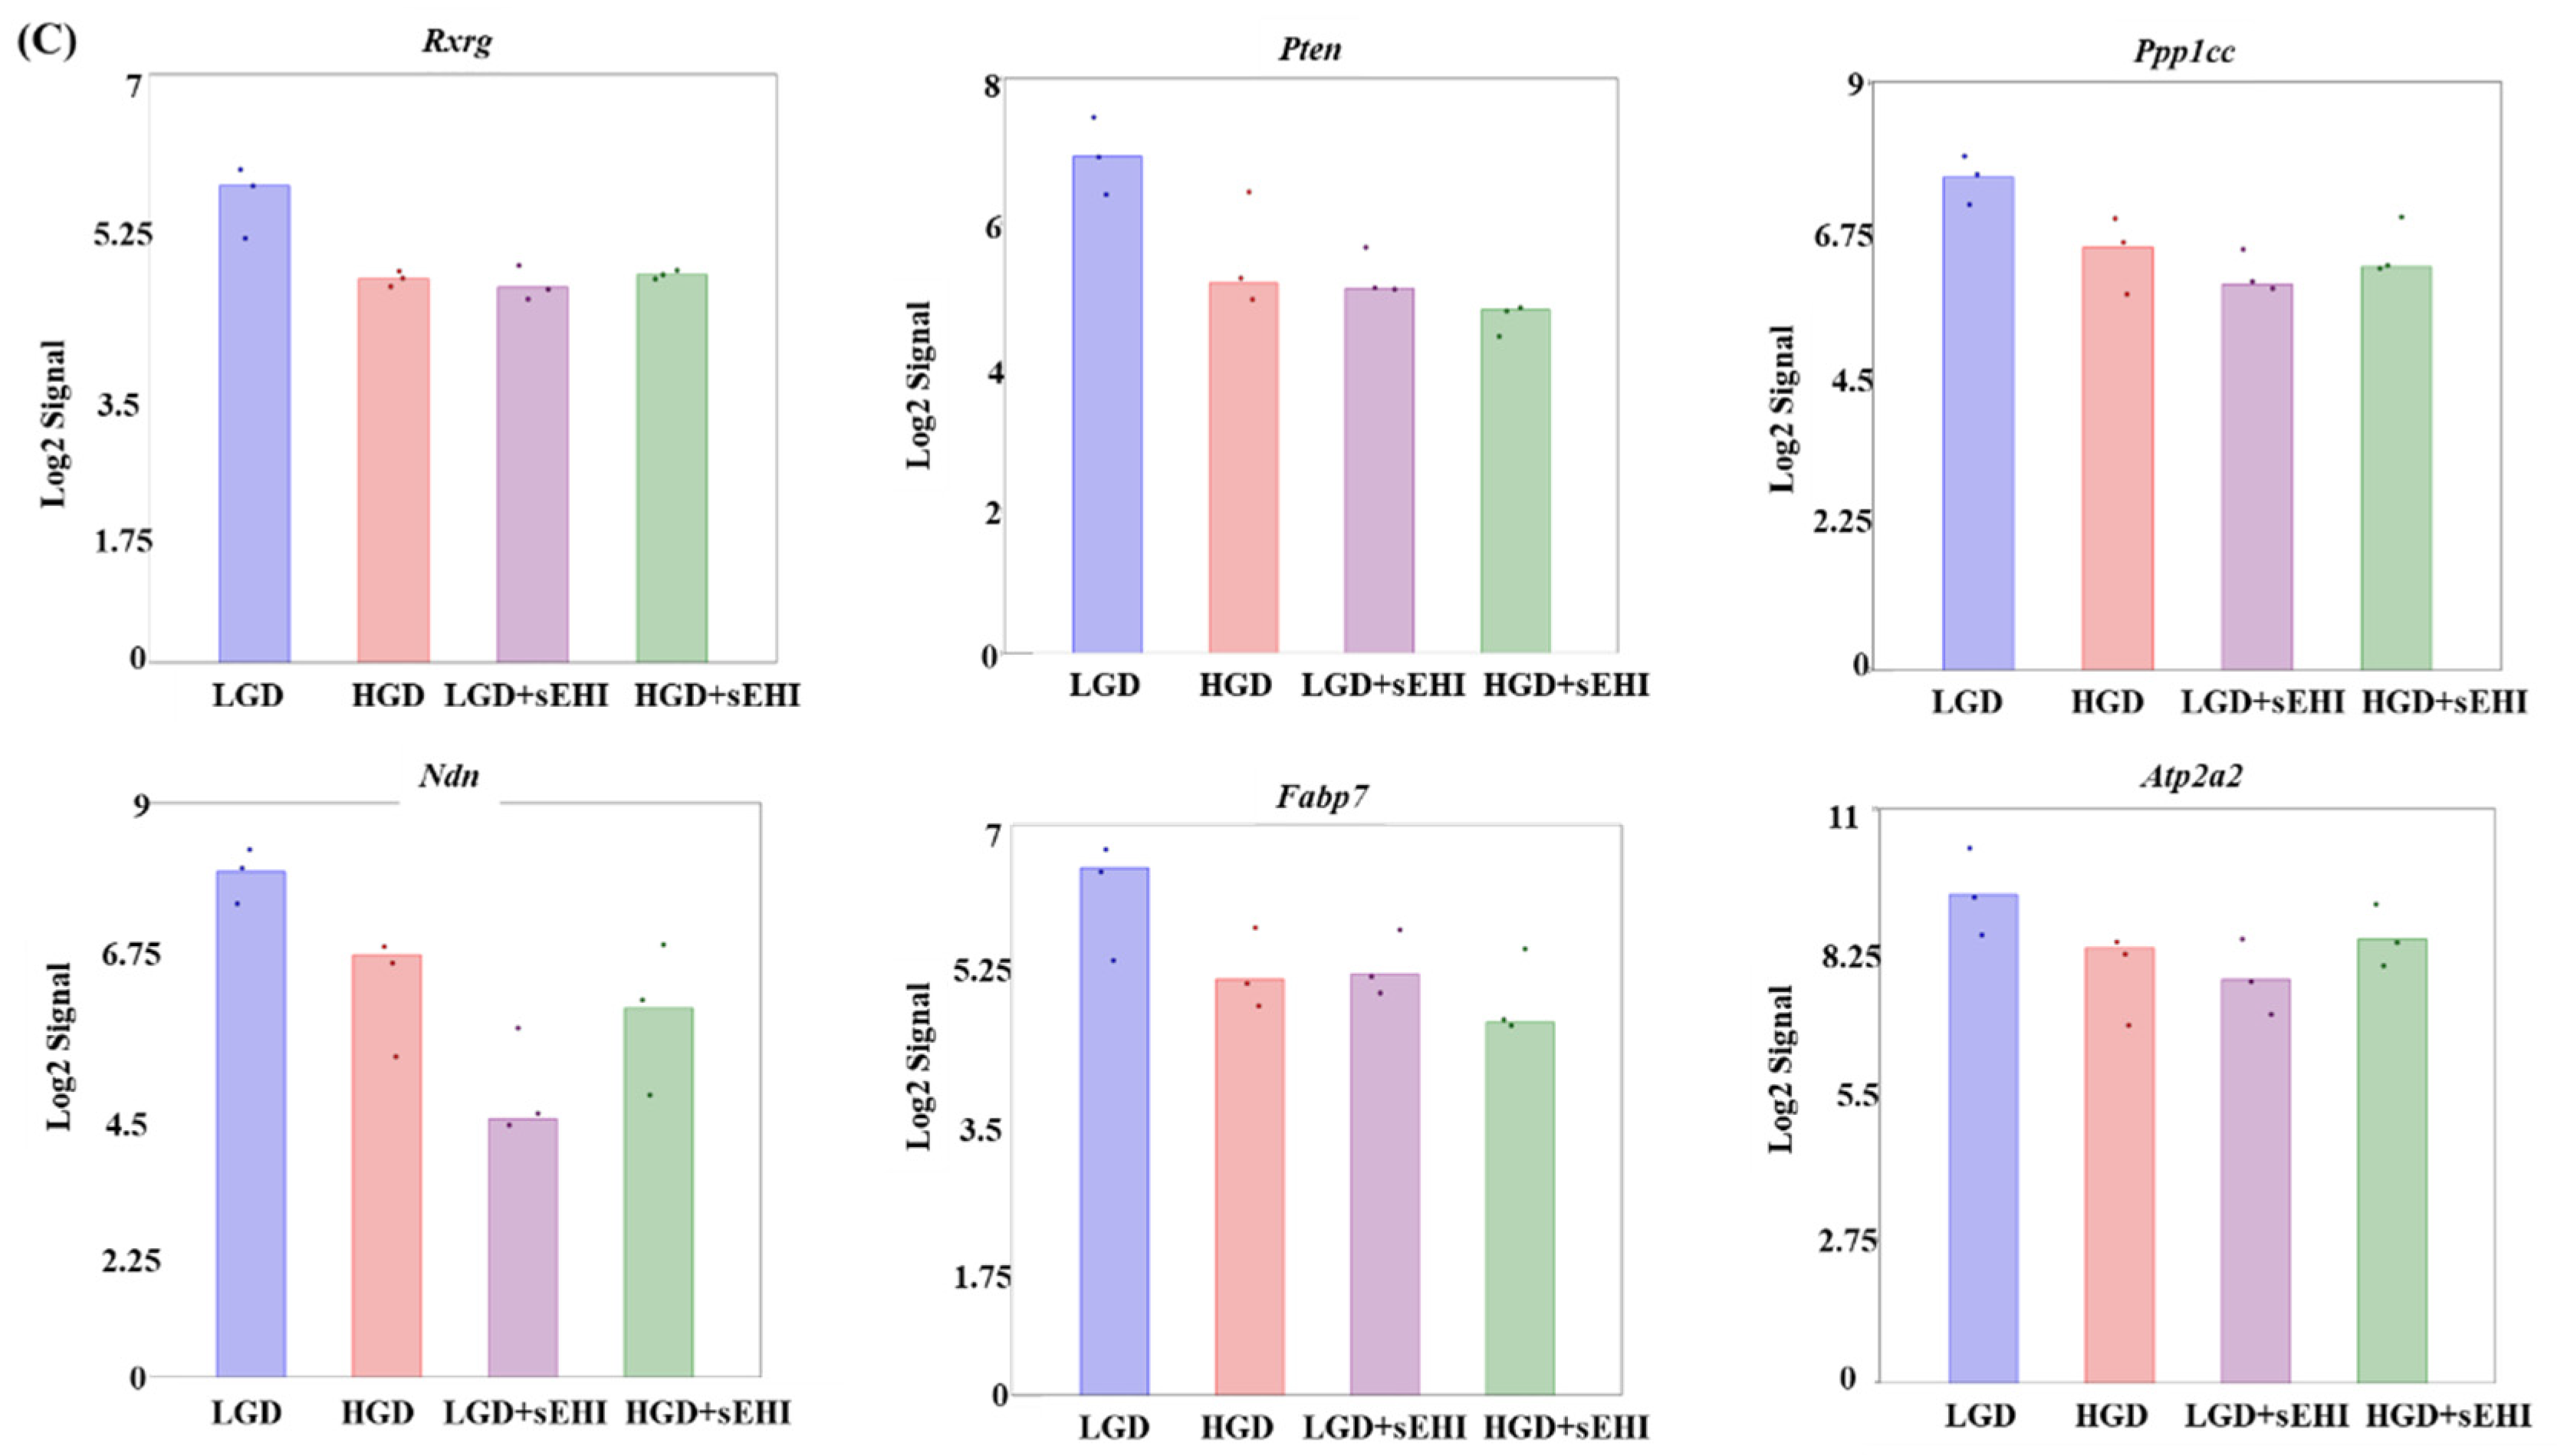
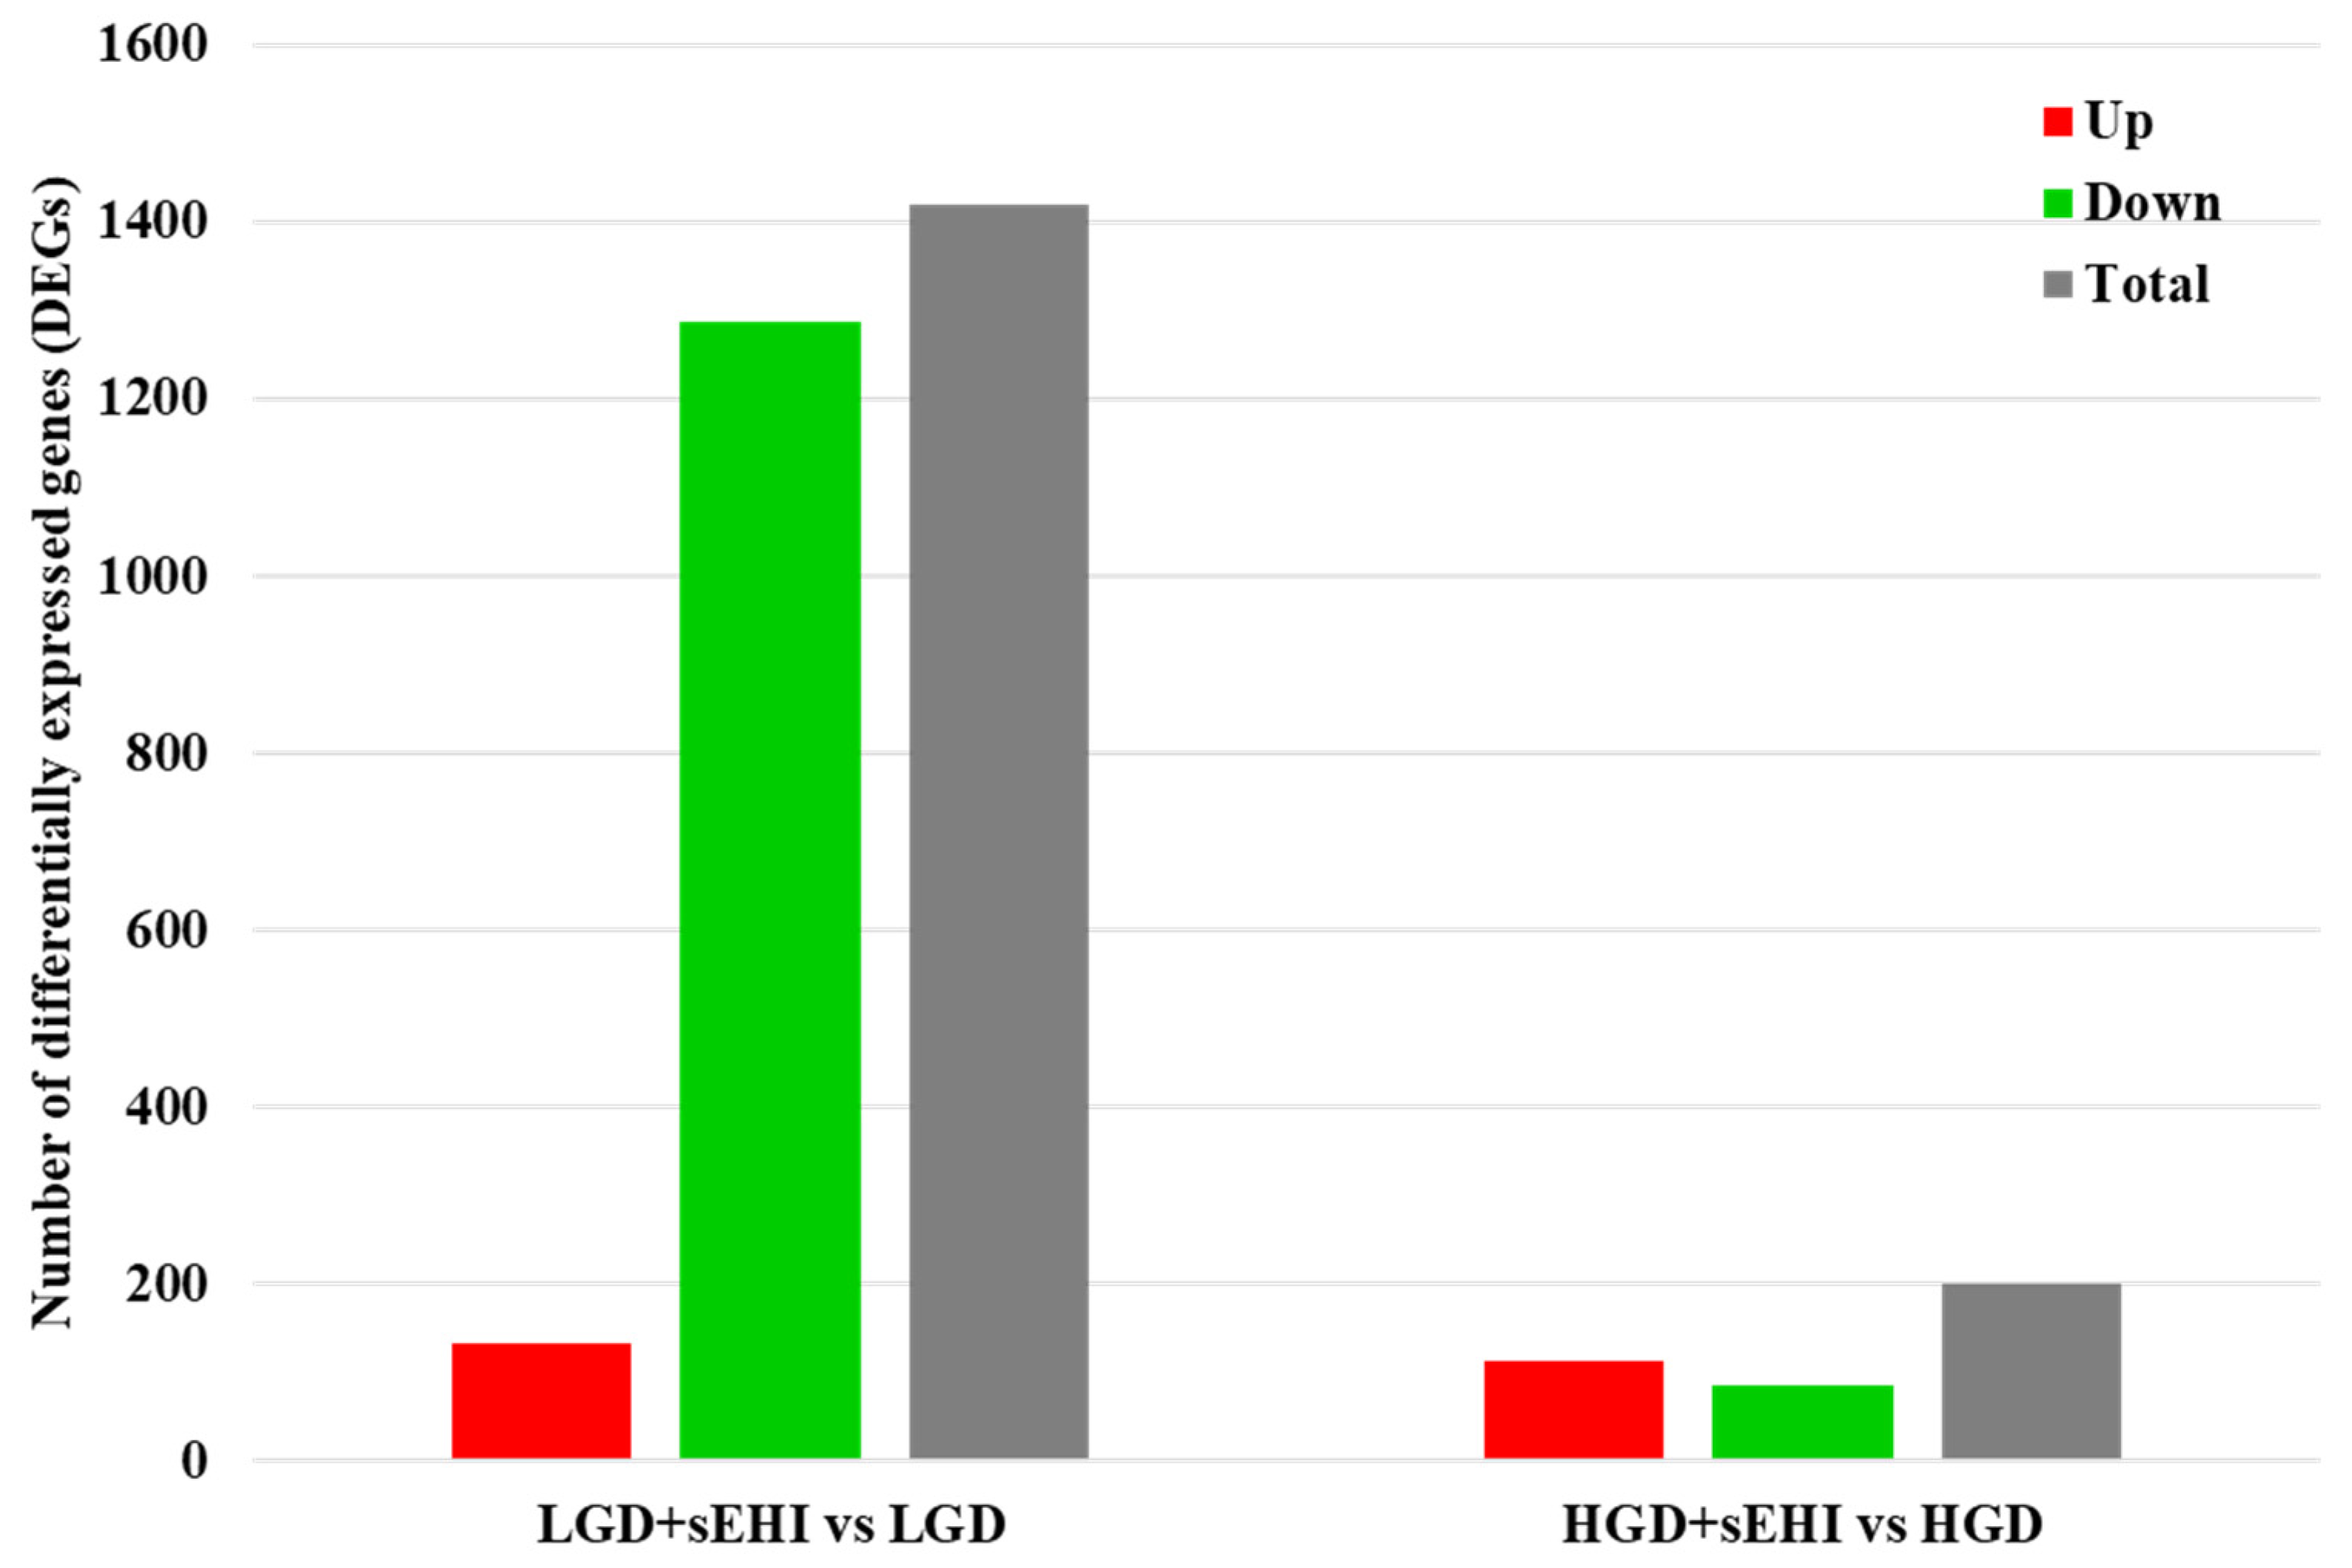
2.2. Effect of the on the Hippocampal Microvascular Genome of Mice Fed the Low and High Glycemic Diets
2.3. Brain Epoxyeicosatrienoic Acids to Dihydroxyeicosatrienoic Acids Ratio
2.4. Cognitive Function
2.5. Clinical Association of Genomic Data
3. Discussion
3.1. Effects of the HGD on Female Brain Microvascular Endothelium
3.2. Effects of sEHI on the LGD
3.3. Effects of the sEHI on the HGD
4. Materials and Methods
4.1. Experimental Animals, Diet, and Treatment
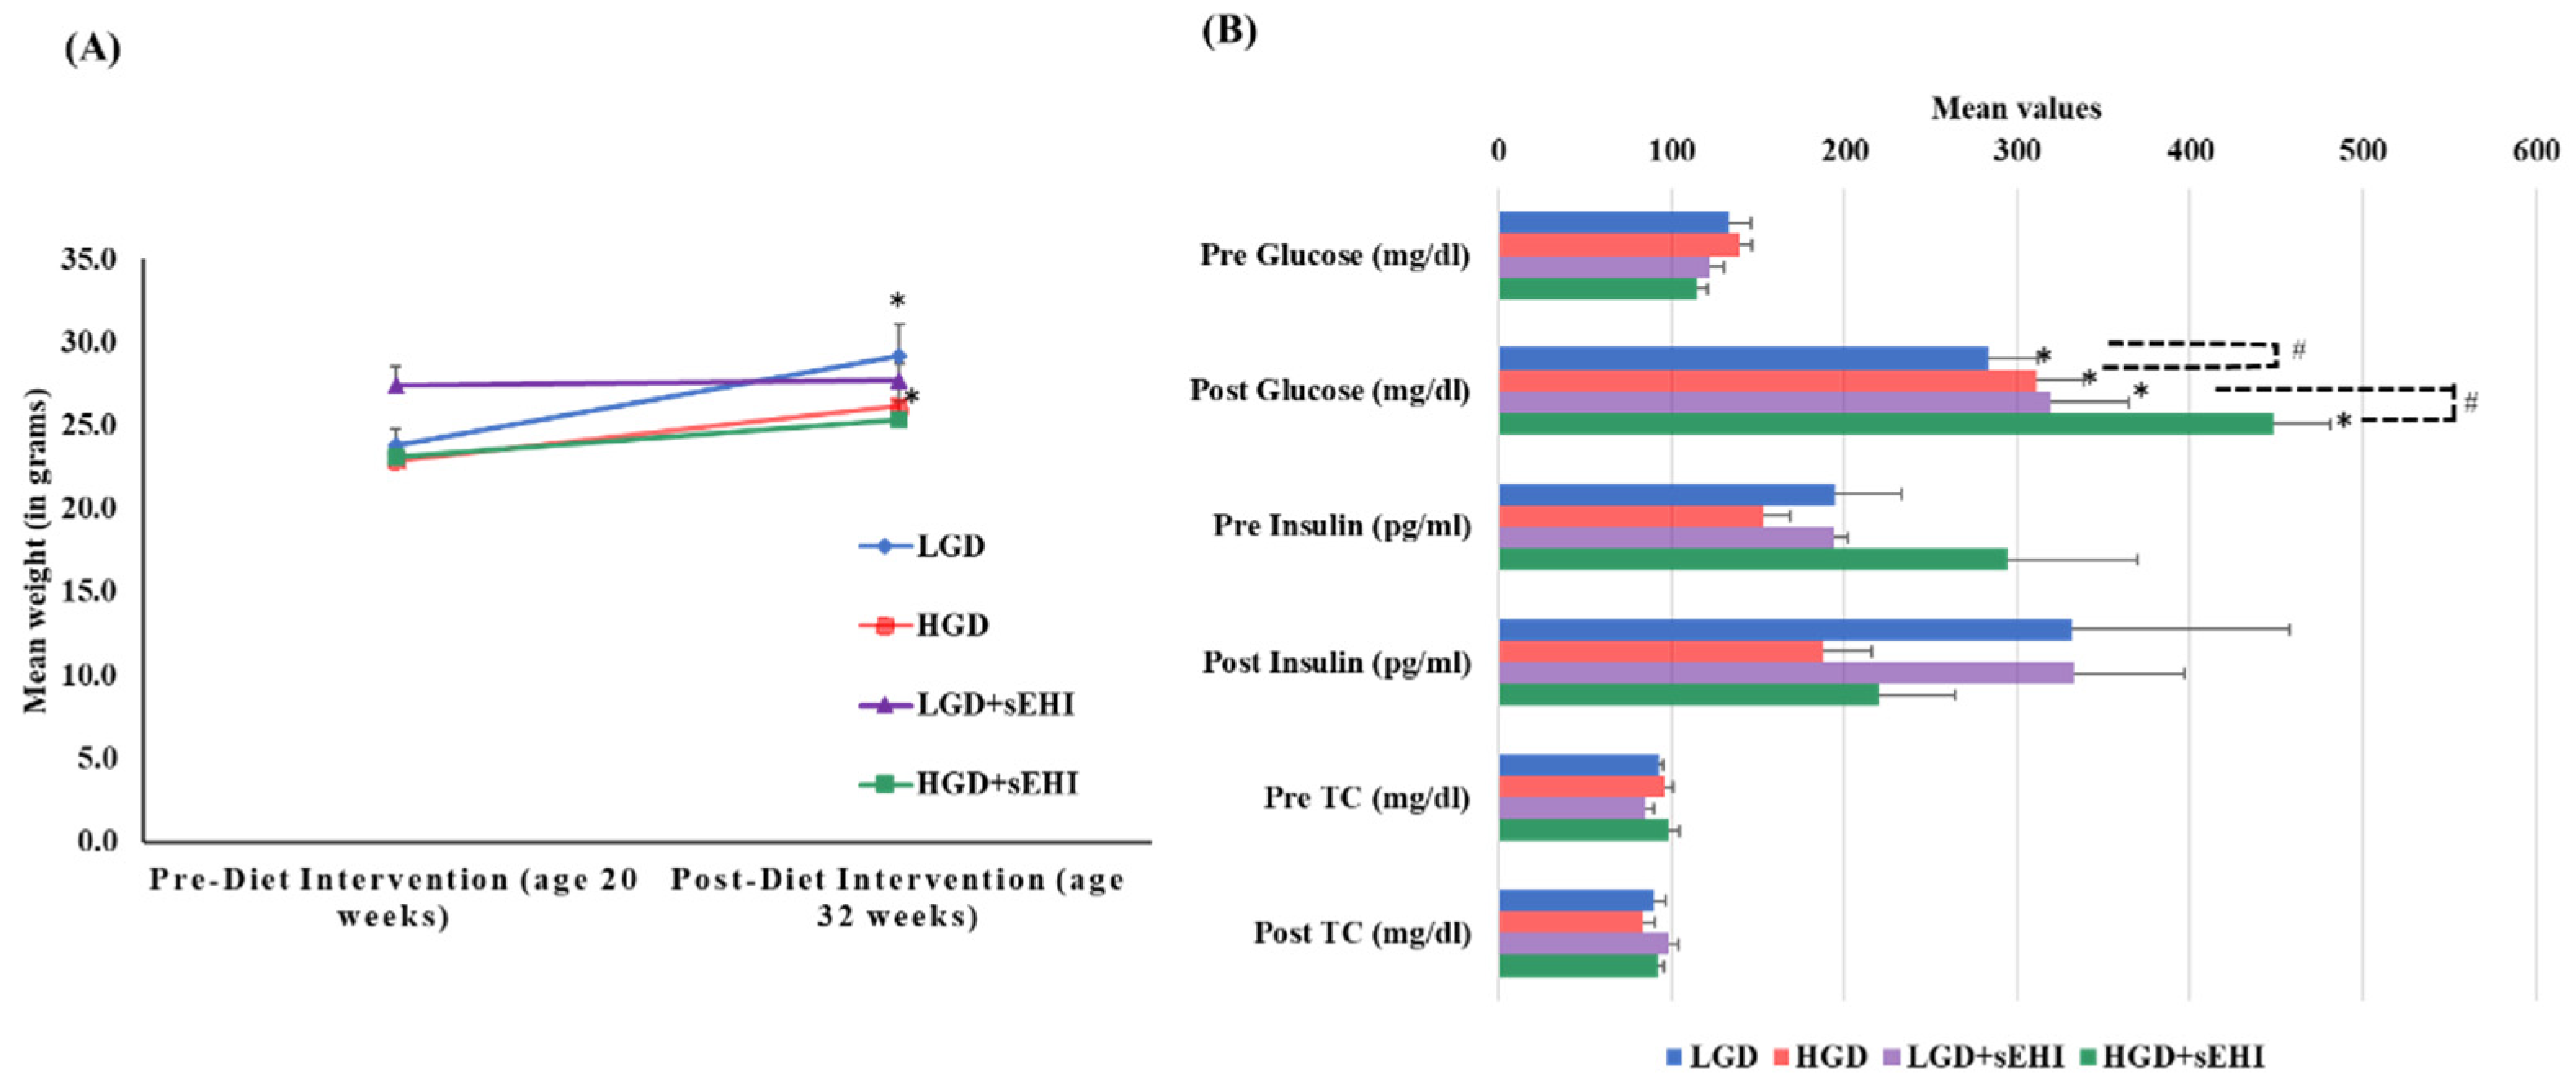
4.2. Serum Lipid, Glucose, and Insulin Assays
4.3. Vaginal Lavage and Assessment of Estrus Cycle
4.4. Isolation and Cryosection of Murine Brain Hippocampus
4.5. Laser Capture Microdissection (LCM) of Hippocampal Microvessels
4.6. RNA Extraction from Laser Captured Brain Microvessels
4.7. Microarray Hybridization and Transcriptome Analysis
4.8. Bioinformatic Analysis
4.9. Determination of EETs/DHETs Ratio within Brain Free Oxylipins
4.10. Assessment of Cognitive Function
4.11. Statistical Analysis
5. Conclusions
Supplementary Materials
Author Contributions
Funding
Institutional Review Board Statement
Data Availability Statement
Acknowledgments
Conflicts of Interest
References
- Badimon, L.; Chagas, P.; Chiva-Blanch, G. Diet and Cardiovascular Disease: Effects of Foods and Nutrients in Classical and Emerging Cardiovascular Risk Factors. Curr. Med. Chem. 2019, 26, 3639–3651. [Google Scholar] [CrossRef]
- Han, F. Cerebral microvascular dysfunction and neurodegeneration in dementia. Stroke Vasc. Neurol. 2019, 4, 105–107. [Google Scholar] [CrossRef] [PubMed] [Green Version]
- Fillit, H.; Nash, D.T.; Rundek, T.; Zuckerman, A. Cardiovascular risk factors and dementia. Am. J. Geriatr. Pharmacother. 2008, 6, 100–118. [Google Scholar] [CrossRef] [PubMed]
- Leigh, S.J.; Morris, M.J. Diet, inflammation and the gut microbiome: Mechanisms for obesity-associated cognitive impairment. Biochim. Biophys. Acta Mol. Basis Dis. 2020, 1866, 165767. [Google Scholar] [CrossRef] [PubMed]
- Mensah, G.A.; Ryan, U.S.; Hooper, W.C.; Engelgau, M.M.; Callow, A.D.; Kapuku, G.K.; Mantovani, A. Vascular endothelium summary statement II: Cardiovascular disease prevention and control. Vasc. Pharmacol. 2007, 46, 318–320. [Google Scholar] [CrossRef]
- Huynh, D.T.N.; Heo, K.S. Therapeutic targets for endothelial dysfunction in vascular diseases. Arch. Pharm. Res. 2019, 42, 848–861. [Google Scholar] [CrossRef]
- Nagy, J.A.; Benjamin, L.; Zeng, H.; Dvorak, A.M.; Dvorak, H.F. Vascular permeability, vascular hyperpermeability and angiogenesis. Angiogenesis 2008, 11, 109–119. [Google Scholar] [CrossRef] [Green Version]
- Krieglstein, C.F.; Granger, D.N. Adhesion molecules and their role in vascular disease. Am. J. Hypertens. 2001, 14, 44s–54s. [Google Scholar] [CrossRef] [Green Version]
- Wadley, A.J.; Veldhuijzen van Zanten, J.J.; Aldred, S. The interactions of oxidative stress and inflammation with vascular dysfunction in ageing: The vascular health triad. Age 2013, 35, 705–718. [Google Scholar] [CrossRef]
- Wang, Q.; Zhang, M.; Ding, Y.; Wang, Q.; Zhang, W.; Song, P.; Zou, M.H. Activation of NAD(P)H oxidase by tryptophan-derived 3-hydroxykynurenine accelerates endothelial apoptosis and dysfunction in vivo. Circ. Res. 2014, 114, 480–492. [Google Scholar] [CrossRef]
- Su, J.; An, X.R.; Li, Q.; Li, X.X.; Cong, X.D.; Xu, M. Improvement of vascular dysfunction by argirein through inhibiting endothelial cell apoptosis associated with ET-1/Nox4 signal pathway in diabetic rats. Sci. Rep. 2018, 8, 12620. [Google Scholar] [CrossRef] [PubMed]
- Breier, G.; Chavakis, T.; Hirsch, E. Angiogenesis in metabolic-vascular disease. Thromb. Haemost. 2017, 117, 1289–1295. [Google Scholar] [CrossRef] [PubMed] [Green Version]
- Nelson, A.R.; Sweeney, M.D.; Sagare, A.P.; Zlokovic, B.V. Neurovascular dysfunction and neurodegeneration in dementia and Alzheimer’s disease. Biochim. Biophys. Acta 2016, 1862, 887–900. [Google Scholar] [CrossRef]
- Sweeney, M.D.; Sagare, A.P.; Zlokovic, B.V. Blood-brain barrier breakdown in Alzheimer disease and other neurodegenerative disorders. Nat. Rev. Neurol. 2018, 14, 133–150. [Google Scholar] [CrossRef] [PubMed]
- Zenaro, E.; Piacentino, G.; Constantin, G. The blood-brain barrier in Alzheimer’s disease. Neurobiol. Dis. 2017, 107, 41–56. [Google Scholar] [CrossRef] [Green Version]
- Dugina, V.B.; Shagieva, G.S.; Shakhov, A.S.; Alieva, I.B. The Cytoplasmic Actins in the Regulation of Endothelial Cell Function. Int. J. Mol. Sci. 2021, 22, 7836. [Google Scholar] [CrossRef]
- Yuan, S.Y.; Rigor, R.R. Integrated Systems Physiology: From Molecule to Function to Disease. In Regulation of Endothelial Barrier Function; Morgan & Claypool Life Sciences: San Rafael, CA, USA, 2010. [Google Scholar] [CrossRef]
- Rutkowsky, J.M.; Lee, L.L.; Puchowicz, M.; Golub, M.S.; Befroy, D.E.; Wilson, D.W.; Anderson, S.; Cline, G.; Bini, J.; Borkowski, K.; et al. Reduced cognitive function, increased blood-brain-barrier transport and inflammatory responses, and altered brain metabolites in LDLr -/-and C57BL/6 mice fed a western diet. PLoS ONE 2018, 13, e0191909. [Google Scholar] [CrossRef] [Green Version]
- Zeng, Y.; Zhang, L.; Hu, Z. Cerebral insulin, insulin signaling pathway, and brain angiogenesis. Neurol. Sci. 2016, 37, 9–16. [Google Scholar] [CrossRef]
- Derreberry, T.M.; Holroyd, S. Dementia in Women. Med. Clin. North Am. 2019, 103, 713–721. [Google Scholar] [CrossRef]
- Wimo, A.; Guerchet, M.; Ali, G.C.; Wu, Y.T.; Prina, M. World Alzheimer Report 2015, The Global Impact of Dementia, An Analysis of Prevalence, Incidence, Cost and Trends; Alzheimers Disease International: London, UK, 2015. [Google Scholar]
- Appelman, Y.; van Rijn, B.B.; Ten Haaf, M.E.; Boersma, E.; Peters, S.A.E. Sex differences in cardiovascular risk factors and disease prevention. Atherosclerosis 2015, 241, 211–218. [Google Scholar] [CrossRef]
- Foret, J.T.; Dekhtyar, M.; Cole, J.H.; Gourley, D.D.; Caillaud, M.; Tanaka, H.; Haley, A.P. Network Modeling Sex Differences in Brain Integrity and Metabolic Health. Front. Aging Neurosci. 2021, 13, 691691. [Google Scholar] [CrossRef] [PubMed]
- Hayden, K.M.; Beavers, D.P.; Steck, S.E.; Hebert, J.R.; Tabung, F.K.; Shivappa, N.; Casanova, R.; Manson, J.E.; Padula, C.B.; Salmoirago-Blotcher, E.; et al. The association between an inflammatory diet and global cognitive function and incident dementia in older women: The Women’s Health Initiative Memory Study. Alzheimer’s Dement. 2017, 13, 1187–1196. [Google Scholar] [CrossRef] [PubMed]
- Bamford, S.M.; Walker, T. Women and dementia--not forgotten. Maturitas 2012, 73, 121–126. [Google Scholar] [CrossRef] [PubMed]
- Aung, H.H.; Altman, R.; Nyunt, T.; Kim, J.; Nuthikattu, S.; Budamagunta, M.; Voss, J.C.; Wilson, D.; Rutledge, J.C.; Villablanca, A.C. Lipotoxic brain microvascular injury is mediated by activating transcription factor 3-dependent inflammatory and oxidative stress pathways. J. Lipid Res. 2016, 57, 955–968. [Google Scholar] [CrossRef] [PubMed] [Green Version]
- Nuthikattu, S.; Milenkovic, D.; Rutledge, J.; Villablanca, A. The Western Diet Regulates Hippocampal Microvascular Gene Expression: An Integrated Genomic Analyses in Female Mice. Sci. Rep. 2019, 9, 19058. [Google Scholar] [CrossRef] [Green Version]
- Nuthikattu, S.; Milenkovic, D.; Rutledge, J.C.; Villablanca, A.C. Lipotoxic Injury Differentially Regulates Brain Microvascular Gene Expression in Male Mice. Nutrients 2020, 12, 1771. [Google Scholar] [CrossRef]
- Nuthikattu, S.; Milenkovic, D.; Rutledge, J.C.; Villablanca, A.C. Sex-Dependent Molecular Mechanisms of Lipotoxic Injury in Brain Microvasculature: Implications for Dementia. Int. J. Mol. Sci. 2020, 21, 8146. [Google Scholar] [CrossRef]
- Brand-Miller, J.C. Glycemic load and chronic disease. Nutr. Rev. 2003, 61, S49–S55. [Google Scholar] [CrossRef]
- Dong, J.Y.; Zhang, Y.H.; Wang, P.; Qin, L.Q. Meta-analysis of dietary glycemic load and glycemic index in relation to risk of coronary heart disease. Am. J. Cardiol. 2012, 109, 1608–1613. [Google Scholar] [CrossRef]
- Fan, J.; Song, Y.; Wang, Y.; Hui, R.; Zhang, W. Dietary glycemic index, glycemic load, and risk of coronary heart disease, stroke, and stroke mortality: A systematic review with meta-analysis. PLoS ONE 2012, 7, e52182. [Google Scholar] [CrossRef]
- Nuthikattu, S.; Milenkovic, D.; Norman, J.E.; Rutledge, J.; Villablanca, A. Inhibition of Soluble Epoxide Hydrolase Is Protective against the Multiomic Effects of a High Glycemic Diet on Brain Microvascular Inflammation and Cognitive Dysfunction. Nutrients 2021, 13, 3913. [Google Scholar] [CrossRef] [PubMed]
- Knierim, J.J. The hippocampus. Curr. Biol. 2015, 25, R1116–R1121. [Google Scholar] [CrossRef] [PubMed] [Green Version]
- Vittal Rao, H.; Bihaqi, S.W.; Iannucci, J.; Sen, A.; Grammas, P. Thrombin Signaling Contributes to High Glucose-Induced Injury of Human Brain Microvascular Endothelial Cells. J. Alzheimer’s Dis. 2021, 79, 211–224. [Google Scholar] [CrossRef]
- Seetharaman, S.; Andel, R.; McEvoy, C.; Dahl Aslan, A.K.; Finkel, D.; Pedersen, N.L. Blood glucose, diet-based glycemic load and cognitive aging among dementia-free older adults. J. Gerontol. Ser. A Biomed. Sci. Med. Sci. 2015, 70, 471–479. [Google Scholar] [CrossRef] [PubMed] [Green Version]
- Taylor, M.K.; Sullivan, D.K.; Swerdlow, R.H.; Vidoni, E.D.; Morris, J.K.; Mahnken, J.D.; Burns, J.M. A high-glycemic diet is associated with cerebral amyloid burden in cognitively normal older adults. Am. J. Clin. Nutr. 2017, 106, 1463–1470. [Google Scholar] [CrossRef] [PubMed] [Green Version]
- Gentreau, M.; Raymond, M.; Chuy, V.; Samieri, C.; Féart, C.; Berticat, C.; Artero, S. High Glycemic Load Is Associated with Cognitive Decline in Apolipoprotein E ε4 Allele Carriers. Nutrients 2020, 12, 3619. [Google Scholar] [CrossRef] [PubMed]
- Saikrishna, K.; Kumari, R.; Chaitanya, K.; Biswas, S.; Nayak, P.G.; Mudgal, J.; Kishore, A.; Nandakumar, K. Combined Administration of Monosodium Glutamate and High Sucrose Diet Accelerates the Induction of Type 2 Diabetes, Vascular Dysfunction, and Memory Impairment in Rats. J. Environ. Pathol. Toxicol. Oncol. 2018, 37, 63–80. [Google Scholar] [CrossRef]
- Wong, A.; Dogra, V.R.; Reichelt, A.C. High-sucrose diets in male rats disrupt aspects of decision making tasks, motivation and spatial memory, but not impulsivity measured by operant delay-discounting. Behav. Brain Res. 2017, 327, 144–154. [Google Scholar] [CrossRef]
- Żebrowska, E.; Chabowski, A.; Zalewska, A.; Maciejczyk, M. High-Sugar Diet Disrupts Hypothalamic but Not Cerebral Cortex Redox Homeostasis. Nutrients 2020, 12, 3181. [Google Scholar] [CrossRef]
- Pinto, B.A.; Melo, T.M.; Flister, K.F.; França, L.M.; Kajihara, D.; Tanaka, L.Y.; Laurindo, F.R.; Paes, A.M. Early and sustained exposure to high-sucrose diet triggers hippocampal ER stress in young rats. Metab. Brain Dis. 2016, 31, 917–927. [Google Scholar] [CrossRef]
- Yeh, S.H.; Shie, F.S.; Liu, H.K.; Yao, H.H.; Kao, P.C.; Lee, Y.H.; Chen, L.M.; Hsu, S.M.; Chao, L.J.; Wu, K.W.; et al. A high-sucrose diet aggravates Alzheimer’s disease pathology, attenuates hypothalamic leptin signaling, and impairs food-anticipatory activity in APPswe/PS1De9 mice. Neurobiol. Aging 2020, 90, 60–74. [Google Scholar] [CrossRef] [PubMed]
- Lampert, C.; Arcego, D.M.; de Sá Couto-Pereira, N.; Dos Santos Vieira, A.; Toniazzo, A.P.; Krolow, R.; Garcia, E.; Vendite, D.A.; Calcagnotto, M.E.; Dalmaz, C. Short post-weaning social isolation induces long-term changes in the dopaminergic system and increases susceptibility to psychostimulants in female rats. Int. J. Dev. Neurosci. 2017, 61, 21–30. [Google Scholar] [CrossRef] [PubMed]
- Orr, M.E.; Salinas, A.; Buffenstein, R.; Oddo, S. Mammalian target of rapamycin hyperactivity mediates the detrimental effects of a high sucrose diet on Alzheimer’s disease pathology. Neurobiol. Aging 2014, 35, 1233–1242. [Google Scholar] [CrossRef] [PubMed] [Green Version]
- Robison, L.S.; Gannon, O.J.; Salinero, A.E.; Zuloaga, K.L. Contributions of sex to cerebrovascular function and pathology. Brain Res. 2019, 1710, 43–60. [Google Scholar] [CrossRef] [PubMed]
- Wang, L.; Luo, G.; Zhang, L.F.; Geng, H.X. Neuroprotective effects of epoxyeicosatrienoic acids. Prostaglandins Other Lipid Mediat. 2018, 138, 9–14. [Google Scholar] [CrossRef]
- Zarriello, S.; Tuazon, J.P.; Corey, S.; Schimmel, S.; Rajani, M.; Gorsky, A.; Incontri, D.; Hammock, B.D.; Borlongan, C.V. Humble beginnings with big goals: Small molecule soluble epoxide hydrolase inhibitors for treating CNS disorders. Prog. Neurobiol. 2019, 172, 23–39. [Google Scholar] [CrossRef] [PubMed]
- Sun, C.-P.; Zhang, X.-Y.; Zhou, J.-J.; Huo, X.-K.; Yu, Z.-L.; Morisseau, C.; Hammock, B.D.; Ma, X.-C. Inhibition of I via stabilizing the level of EETs alleviated Alzheimer’s disease through GSK3β signaling pathway. Food Chem. Toxicol. 2021, 156, 112516. [Google Scholar] [CrossRef]
- Davis, C.M.; Fairbanks, S.L.; Alkayed, N.J. Mechanism of the sex difference in endothelial dysfunction after stroke. Transl. Stroke Res. 2013, 4, 381–389. [Google Scholar] [CrossRef]
- Gupta, N.C.; Davis, C.M.; Nelson, J.W.; Young, J.M.; Alkayed, N.J. Soluble epoxide hydrolase: Sex differences and role in endothelial cell survival. Arterioscler. Thromb. Vasc. Biol. 2012, 32, 1936–1942. [Google Scholar] [CrossRef]
- Koerner, I.P.; Zhang, W.; Cheng, J.; Parker, S.; Hurn, P.D.; Alkayed, N.J. Soluble epoxide hydrolase: Regulation by estrogen and role in the inflammatory response to cerebral ischemia. Front. Biosci. 2008, 13, 2833–2841. [Google Scholar] [CrossRef] [Green Version]
- Zhang, W.; Iliff, J.J.; Campbell, C.J.; Wang, R.K.; Hurn, P.D.; Alkayed, N.J. Role of soluble epoxide hydrolase in the sex-specific vascular response to cerebral ischemia. J. Cereb. Blood Flow Metab. 2009, 29, 1475–1481. [Google Scholar] [CrossRef] [PubMed] [Green Version]
- Van Schothorst, E.M.; Bunschoten, A.; Schrauwen, P.; Mensink, R.P.; Keijer, J. Effects of a high-fat, low-versus high-glycemic index diet: Retardation of insulin resistance involves adipose tissue modulation. FASEB J. 2009, 23, 1092–1101. [Google Scholar] [CrossRef] [PubMed]
- Zhu, Y.; Smith, K.; Rowan, S.; Greenberg, A. The Short-Term Effect of a High-Glycemic Diet on Mouse Obesity and Intestinal Microbiota Composition. Curr. Dev. Nutr. 2020, 4 (Suppl. 2), 1602. [Google Scholar] [CrossRef]
- Sousa, L.G.O.d.; Marshall, A.G.; Norman, J.E.; Fuqua, J.D.; Lira, V.A.; Rutledge, J.C.; Bodine, S.C. The effects of diet composition and chronic obesity on muscle growth and function. J. Appl. Physiol. 2021, 130, 124–138. [Google Scholar] [CrossRef] [PubMed]
- Campbell, G.J.; Senior, A.M.; Bell-Anderson, K.S. Metabolic Effects of High Glycaemic Index Diets: A Systematic Review and Meta-Analysis of Feeding Studies in Mice and Rats. Nutrients 2017, 9, 646. [Google Scholar] [CrossRef] [Green Version]
- Huang, J.; Wan, L.; Lu, H.; Li, X. High expression of active ATF6 aggravates endoplasmic reticulum stress-induced vascular endothelial cell apoptosis through the mitochondrial apoptotic pathway. Mol. Med. Rep. 2018, 17, 6483–6489. [Google Scholar] [CrossRef] [PubMed] [Green Version]
- Mannarino, E.; Pirro, M. Endothelial injury and repair: A novel theory for atherosclerosis. Angiology 2008, 59, 69s–72s. [Google Scholar] [CrossRef]
- Luchetti, F.; Crinelli, R.; Cesarini, E.; Canonico, B.; Guidi, L.; Zerbinati, C.; Di Sario, G.; Zamai, L.; Magnani, M.; Papa, S.; et al. Endothelial cells, endoplasmic reticulum stress and oxysterols. Redox Biol. 2017, 13, 581–587. [Google Scholar] [CrossRef]
- Battson, M.L.; Lee, D.M.; Gentile, C.L. Endoplasmic reticulum stress and the development of endothelial dysfunction. Am. J. Physiol. Heart Circ. Physiol. 2017, 312, H355–H367. [Google Scholar] [CrossRef]
- Dhahri, W.; Dussault, S.; Légaré, É.; Rivard, F.; Desjarlais, M.; Mathieu, R.; Rivard, A. Reduced expression of microRNA-130a promotes endothelial cell senescence and age-dependent impairment of neovascularization. Aging 2020, 12, 10180–10193. [Google Scholar] [CrossRef]
- Bijli, K.M.; Fazal, F.; Slavin, S.A.; Leonard, A.; Grose, V.; Alexander, W.B.; Smrcka, A.V.; Rahman, A. Phospholipase C-ε signaling mediates endothelial cell inflammation and barrier disruption in acute lung injury. Am. J. Physiol. Lung Cell. Mol. Physiol. 2016, 311, L517–L524. [Google Scholar] [CrossRef] [PubMed] [Green Version]
- Wu, M.H. Endothelial focal adhesions and barrier function. J. Physiol. 2005, 569, 359–366. [Google Scholar] [CrossRef] [PubMed]
- Pannekoek, W.J.; Post, A.; Bos, J.L. Rap1 signaling in endothelial barrier control. Cell Adh. Migr. 2014, 8, 100–107. [Google Scholar] [CrossRef] [PubMed] [Green Version]
- Iacobazzi, D.; Garaeva, I.; Albertario, A.; Cherif, M.; Angelini, G.D.; Caputo, M.; Ghorbel, M.T. Protein Phosphatase 1 Beta is Modulated by Chronic Hypoxia and Involved in the Angiogenic Endothelial Cell Migration. Cell. Physiol. Biochem. 2015, 36, 384–394. [Google Scholar] [CrossRef] [PubMed] [Green Version]
- Diwan, A.H.; Honkanen, R.E.; Schaeffer, R.C., Jr.; Strada, S.J.; Thompson, W.J. Inhibition of serine-threonine protein phosphatases decreases barrier function of rat pulmonary microvascular endothelial cells. J. Cell. Physiol. 1997, 171, 259–270. [Google Scholar] [CrossRef]
- Kovacs-Kasa, A.; Kim, K.M.; Cherian-Shaw, M.; Black, S.M.; Fulton, D.J.; Verin, A.D. Extracellular adenosine-induced Rac1 activation in pulmonary endothelium: Molecular mechanisms and barrier-protective role. J. Cell. Physiol. 2018, 233, 5736–5746. [Google Scholar] [CrossRef]
- Simpkins, A.N.; Rudic, R.D.; Schreihofer, D.A.; Roy, S.; Manhiani, M.; Tsai, H.J.; Hammock, B.D.; Imig, J.D. Soluble epoxide inhibition is protective against cerebral ischemia via vascular and neural protection. Am. J. Pathol. 2009, 174, 2086–2095. [Google Scholar] [CrossRef] [Green Version]
- Shaik, J.S.; Ahmad, M.; Li, W.; Rose, M.E.; Foley, L.M.; Hitchens, T.K.; Graham, S.H.; Hwang, S.H.; Hammock, B.D.; Poloyac, S.M. Soluble epoxide hydrolase inhibitor trans-4-[4-(3-adamantan-1-yl-ureido)-cyclohexyloxy]-benzoic acid is neuroprotective in rat model of ischemic stroke. Am. J. Physiol. Heart Circ. Physiol. 2013, 305, H1605–H1613. [Google Scholar] [CrossRef] [Green Version]
- Wu, J.; Fan, Z.; Zhao, Y.; Chen, Q.; Xiao, Q. Inhibition of soluble epoxide hydrolase (I) protects hippocampal neurons and reduces cognitive decline in type 2 diabetic mice. Eur. J. Neurosci. 2021, 53, 2532–2540. [Google Scholar] [CrossRef]
- Minaz, N.; Razdan, R.; Hammock, B.D.; Goswami, S.K. An inhibitor of soluble epoxide hydrolase ameliorates diabetes-induced learning and memory impairment in rats. Prostaglandins Other Lipid Mediat. 2018, 136, 84–89. [Google Scholar] [CrossRef]
- Matin, N.; Fisher, C.; Lansdell, T.A.; Hammock, B.D.; Yang, J.; Jackson, W.F.; Dorrance, A.M. Soluble epoxide hydrolase inhibition improves cognitive function and parenchymal artery dilation in a hypertensive model of chronic cerebral hypoperfusion. Microcirculation 2021, 28, e12653. [Google Scholar] [CrossRef] [PubMed]
- Dorrance, A.M.; Rupp, N.; Pollock, D.M.; Newman, J.W.; Hammock, B.D.; Imig, J.D. An epoxide hydrolase inhibitor, 12-(3-adamantan-1-yl-ureido)dodecanoic acid (AUDA), reduces ischemic cerebral infarct size in stroke-prone spontaneously hypertensive rats. J. Cardiovasc. Pharmacol. 2005, 46, 842–848. [Google Scholar] [CrossRef] [PubMed] [Green Version]
- Bellien, J.; Joannides, R. Epoxyeicosatrienoic acid pathway in human health and diseases. J. Cardiovasc. Pharmacol. 2013, 61, 188–196. [Google Scholar] [CrossRef] [PubMed]
- Bellien, J.; Joannides, R.; Richard, V.; Thuillez, C. Modulation of cytochrome-derived epoxyeicosatrienoic acids pathway: A promising pharmacological approach to prevent endothelial dysfunction in cardiovascular diseases? Pharmacol. Ther. 2011, 131, 1–17. [Google Scholar] [CrossRef] [PubMed]
- Lorthioir, A.; Guerrot, D.; Joannides, R.; Bellien, J. Diabetic CVD—Soluble epoxide hydrolase as a target. Cardiovasc. Hematol. Agents Med. Chem. 2012, 10, 212–222. [Google Scholar] [CrossRef] [PubMed]
- Yao, L.; Cao, B.; Cheng, Q.; Cai, W.; Ye, C.; Liang, J.; Liu, W.; Tan, L.; Yan, M.; Li, B.; et al. Inhibition of soluble epoxide hydrolase ameliorates hyperhomocysteinemia-induced hepatic steatosis by enhancing β-oxidation of fatty acid in mice. Am. J. Physiol. Gastrointest. Liver Physiol. 2019, 316, G527–G538. [Google Scholar] [CrossRef]
- Reisdorf, W.C.; Xie, Q.; Zeng, X.; Xie, W.; Rajpal, N.; Hoang, B.; Burgert, M.E.; Kumar, V.; Hurle, M.R.; Rajpal, D.K.; et al. Preclinical evaluation of EPHX2 inhibition as a novel treatment for inflammatory bowel disease. PLoS ONE 2019, 14, e0215033. [Google Scholar] [CrossRef] [Green Version]
- Cong, X.; Kong, W. Endothelial tight junctions and their regulatory signaling pathways in vascular homeostasis and disease. Cell. Signal. 2020, 66, 109485. [Google Scholar] [CrossRef]
- Yao, E.S.; Tang, Y.; Liu, X.H.; Wang, M.H. TPPU protects tau from H2O2-induced hyperphosphorylation in HEK293/tau cells by regulating PI3K/AKT/GSK-3β pathway. J. Huazhong Univ. Sci. Technol. Med. Sci. 2016, 36, 785–790. [Google Scholar] [CrossRef]
- Li, X.; Wu, X. Soluble epoxide hydrolase (Ephx2) silencing attenuates the hydrogen peroxide-induced oxidative damage in IEC-6 cells. Arch. Med. Sci. 2021, 17, 1075–1086. [Google Scholar] [CrossRef]
- Zhang, Y.; Hong, G.; Lee, K.S.; Hammock, B.D.; Gebremedhin, D.; Harder, D.R.; Koehler, R.C.; Sapirstein, A. Inhibition of soluble epoxide hydrolase augments astrocyte release of vascular endothelial growth factor and neuronal recovery after oxygen-glucose deprivation. J. Neurochem. 2017, 140, 814–825. [Google Scholar] [CrossRef] [PubMed] [Green Version]
- Sudhahar, V.; Shaw, S.; Imig, J.D. Epoxyeicosatrienoic acid analogs and vascular function. Curr. Med. Chem. 2010, 17, 1181–1190. [Google Scholar] [CrossRef] [PubMed]
- Liu, L.; Puri, N.; Raffaele, M.; Schragenheim, J.; Singh, S.P.; Bradbury, J.A.; Bellner, L.; Vanella, L.; Zeldin, D.C.; Cao, J.; et al. Ablation of soluble epoxide hydrolase reprogram white fat to beige-like fat through an increase in mitochondrial integrity, HO-1-adiponectin in vitro and in vivo. Prostaglandins Other Lipid Mediat. 2018, 138, 1–8. [Google Scholar] [CrossRef] [PubMed]
- Zhang, W.; Li, H.; Dong, H.; Liao, J.; Hammock, B.D.; Yang, G.Y. Soluble epoxide hydrolase deficiency inhibits dextran sulfate sodium-induced colitis and carcinogenesis in mice. Anticancer Res. 2013, 33, 5261–5271. [Google Scholar]
- Campbell, W.B. New role for epoxyeicosatrienoic acids as anti-inflammatory mediators. Trends Pharmacol. Sci. 2000, 21, 125–127. [Google Scholar] [CrossRef]
- Cowart, L.A.; Wei, S.; Hsu, M.H.; Johnson, E.F.; Krishna, M.U.; Falck, J.R.; Capdevila, J.H. The CYP4A isoforms hydroxylate epoxyeicosatrienoic acids to form high affinity peroxisome proliferator-activated receptor ligands. J. Biol. Chem. 2002, 277, 35105–35112. [Google Scholar] [CrossRef] [Green Version]
- Wong, P.Y.; Lai, P.S.; Shen, S.Y.; Belosludtsev, Y.Y.; Falck, J.R. Post-receptor signal transduction and regulation of 14I,15(S)-epoxyeicosatrienoic acid (14,15-EET) binding in U-937 cells. J. Lipid Mediat. Cell Signal. 1997, 16, 155–169. [Google Scholar] [CrossRef]
- Oguro, A.; Fujita, N.; Imaoka, S. Regulation of soluble epoxide hydrolase (I) in mice with diabetes: High glucose suppresses I expression. Drug Metab. Pharmacokinet. 2009, 24, 438–445. [Google Scholar] [CrossRef] [Green Version]
- Taylor, M.K.; Sullivan, D.K.; Morris, J.K.; Vidoni, E.D.; Honea, R.A.; Mahnken, J.D.; Burns, J.M. High Glycemic Diet Is Related to Brain Amyloid Accumulation Over One Year in Preclinical Alzheimer’s Disease. Front. Nutr. 2021, 8, 741534. [Google Scholar] [CrossRef]
- Ortiz, G.G.; Huerta, M.; González-Usigli, H.A.; Torres-Sánchez, E.D.; Delgado-Lara, D.L.; Pacheco-Moisés, F.P.; Mireles-Ramírez, M.A.; Torres-Mendoza, B.M.; Moreno-Cih, R.I.; Velázquez-Brizuela, I.E. Cognitive disorder and dementia in type 2 diabetes mellitus. World J. Diabetes 2022, 13, 319–337. [Google Scholar] [CrossRef]
- Poli, G.; Corda, E.; Martino, P.A.; Dall’ara, P.; Bareggi, S.R.; Bondiolotti, G.; Iulini, B.; Mazza, M.; Casalone, C.; Hwang, S.H.; et al. Therapeutic activity of inhibition of the soluble epoxide hydrolase in a mouse model of scrapie. Life Sci. 2013, 92, 1145–1150. [Google Scholar] [CrossRef] [PubMed] [Green Version]
- Roche, C.; Besnier, M.; Cassel, R.; Harouki, N.; Coquerel, D.; Guerrot, D.; Nicol, L.; Loizon, E.; Remy-Jouet, I.; Morisseau, C.; et al. Soluble epoxide hydrolase inhibition improves coronary endothelial function and prevents the development of cardiac alterations in obese insulin-resistant mice. Am. J. Physiol.-Heart Circ. Physiol. 2015, 308, H1020–H1029. [Google Scholar] [CrossRef] [Green Version]
- Gui, Y.J.; Yang, T.; Liu, Q.; Liao, C.X.; Chen, J.Y.; Wang, Y.T.; Hu, J.H.; Xu, D.Y. Soluble epoxide hydrolase inhibitors, t-AUCB, regulated microRNA-1 and its target genes in myocardial infarction mice. Oncotarget 2017, 8, 94635–94649. [Google Scholar] [CrossRef] [PubMed] [Green Version]
- Hermansky, S.J.; Neptun, D.A.; Loughran, K.A.; Leung, H.W. Effects of polyethylene glycol 400 (PEG 400) following 13 weeks of gavage treatment in Fischer-344 rats. Food Chem. Toxicol. 1995, 33, 139–149. [Google Scholar] [CrossRef]
- McLean, A.C.; Valenzuela, N.; Fai, S.; Bennett, S.A. Performing vaginal lavage, crystal violet staining, and vaginal cytological evaluation for mouse estrous cycle staging identification. J. Vis. Exp. 2012, e4389. [Google Scholar] [CrossRef] [PubMed] [Green Version]
- Ball, H.J.; McParland, B.; Driussi, C.; Hunt, N.H. Isolating vessels from the mouse brain for gene expression analysis using laser capture microdissection. Brain Res. Protoc. 2002, 9, 206–213. [Google Scholar] [CrossRef]
- Metsalu, T.; Vilo, J. ClustVis: A web tool for visualizing clustering of multivariate data using Principal Component Analysis and heatmap. Nucleic Acids Res. 2015, 43, W566–W570. [Google Scholar] [CrossRef]
- MetaboAnalyst-Statistical, Functional and Integrative Analysis of Metabolomics Data. Available online: https://www.metaboanalyst.ca/ (accessed on 2 March 2020).
- Pang, Z.; Chong, J.; Zhou, G.; de Lima Morais, D.A.; Chang, L.; Barrette, M.; Gauthier, C.; Jacques, P.-É.; Li, S.; Xia, J. MetaboAnalyst 5.0: Narrowing the gap between raw spectra and functional insights. Nucleic Acids Res. 2021, 49, W388–W396. [Google Scholar] [CrossRef]
- Ge, S.X.; Jung, D.; Yao, R. ShinyGO: A graphical gene-set enrichment tool for animals and plants. Bioinformatics 2019, 36, 2628–2629. [Google Scholar] [CrossRef]
- Licursi, V.; Conte, F.; Fiscon, G.; Paci, P. MIENTURNET: An interactive web tool for microRNA-target enrichment and network-based analysis. BMC Bioinform. 2019, 20, 545. [Google Scholar] [CrossRef]
- Fukunaga, T.; Iwakiri, J.; Ono, Y.; Hamada, M. LncRRIsearch: A Web Server for lncRNA-RNA Interaction Prediction Integrated With Tissue-Specific Expression and Subcellular Localization Data. Front. Genet. 2019, 10, 462. [Google Scholar] [CrossRef] [PubMed] [Green Version]
- Rtools CBRC. Available online: http://rtools.cbrc.jp/cgi-bin/RNARNA/index.pl (accessed on 25 April 2021).
- GeneTrail2. Available online: https://genetrail2.bioinf.uni-sb.de (accessed on 2 June 2019).
- Stockel, D.; Kehl, T.; Trampert, P.; Schneider, L.; Backes, C.; Ludwig, N.; Gerasch, A.; Kaufmann, M.; Gessler, M.; Graf, N.; et al. Multi-omics enrichment analysis using the GeneTrail2 web service. Bioinformatics 2016, 32, 1502–1508. [Google Scholar] [CrossRef] [PubMed] [Green Version]
- Cytoscape Network Analyzer Application. Available online: http://apps.cytoscape.org/apps/networkanalyzer (accessed on 2 March 2020).
- Su, G.; Morris, J.H.; Demchak, B.; Bader, G.D. Biological network exploration with Cytoscape 3. Curr. Protoc. Bioinform. 2014, 47, 8–13. [Google Scholar] [CrossRef] [PubMed] [Green Version]
- Xie, Z.; Bailey, A.; Kuleshov, M.V.; Clarke, D.J.B.; Evangelista, J.E.; Jenkins, S.L.; Lachmann, A.; Wojciechowicz, M.L.; Kropiwnicki, E.; Jagodnik, K.M.; et al. Gene Set Knowledge Discovery with Enrichr. Curr. Protoc. 2021, 1, e90. [Google Scholar] [CrossRef]
- PermutMatrix. Available online: http://www.atgc-montpellier.fr/permutmatrix/ (accessed on 2 June 2019).
- Caraux, G.; Pinloche, S. PermutMatrix: A graphical environment to arrange gene expression profiles in optimal linear order. Bioinformatics 2005, 21, 1280–1281. [Google Scholar] [CrossRef] [Green Version]
- Grondin, C.J.; Davis, A.P.; Wiegers, J.A.; Wiegers, T.C.; Sciaky, D.; Johnson, R.J.; Mattingly, C.J. Predicting molecular mechanisms, pathways, and health outcomes induced by Juul e-cigarette aerosol chemicals using the Comparative Toxicogenomics Database. Curr. Res. Toxicol. 2021, 2, 272–281. [Google Scholar] [CrossRef]
- Kraeuter, A.K.; Guest, P.C.; Sarnyai, Z. The Y-Maze for Assessment of Spatial Working and Reference Memory in Mice. Methods Mol. Biol. 2019, 1916, 105–111. [Google Scholar] [CrossRef]
- Nuthikattu, S.; Milenkovic, D.; Norman, J.E.; Rutledge, J.; Villablanca, A. The Brain’s Microvascular Response to High Glycemia and to the Inhibition of Soluble Epoxide Hydrolase Is Sexually Dimorphic. Nutrients 2022, 14, 3451. [Google Scholar] [CrossRef]
- Hammock, B.D.; McReynolds, C.B.; Wagner, K.; Buckpitt, A.; Cortes-Puch, I.; Croston, G.; Lee, K.S.S.; Yang, J.; Schmidt, W.K.; Hwang, S.H. Movement to the Clinic of Soluble Epoxide Hydrolase Inhibitor EC5026 as an Analgesic for Neuropathic Pain and for Use as a Nonaddictive Opioid Alternative. J. Med. Chem. 2021, 64, 1856–1872. [Google Scholar] [CrossRef]
- Yang, L.; Cheriyan, J.; Gutterman, D.D.; Mayer, R.J.; Ament, Z.; Griffin, J.L.; Lazaar, A.L.; Newby, D.E.; Tal-Singer, R.; Wilkinson, I.B. Mechanisms of Vascular Dysfunction in COPD and Effects of a Novel Soluble Epoxide Hydrolase Inhibitor in Smokers. Chest 2017, 151, 555–563. [Google Scholar] [CrossRef]
- Imig, J.D.; Morisseau, C. Editorial: Clinical Paths for Soluble Epoxide Hydrolase Inhibitors. Front. Pharmacol. 2020, 11, 598858. [Google Scholar] [CrossRef] [PubMed]
- Imig, J.D. Prospective for cytochrome P450 epoxygenase cardiovascular and renal therapeutics. Pharmacol. Ther. 2018, 192, 1–19. [Google Scholar] [CrossRef] [PubMed]
- Chen, D.; Whitcomb, R.; MacIntyre, E.; Tran, V.; Do, Z.N.; Sabry, J.; Patel, D.V.; Anandan, S.K.; Gless, R.; Webb, H.K. Pharmacokinetics and pharmacodynamics of AR9281, an inhibitor of soluble epoxide hydrolase, in single- and multiple-dose studies in healthy human subjects. J. Clin. Pharmacol. 2012, 52, 319–328. [Google Scholar] [CrossRef] [PubMed]


| Y Maze Test | LGD | LGD+sEHI | HGD | HGD+sEHI |
|---|---|---|---|---|
| Alternation triplets (%) | 44.3 ± 2.4 | 58.0 ± 4.2 * | 48.7 ± 2.2 | 57.5 ± 5.5 |
| Disease | Corrected p-Value |
|---|---|
| HGD vs. LGD | |
| Brain Diseases | 0.00781 |
| Central Nervous System Diseases | 0.02359 |
| Intellectual Disability | 0.00071 |
| Metabolic Diseases | 0.02285 |
| Nervous System Diseases | 0.000266 |
| Neurobehavioral Manifestations | 0.0000724 |
| Neurologic Manifestations | 0.000573 |
| Vascular Diseases | 0.03423 |
| HGD+sEHI vs. HGD | |
| ND | ND |
| LGD+sEHI vs. LGD | |
| Amyotrophic Lateral Sclerosis | 0.04935 |
| Brain Diseases | 0.0000137 |
| Cardiovascular Diseases | 0.0000134 |
| Central Nervous System Diseases | 0.000000035 |
| Dementia | 0.01501 |
| Dyskinesias | 0.000000946 |
| Heart Diseases | 0.000208 |
| Hyperkinesis | 0.04363 |
| Intellectual Disability | 0.0023 |
| Movement Disorders | 0.000136 |
| Myocardial Ischemia | 0.00386 |
| Nervous System Diseases | 1.2 × 10⁻¹² |
| Neurobehavioral Manifestations | 0.0000162 |
| Neurodegenerative Diseases | 0.0000918 |
| Neurologic Manifestations | 1.13 × 10⁻¹⁰ |
| Neuromuscular Diseases | 0.00162 |
| Vascular Diseases | 0.0000724 |
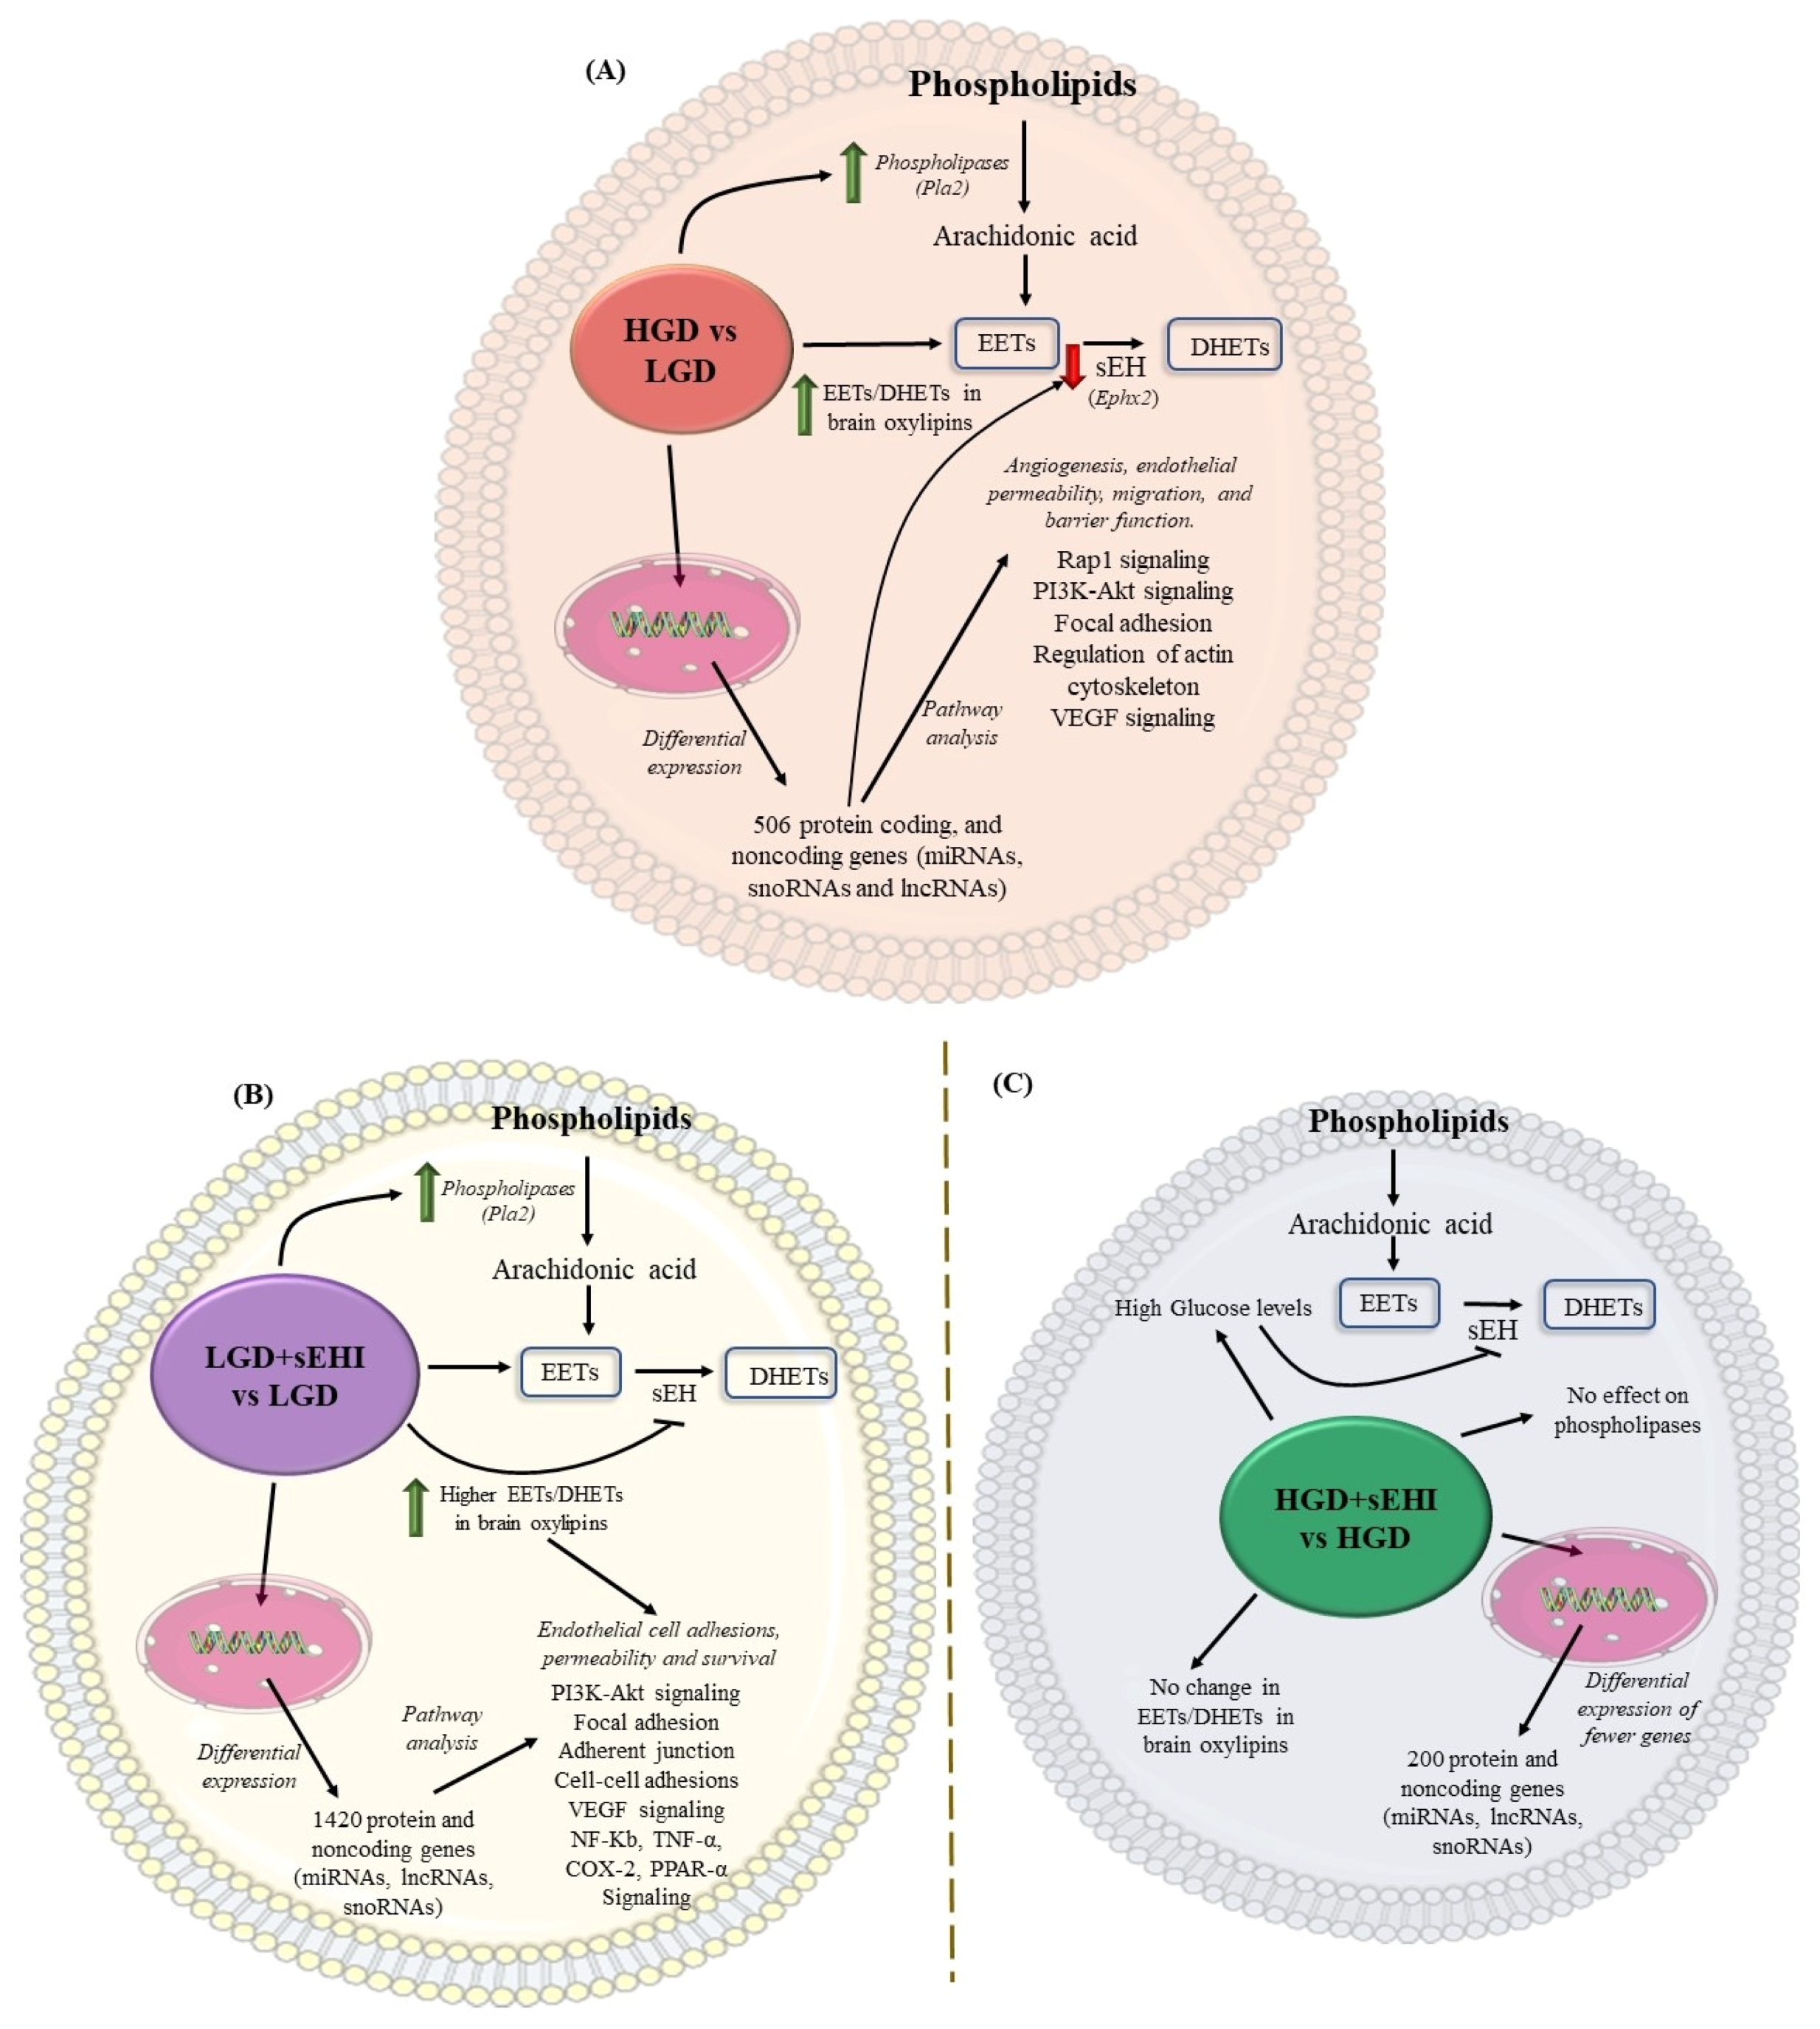
| Female Brain Hippocampal Microvessels | HGD vs. LGD | LGD+sEHI vs. LGD | HGD+sEHI vs. HGD |
|---|---|---|---|
| Differentially expressed genes (DEGs) | 506 | 1420 | 200 |
| Phospholipases (Pla2) |  |  |  |
| EETs/DHETs (brain oxylipins) |  |  |  |
| sEH (Ephx2) |  | Blocked | Blocked |
| Pathways | Angiogenesis, endothelial permeability, migration, and barrier function. Rap1 signaling PI3K-Akt signaling Focal adhesion Regulation of actin cytoskeleton VEGF signaling | Endothelial cell adhesions, permeability and survival. PI3K-Akt signaling Focal adhesion Adherent junction Cell–cell adhesions VEGF signaling NF-Kb, TNF-α, COX-2, PPAR-α Signaling | Fewer cellular pathways. Proteasome degradation Mapk signaling |
Publisher’s Note: MDPI stays neutral with regard to jurisdictional claims in published maps and institutional affiliations. |
© 2022 by the authors. Licensee MDPI, Basel, Switzerland. This article is an open access article distributed under the terms and conditions of the Creative Commons Attribution (CC BY) license (https://creativecommons.org/licenses/by/4.0/).
Share and Cite
Nuthikattu, S.; Milenkovic, D.; Norman, J.E.; Rutledge, J.; Villablanca, A. High Glycemia and Soluble Epoxide Hydrolase in Females: Differential Multiomics in Murine Brain Microvasculature. Int. J. Mol. Sci. 2022, 23, 13044. https://doi.org/10.3390/ijms232113044
Nuthikattu S, Milenkovic D, Norman JE, Rutledge J, Villablanca A. High Glycemia and Soluble Epoxide Hydrolase in Females: Differential Multiomics in Murine Brain Microvasculature. International Journal of Molecular Sciences. 2022; 23(21):13044. https://doi.org/10.3390/ijms232113044
Chicago/Turabian StyleNuthikattu, Saivageethi, Dragan Milenkovic, Jennifer E. Norman, John Rutledge, and Amparo Villablanca. 2022. "High Glycemia and Soluble Epoxide Hydrolase in Females: Differential Multiomics in Murine Brain Microvasculature" International Journal of Molecular Sciences 23, no. 21: 13044. https://doi.org/10.3390/ijms232113044
APA StyleNuthikattu, S., Milenkovic, D., Norman, J. E., Rutledge, J., & Villablanca, A. (2022). High Glycemia and Soluble Epoxide Hydrolase in Females: Differential Multiomics in Murine Brain Microvasculature. International Journal of Molecular Sciences, 23(21), 13044. https://doi.org/10.3390/ijms232113044