Abstract
Atopic dermatitis (AD) and psoriasis (PS) are common chronic inflammatory dermatoses. Although the differences at the intercellular and intracellular signaling level between AD and PS are well described, the resulting differences at the metabolism level have not yet been systematically analyzed. We compared the metabolomic profiles of the lesional skin, non-lesional skin and blood sera of AD and PS. Skin biopsies from 15 patients with AD, 20 patients with PS and 17 controls were collected, and 25 patients with AD, 55 patients with PS and 63 controls were recruited for the blood serum analysis. Serum and skin samples were analyzed using a targeted approach to find the concentrations of 188 metabolites and their ratios. A total of 19 metabolites differed in the comparison of lesional skins, one metabolite in non-lesional skins and 5 metabolites in blood sera. Although we found several metabolomic similarities between PS and AD, clear differences were outlined. Sphingomyelins were elevated in lesional skin of AD, implying a deficient barrier function. Increased levels of phosphatidylcholines, carnitines and asymmetric dimethylarginine in PS lesional skin and carnitines amino acids in the PS serum pointed to elevated cell proliferation. The comparison of the metabolomic profiles of AD and PS skin and sera outlined distinct patterns that were well correlated with the differences in the pathogenetic mechanisms of these two chronic inflammatory dermatoses.
1. Introduction
Atopic dermatitis (AD) and psoriasis (PS) are common chronic inflammatory dermatoses. PS is an immune-mediated disease that affects approximately 1.5–3% of the population [1]. The pathogenesis of PS involves Th1-, Th17- and Th22-lymphocyte driven inflammatory cascade, keratinocyte hyperproliferation and altered differentiation, as well as angiogenesis and vasodilatation [2,3,4]. Genetic and environmental factors also play a role in the development and persistence of the disease [5]. The prevalence of AD is 1–7% in adults, up to 20% in children and it has increased during past few decades [6,7]. AD is characterized by an impaired barrier function and a predominantly dysregulated Th2-mediated inflammation, although other immune pathways are included as well. The disease has a genetic predisposition and is worsened by numerous environmental factors such as reduced humidity, pollutants and tobacco smoke [8,9,10,11].
The differences at the intercellular and intracellular signaling level between AD and PS are well described; however, the resulting differences at the metabolism level have not been systematically analyzed yet. Both AD and PS are multifactorial diseases and metabolomic studies can help in better understanding their pathogenesis, which could lead to finding novel treatment opportunities in the future. To date, different approaches have been used to identify biomarkers characteristic of AD and PS.
In psoriatic lesional (PS-L) skin, there have been found elevated arachidonic acid, 12-hydroxyeicosatetraenoic acid (12-HETE), leukotriene B4, PGE2, PGF2-alpha and 13-hydroxyoctadecadienoic acid, 8, 12- and 15-hydroxyeicosatetraenoic acid, choline and taurine concentrations and decreased levels of myo-inositol and glucose [12,13,14,15,16]. According to Sorokin et al., there are higher glycerol and acylcarnitine levels and lower glutathione and gamma-glutamyl levels in PS plasma compared with the healthy controls [15]. Armstrong et al. found higher amounts of alpha ketoglutaric acid and lower amounts of asparagine and glutamine in PS patients’ blood serum (both with and without PsA) compared to controls. Elevated levels of alpha ketoglutaric acid and decreased levels of lignoceric acid were found in only cutaneous PS patients’ serum compared to PS patients with PsA. Higher concentrations of glucuronic acid were found in the serum of PS patients with PsA compared to controls [17]. In the comparison of the blood plasma of PS patients and healthy controls, differences among 37 amino acids (AA) and 40 carnitines were found. Negative correlations with PASI score were found in the concentrations of glutamine, asparagine and hexadecanoylcarnitine (C16) [18]. The lipidomic analysis of plasma samples collected from PS patients and healthy controls showed elevated levels of lysophosphatidic acid, lysophosphatidylcholine and phosphatidic acid and decreased levels of phosphatidylinositol and phosphatidylcholine in PS patients [19].
Less studies have been conducted on the metabolomic profile of AD. Berdyeshev et al. have found a higher proportion of short-chain ceramides, sphingomyelins and 14:0–22:0 lysophosphatidylcholines (LPC) and a decreased number of long-chain sphingolipids and LPC-s in AD skin compared to C [20]. In the serum of children with AD, decreased levels of glycine and taurine conjugated bile acids and increased levels of cholic acid, chenodeoxycholic acid and some unsaturated fatty acids were found compared to the controls [21]. In the urine of AD children, the concentrations of creatinine, creatine, citrate, formate, 2-hydroxybutyrate, dimethylglycine and lactate were increased and the concentrations of betaine, glycine and alanine were decreased [22].
Research related to metabolomic studies has been concentrated on the differences between lesional and non-lesional skin or that of blood sera of patients and healthy controls; nevertheless, the direct comparisons of the metabolomic profiles of PS and AD are virtually lacking. Here we elucidated for the first time the differences at the metabolism level in the PS and AD lesions and blood sera by head-to-head comparison. We detected a few similarities; however, we also unveiled remarkable differences (e.g., in the levels of phosphatidylcholines (PC) and sphingolipids) that corroborate the different pathogenetic mechanisms underlying these two widespread cutaneous pathologies.
2. Results
The concentration of each metabolite was normalized to values between 0 and 1 so that the metabolite levels of skin and serum could be compared. R package version 3.5.1 was used for data analyzation [23]. Non parametric Kruskal–Wallis rank sum test and the Mann–Whitney–Wilcoxon rank-sum test were used for statistical analysis. Benjamini–Hochberg (false discovery rate; FDR 5%) corrected p value < 0.05 was considered statistically significant.
In this study, we compared the metabolome of skin and sera of AD and PS patients (Figure 1). We found 19 metabolites and their ratios that differed statistically significantly between atopic dermatitis lesional (AD-L) and psoriatic lesional (PS-L) skin (Table 1). The median concentrations of sphingomyelins (SM) [SM.C26.0 (p = 0.0028), SM.C26.1 (p = 0.0035), hydroxysphingomyeline C22.1 (SM.OH.C22.1; p = 0.0095), SM.C18.1 (p = 0.0095), SM.C24.1 (p = 0.0095), SM.C24.0 (p = 0.0294), hydroxysphingomyeline C22.2 (SM.OH.C22.2; p = 0.0328), SM.C16.1 (p = 0.044) and SM.C16.0 (p = 0.044)] and the ratio of ornithine to arginine (Orn…Arg; p = 0.0285) were statistically significantly higher in AD-L skin when compared to PS-L skin. The median concentrations of asymmetric dimethylarginine (ADMA; p = 0.0043), acetylcarnitine (C2; p = 0.0086) and octadecadienylcarnitine (C18.2; p = 0.0318), and a group of glycerophospholipids [PC acyl-alkyl C38:1 (PC.ae.C38.1; p = 0.0095), PC acyl-alkyl C36:0 (PC.ae.C36.0; p = 0.0184), lysophosphatidylcholine acyl C16:1 (lysoPC.a.C16.1; p = 0.0274), PC acyl-alkyl C38:0 (PC.ae.C38.0; p = 0.0365), PC acyl-alkyl C38:2 (PC.ae.C38.2; p = 0.044) and PC acyl-alkyl C36:1 (PC.ae.C36.1; p = 0.044)] were increased in PS-L skin when compared to AD-L skin.
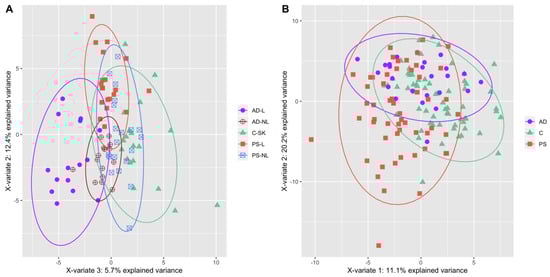
Figure 1.
(A) PLS-DA plot of the samples of AD (lesional skin—filled violet circles, non-lesional skin—empty violet circles), PS (lesional skin—filled red squares, non-lesional skin—empty blue squares) and C (filled green triangles) skin. (B) PLS-DA plot of the samples of AD (violet circles), PS (red squares) and C (green triangles) sera. Data is based on metabolites that changed statistically significantly from Kruskal–Wallis test.

Table 1.
Targeted analysis results from Mann–Whitney–Wilcoxon (MWW) test where AD patients’ lesional skin samples were compared to PS patients’ lesional skin samples.
When comparing atopic dermatitis non-lesional (AD-NL) and psoriatic non-lesional (PS-NL) skin, we found just one metabolite, acetylcarnitine (C2; p = 0.0481), that was more abundant in PS-NL samples, underpinning the similarity of NL skin samples as opposed to the lesional ones (AD-NL median value was 0.0985, PS-NL median value was 0.1455, 1.5-fold change).
In the comparison of AD and PS sera, we found five metabolites that were present at significantly different concentrations (Table 2). All the metabolite concentrations were elevated in PS sera, namely citrulline (Cit; p = 0.0392), glutamate (Glu; p = 0.0392), proline (Pro; p = 0.0392), carnitine (C0; p = 0.0184) and octadecenoylcarnitine (C18.1; p = 0.0392).
Table 2.
Statistically significantly different metabolites between the blood serum samples from atopic dermatitis (AD) and psoriasis (PS) patients.
3. Discussion
As expected, the lesions of PS and AD were characterized by distinct metabolomic patterns. A group of SM-s was elevated in AD-L skin and a group of PC-s had elevated concentrations in PS-L skin. Among SM-s, all except SM.C16.1 were also elevated in AD-L skin when compared to C skin [24]. Notably, there were no differences in the concentrations of SM-s between PS-L, PS-NL and C skin [25].
Lipids in stratum corneum have water-retaining properties and provide protection from environmental factors. Ceramides are the essential constituents of stratum corneum lipids and consist of a fatty acid residue and a sphingoid base [26,27,28]. Notably, the number of ceramides is reduced in the skin of AD patients [29,30]. Ceramides are produced either by degrading glucosylceramides (GCer) and SM by glucosylceramidase and sphingomyelinase or formed from serine and palmitic acid by serine palmitoyltransferase and ceramide synthase. Conversely, ceramides can be metabolized to SM via sphingomyelin synthase [26,27,31,32,33]. Hara et al. have found an increased expression of SM deacylase in AD patients’ skin, which competes with sphingomyelinase and glucosylceramidase for SM and GCer [27]. Imokawa et al. also found 5-fold enhanced activity of SM-GCer deacylase (also referred to as SM deacylase) in AD-L skin [34]. Additionally, reduced sphingomyelinase activity has been reported in AD skin [35] and all these changes are expected to result in decreased levels of ceramides in AD skin. Thus, the increased concentrations of SM in atopic dermatitis skin potentially reflect the reduction in ceramide synthesis when compared to psoriatic lesions.
The potential explanation for such changes is the prevalence of Th2-mediated inflammation in the AD lesional skin. Berdyshev et al. demonstrated the role of type 2 immune response on the lipid composition of AD skin. Besides showing the decrease in very long-chain fatty acids in several lipid classes, they also noted the increase in SM-s in AD skin, the skin of IL-13 transgenic mice and IL-4/IL-13 treated differentiated keratinocytes [20]. Another report demonstrated that Th2 cytokines provoked a decrease in stratum corneum ceramide levels and also downregulated the expression of serine-palmitoyl transferase-2, acid sphingomyelinase and β-glucocerebrosidase (glucosylceramidase) [20,36]. At the same time, Th1 cytokines induced mild elevation of ceramides and either upregulated or did not alter the activity of mentioned enzymes.
Conversely, in PS-L skin, a subset of PC-s (PC.ae.C36.0, PC.ae.C38.0 and PC.ae.C38.1) were elevated when compared to C and AD-L skin. Additionally, C2 and lysoPC.a.C16.1 were elevated in PS-L skin when compared to PS-NL skin. PC-s are major constituents of cellular membranes. As epidermal hyperproliferation is a characteristic of PS, the increased amount of PC-s in psoriatic plaques is consistent with the increased cell division rate. Choline, a constituent of PC, has previously been found elevated in PS-L skin and its levels were positively correlated with the severity of PS [16,25,37].
Besides being structural components of the cells, PC-s also participate in intra and intercellular signaling as well as act as important substrates for the biosynthesis of other signaling molecules such as diacylglycerol and arachidonic acid [32,38,39]. The latter can further be metabolized to leukotrienes and prostaglandins and leukotriene B4, PGE2 and PGF2-alpha, as well as arachidonic acid, were found at elevated concentrations in PS-L skin [12,13,14]. In addition, LysoPC-s are likely to participate in PS inflammatory response, as these possess pro-inflammatory properties and amplify the function of the cells of innate and adaptive immunity [40].
When studying the amino acid metabolism, we found that Orn…Arg was significantly lower in PS-L skin when compared to AD-L skin. We have previously found that this was also decreased in the comparison of PS-L and C skin [25]. ADMA levels were also higher in PS-L skin compared to AD-L skin. ADMA blocks the synthesis of Cit from Arg via inhibiting nitric oxide synthase (NOS) and in line with this the median concentrations of Arg have been previously found elevated in both PS-L and AD-L skin when compared to the C skin. Furthermore, Bilgic et al. found elevated ADMA levels in PS patients’ blood compared to controls [41]. Elevated serum levels of ADMA have been associated with an increased risk of atherosclerosis and cardiovascular disease, diseases that are also more prevalent in PS patients [42,43,44].
Two carnitines (C2 and C18.2) were elevated in PS-L skin when compared to AD-L skin. Additionally, C2 levels were also increased in PS-NL skin when compared to AD-NL skin. Of note, C2 was previously found elevated in AD-L skin compared to AD-NL skin and in PS-L skin compared to PS-NL skin. C18.2 had higher concentrations in PS-L skin while compared with PS-NL and C skin [24,25].
Carnitine takes part in fatty acid metabolism by transporting fatty acids into the mitochondria. This process is essential for utilization of medium- and long-chain fatty acids and involves esterifying L-carnitine into various acylcarnitine derivatives such as C18.2. The hyperproliferation of keratinocytes needs additional energy which could be provided by fatty acid β-oxidation that takes place in mitochondria. Additionally, C2 is a marker of free CoA and thus acts as a marker of the cell’s energetic homeostasis [45].
In the serum of PS patients, the levels of C0 and C18.1 were elevated compared to AD serum. Ottas et al. have previously found decreased ratio of acetylcarnitine to free carnitine (C2…C0) in PS and AD sera, potentially indicating an altered lipid metabolism in these chronic dermatoses [46,47].
Hyperproliferation also increases the need for protein synthesis and Glu has a significant role in stabilizing protein structure. Glu is synthesized from α-ketoglutarate and from other amino acids (AA-s) such as glutamine, Pro, Arg and histidine [48]. We found elevated levels of Glu in PS blood compared to C and also PS-L skin compared to PS-NL and C skin, as well as in AD-L skin compared to AD-NL and C skin. Dutkiewicz et al. found a positive correlation between the levels of Glu in PS skin and the severity of PS [37]. Elevated Glu levels have been found in the sera of patients suffering from inflammatory diseases or frequent PS comorbidities such as non-alcoholic fatty liver disease, diabetes, cardiometabolic disease and atherosclerosis [49,50,51].
Pro was also elevated in PS blood compared to AD blood. Pro can be metabolized to Glu and vice versa. Additionally, Pro can be synthesized from Orn and be metabolized to Orn, being subsequently converted into putrescine or Cit [52]. This is in concordance with Kang et al., who also found elevated concentrations of Pro in PS blood plasma compared to controls [53]. Kamleh et al. found changes in three metabolic pathways (Arg and Pro; glycine, serine and threonine; alanine, aspartate and Glu) when comparing the plasma from patients with mild and severe PS from healthy controls and from patients with severe PS after treatment with Etanercept. There was an increase of 90% in Cit levels in severe PS compared to C and its levels also correlated positively with PASI scores [54]. The elevated concentration of Cit is consistent with our findings as its level was elevated in PS blood serum when compared with AD.
On the other hand, Bilgic et al. found that the serum of PS contained significantly higher amounts of ADMA as well as homocysteine and had lower values of Cit and L-Arg/ADMA [41]. We and other authors have found alterations in urea cycle intermediates previously in PS and also in AD patients’ blood and skin [24,25,37,41,46,55]. Recently, Lou et al. indicated that interleukin-17, a major driver of inflammation in PS induces alterations in urea cycle metabolite balance [56].
In conclusion, the comparison of the metabolomic profiles of AD and PS skin and sera outlined distinct patterns that were well correlated with the differences in the pathogenetic mechanisms of these two chronic inflammatory dermatoses. These differences encompassed several lipid classes, carnitines and alterations in the levels and ratios of urea cycle intermediates. In AD skin, altered lipid composition (increased SM-s) implied deficient barrier function. In PS skin, elevated PC-s denoted increased cell proliferation and acted as a potential source for inflammatory mediators. Increased ADMA and decreased ratio of Orn to Arg pointed to alterations in the urea cycle that in turn is possibly a hallmark of increased nucleic acid metabolism due to the cell proliferation. Elevated carnitine levels represented the alterations in fatty acid β-oxidation, which was also seen in the comparison of the blood sera of PS and AD patients. Elevated concentrations of AA-s and changes in the concentrations of urea cycle intermediates in PS blood sera indicated the increased need for protein synthesis in PS. As the previous findings at the cytokine levels have led to the development of biological therapy, the metabolomic studies might add valuable knowledge to the derivation of novel topical treatments and may also contribute to the better understanding of the mechanism of non-biological disease modulating medications.
4. Materials and Methods
4.1. Volunteer Recruitment
Adult patients with PS and AD and healthy controls were recruited from the Tartu University Hospital, Dermatology Clinic and Traumatology and Orthopaedics Clinic between 2013 and 2015 (Table 3). Inclusion criterium was the diagnosis of PS or AD. Skin biopsies from 15 patients with AD (4 men, 11 women, ages 20–50), 20 patients with PS (13 men, 7 women, ages 20–75, median PASI 7.7) and 17 controls (10 men, 7 women, ages 23–75) were collected. The AD and PS biopsies were collected during the acute phase of the disease. For the blood serum analysis, 25 patients with AD (6 men, 19 women, ages 19–54), 55 patients with PS (37 men, 18 women, ages 20–75, median PASI 9) and 63 controls (37 men, 26 women, ages 23–75) were recruited. All participants were Caucasians of Eastern European descent. Exclusion criteria for the patients and controls were any other concomitant skin disease, hypertension, diabetes, gout and regular medication intake.
Table 3.
Clinical and demographic characteristics of the patients’ cohorts.
4.2. Skin Biopsies
Three millimeter punch biopsies were taken from the lesional skin and adjacent (1–2 cm from lesions) non-lesional skin from the upper arm and torso of patients with AD and PS, as well as from similar locations of non-sun-exposed skin of controls. Subsequently, skin samples were frozen immediately in liquid nitrogen and stored at −80 °C until needed. The period for collecting the samples was 3 years, after which metabolites were extracted and samples were lyophilized and stored at −80 °C until analysis, as described previously [57]. Before the measurements, the skin samples were weighed, and a mix of 12 mL/g(sample) methanol and chloroform and 6 mL/g(sample) water was added. Steel balls (12 mm diameter) were added to the tube and milled using BulletBlender (NextAdvance). The sample was incubated for 1 h on ice, the supernatant was transferred to a clean tube and centrifuged at 16,000× g and 4 °C for 15 min. The methanol/water and chloroform phases were pipetted to separate tubes and lyophilized.
4.3. Blood Samples
Fasting blood samples were collected into 5 mL Vacutainer (REF 367614) tubes with micronized silica particles. The samples were centrifuged at 1300× g for 20 min and were left to clot for one hour at room temperature. The supernatant was aliquoted into 300 μL fractions and stored at −80 °C.
4.4. Metabolomic Analysis
For the targeted analysis of 188 metabolites and their ratios, the AbsoluteIDQ p180 kit (Biocrates Life Sciences AG, Innsbruck, Austria) was used according to the manufacturer’s instructions. For further analysis, Agilent Zorbax Eclipse XDB C18, 3.0 × 100 mm, 3.5 μm with Pre Column SecurityGuard, Phenomenex, C18, 4 × 3 mm was used on a 1260 series HPLC (Agilent, Santa Clara, CA, USA) in tandem with a QTRAP 4500 (ABSciex, Framingham, MA, USA) mass spectrometer.
Lyophilized skin samples were thawed on ice, dissolved in 85% methanol/15% water according to their previous weight (15–25 μL added solvent) and pipetted to the filter plate along with 10 μL internal standards. The samples were derivatized using phenylisothio cyanate, dried, and metabolites were extracted using 40% methanol solution in water. All reagents were HPLC grade (Sigma Aldrich, Darmstadt, Germany).
The serum samples were thawed on ice, pipetted onto a 96-well plate (10 μL per sample) and derivatized using phenylisothiocyanate. A combination of flow injection analysis and liquid chromatography through a C18 column was used to determine the concentrations of metabolites.
Author Contributions
Conceptualization, K.K., A.O. and L.I.; methodology, A.O.; software, A.O.; validation, B.K. and K.A.; formal analysis, A.O.; investigation, L.I.; resources, K.K., V.J., A.O. and M.Z.; data curation, A.O. and K.K.; writing—original draft preparation, L.I.; writing—review and editing, K.K., M.Z. and V.J.; visualization, L.I. and A.O.; supervision, U.S.; project administration, K.K.; funding acquisition, V.J., K.K., A.O. and M.Z. All authors have read and agreed to the published version of the manuscript.
Funding
This study was made possible by the funding from grant IUT20-42 from the Estonian Research Council, PRG1189 from the Estonian Research Council, SP1GVARENG from the University of Tartu, personal research grants PUT1465 (Külli Kingo), PUTJD914 (Aigar Ottas) and PRG057 (Viljar Jaks) from Estonian Research Agency as well as the European Union through the European Regional Development Fund (Project No. 2014-2020.4.01.15-0012).
Institutional Review Board Statement
The study was conducted in accordance with the Declaration of Helsinki, and approved by the Research Ethics Committee of the University of Tartu (permission number 269/T9, 17 April 2017).
Informed Consent Statement
Informed consent was obtained from all subjects involved in the study.
Data Availability Statement
All data generated or analyzed during this study are included in this published article.
Acknowledgments
The authors are grateful to all of the volunteers and Ingrid Liiman, Kadri Sikk, Aare Märtson, Katre Maasalu and Jelena Lüter for their efforts in recruiting the volunteers and collecting the samples.
Conflicts of Interest
The authors declare no conflict of interest.
References
- Griffiths, C.E.; Barker, J.N. Pathogenesis and clinical features of psoriasis. Lancet 2007, 370, 263–271. [Google Scholar] [CrossRef]
- Armstrong, A.W.; Read, C. Pathophysiology, Clinical Presentation, and Treatment of Psoriasis: A Review. JAMA 2020, 323, 1945–1960. [Google Scholar] [CrossRef]
- Puig, L. Cardiometabolic Comorbidities in Psoriasis and Psoriatic Arthritis. Int. J. Mol. Sci. 2017, 19, 58. [Google Scholar] [CrossRef]
- Tokuyama, M.; Mabuchi, T. New Treatment Addressing the Pathogenesis of Psoriasis. Int. J. Mol. Sci. 2020, 21, 7488. [Google Scholar] [CrossRef] [PubMed]
- Nestle, F.O.; Kaplan, D.H.; Barker, J. Psoriasis. N. Engl. J. Med. 2009, 361, 496. [Google Scholar] [CrossRef] [PubMed]
- Nutten, S. Atopic Dermatitis: Global Epidemiology and Risk Factors. Ann. Nutr. Metab. 2015, 66 (Suppl. S1), 8–16. [Google Scholar] [CrossRef] [PubMed]
- Sacotte, R.; Silverberg, J.I. Epidemiology of adult atopic dermatitis. Clin. Dermatol. 2018, 36, 595–605. [Google Scholar] [CrossRef] [PubMed]
- Boothe, W.D.; Tarbox, J.A.; Tarbox, M.B. Atopic Dermatitis: Pathophysiology. Adv. Exp. Med. Biol. 2017, 1027, 21–37. [Google Scholar]
- Kim, J.; Kim, B.E.; Leung, D.Y.M. Pathophysiology of atopic dermatitis: Clinical implications. Allergy Asthma Proc. 2019, 40, 84–92. [Google Scholar] [CrossRef] [PubMed]
- Langan, S.M.; Irvine, A.D.; Weidinger, S. Atopic dermatitis. Lancet 2020, 396, 345–360. [Google Scholar] [CrossRef]
- Noda, S.; Suárez-Fariñas, M.; Ungar, B.; Kim, S.J.; de Guzman Strong, C.; Xu, H.; Peng, X.; Estrada, Y.D.; Nakajima, S.; Honda, T.; et al. The Asian atopic dermatitis phenotype combines features of atopic dermatitis and psoriasis with increased TH17 polarization. J. Allergy Clin. Immunol. 2015, 136, 1254–1264. [Google Scholar] [CrossRef] [PubMed]
- Barr, R.M.; Wong, E.; Mallet, A.I.; Olins, L.A.; Greaves, M.W. The analysis of arachidonic acid metabolites in normal, uninvolved and lesional psoriatic skin. Prostaglandins 1984, 28, 57–65. [Google Scholar] [CrossRef]
- Brain, S.; Camp, R.; Derm, F.F.; Dowd, P.; Black, A.K.; Greaves, M. The Release of Leukotriene B4-like Material in Biologically Active Amounts from the Lesional Skin of patients with Psoriasis. J. Investig. Dermatol. 1984, 83, 70. [Google Scholar] [CrossRef]
- Hammarström, S.; Hamberg, M.; Samuelsson, B.; Duell, E.A.; Stawiski, M.; Voorhees, J.J. Increased concentrations of nonesterified arachidonic acid, 12L-hydroxy-5,8,10,14-eicosatetraenoic acid, prostaglandin E2, and prostaglandin F2alpha in epidermis of psoriasis. Proc. Natl. Acad. Sci. USA 1975, 72, 5130–5134. [Google Scholar] [CrossRef] [PubMed]
- Sorokin, A.V.; Domenichiello, A.F.; Dey, A.K.; Yuan, Z.-X.; Goyal, A.; Rose, S.M.; Playford, M.P.; Ramsden, C.E.; Mehta, N.N. Bioactive Lipid Mediator Profiles in Human Psoriasis Skin and Blood. J. Investig. Dermatol. 2018, 138, 1518–1528. [Google Scholar] [CrossRef] [PubMed]
- Sitter, B.; Johnsson, M.K.; Halgunset, J.; Bathen, T.F. Metabolic changes in psoriatic skin under topical corticosteroid treatment. BMC Dermatol. 2013, 13, 8. [Google Scholar] [CrossRef]
- Armstrong, A.W.; Wu, J.; Johnson, M.A.; Grapov, D.; Azizi, B.; Dhillon, J.; Fiehn, O. Metabolomics in psoriatic disease: Pilot study reveals metabolite differences in psoriasis and psoriatic arthritis. F1000Research 2014, 3, 248. [Google Scholar] [CrossRef]
- Chen, C.; Hou, G.; Zeng, C.; Ren, Y.; Chen, X.; Peng, C. Metabolomic profiling reveals amino acid and carnitine alterations as metabolic signatures in psoriasis. Theranostics 2021, 11, 754–767. [Google Scholar] [CrossRef]
- Zeng, C.; Wen, B.; Hou, G.; Lei, L.; Mei, Z.; Jia, X.; Chen, X.; Zhu, W.; Li, J.; Kuang, Y.; et al. Lipidomics profiling reveals the role of glycerophospholipid metabolism in psoriasis. GigaScience 2017, 6, 1–11. [Google Scholar] [CrossRef]
- Berdyshev, E.; Goleva, E.; Bronova, I.; Dyjack, N.; Rios, C.; Jung, J.; Taylor, P.; Jeong, M.; Hall, C.F.; Richers, B.N.; et al. Lipid abnormalities in atopic skin are driven by type 2 cytokines. JCI Insight 2018, 3, e98006. [Google Scholar] [CrossRef]
- Huang, Y.; Chen, G.; Liu, X.; Shao, Y.; Gao, P.; Xin, C.; Cui, Z.; Zhao, X.; Xu, G. Serum Metabolomics Study and Eicosanoid Analysis of Childhood Atopic Dermatitis Based on Liquid Chromatography-Mass Spectrometry. J. Proteome Res. 2014, 13, 5715–5723. [Google Scholar] [CrossRef] [PubMed]
- Assfalg, M.; Bortoletti, E.; D’Onofrio, M.; Pigozzi, R.; Molinari, H.; Boner, A.; Peroni, D.; Piacentini, G. An exploratory 1H-nuclear magnetic resonance metabolomics study reveals altered urine spectral profiles in infants with atopic dermatitis. Br. J. Dermatol. 2011, 166, 1123–1125. [Google Scholar] [CrossRef] [PubMed]
- R Core Team. R: A Language and Environment for Statistical Computing. 2018. Available online: https://www.R-project.org/ (accessed on 21 April 2021).
- Ilves, L.; Ottas, A.; Kaldvee, B.; Abram, K.; Soomets, U.; Zilmer, M.; Jaks, V.; Kingo, K. Metabolomic Analysis of Skin Biopsies from Patients with Atopic Dermatitis Reveals Hallmarks of Inflammation, Disrupted Barrier Function and Oxidative Stress. Acta Derm. Venereol. 2021, 101, adv00407. [Google Scholar] [CrossRef] [PubMed]
- Pohla, L.; Ottas, A.; Kaldvee, B.; Abram, K.; Soomets, U.; Zilmer, M.; Reemann, P.; Jaks, V.; Kingo, K. Hyperproliferation is the main driver of metabolomic changes in psoriasis lesional skin. Sci. Rep. 2020, 10, 3081. [Google Scholar] [CrossRef]
- Choi, M.J.; Maibach, H.I. Role of Ceramides in Barrier Function of Healthy and Diseased Skin. Am. J. Clin. Dermatol. 2005, 6, 215–223. [Google Scholar] [CrossRef] [PubMed]
- Hara, J.; Higuchi, K.; Okamoto, R.; Kawashima, M.; Imokawa, G. High-Expression of Sphingomyelin Deacylase is an Important Determinant of Ceramide Deficiency Leading to Barrier Disruption in Atopic Dermatitis1. J. Investig. Dermatol. 2000, 115, 406–413. [Google Scholar] [CrossRef]
- Imokawa, G.; Hattori, M. A possible function of structural lipids in the water-holding properties of the stratum corneum. J. Investig. Dermatol. 1985, 84, 282–284. [Google Scholar] [CrossRef] [PubMed]
- Imokawa, G.; Abe, A.; Jin, K.; Higaki, Y.; Kawashima, M.; Hidano, A. Decreased level of ceramides in stratum corneum of atopic dermatitis: An etiologic factor in atopic dry skin? J. Investig. Dermatol. 1991, 96, 523–526. [Google Scholar] [CrossRef]
- Van Smeden, J.; Bouwstra, J. Stratum Corneum Lipids: Their Role for the Skin Barrier Function in Healthy Subjects and Atopic Dermatitis Patients. Curr. Probl. Dermatol. 2016, 49, 8–26. [Google Scholar]
- Maceyka, M.; Spiegel, S. Sphingolipid metabolites in inflammatory disease. Nature 2014, 510, 58–67. [Google Scholar] [CrossRef]
- Gibellini, F.; Smith, T.K. The Kennedy pathway-De novo synthesis of phosphatidylethanolamine and phosphatidylcholine. IUBMB Life 2010, 62, 414–428. [Google Scholar] [CrossRef] [PubMed]
- Hannun, Y.A.; Luberto, C.; Argraves, K.M. Enzymes of Sphingolipid Metabolism: From Modular to Integrative Signaling. Biochemistry 2001, 40, 4893–4903. [Google Scholar] [CrossRef]
- Imokawa, G. A possible mechanism underlying the ceramide deficiency in atopic dermatitis: Expression of a deacylase enzyme that cleaves the N-acyl linkage of sphingomyelin and glucosylceramide. J. Dermatol. Sci. 2009, 55, 1–9. [Google Scholar] [CrossRef] [PubMed]
- Jensen, J.-M.; Fölster-Holst, R.; Baranowsky, A.; Schunck, M.; Winoto-Morbach, S.; Neumann, C.; Schütze, S.; Proksch, E. Impaired Sphingomyelinase Activity and Epidermal Differentiation in Atopic Dermatitis. J. Investig. Dermatol. 2004, 122, 1423–1431. [Google Scholar] [CrossRef]
- Sawada, E.; Yoshida, N.; Sugiura, A.; Imokawa, G. Th1 cytokines accentuate but Th2 cytokines attenuate ceramide production in the stratum corneum of human epidermal equivalents: An implication for the disrupted barrier mechanism in atopic dermatitis. J. Dermatol. Sci. 2012, 68, 25–35. [Google Scholar] [CrossRef]
- Dutkiewicz, E.P.; Hsieh, K.T.; Wang, Y.S.; Chiu, H.Y.; Urban, P.L. Hydrogel Micropatch and Mass Spectrometry—Assisted Screening for Psoriasis-Related Skin Metabolites. Clin. Chem. 2016, 62, 1120–1128. [Google Scholar] [CrossRef]
- Furse, S.; de Kroon, A.I.P.M. Phosphatidylcholine’s functions beyond that of a membrane brick. Mol. Membr. Biol. 2015, 32, 117–119. [Google Scholar] [CrossRef]
- Chen, Y.; Cao, Y. The sphingomyelin synthase family: Proteins, diseases, and inhibitors. Biol. Chem. 2017, 398, 1319–1325. [Google Scholar] [CrossRef]
- Liu, P.; Zhu, W.; Chen, C.; Yan, B.; Zhu, L.; Chen, X.; Peng, C. The mechanisms of lysophosphatidylcholine in the development of diseases. Life Sci. 2020, 247, 117443. [Google Scholar] [CrossRef]
- Bilgic, O.; Altinyazar, H.C.; Baran, H.; Unlu, A. Serum homocysteine, asymmetric dimethyl arginine (ADMA) and other arginine-NO pathway metabolite levels in patients with psoriasis. Arch. Dermatol. Res. 2015, 307, 439–444. [Google Scholar] [CrossRef]
- Dowsett, L.; Higgins, E.; Alanazi, S.; Alshuwayer, N.A.; Leiper, F.C.; Leiper, J. ADMA: A Key Player in the Relationship between Vascular Dysfunction and Inflammation in Atherosclerosis. J. Clin. Med. 2020, 9, 3026. [Google Scholar] [CrossRef]
- Mangiacapra, F.; Conte, M.; Demartini, C.; Muller, O.; Delrue, L.; Dierickx, K.; Di Sciascio, G.; Trimarco, B.; De Bruyne, B.; Wijns, W.; et al. Relationship of asymmetric dimethylarginine (ADMA) with extent and functional severity of coronary atherosclerosis. Int. J. Cardiol. 2016, 220, 629–633. [Google Scholar] [CrossRef] [PubMed]
- Mehta, N.N.; Azfar, R.S.; Shin, D.B.; Neimann, A.L.; Troxel, A.B.; Gelfand, J.M. Patients with severe psoriasis are at increased risk of cardiovascular mortality: Cohort study using the General Practice Research Database. Eur. Heart J. 2010, 31, 1000–1006. [Google Scholar] [CrossRef]
- Reuter, S.E.; Evans, A.M. Carnitine and Acylcarnitines: Pharmacokinetic, Pharmacological and Clinical Aspects. Clin. Pharm. 2012, 51, 553–572. [Google Scholar] [CrossRef]
- Ottas, A.; Fishman, D.; Okas, T.L.; Kingo, K.; Soomets, U. The metabolic analysis of psoriasis identifies the associated metabolites while providing computational models for the monitoring of the disease. Arch. Dermatol. Res. 2017, 309, 519–528. [Google Scholar] [CrossRef]
- Ottas, A.; Fishman, D.; Okas, T.-L.; Püssa, T.; Toomik, P.; Martson, A.; Kingo, K.; Soomets, U. Blood serum metabolome of atopic dermatitis: Altered energy cycle and the markers of systemic inflammation. PLoS ONE 2017, 12, e0188580. [Google Scholar] [CrossRef] [PubMed]
- Brosnan, J.T.; Brosnan, M.E. Glutamate: A truly functional amino acid. Amino Acids 2013, 45, 413–418. [Google Scholar] [CrossRef] [PubMed]
- Gaggini, M.; Carli, F.; Bugianesi, E.; Gastaldelli, A.; Rosso, C.; Buzzigoli, E.; Marietti, M.; Della Latta, V.; Ciociaro, D.; Abate, M.L.; et al. Altered amino acid concentrations in NAFLD: Impact of obesity and insulin resistance. Hepatology 2018, 67, 145–158. [Google Scholar] [CrossRef]
- Takeshita, J.; Grewal, S.; Langan, S.M.; Mehta, N.N.; Ogdie, A.; Van Voorhees, A.S.; Gelfand, J.M. Psoriasis and comorbid diseases: Implications for management. J. Am. Acad. Dermatol. 2017, 76, 393–403. [Google Scholar] [CrossRef]
- Lehn-Stefan, A.; Peter, A.; Machann, J.; Schick, F.; Randrianarisoa, E.; Heni, M.; Wagner, R.; Birkenfeld, A.L.; Fritsche, A.; Häring, H.-U.; et al. Elevated Circulating Glutamate Is Associated with Subclinical Atherosclerosis Independently of Established Risk Markers: A Cross-Sectional Study. J. Clin. Endocrinol. Metab. 2021, 106, e982–e989. [Google Scholar] [CrossRef]
- KEGG PATHWAY: Arginine and Proline Metabolism—Homo Sapiens. Available online: https://www.genome.jp/kegg/pathway/map/hsa00330.html (accessed on 10 June 2021).
- Kang, H.; Li, X.; Zhou, Q.; Quan, C.; Xue, F.; Zheng, J.; Yu, Y. Exploration of candidate biomarkers for human psoriasis based on gas chromatography-mass spectrometry serum metabolomics. Br. J. Dermatol. 2017, 176, 713–722. [Google Scholar] [CrossRef]
- Kamleh, M.A.; Snowden, S.G.; Grapov, D.; Blackburn, G.J.; Watson, D.G.; Xu, N.; Ståhle, M.; Wheelock, C.E. LC-MS Metabolomics of Psoriasis Patients Reveals Disease Severity-Dependent Increases in Circulating Amino Acids That Are Ameliorated by Anti-TNFα Treatment. J. Proteome Res. 2014, 14, 557–566. [Google Scholar] [CrossRef] [PubMed]
- Hussain, H.; Neubert, R.H.H.; Ziegler, J.; Hause, G.; Wohlrab, J. Quantitative Analysis of Free Amino Acids and Urea Derived from Isolated Corneocytes of Healthy Young, Healthy Aged, and Diseased Skin. Skin Pharmacol. Physiol. 2019, 32, 94–100. [Google Scholar] [CrossRef] [PubMed]
- Lou, F.; Sun, Y.; Xu, Z.; Niu, L.; Wang, Z.; Deng, S.; Liu, Z.; Zhou, H.; Bai, J.; Yin, Q.; et al. Excessive Polyamine Generation in Keratinocytes Promotes Self-RNA Sensing by Dendritic Cells in Psoriasis. Immunity 2020, 53, 204–216. [Google Scholar] [CrossRef] [PubMed]
- Álvarez-Sánchez, B.; Priego-Capote, F.; Luque de Castro, M.D. Metabolomics analysis I. Selection of biological samples and practical aspects preceding sample preparation. Trends Anal. Chem. 2010, 29, 111–119. [Google Scholar] [CrossRef]

Publisher’s Note: MDPI stays neutral with regard to jurisdictional claims in published maps and institutional affiliations. |
© 2022 by the authors. Licensee MDPI, Basel, Switzerland. This article is an open access article distributed under the terms and conditions of the Creative Commons Attribution (CC BY) license (https://creativecommons.org/licenses/by/4.0/).