Article

Selection and Validation of Reference Genes for Quantitative Real-Time PCR Analysis of Development and Tissue-Dependent Flower Color Formation in Cymbidium lowianum

1
Key Laboratory of Economic Plants and Biotechnology, Kunming Institute of Botany, Chinese Academy of Sciences, 132# Lanhei Road, Kunming 650201, China
2
Yunnan Key Laboratory for Wild Plant Resources, 132# Lanhei Road, Kunming 650201, China
*
Author to whom correspondence should be addressed.
Int. J. Mol. Sci. 2022, 23(2), 738; https://doi.org/10.3390/ijms23020738
Submission received: 25 October 2021 / Revised: 31 December 2021 / Accepted: 7 January 2022 / Published: 10 January 2022
(This article belongs to the Section Molecular Plant Sciences)

Abstract

:
The development and tissue-dependent color formation of the horticultural plant results in various color pattern flowers. Anthocyanins and carotenoids contribute to the red and yellow colors, respectively. In this study, quantitative real-time polymerase chain reaction (qRT-PCR) is used to analyze the expression profiles of anthocyanin and carotenoids biosynthesis genes in Cymbidium lowianum (Rchb.f.) Rchb.f. Appropriate reference gene selection and validation are required before normalization of gene expression in qRT-PCR analysis. Thus, we firstly selected 12 candidate reference genes from transcriptome data, and used geNorm and Normfinder to evaluate their expression stability in lip (divided into abaxial and adaxial), petal, and sepal of the bud and flower of C. lowianum. Our results show that the two most stable reference genes in different tissues of C. lowianum bud and flower are EF1δ and 60S, the most unstable reference gene is 26S. The expression profiles of the CHS and BCH genes were similar to FPKM value profiles after normalization to the two most stable reference genes, EF1δ and 60S, with the upregulated CHS and BCH expression in flower stage, indicating that the ABP and CBP were activated across the stages of flower development. However, when the most unstable reference gene, 26S, was used to normalize the qRT-PCR data, the expression profiles of CHS and BCH differed from FPKM value profiles, indicating the necessity of selecting stable reference genes. Moreover, CHS and BCH expression was highest in the abaxial lip and adaxial lip, respectively, indicating that the ABP and CBP were activated in abaxial and adaxial lip, respectively, resulting in a presence of red or yellow segments in abaxial and adaxial lip. This study is the first to provide reference genes in C. lowianum, and also provide useful information for studies that aim to understand the molecular mechanisms of flower color formation in C. lowianum.

1. Introduction

Flower color is a pivotal plant phenotype for ornamentation and population diversity [1,2]. Accordingly, investigating the formation of flower color is key to understand the evolution of color variation in plant populations and may facilitate ornamental plant breeding [3,4]. Cymbidium lowianum (Rchb.f.) Rchb.f. (Orchidaceae) is an important ornamental plant that possess flowers with a deep red V-shape on the abaxial lip in flower stage [5,6]. Moreover, in the bud stage, the color of sepal and petal are green (Figure 1A). In the flower stage, sepal and petal turned yellow green, and reddish brown on some longitudinal veins (Figure 1B). However, the molecular mechanisms of flower color formation in C. lowianum remains unclear. Gene expression analysis is fundamental to understanding gene function and the molecular mechanisms of developmental processes [7].
Quantitative real-time polymerase chain reaction (qRT-PCR) is one of the most common and important tools in the detection of gene expression due to its high sensitivity, accuracy and reliability [8]. The reliability and accuracy of qRT-PCR largely depend on the stability of reference genes, and the specificity of reference gene primer pairs [9]. Thus, the selection of appropriate reference genes and design of specific primers are prerequisites for ensuring the accuracy of qRT-PCR results [10]. Housekeeping genes are often used as standardized reference genes, but the expression of many housekeeping genes varies greatly in different tissues, different species, and under different environmental conditions [7,11,12,13,14,15,16].
To date, qRT-PCR reference genes have been identified in many plants, and have been used to analyze changes in gene expression during development and in response to environmental stimuli. For example, over the past 10 years, stable reference genes for plant developmental analysis have been identified in Agaricus blazei [15], Euscaphis konishii [17], Gentiana macrophylla [18], chrysanthemums [12,13], Chinese wolfberry [19], Solanum melongena L [20], maize [21], and Eremosparton songoricum [22]. Similarly, stable reference genes have been identified to analyze changes in gene expression changes in response to abiotic and biotic stresses in Suaeda glauca [16], maize [23], Isatis indigotica [24], Lolium multiflorum [25], Brassica napus [26], and lettuce [27]. Stable reference genes have yet to be reported for orchids, including C. lowianum. Furthermore, these studies indicate that stable reference genes may differ in plant species and when examining different abiotic stresses.
Plant genome and transcriptome sequences have been used to select candidate reference genes in a wide variety of plants, including Agaricus blazei [15], Euscaphis konishii [24], Stellera chamaejasme [28], Lolium perenne [29], Arabidopsis thaliana [30], and Solanum lycopersicum [31]. The C. lowianum genome has yet to be sequenced, although the chloroplast genome has recently been sequenced. Furthermore, morphological and phylogenetic analyses revealed a close relationship between C. lowianum and C. tracyanum [6]. Our team has sequenced and assembled the genome of C. tracyanum (unpublished), and found that reads of C. lowianum transcriptome data could map 85.76–90.94% to the genome of C. tracyanum, indicating a close relationship between them at the whole genome level. These findings suggest it is feasible to select reference genes from C. lowianum RNA sequencing data.
In this study, we selected 12 candidate reference genes (ACT7, ACTF11, ATP, EF1δ, EIF, MADH, RAD23d, g-TUB, UBC, 26S, 40S, and 60S) according to their expression in C. lowianum transcriptome data. We then used geNorm [32] and NormFinder [33] to validate the appropriateness of these candidate reference genes for qRT-PCR analysis of gene expression. Finally, we detected the expression profiles of chalcone synthase (CHS) and β-carotene hydroxylase (BCH), structural genes of anthocyanin and carotenoid biosynthesis pathways (ABP and CBP) [34,35] in different flower tissues across the stages of flower development in C. lowianum.

2. Results

2.1. Selection of Candidate Reference Genes Based on Transcriptome Data

To obtain appropriate reference genes in C. lowianum, we firstly searched transcriptome data for genes without significant difference in expression in tissues (abaxial lip, adaxial lip, petal, and sepal) at two stages of flower development (bud and flower) (Figure 1). In order to obtain accuracy results in qRT-PCR analysis, the Cq value of reference genes should range from 20 to 30 [36]. Based on our experience, when the FPKM values of genes are about 100 in the samples, the Cq values range from 20 to 30 in qRT-PCR analysis following the protocol in the present methods. Thus, we searched C. lowianum transcriptome data for genes that showed FPKM values of ~100, and identified 10 candidate reference genes. The common housekeeping genes, ACT and TUB, were not among these candidates; a subsequent search for ACT and TUB in transcriptome data identified ACT7 and g-TUB, which had the most stable expression among the homologues of ACT and TUB. Thus, the total number of candidate reference genes for further study was 12 (Table S1).

2.2. Primer Specificity and Amplification Efficiency Test of Candidate Reference Genes

The specificity and amplification efficiency of primer sets for each candidate reference genes were tested by RT-PCR and qRT-PCR analysis. The gene names, descriptions, primer sequences, amplicon length, amplification efficiencies, and R2 are given in Table 1. In RT-PCR analysis, only 10 candidate reference genes showed a single band in 2.0% agarose gel; EIF and RAD23d had no band in the agarose gel (Figure S1). Thus, we excluded EIF and RAD23d from further qRT-PCR analyses. The specificity for each primer set was also validated by the melting curves of qRT-PCR. For all primer sets, the melting curve showed a single amplification peak (Figure S2), indicating that the primers were highly specific.
For amplification efficiency analysis, five gradients (1, 1/5, 1/25, 1/125, and 1/625) of mixed cDNA of all samples were used for qRT-PCR to produce standard curves, and calculate the amplification efficiency (E) (E = 10−1/k − 1). The abscissa of the standard curves are log10 (1, 1/5, 1/25, 1/125, and 1/625), the ordinate of the standard curves were the corresponding cycle threshold (Cq) values, k indicates slope factor of the standard curves, R2 indicates correlation coefficients (Figure S3). As shown in Table 1, the amplification efficiency of qRT-PCR for all 10 candidate reference genes ranged from 88.58% (ACT7) to 158.30 (ACTF11), and R2 ranged from 0.8844 (ACTF11) to 0.9999 (40S).

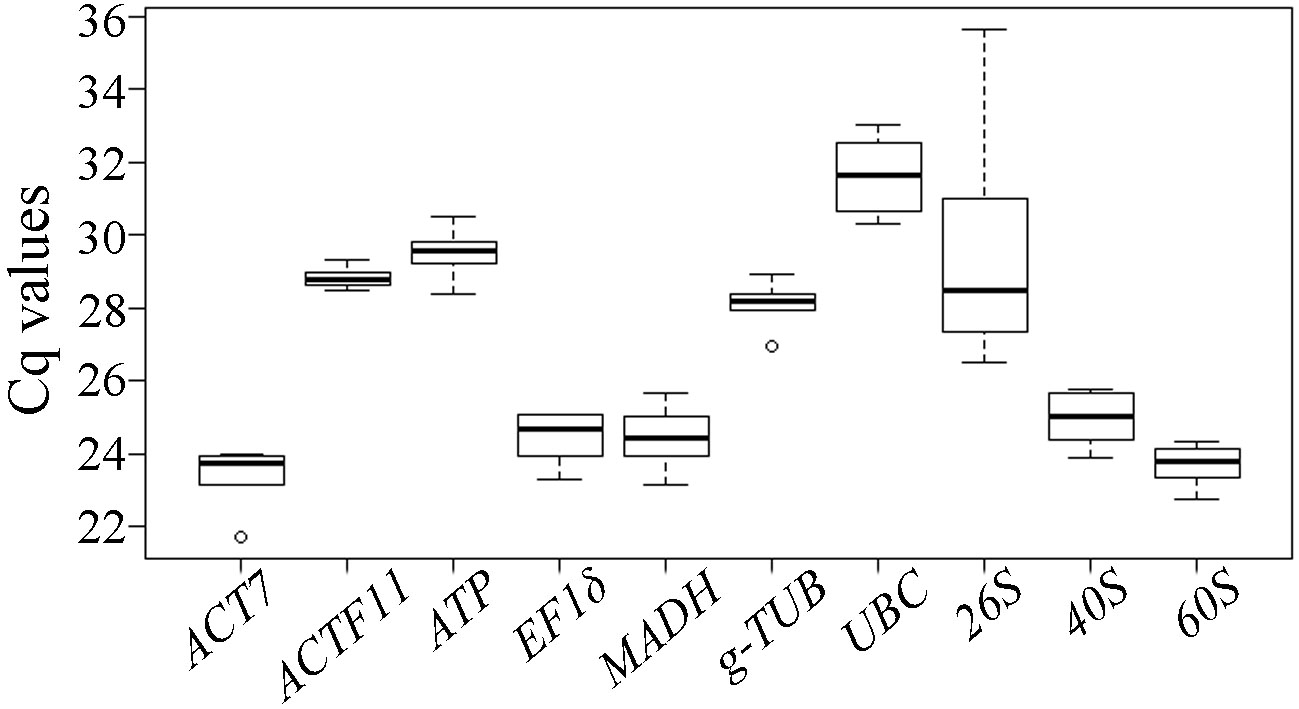
2.3. Expression Profiles of Candidate Reference Genes

The expression profiles are represented by Cq values of the candidate reference genes in different samples. The Cq values of the 10 candidate reference genes were detected by qRT-PCR. As shown in Figure 2, the expression levels across all investigated samples showed variation among the candidate reference genes. The Cq values of the 10 candidate reference genes displayed a wide range from 21.70 (ACT7) to 33.03 (UBC) in all samples, and mean Cq ranged from 23.42 (ACT7) to 31.62 (UBC), indicating that ACT7 had the highest expression level, whereas UBC had the lowest expression level in the samples. In addition, 26S expression levels were the most variable with 9.17 Cq; ACTF11 showed the least variable levels with 0.84 Cq.

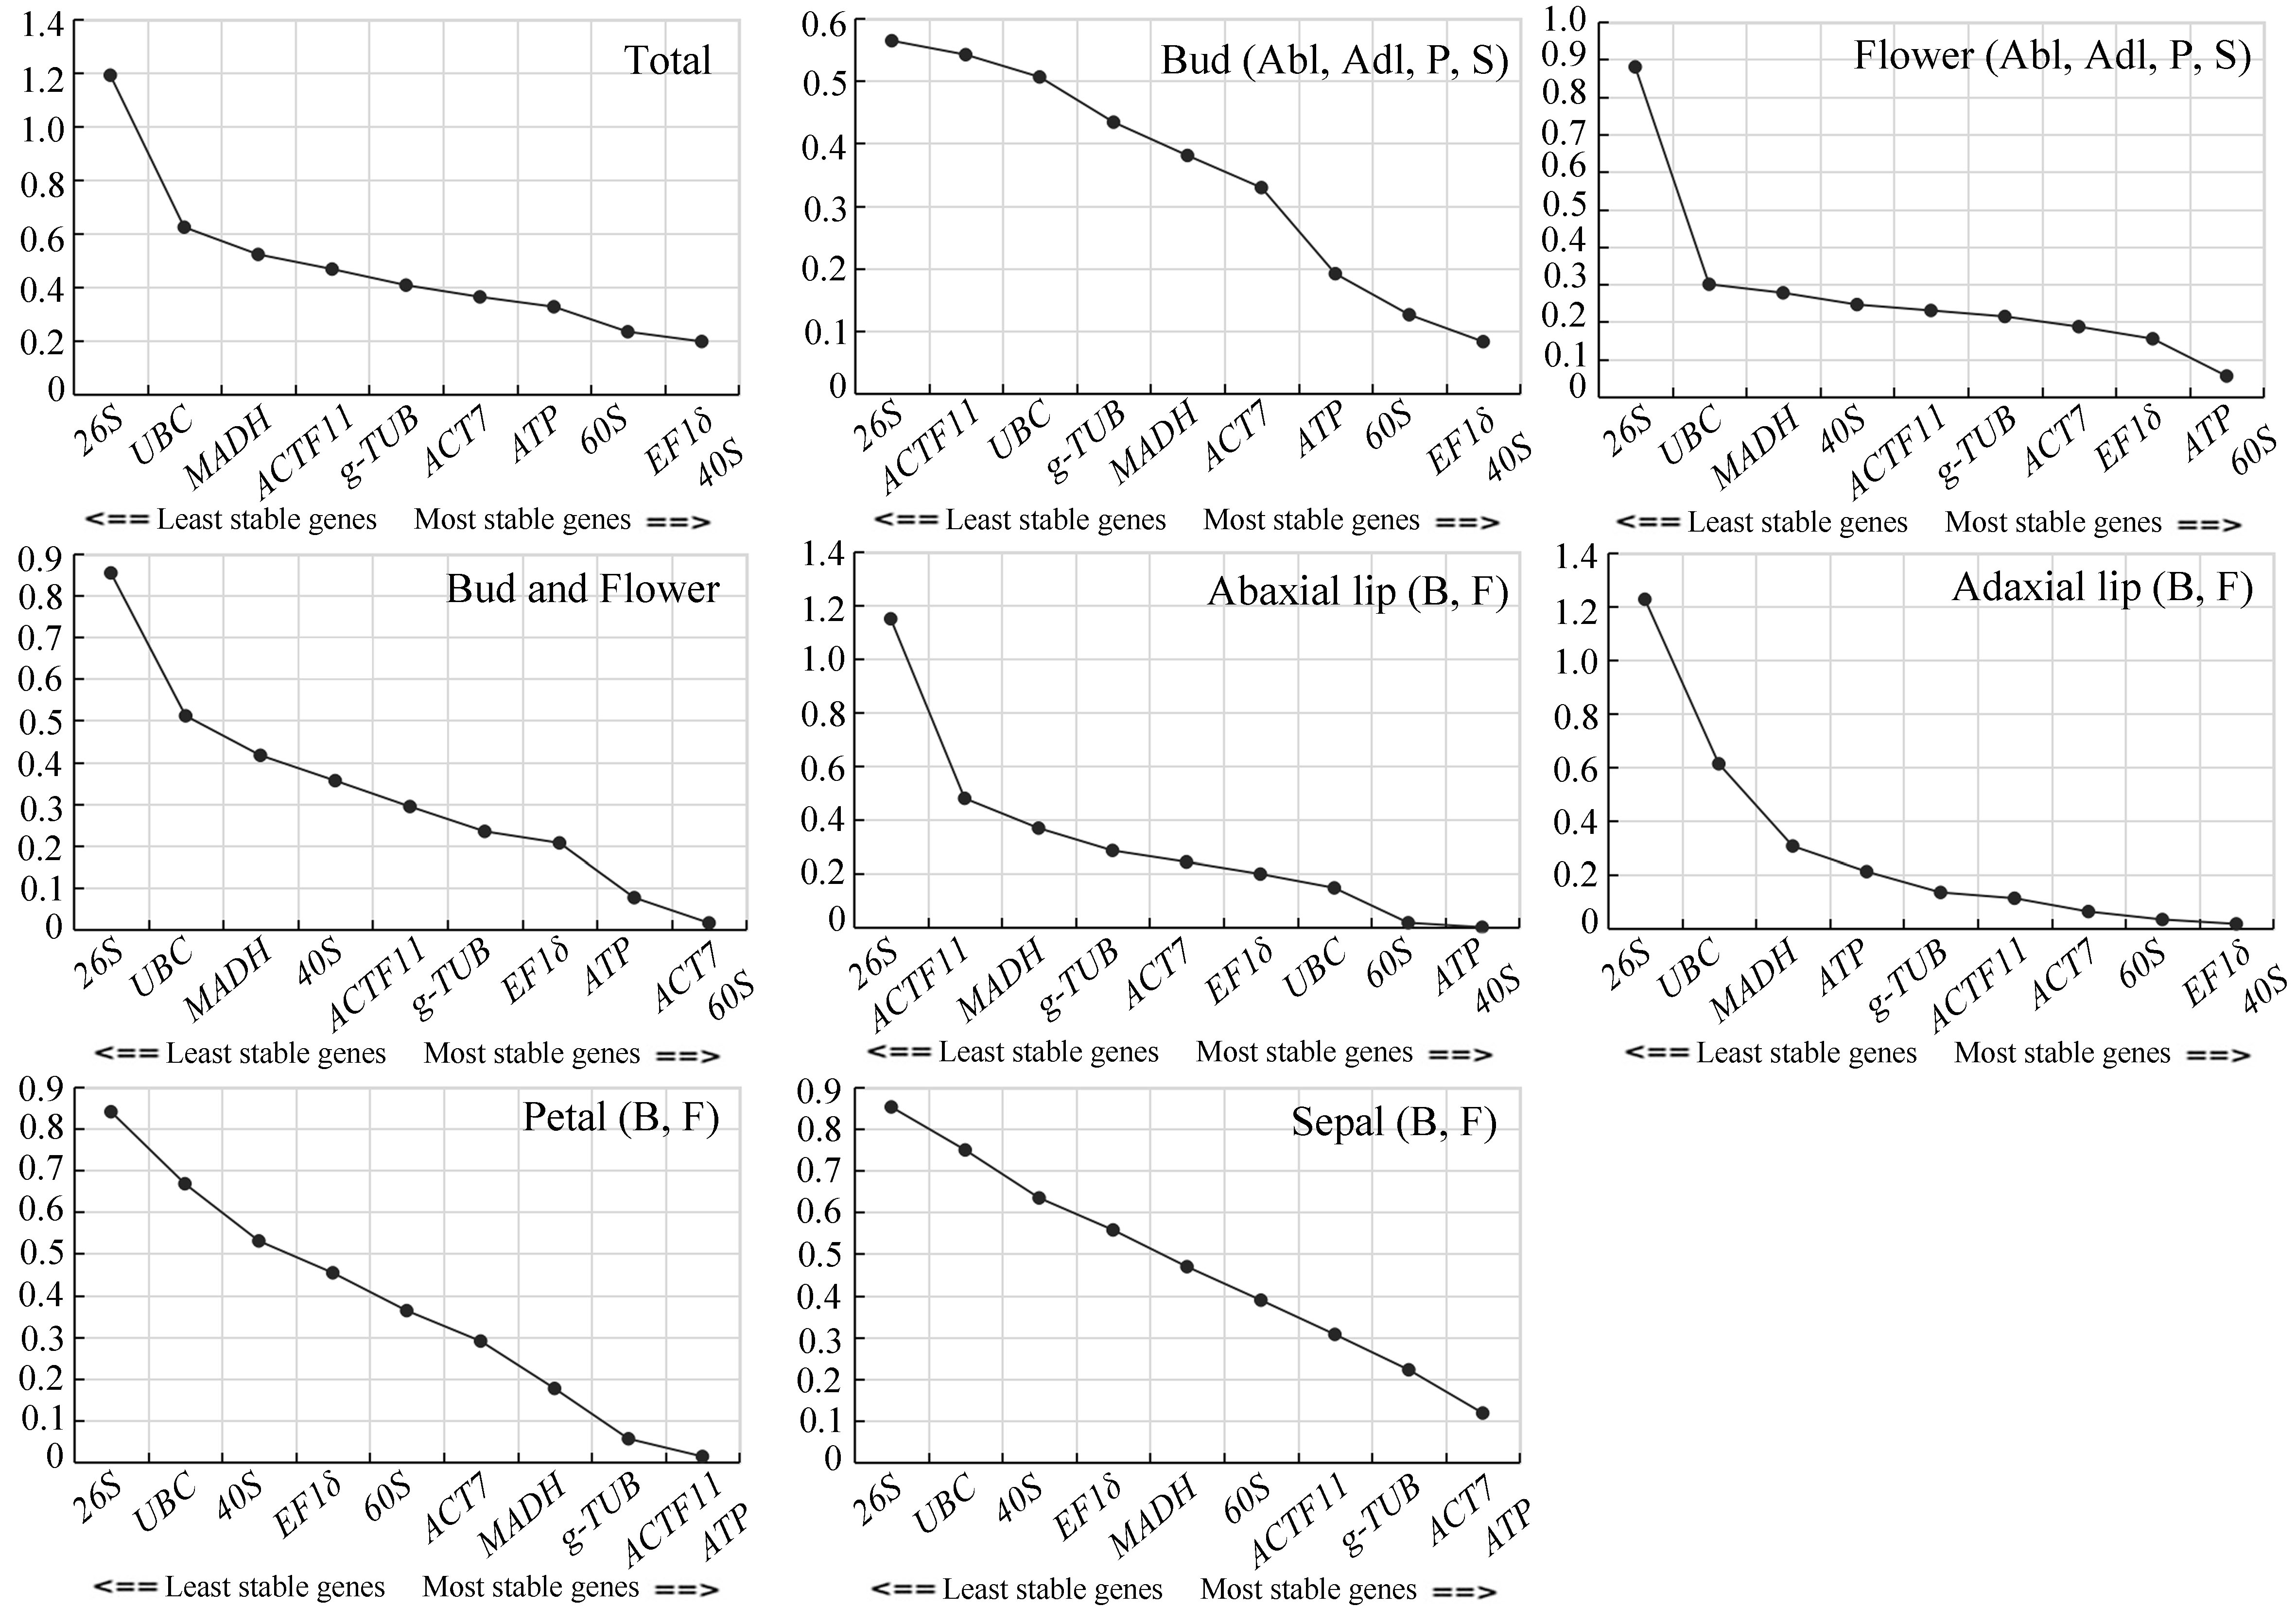
2.4. Expression Stability of Candidate Reference Genes

After the above qRT-PCR assays, we used geNorm and NormFinder to evaluate the expression stability of the 10 candidate reference genes. To identify reference genes that can be used to examine gene expression changes in diverse tissues, we evaluated the stability of candidate reference gene expression in several tissues at the same stage of development, i.e., in the abaxial lip, adaxial lip, petal, and sepal of the bud; and in the abaxial lip, adaxial lip, petal, and sepal of the flower (tissue-dependent group). To identify reference genes that can be used to examine gene expression changes in whole flower across developmental stages, we evaluated the stability of candidate reference gene expression in the bud and flowering stages. To identify reference genes that can be used to examine gene expression changes in a single tissue across developmental stages, we evaluated the stability of candidate reference gene expression in each individual tissue across developmental stages, i.e., abaxial lip of bud and flower; adaxial lip of bud and flower petal of bud and flower; sepal of bud and flower; and all tissues of bud and flower (development-dependent group).

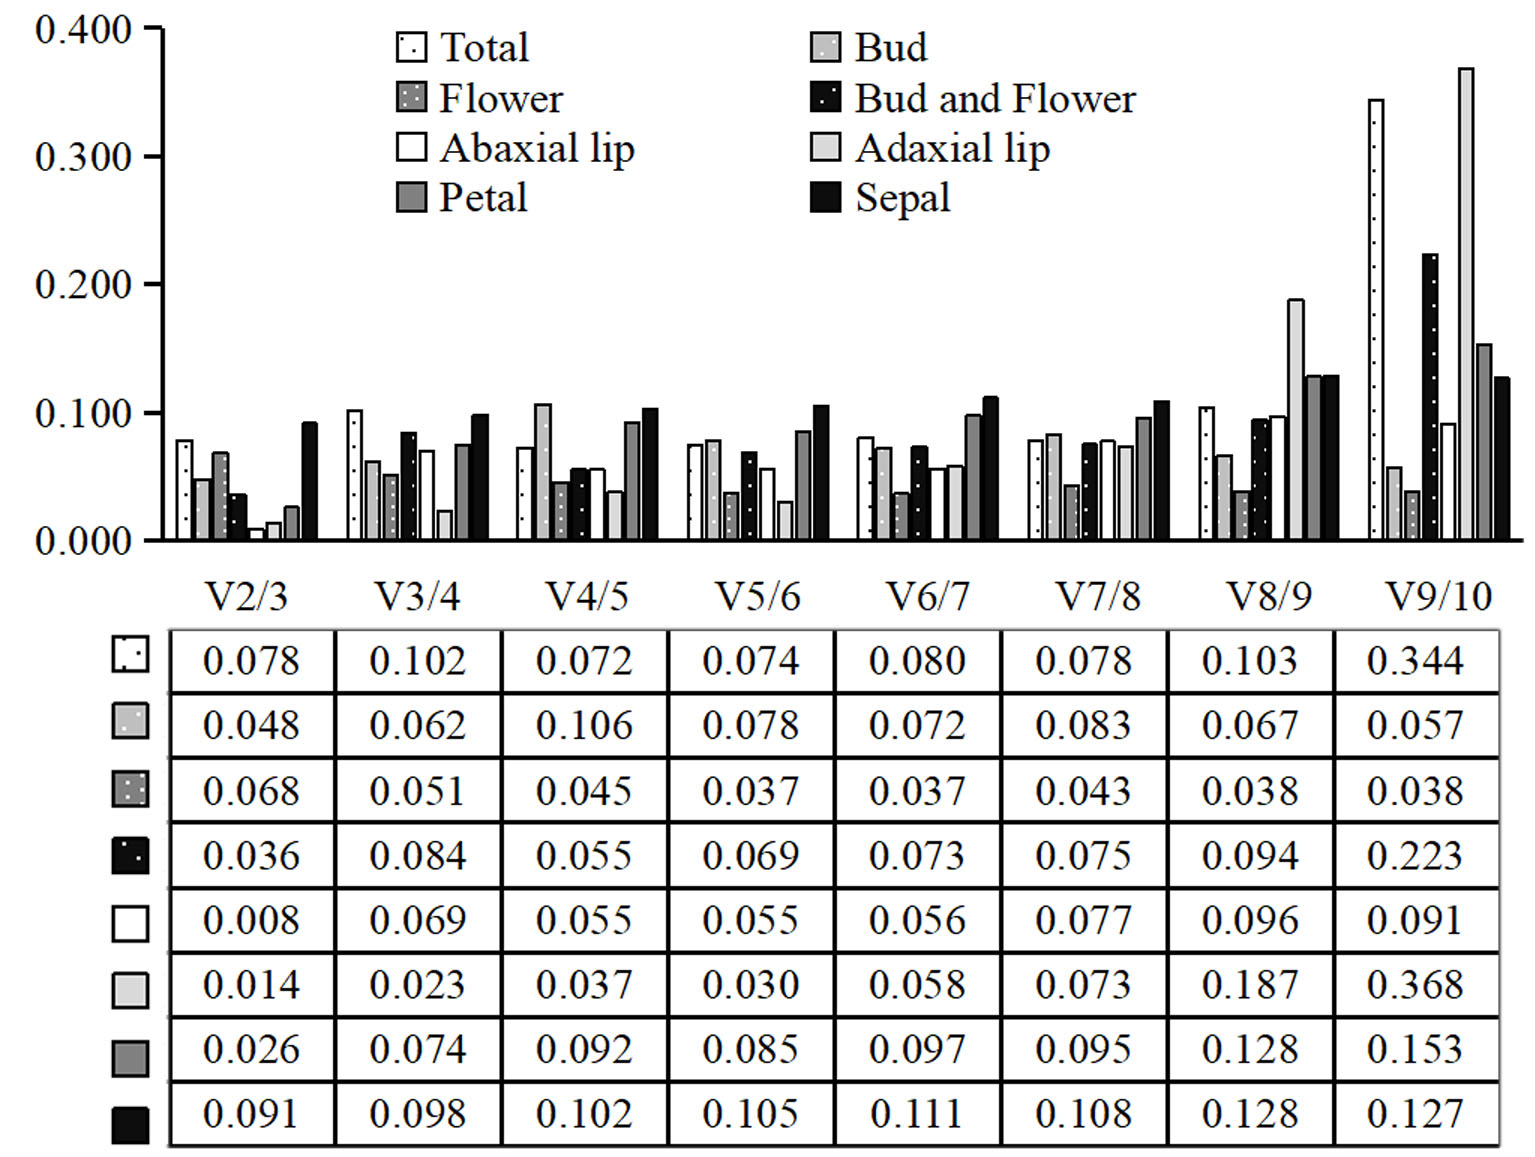
2.4.1. geNorm Analysis

The gene expression values were evaluated by M value in geNorm analysis, with the default limit value of 1.5, lower M value indicated greater gene expression stability [5]. The results of geNorm analyses are shown in Figure 3. The three genes with the most stable expression across multiple tissues and developmental stages were 60S, EF1δ, and 40S. These three genes also had the most stable expression in the bud stage; however, in the flowering stage, the genes with the most stable expression were EF1δ, ATP, and 60S. The candidate reference genes with the most stable expression differed in different tissues across developmental stages. For instance, in the whole bud and flower, the three genes with the most stable expression were ATP, ACT7, and 60S. In the abaxial lip, it was 60S, ATP, and 40S; in the adaxial lip, 60S, EF1δ, and 40S; in the petal, g-TUB, ACTF11, and ATP; and in the sepal, g-TUB, ACT7, and ATP. We also used geNorm to calculate the optimal number of reference genes required for normalization in different groups. The V2/3 values for all the different groups were below the threshold 0.15, indicating that two reference genes were enough to normalize qRT-PCR data (Figure 4). Therefore, combining the M values and Vn/n+1 values given by geNorm, we found that EF1δ/40S and 60S were the most stable genes amongst all samples, EF1δ/40S and 60S were the most stable genes in all tissues of the bud stage, and ATP/60S and EF1δ were the most stable genes in all tissues of the flower stage. Together, in the tissue-dependent group, the most stable genes were EF1δ and 60S. In the development-dependent group, ACT7/60S and ATP were the most stable genes in the whole bud and flower; ATP/40S and 60S, EF1δ/40S and 60S, ACTF11/ATP and g-TUB, and ACT7/ATP and g-TUB were the most stably expressed combinations in abaxial lip, adaxial lip, petal, and sepal across flower developmental stages, indicating that the most stable genes differed in abaxial lip, adaxial lip, petal, and sepal. The least stable reference gene in all groups was 26S.

2.4.2. NormFinder Analysis

In NormFinder analysis, a direct variation value was used to evaluate the stability of the reference genes. Lower variation values indicate more stability of the reference genes; otherwise, more instability of the reference genes. In the tissue-dependent group, EF1δ, 60S, and 40S were the most stable genes amongst all samples; 60S, EF1δ, and ATP were the most stable genes in all tissues of the bud stage; ATP, 60S, and EF1δ were the most stable genes in all tissues of flower stage. In the development-dependent group, ACT7, 60S, and EF1δ were the most stable genes in the whole bud and flower, petal, and sepal; ATP, 40S, and 60S were the most stable genes in abaxial lip across the flower developmental stages; ACTF11, g-TUB and 60S were the most stably expressed combinations in adaxial lip across the flower developmental stages. The least stable reference gene in all groups was 26S as well (Table 2).

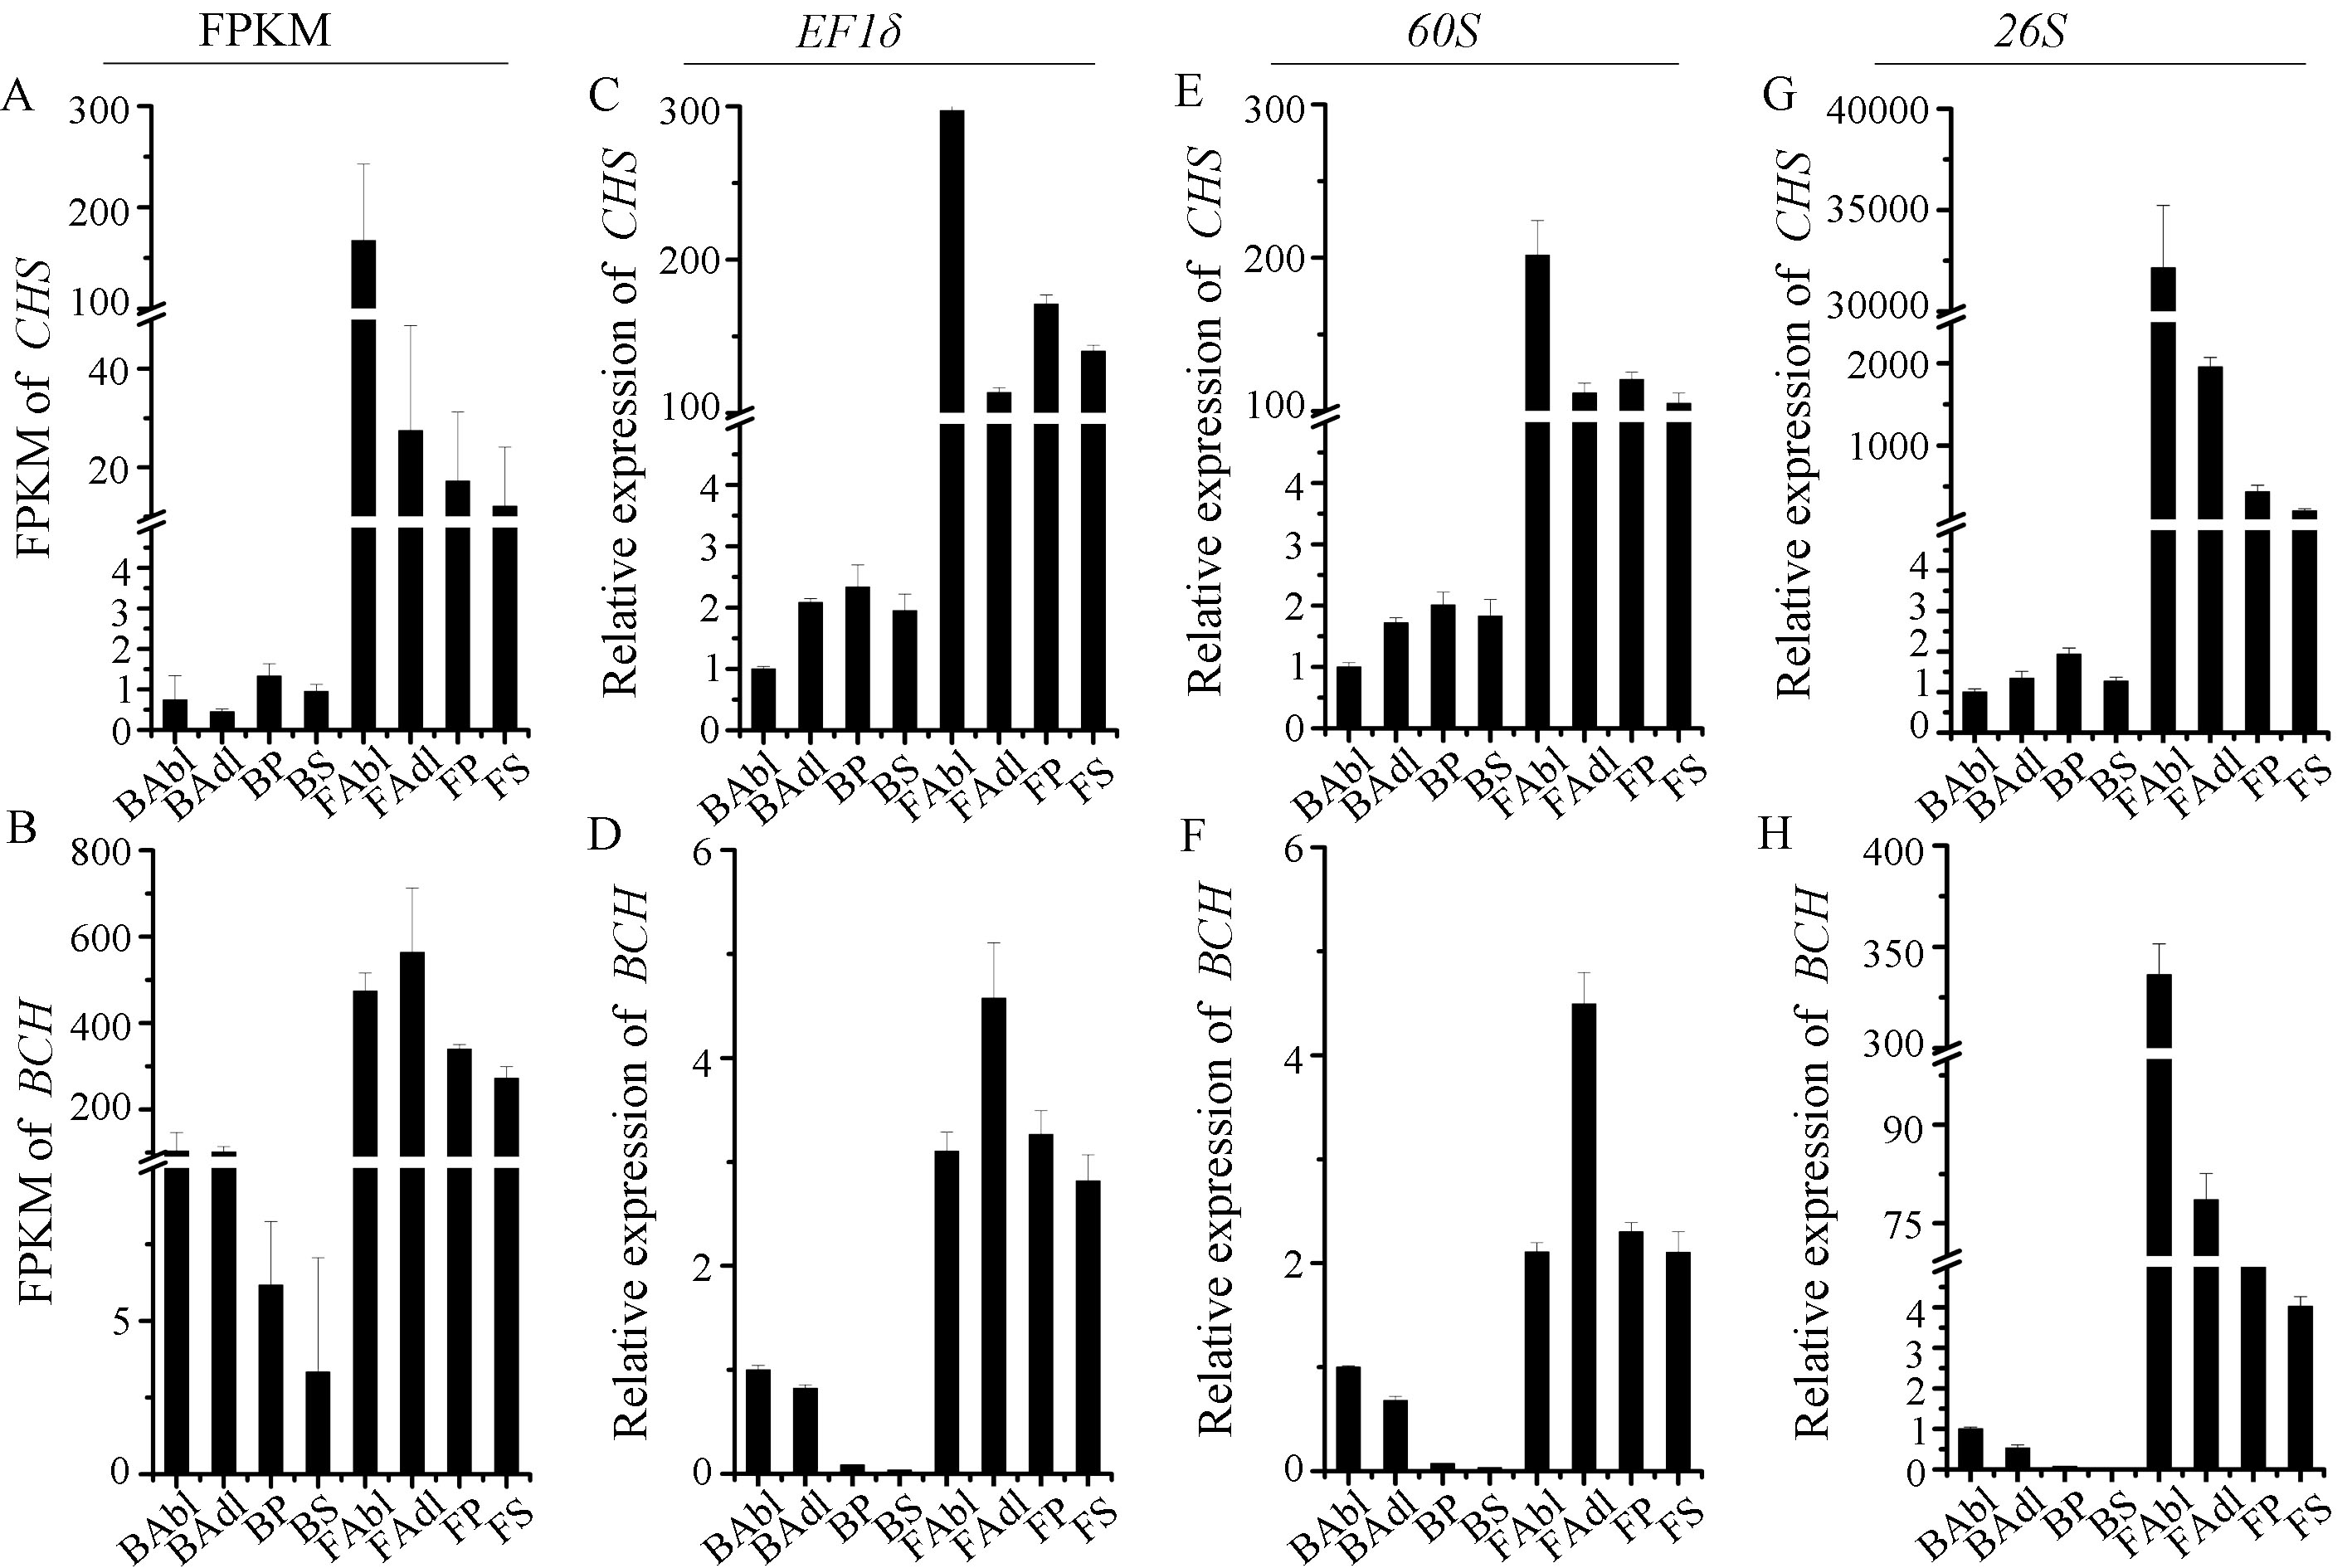
2.5. The Expression Profiles of CHS and BCH Validated by the Most Stable/unstable Reference Genes

Anthocyanins and carotenoids are widely distributed pigments in flowers, and their biosynthetic pathways (ABP and CBP) have been extensively studied in model and ornamental plants [3,37]. Chalcone synthase (CHS) and β-carotene hydroxylase (BCH) encode structural proteins that play roles in anthocyanin and carotenoid biosynthesis, respectively. The expression profiles of CHS and BCH were firstly showed by FPKM values in transcriptome data (Figure 5A,B). To validate the transcriptome data and the appropriateness of the reference genes, the two most stable reference genes, EF1δ (Figure 5C,D) and 60S (Figure 5E,F), and the least stable reference gene 26S (Figure 5G,H) were used to analyze the expression profiles of CHS and BCH in different tissues (abaxial lip, adaxial lip, petal, and sepal) across the flower developmental stages (bud and flower). When EF1δ and 60S were used to normalize expression, CHS and BCH expression patterns were similar to those shown by their respective FPKM value profiles, with the upregulated CHS and BCH expression in flower tissue, indicating that the ABP and CBP were activated across the stages of flower development. In addition, CHS expression was highest in the abaxial lip (Figure 5A,C,E), and BCH expression was highest in the adaxial lip (Figure 5B,D,F), indicating that the ABP and CBP were activated in abaxial and adaxial lip, resulting in a presence of red or yellow segments in abaxial and adaxial lip, respectively. When 26S (unstable gene) was used for normalization, the relative expression patterns of CHS and BCH differed from the relative expression patterns obtained using the two most stable reference genes (EF1δ and 60S) (Figure 5G,H). These results confirmed the importance of selecting reference genes prior to qRT-PCR analysis.

3. Discussion

In this study, we identified 12 candidate reference genes from transcriptome data of C. lowianum and analyzed their stability. We used geNorm and NormFinder to calculate expression stability of 10 candidate reference genes. In addition, qRT-PCR was used to detect the expression profiles of CHS and BCH in different samples across the stages of C. lowianum flower development, and validate the appropriateness of the results of geNorm and NormFinder analysis.
With the rapid development of high-throughput sequencing technology, RNA-sequencing has been widely used to detect gene expressions, based on genome sequence. The Orchidaceae is one of the largest families of flowering plants. However, due to the difficulty of assembling and annotating of genomes of Cymbidium, only Cymbidium goeringii [38] and Cymbidium sinense [39] had been sequenced and published. Morphological and phylogenetic analyses revealed a close relationship between C. lowianum and C. tracyanum [6]. Moreover, the reads of our C. lowianum transcriptome data could map 85.76–90.94% to the genome of C. tracyanum, which also indicate a close relationship between them at the whole genome level. In addition, transcriptome data of C. lowianum could be used to analyze gene expressions, and presumptive function genes associated with flower color formation in different tissues across the stages of flower development.
In the tissue-development group, our results show that the two most stable reference genes in different tissues of C. lowianum bud and flower are EF1δ, and 60S. These results coincide with the previous studies that 60S is the most suitable reference gene in different tissues in soybean [40,41], and in five developmental stages of stems in Panax ginseng [42]. Moreover, 60S is also found to be the most stable reference gene under various stress conditions [41]. However, there are few studies that have chosen EF1δ as a reference gene in plants, but EF1α was found to be the most suitable reference gene in different tissues in Panax ginseng [42] and jute [43]. ACT7 and g-TUB, two of the most widely used reference genes, showed different expression stabilities. In this study, ACT7 did not show a good expression stability in abaxial lip, adaxial lip, and petal, while they showed a good expression stability in sepal during C. lowianum flower development from the bud to flower. g-TUB did not show a good expression stability in all tissues during C. lowianum flower development from the bud to flower. In the previous studies, there are also few studies that have chosen g-TUB as a reference gene in plants, but β-TUB and α-TUB were used as reference genes usually, which did not among the selected candidate reference genes in this study. α-TUB is the least suitable reference gene in different tissues in Platycladus orientalis [44], and β-TUB exhibited low stability in Glehnia littoralis [45], while it showed the most stability in Jute [43]. ACT7 also showed different expression stabilities in different experimental conditions. ACT7 showed the least stable expression patterns during fruit ripening of red pitaya [46], in the seedlings of Suaeda glauca under NaCl treatment [16], and in different flax tissues [47]; while it showed the most stable expression patterns across different tissues and cold-treated samples in Platycladus orientalis [44], and in flixweed (Descurainia sophia) [48]. In the development-dependent group, the two most stable genes in the different tissues (abaxial lip, adaxial lip, petal, and sepal) differed (Figure 3, Table 2), coincided with the results in Panax ginseng [42]. These differences in reference gene expression across developmental stages and/or individual tissues demonstrate that gene expression is not always stable for a single given reference gene. In C. lavandulifolium, SAND (SAND family protein) is the most stable reference gene in different development samples and different tissues during the process of flower development [13], indicating that no single reference gene can be used for all species or different experimental conditions [13,49].
GeNorm and NormFinder are the two most widely used software for evaluating reference genes. In this study, the most stable reference genes identified by using GeNorm and NormFinder. In the tissue-dependent group, both GeNorm and NormFinder indicated that the two most stable reference genes are EF1δ and 60S. In the development-dependent group, combined GeNorm and NormFinder results showed the most stable reference genes in abaxial lip to be ATP and 40S, in adaxial lip to be 60S and EF1δ, in petal and sepal to be ACT7 and ATP (Figure 3, Table 2). Taken together, these findings indicate that the most stable reference gene for expression analysis during C. lowianum flower development differed in different experimental conditions.
The expression levels of structural genes in the pigment of anthocyanins and carotenoids biosynthesis pathways can directly influence pigment accumulation to determine flower color [37,50,51]. However, little is known about the molecular mechanisms of color formation in lip (divided into abaxial and adaxial), petal, and sepal across C. lowianum flower development stages. The expression profiles of CHS and BCH in C. lowianum, indicate that both anthocyanins and carotenoids content may increase from the bud stage to the flower stage. In the bud stage, ABP may be activated in lip, sepal, and petal, while BCP may be activated in lip, and inactivated in sepal and petal. In the flower stage, ABP and BCP may be both activated in lip, sepal, and petal. Moreover, in the abaxial lip of the flower, ABP may be mainly activated, resulting in the red segment; in the adaxial lip of flower, BCP may be mainly activated, resulting in the yellow segment.
This study is the first to select reference genes and detect anthocyanins and carotenoids biosynthesis pathway structural gene (CHS and BCH) expression profiles in different tissues across the stages of flower development in C. lowianum. Our findings provide a foundation for gene expression analysis during C. lowianum flower development and research aimed at elucidating the mechanisms of flower color formation. Moreover, these results confirm that different reference genes should be used for normalizing qRT-PCR data under different experimental conditions.

4. Materials and Methods

4.1. Plant Materials

C.lowianum was cultivated in a greenhouse at Kunming Institute of Botany, Chinese Academy of Sciences greenhouse (Kunming, China) under natural light at a temperature between 24–28 °C. C. lowianum flower tissues (abaxial lip, adaxial lip, petal, and sepal) were collected at the bud stage and at 10 days after flowering. All samples were immediately frozen in liquid nitrogen and then stored at −80 °C.

4.2. RNA Preparation, Reverse Transcription and qRT-PCR

Total RNA was extracted from tissues using RNAprep Pure Plant kit (TIAGEN, Beijing, China). RNA amounts were estimated using a NanoDrop 2000 (Thermo Fisher Scientific, Waltham, MA USA). cDNA synthesis was performed with approximately 2 μg of total RNA and the reaction system followed the PrimeScriptTM RT reagent Kit with gDNA Eraser (TaKaRa, RR047A, Shiga, Japan) protocol. The cDNA was eluted with 100 μL deionized water. A total of 2 μL of eluted cDNA was used as a template for qRT-PCR analysis. qRT-PCR was performed on a BioRad sequence detection system using TB Green Premix Ex Taq II (Tli RNaseH Plus) (TaKaRa, RR820, Shiga, Japan) for detection. Amplification conditions were as follows: 3 min of initial denaturation at 95 °C, followed by 40 cycles of 10 s at 95 °C, 20 s at 55 °C, and 20 s at 72 °C. Melt curves used to determine primer specificity were 10 s at 95 °C, followed by cycles of 0.05 s at 65–95 °C, rising 0.5 °C/cycle. Primers are listed in Table 1.

4.3. Screening of Candidate Reference Genes

In the transcriptome data sets, gene expression levers were calculated by FPKM values [52]. Genes without significant difference in FPKM values among the samples were selected as candidate reference genes. From these genes, 10 candidate reference genes (ACTF11, ATP, EF1δ, EIF, MADH, RAD23d, UBC, 26S, 40S, and 60S) with the FPKM values of about 100, and two common housekeeping genes, ACT7 and g-TUB, with the most stable expression among their homologous genes, were chosen for further study.

4.4. Primer Design and qRT-PCR Analysis of Candidate Reference Genes

Primers were selected artificially, and then tested using DNAMAN software with the following criteria: primer lengths between 18 to 25 bp, melting temperature between 50 to 60 °C, GC content between 40 to 60%, and amplicon lengths between 100 to 200 bp (Table 1). The expression level of each candidate gene was evaluated based on qRT-PCR. The specificity of the candidate reference genes was verified by RT-PCR, the products of which were visualized with 2% agarose gel electrophoresis (Figure S1), and qRT-PCR, as represented by a melting curve (Figure S2). The amplification efficiency (E) of each candidate gene was calculated according to a previous study [53,54].

4.5. Selection of Reference Genes with Stable Expression

To evaluate the stability of gene expression for each candidate reference gene, we used geNorm [32] and NormFinder [33] according to a recent study [17]. Before using this software, the minimum Cq values of candidate genes in all samples was determined, ∆Ct = Cq values of the other samples subtracting the minimum Cq among the samples, relative quantities were calculated by 2∆Ct. The values that represent the relative expression of each candidate reference gene in different samples were exported into an Excel datasheet (Microsoft Excel 2003), and the Ct values were converted according to the requirements of the software. In geNorm analysis, M values represent the pairwise variation for the candidate reference genes; using a cut-off of 1.5, lower M values indicate stable gene expression [32]. The geNorm software can also calculate a normalization factor for each experimental condition and suggest an optimal number of reference genes necessary for the experiment. In NormFinder analysis, a direct variation value of the candidate reference genes is provided [33]. Each of these approaches generates a rank order of the reference genes that represent reference gene stability. Based on the evaluated results of the two software, the most stable reference genes for qRT-PCR in different experimental conditions of C. lowianum were selected.

4.6. Validation of the Candidate Reference Genes

To confirm the reliability of the potential reference genes, we measured and normalized the relative expression of CHS and BCH in tissues at two developmental stages (abaxial lip, adaxial lip, petal, and sepal from the bud and flower). We normalized CHS and BCH expression with the most stable and most unstable reference genes according to geNorm and NormFinder. qRT-PCR experimental method was the same as described above, and the relative expression level was calculated by 2−ΔΔct method [55]. Each include three technical replicates. The FPKM values of CHS and BCH in transcriptome data can be used as a reference for their expression patterns.

Supplementary Materials

The following are available online at: https://www.mdpi.com/article/10.3390/ijms23020738/s1.

Author Contributions

X.-M.D. and S.-B.Z. conceived this study and designed the experiments. X.-M.D. performed the experiments and wrote the manuscript. W.Z. collected and cultivated the plant materials. All authors have read and agreed to the published version of the manuscript.

Funding

This work was supported by the Strategic Priority Research software of the Chinese Academy of Sciences (XDB31000000), the National Natural Science Foundation of China (32170393, 31971411), the Project for Innovation Team of Yunnan Province (202105AE160012), and Science and Technology software of Yunnan Province (202102AE090001).

Acknowledgments

We are grateful to Vandesompele and Andersen for the sharing of geNorm and NormFinder software.

Conflicts of Interest

The authors declare that they have no conflict of interest.

Abbreviations

qRT-PCRQuantitative real-time polymerase chain reaction
CqCycle threshold
ACT7Actin-7-like
ACTF11Actin-depolymerizing factor 11-like
ATPATP synthase subunit O
EF1 δ Elongation factor 1-delta
MADHMalate dehydrogenase
g-TUBgamma-tubulin complex component 2
UBCUbiquitin-conjugating enzyme
26S26S proteasome non-ATPase regulatory subunit 2
40S40S ribosomal protein
60S60S ribosomal protein
ABPAnthocyanins biosynthetic pathways
CBPCarotenoids biosynthetic pathways
CHSChalcone synthase
BCHβ-carotene hydroxylase
FPKMFragments per Kilobase of transcript per millions base pairs sequenced

References

  1. Gigord, L.D.B.; Macnair, M.R.; Smithson, A. Negative frequency-dependent selection maintains a dramatic flower color polymorphism in the rewardless orchid Dactylorhiza sambucina (L.) Soo. Proc. Natl. Acad. Sci. USA 2001, 98, 6253–6255. [Google Scholar] [CrossRef] [Green Version]
  2. Hopkins, R.; Rausher, M.D. Pollinator-Mediated Selection on Flower Color Allele Drives Reinforcement. Science 2012, 335, 1090–1092. [Google Scholar] [CrossRef] [PubMed] [Green Version]
  3. Cazzonelli, C.; Pogson, B.J. Source to sink: Regulation of carotenoid biosynthesis in plants. Trends Plant Sci. 2010, 15, 266–274. [Google Scholar] [CrossRef] [PubMed]
  4. Noman, A.; Aqeel, M.; Deng, J.; Khalid, N.; Sanaullah, T.; Shuilin, H. Biotechnological Advancements for Improving Floral Attributes in Ornamental Plants. Front. Plant Sci. 2017, 8, 530. [Google Scholar] [CrossRef] [Green Version]
  5. Li, X.J.; Li, Z.L.; Huang, L.P. Induction and identification of wild polyploid C. lowianum. Chin. Agric. Sci. Bull. 2010, 26, 261–266. [Google Scholar]
  6. Cheng, L.; Wang, Y.; Zhao, Y.; Li, Y.; He, F.; Li, Z. Characterization of the complete chloroplast genome of the endangered Chinese species Cymbidium lowianum (Rchb.f.) Rchb.f. Mitochondrial DNA Part B 2020, 5, 3318–3319. [Google Scholar] [CrossRef] [PubMed]
  7. Hossain, M.S.; Ahmed, R.; Haque, M.S.; Alam, M.M.; Islam, M.S. Identification and validation of reference genes for real-time quantitative RT-PCR analysis in jute. BMC Mol. Biol. 2019, 20, 13. [Google Scholar] [CrossRef]
  8. Gachon, C.; Mingam, A.; Charrier, B. Real-time PCR: What relevance to plant studies? J. Exp. Bot. 2004, 55, 1445–1454. [Google Scholar] [CrossRef] [Green Version]
  9. Nolan, T.; Hands, R.E.; Bustin, S.A. Quantification of mRNA using real-time RT-PC.R. Nat. Protoc. 2006, 1, 1559–1582. [Google Scholar] [CrossRef]
  10. Chi, C.; Shen, Y.; Yin, L.; Ke, X.; Han, D.; Zuo, Y. Selection and validation of reference genes for gene expression analysis in vigna angularis using quantitative real-time RT-PC.R. PLoS ONE 2016, 11, e0168479. [Google Scholar] [CrossRef]
  11. Bustin, S.A.; Benes, V.; Garson, J.A.; Hellemans, J.; Huggett, J.; Kubista, M.; Mueller, R.; Nolan, T.; Pfaffl, M.W.; Shipley, G.L.; et al. The MIQE guidelines: Minimum information for publication of quantitative real-time PCR experiments. Clin. Chem. 2009, 55, 611–622. [Google Scholar] [CrossRef] [Green Version]
  12. Hong, Y.; Dai, S. Selection of Reference Genes for Real-time Polymerase Chain Reaction Analysis of Light-dependent Anthocyanin Biosynthesis in Chrysanthemum. J. Am. Soc. Hortic. Sci. 2015, 140, 68–77. [Google Scholar] [CrossRef]
  13. Qi, S.; Yang, L.; Wen, X.; Hong, Y.; Song, X.; Zhang, M.; Dai, S. Reference Gene Selection for RT-qPCR Analysis of Flower Development in Chrysanthemum morifolium and Chrysanthemum lavandulifolium. Front. Plant Sci. 2016, 7, 287. [Google Scholar] [CrossRef] [Green Version]
  14. Hou, F.; Li, S.; Wang, J.; Kang, X.; Weng, Y.; Xing, G. Identification and validation of reference genes for quantitative real-time PCR studies in long yellow daylily, Hemerocallis citrina Borani. PLoS ONE 2017, 12, e0174933. [Google Scholar]
  15. Lu, Y.P.; Liao, J.H.; Guo, Z.J.; Zheng, H.Q.; Lu, L.F.; Cai, Z.X.; Zeng, Z.H.; Ying, Z.H.; Chen, M.Y. Selection and Evaluation of Potential Reference Genes for Quantitative Real-Time PCR in Agaricus blazei Based on Transcriptome Sequencing Data. BioMed Res. Int. 2021, 2021. [Google Scholar] [CrossRef]
  16. Wang, M.; Ren, T.; Marowa, P.; Du, H.; Xu, Z. Identification and selection of reference genes for gene expression analysis by quantitative real-time PCR in Suaeda glauca’s response to salinity. Sci. Rep. 2021, 11, 8569. [Google Scholar] [CrossRef] [PubMed]
  17. Liang, W.; Zou, X.; Carballar-Lejarazú, R.; Wu, L.; Sun, W.; Yuan, X.; Wu, S.; Li, P.; Ding, H.; Ni, L.; et al. Selection and evaluation of reference genes for qRT-PCR analysis in Euscaphis konishii Hayata based on transcriptome data. Plant Methods 2018, 14, 42. [Google Scholar] [CrossRef]
  18. He, Y.; Yan, H.; Hua, W.; Huang, Y.; Wang, Z. Selection and validation of reference genes for quantitative real-time PCR in Gentiana macrophylla. Front. Plant Sci. 2016, 7, 945. [Google Scholar] [CrossRef] [Green Version]
  19. Wang, L.; Wang, Y.; Zhou, P. Validation of reference genes for quantitative real-time PCR during Chinese wolfberry fruit development. Plant Physiol. Biochem. 2013, 70, 304–310. [Google Scholar] [CrossRef] [PubMed]
  20. Gantasala, N.P.; Papolu, P.K.; Thakur, P.K.; Kamaraju, D.; Sreevathsa, R.; Rao, U. Selection and validation of reference genes for quantitative gene expression studies by real-time PCR in eggplant (Solanum melongena L). BMC Res. Notes 2013, 6, 312. [Google Scholar] [CrossRef] [Green Version]
  21. Galli, V.; da Silva Messias, R.; dos Anjos e Silva, S.D.; Rombaldi, C.V. Selection of reliable reference genes for quantitative real-time polymerase chain reaction studies in maize grains. Plant Cell. Rep. 2013, 32, 1869–1877. [Google Scholar] [CrossRef] [PubMed] [Green Version]
  22. Li, X.S.; Yang, H.L.; Zhang, D.Y.; Zhang, Y.M.; Wood, A.J. Reference gene selection in the desert plant Eremosparton songoricum. Int. J. Mol. Sci. 2012, 13, 6944–6963. [Google Scholar] [CrossRef] [PubMed]
  23. Alves Oliveira, D.; Tang, J.D.; Warburton, M.L. Reference Gene Selection for RT-qPCR Analysis in Maize Kernels Inoculated with Aspergillus flavus. Toxins 2021, 13, 386. [Google Scholar] [CrossRef] [PubMed]
  24. Qu, R.; Miao, Y.; Cui, Y.; Cao, Y.; Zhou, Y.; Tang, X.; Yang, J.; Wang, F. Selection of reference genes for the quantitative real-time PCR normalization of gene expression in Isatis indigotica fortune. BMC Mol. Biol. 2019, 20, 9. [Google Scholar] [CrossRef] [PubMed] [Green Version]
  25. Liu, Q.; Qi, X.; Yan, H.; Huang, L.; Nie, G.; Zhang, X. Reference gene selection for quantitative real-time Reverse-transcriptase PCR in annual ryegrass (Lolium multiflorum) subjected to various abiotic stresses. Molecules 2018, 23, 172. [Google Scholar] [CrossRef]
  26. Wang, Z.; Chen, Y.; Fang, H.; Shi, H.; Chen, K.; Zhang, Z.; Tan, X. Selection of reference genes for quantitative reverse-transcription polymerase chain reaction normalization in Brassica napus under various stress conditions. Mol. Genet. Genom. 2014, 289, 1023–1035. [Google Scholar] [CrossRef]
  27. Borowski, J.M.; Galli, V.; Messias Rda, S.; Perin, E.C.; Buss, J.H.; dos Anjos e Silva, S.D.; Rombaldi, C.V. Selection of candidate reference genes for real-time PCR studies in lettuce under abiotic stresses. Planta 2014, 239, 1187–1200. [Google Scholar] [CrossRef]
  28. Liu, X.; Guan, H.; Song, M.; Fu, Y.; Han, X.; Lei, M.; Ren, J.; Guo, B.; He, W.; Wei, Y. Reference gene selection for qRT-PCR assays in Stellera chamaejasme subjected to abiotic stresses and hormone treatments based on transcriptome datasets. PeerJ 2018, 6, e4535. [Google Scholar] [CrossRef] [Green Version]
  29. Lee, J.M.; Roche, J.R.; Donaghy, D.J.; Thrush, A.; Sathish, P. Validation of reference genes for quantitative RT-PCR studies of gene expression in perennial ryegrass (Lolium perenne L.). BMC Mol. Biol. 2010, 11, 8. [Google Scholar] [CrossRef] [Green Version]
  30. Czechowski, T.; Stitt, M.; Altmann, T.; Udvardi, M.K.; Scheible, W.R. Genome-wide identification and testing of superior reference genes for transcript normalization in Arabidopsis. Plant Physiol. 2005, 139, 5–17. [Google Scholar] [CrossRef] [PubMed] [Green Version]
  31. Coker, J.S.; Davies, E. Selection of candidate housekeeping controls in tomato plants using EST data. Biotechniques 2003, 35, 740–746. [Google Scholar] [CrossRef]
  32. Vandesompele, J.; De Preter, K.; Pattyn, F.; Poppe, B.; Van Roy, N.; De Paepe, A.; Speleman, F. Accurate normalization of real-time quantitative RT-PCR data by geometric averaging of multiple internal control genes. Genome Biol. 2002, 3, 1–12. [Google Scholar] [CrossRef] [Green Version]
  33. Andersen, C.L.; Jensen, J.L.; Ørntoft, T.F. Normalization of real-time quantitative reverse transcription-PCR data: A model-based variance estimation approach to identify genes suited for normalization, applied to bladder and colon cancer data sets. Cancer Res. 2004, 64, 5245–5250. [Google Scholar] [CrossRef] [Green Version]
  34. Dao, T.T.H.; Linthorst, H.J.M.; Verpoorte, R. Chalcone synthase and its functions in plant resistance. Phytochem. Rev. 2011, 10, 397. [Google Scholar] [CrossRef] [PubMed] [Green Version]
  35. Kim, S.H.; Ahn, Y.O.; Ahn, M.J.; Lee, H.S.; Kwak, S.S. Down-regulation of β-carotene hydroxylase increases β-carotene and total carotenoids enhancing salt stress tolerance in transgenic cultured cells of sweetpotato. Phytochemistry 2012, 74, 69–78. [Google Scholar] [CrossRef]
  36. Zhao, Z.; Zhang, Z.; Ding, Z.; Meng, H.; Shen, R.; Tang, H.; Liu, Y.G.; Chen, L. Public-transcriptome-database-assisted selection and validation of reliable reference genes for qRT-PCR in rice. Sci. China Life Sci. 2020, 63, 92–101. [Google Scholar] [CrossRef] [PubMed]
  37. Zhao, D.; Tao, J. Recent advances on the development and regulation of flower color in ornamental plants. Front. Plant Sci. 2015, 6, 261. [Google Scholar] [CrossRef] [PubMed] [Green Version]
  38. Sun, Y.; Chen, G.-Z.; Huang, J.; Liu, D.-K.; Xue, F.; Chen, X.-L.; Chen, S.-Q.; Liu, C.-G.; Liu, H.; Ma, H.; et al. The Cymbidium goeringii genome provides insight into organ development and adaptive evolution in orchids. Ornam. Plant Res. 2021, 1, 10. [Google Scholar] [CrossRef]
  39. Yang, F.; Gao, J.; Wei, Y.; Ren, R.; Zhang, G.; Lu, C.; Jin, J.; Ai, Y.; Wang, Y.; Chen, L.; et al. The genome of Cymbidium sinense revealed the evolution of orchid traits. Plant Biotechnol. J. 2021, 19, 2501–2516. [Google Scholar] [CrossRef]
  40. Gao, M.; Liu, Y.; Ma, X.; Shuai, Q.; Gai, J.; Li, Y. Evaluation of Reference Genes for Normalization of Gene Expression Using Quantitative RT-PCR under Aluminum, Cadmium, and Heat Stresses in Soybean. PLoS ONE 2017, 12, e0168965. [Google Scholar] [CrossRef]
  41. Le, D.T.; Aldrich, D.L.; Valliyodan, B.; Watanabe, Y.; Ha, C.V.; Nishiyama, R.; Guttikonda, S.K.; Quach, T.N.; Gutierrez-Gonzalez, J.J.; Tran, L.S.; et al. Evaluation of candidate reference genes for normalization of quantitative RT-PCR in soybean tissues under various abiotic stress conditions. PLoS ONE 2012, 7, e46487. [Google Scholar] [CrossRef]
  42. Liu, J.; Wang, Q.; Sun, M.; Zhu, L.; Yang, M.; Zhao, Y. Selection of reference genes for quantitative real-time PCR normalization in Panax ginseng at different stages of growth and in different organs. PLoS ONE 2014, 9, e112177. [Google Scholar] [CrossRef] [PubMed] [Green Version]
  43. Niu, X.; Qi, J.; Zhang, G.; Xu, J.; Tao, A.; Fang, P.; Su, J. Selection of reliable reference genes for quantitative real-time PCR gene expression analysis in Jute (Corchorus capsularis) under stress treatments. Front. Plant Sci. 2015, 6, 848. [Google Scholar] [CrossRef] [Green Version]
  44. Chang, E.; Shi, S.; Liu, J.; Cheng, T.; Xue, L.; Yang, X.; Yang, W.; Lan, Q.; Jiang, Z. Selection of reference genes for quantitative gene expression studies in Platycladus orientalis (Cupressaceae) Using real-time PC.R. PLoS ONE 2012, 7, e33278. [Google Scholar]
  45. Li, L.; Li, N.; Fang, H.; Qi, X.; Zhou, Y. Selection and Validation of Reference Genes for Normalisation of Gene Expression in Glehnia littoralis. Sci. Rep. 2020, 10, 7374. [Google Scholar] [CrossRef] [PubMed]
  46. Zheng, Q.; Wang, X.; Qi, Y.; Ma, Y. Selection and validation of reference genes for qRT-PCR analysis during fruit ripening of red pitaya (Hylocereus polyrhizus). FEBS Open Bio. 2021, 11, 3142–3152. [Google Scholar] [CrossRef]
  47. Huis, R.; Hawkins, S.; Neutelings, G. Selection of reference genes for quantitative gene expression normalization in flax (Linum usitatissimum L.). BMC Plant Biol. 2010, 10, 71. [Google Scholar] [CrossRef] [Green Version]
  48. Xu, X.; Liu, X.; Chen, S.; Li, B.; Wang, X.; Fan, C.; Wang, G.; Ni, H. Selection of relatively exact reference genes for gene expression studies in flixweed (Descurainia sophia) by quantitative real-time polymerase chain reaction. Pestic Biochem Physiol. 2016, 127, 59–66. [Google Scholar] [CrossRef]
  49. Ray, D.L.; Johnson, J.C. Validation of reference genes for gene expression analysis in olive (Olea europaea) mesocarp tissue by quantitative real-time RT-PC.R. BMC Res. Notes 2014, 7, 304. [Google Scholar] [CrossRef] [Green Version]
  50. Nisar, N.; Li, L.; Lu, S.; Khin, N.C.; Pogson, B.J. Carotenoid metabolism in plants. Mol. Plant 2015, 8, 68–82. [Google Scholar] [CrossRef] [Green Version]
  51. Yuan, H.; Zhang, J.; Nageswaran, D.; Li, L. Carotenoid metabolism and regulation in horticultural crops. Hortic. Res. 2015, 2, 15036. [Google Scholar] [CrossRef] [PubMed] [Green Version]
  52. Trapnell, C.; Williams, B.A.; Pertea, G.; Mortazavi, A.; Kwan, G.; van Baren, M.J.; Salzber, S.L.; Wold, B.J.; Pachter, L. Transcript assembly and quantification by RNA–Seq reveals unannotated transcripts and isoform switching during cell differentiation. Nat. Biotechnol. 2010, 28, 511–515. [Google Scholar] [CrossRef] [Green Version]
  53. Rasmussen, R. Quantification on the LightCycler. In Rapid Cycle Real-time PCR, Methods and Application; Meuer, S., Wittwer, C., Nakagawara, K., Eds.; Springer Press: Heidelberg, Germany, 2001; pp. 21–34. [Google Scholar]
  54. Tong, Z.; Gao, Z.; Wang, F.; Zhou, J.; Zhang, Z. Selection of reliable reference genes for gene expression studies in peach using real-time PC.R. BMC Mol. Biol. 2009, 10, 71. [Google Scholar] [CrossRef] [PubMed] [Green Version]
  55. Livak, K.J.; Schmittgen, T.D. Analysis of relative gene expression data using real-time quantitative PCR and the 2(-Delta Delta C(T)) Method. Methods 2001, 25, 402–408. [Google Scholar] [CrossRef] [PubMed]
Figure 1. Two stages of C. lowianum flower development: (A) bud and (B) flower. V-shaped red abaxial, and adaxial of lip, petal, and sepal of bud and flower were collected as samples for this study. Bar = 0.5 cm.
Ijms 23 00738 g001
Figure 2. qRT-PCR cycle threshold (Cq) values of 10 candidate reference genes from all investigated samples. The lines across the box indicate the median values, boxes indicate the 25/75 percentiles, whisker caps indicate the maximum and minimum values, and small circles represent outliers. The higher boxes and whiskers indicate the greater the variations.
Ijms 23 00738 g002
Figure 3. Average expression stability (M value) of 10 candidate reference genes calculated by geNorm software. Expression stability was evaluated in different sample combinations. Totals indicate samples of abaxial lip, adaxial lip, petal, and sepal from the bud and flower. Abl, Adl, P, and S indicate abaxial lip, adaxial lip, petal, and sepal, respectively. Bud and flower indicate samples of two developmental stages. B and F indicate bud and flower, respectively. The lower M value, the more stable expression of the reference genes.
Ijms 23 00738 g003
Figure 4. Optimal number of reference genes in different groups calculated by geNorm. The pairwise variation (Vn/Vn + 1) was analyzed between normalization factors (NFn and NFn + 1). The Vn/n + 1 threshold is 0.15. If Vn/n + 1 is lower than 0.15, n reference genes can meet the experimental requirements, otherwise n + 1 reference genes should be used for further study.
Ijms 23 00738 g004
Figure 5. The expression profiles of CHS and BCH in C. lowianum. (A,B) The expression levels of CHS and BCH presented by FPKM value of transcriptome data. (CF) The expression levels of CHS and BCH normalized by the most stable reference genes EF1δ (C,D), and 60S (E,F). (G,H) The expression levels of CHS and BCH normalized by the most unstable reference genes 26S. BAbl, BAdl, BP, and BS indicate abaxial lip, adaxial lip, petal, and sepal of the bud, respectively. FAbl, FAdl, FP, and FS indicate abaxial lip, adaxial lip, petal, and sepal of the flower, respectively.
Ijms 23 00738 g005
Table 1. Selected candidate reference genes, primers, and amplification characteristics.
Gene
Name
DescriptionPrimer Sequence (5′-3′)Amplicon
Length (bp)
RT-qPCR
Efficiency (%)
R2
ACT7actin-7-likeF:AACTGGTATTGTGCTGGATTC
R:TCATCAGTGAATCTGTAAGGTC
12888.580.9970
ACTF11actin-depolymerizing factor 11-likeF:ATGTTCATCAACAGTTGCAG
R:GGCAGTGATCATCAACTC
130158.300.8844
ATPATP synthase subunit OF:TTCACTGATCAATTACGGC
R:GATGCGTAGTTTCCAGTAC
141102.440.9496
EF1 δ elongation factor 1-deltaF:CTACCAAGCTTCAAAGGATG
R:CTCAGATACAGTAGTAGACC
14398.320.9984
MADHmalate dehydrogenaseF:CTACGATATCGCTGGTACTC
R:ACGAGTTCTGATCCCTCC
123105.620.9948
g-TUBgamma-tubulin complex component 2F:ATCCATTGTGATTGAGAAGGC
R:ACTGTAGTATCACCTGCCATG
10293.050.9996
UBCUbiquitin-conjugating enzymeF:ATCTCTCAGGCAAGCATTAC
R:GTAGAGGTATGGCACTAATC
125130.870.9856
26S26S proteasome non-ATPase regulatory subunit 2F:CAGAAGCTCGCACTAGAG
R:TATGGGCAGATCATCATACTG
162102.600.9953
40S40S ribosomal proteinF:GAAGATGGTATTCCTGCAG
R:TAGCCTTGGCTGCTTCATG
13993.180.9999
60S60S ribosomal proteinF:GTCCAAGTCGAATCAGTATG
R:ATAGTGCGTGCCATTCTTC
13996.680.9960
Table 2. Expression stability of the nine candidate reference genes as calculated by NormFinder.
SampleRank12345678910
TotalGeneEF1δ60S40SACT7ATPg-TUBACTF11UBCMADH26S
stability0.0680.0740.1240.1880.2550.3320.4270.4940.6452.383
BudGene60SEF1δATP40Sg-TUBACT7ACTF11UBC26SMADH
stability0.1430.1660.1930.2270.2870.3330.3600.3680.3850.388
FlowerGeneATP60SEF1δACTF11ACT7g-TUB40SMADHUBC26S
stability0.0200.0200.0520.0840.1040.1560.2790.3410.4372.615
Bud and FlowerGeneACT760SEF1δ40SATPg-TUBUBCACTF11MADH26S
stability0.0040.0040.0340.0810.2800.3030.3640.4650.6231.519
Abaxial lipGeneATP40S60SEF1δUBCACT7g-TUBMADHACTF1126S
stability0.0040.0040.0110.0260.0260.0430.3560.6580.9624.283
Adaxial
lip
GeneACTF11g-TUB60SEF1δ40SACT7ATPMADHUBC26S
stability0.0120.0120.1240.1650.1920.2890.5580.7660.8222.476
PetalGeneACT760SEF1δ40SATPACTF11g-TUBUBCMADH26S
stability0.0490.0490.0620.2450.3830.3930.4540.6450.6541.053
SepalGeneACT760SEF1δATP40Sg-TUBACTF11UBCMADH26S
stability0.0410.0870.1630.1910.3430.3890.5610.6760.7560.844
Publisher’s Note: MDPI stays neutral with regard to jurisdictional claims in published maps and institutional affiliations.

