
Omega-6 and Omega-3 Fatty Acid-Derived Oxylipins from the Lipoxygenase Pathway in Maternal and Umbilical Cord Plasma at Delivery and Their Relationship with Infant Growth

 , ,
, ,  , , , ,
Abstract
:1. Introduction
2. Results
2.1. Baseline Characteristics
2.1.1. Maternal Demographics
2.1.2. Infant Demographics
2.1.3. Association between Metabolite Levels and Baseline Characteristics
2.2. Relationships between LOX Metabolite Levels in Maternal and Umbilical Cord Plasma
2.2.1. Correlations for Parent Nutrients and n-6 Metabolites in Maternal and Umbilical Cord Plasma
2.2.2. Correlations for Parent Nutrients and n-3 Metabolites in Maternal and Umbilical Cord Plasma
2.3. Metabolite Association with Maternal Diet
2.4. Associations between Fatty Acid Metabolites and Infant Growth
2.4.1. The Relationships between n-6 FA Metabolites and Infant Growth
2.4.2. n-3 FA Metabolites and Infant Growth
3. Discussion
3.1. n-6 PUFA
3.2. n-3 PUFA
4. Materials and Methods
4.1. Study Characteristics
4.2. Maternal Dietary Intake
4.3. Maternal and Infant Outcomes
4.4. Blood Sample Collection
4.5. Quantification Methods for n-3 and n-6 FA Oxylipin
4.5.1. Fatty Acid Extraction
4.5.2. Liquid Chromatography–Mass Spectrometry
4.6. Fatty Acid Quantification in Maternal Plasma
4.7. Statistics
5. Conclusions
Author Contributions
Funding
Institutional Review Board Statement
Informed Consent Statement
Data Availability Statement
Conflicts of Interest
Appendix A

| Parent Fatty Acid | Median | IQR |
|---|---|---|
| Maternal Linoleic (µg/mL) | 1482.57 | 296.91 |
| Maternal alpha-Linolenic (µg/mL) | 35.64 | 10.90 |
| Maternal Arachidonic (µg/mL) | 272.70 | 109.78 |
| Maternal Eicosapentaenoic (µg/mL) | 5.96 | 5.26 |
| Maternal Docosahexaenoic (µg/mL) | 72.74 | 22.30 |
Appendix B
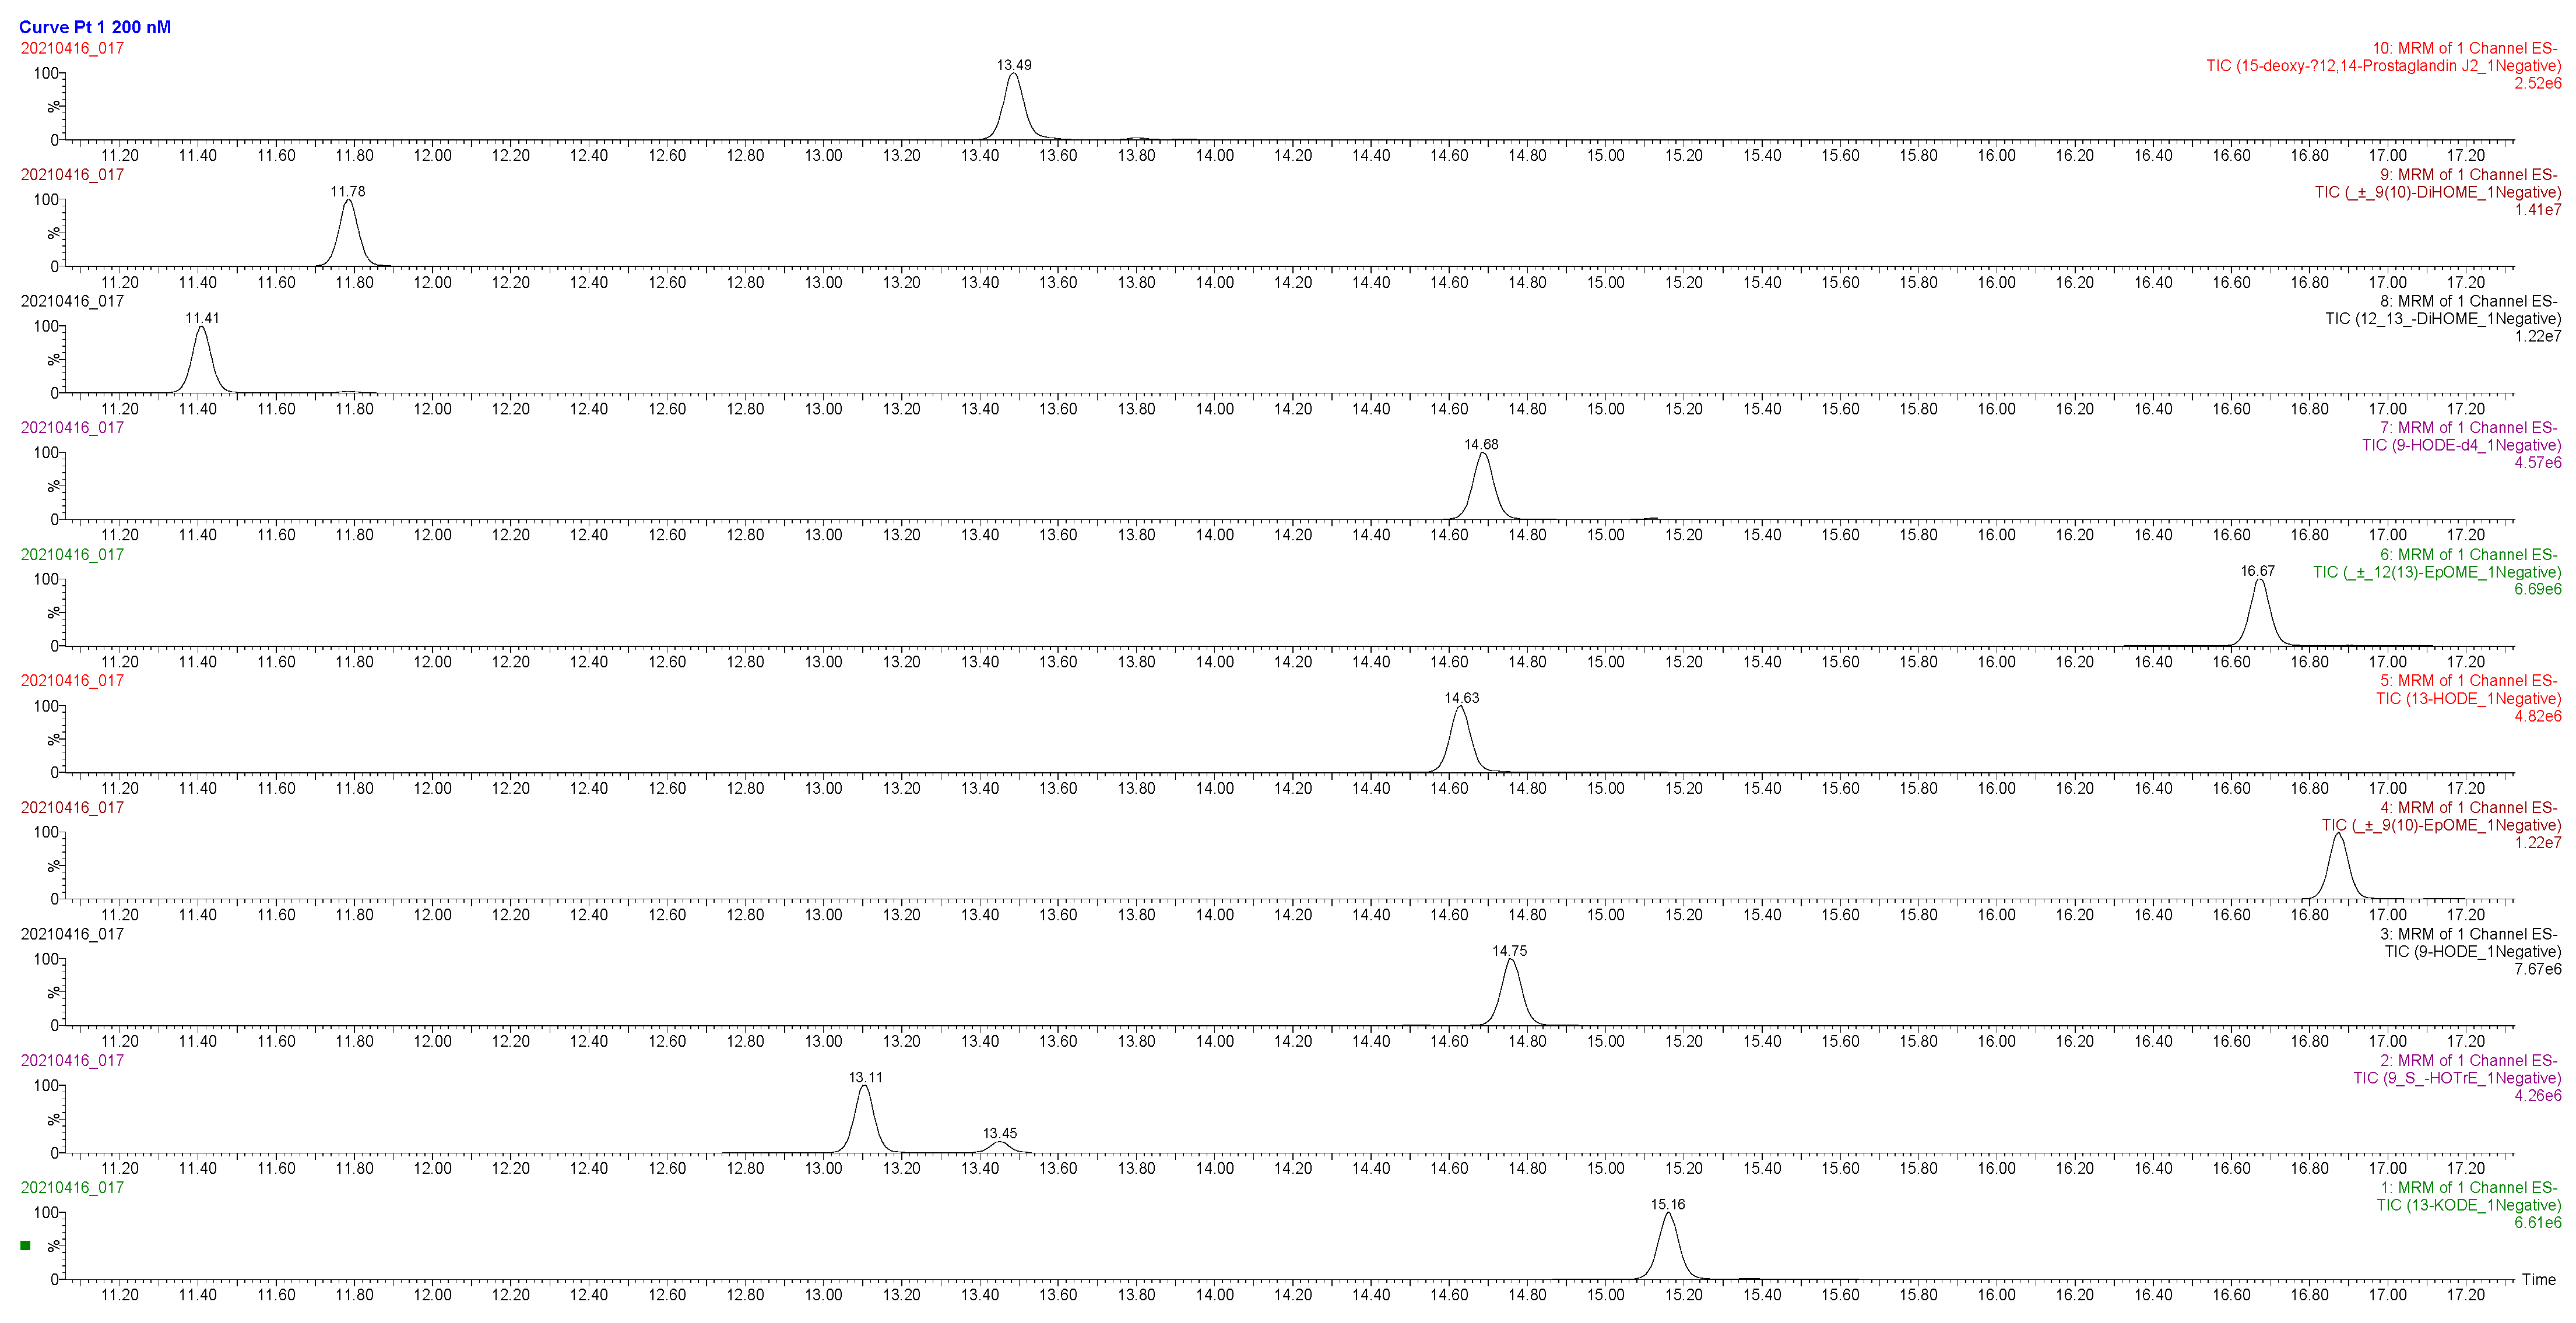
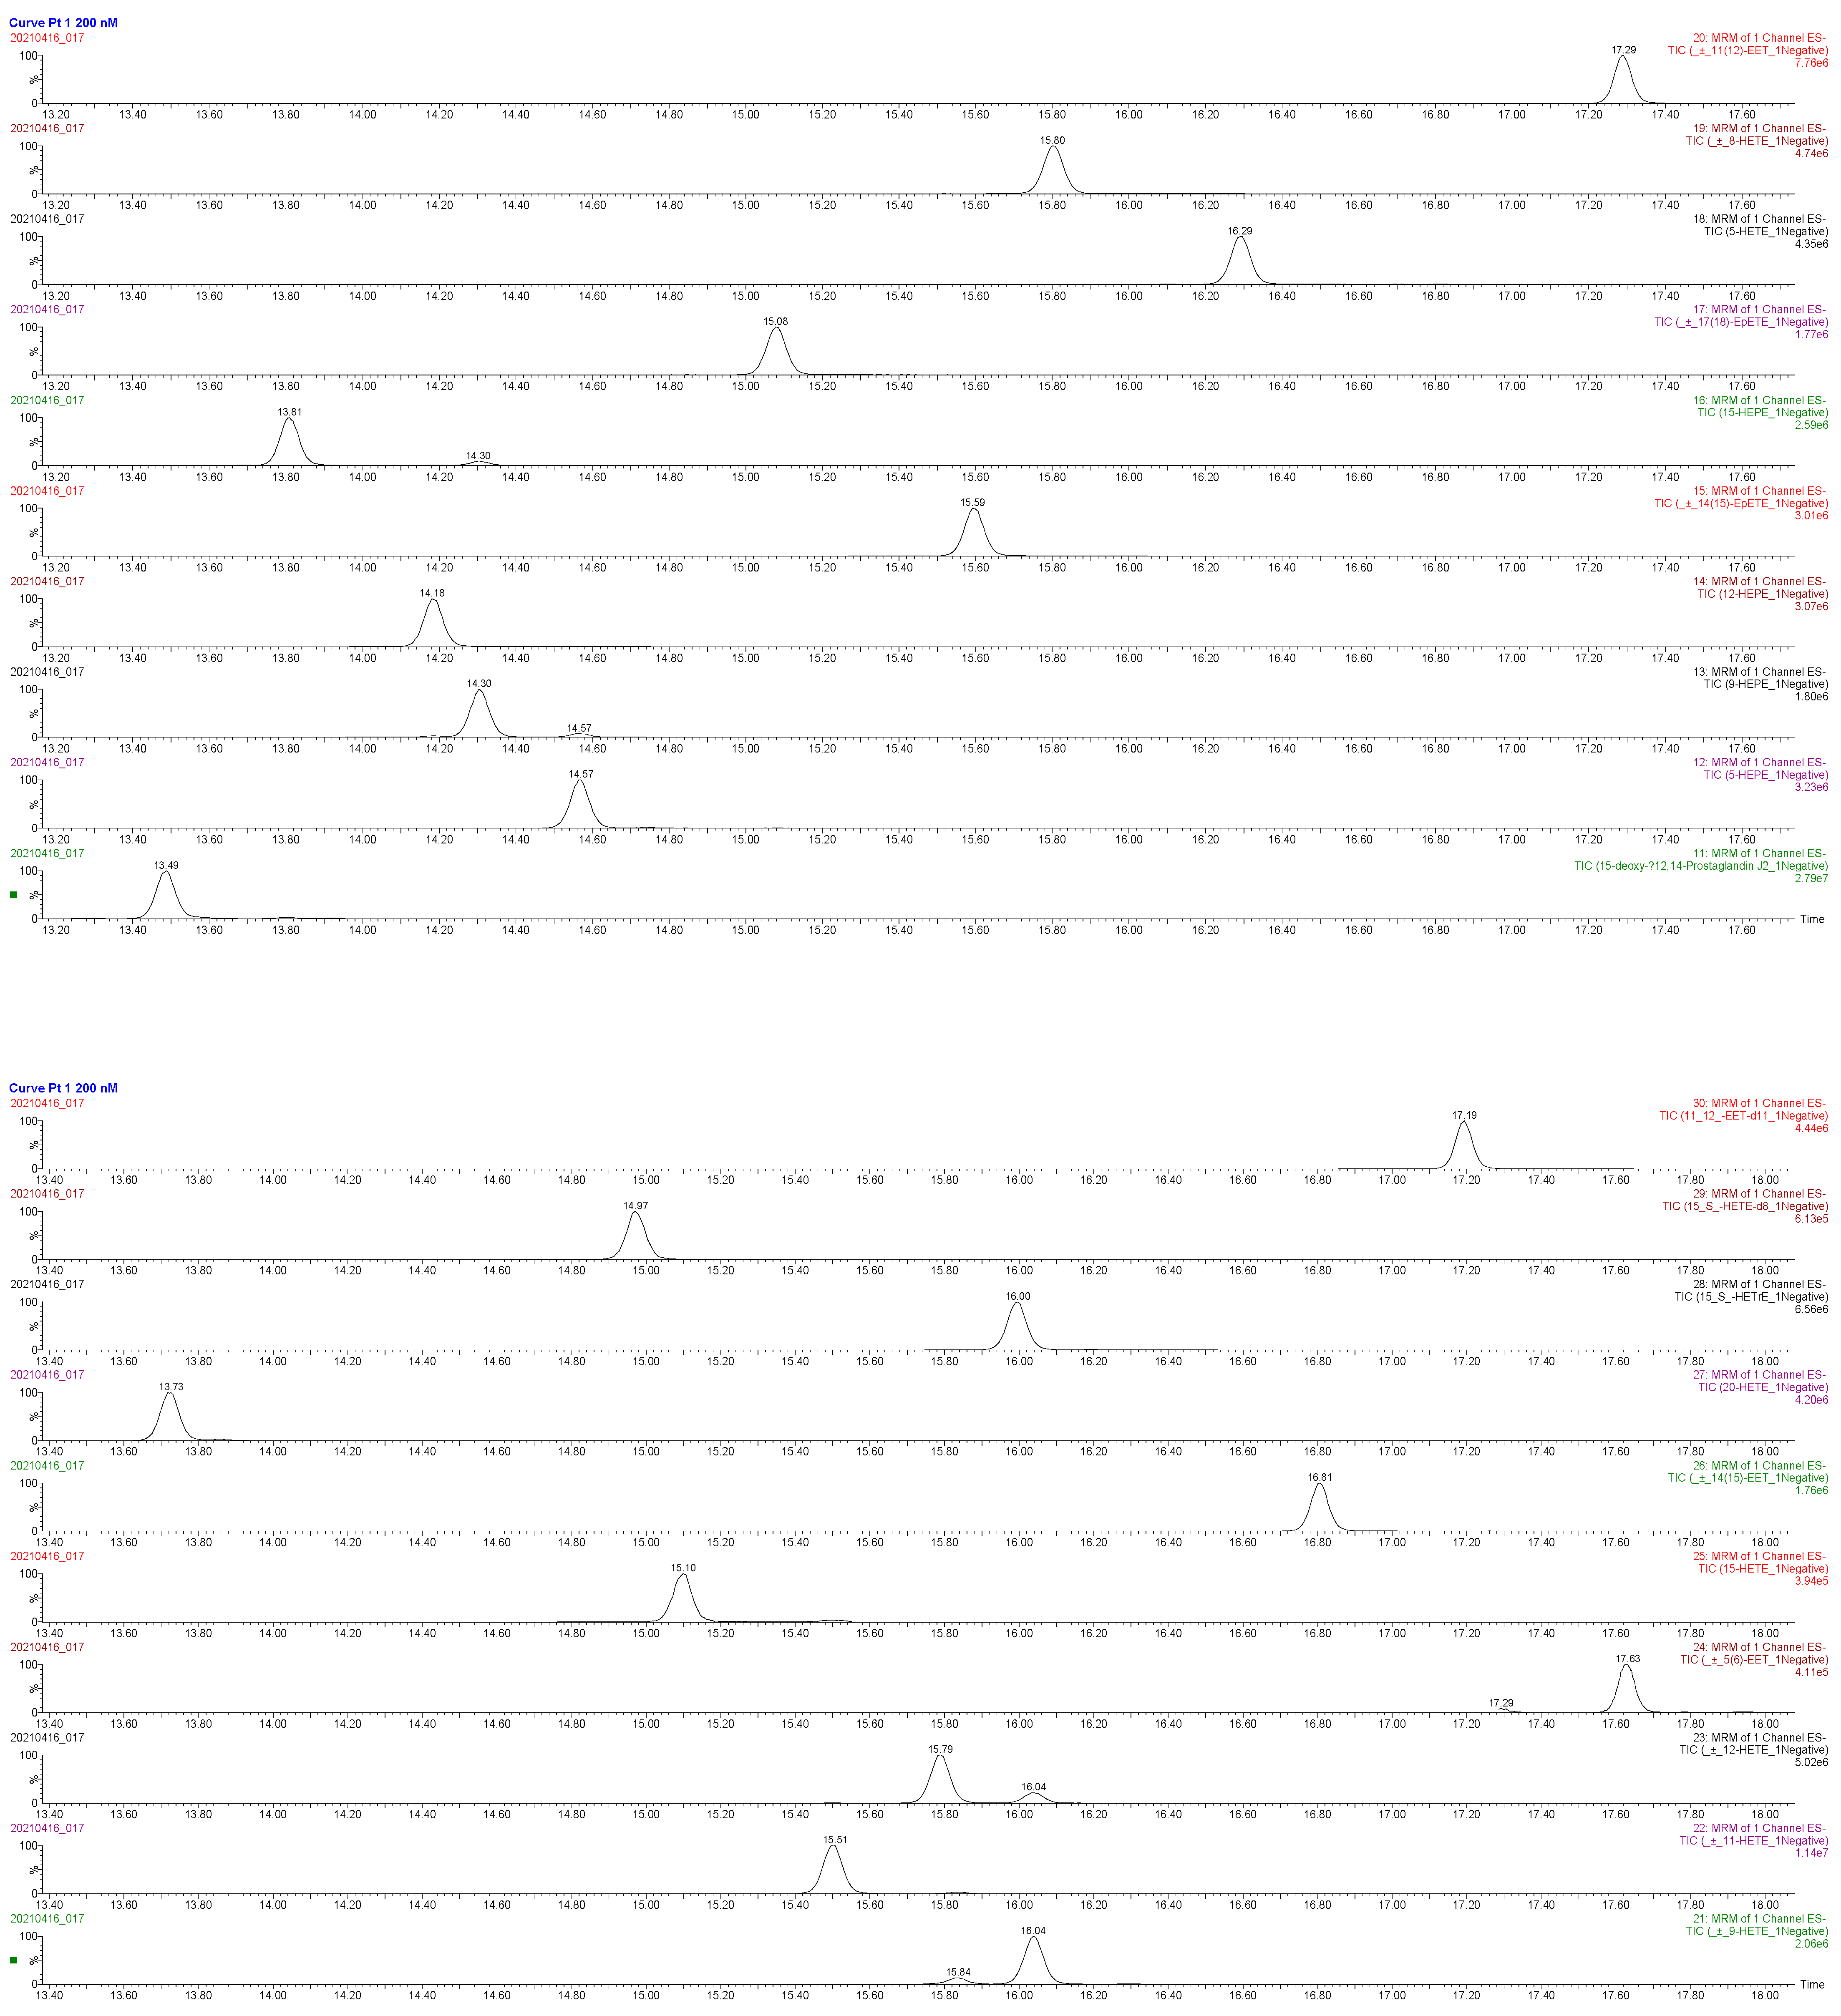
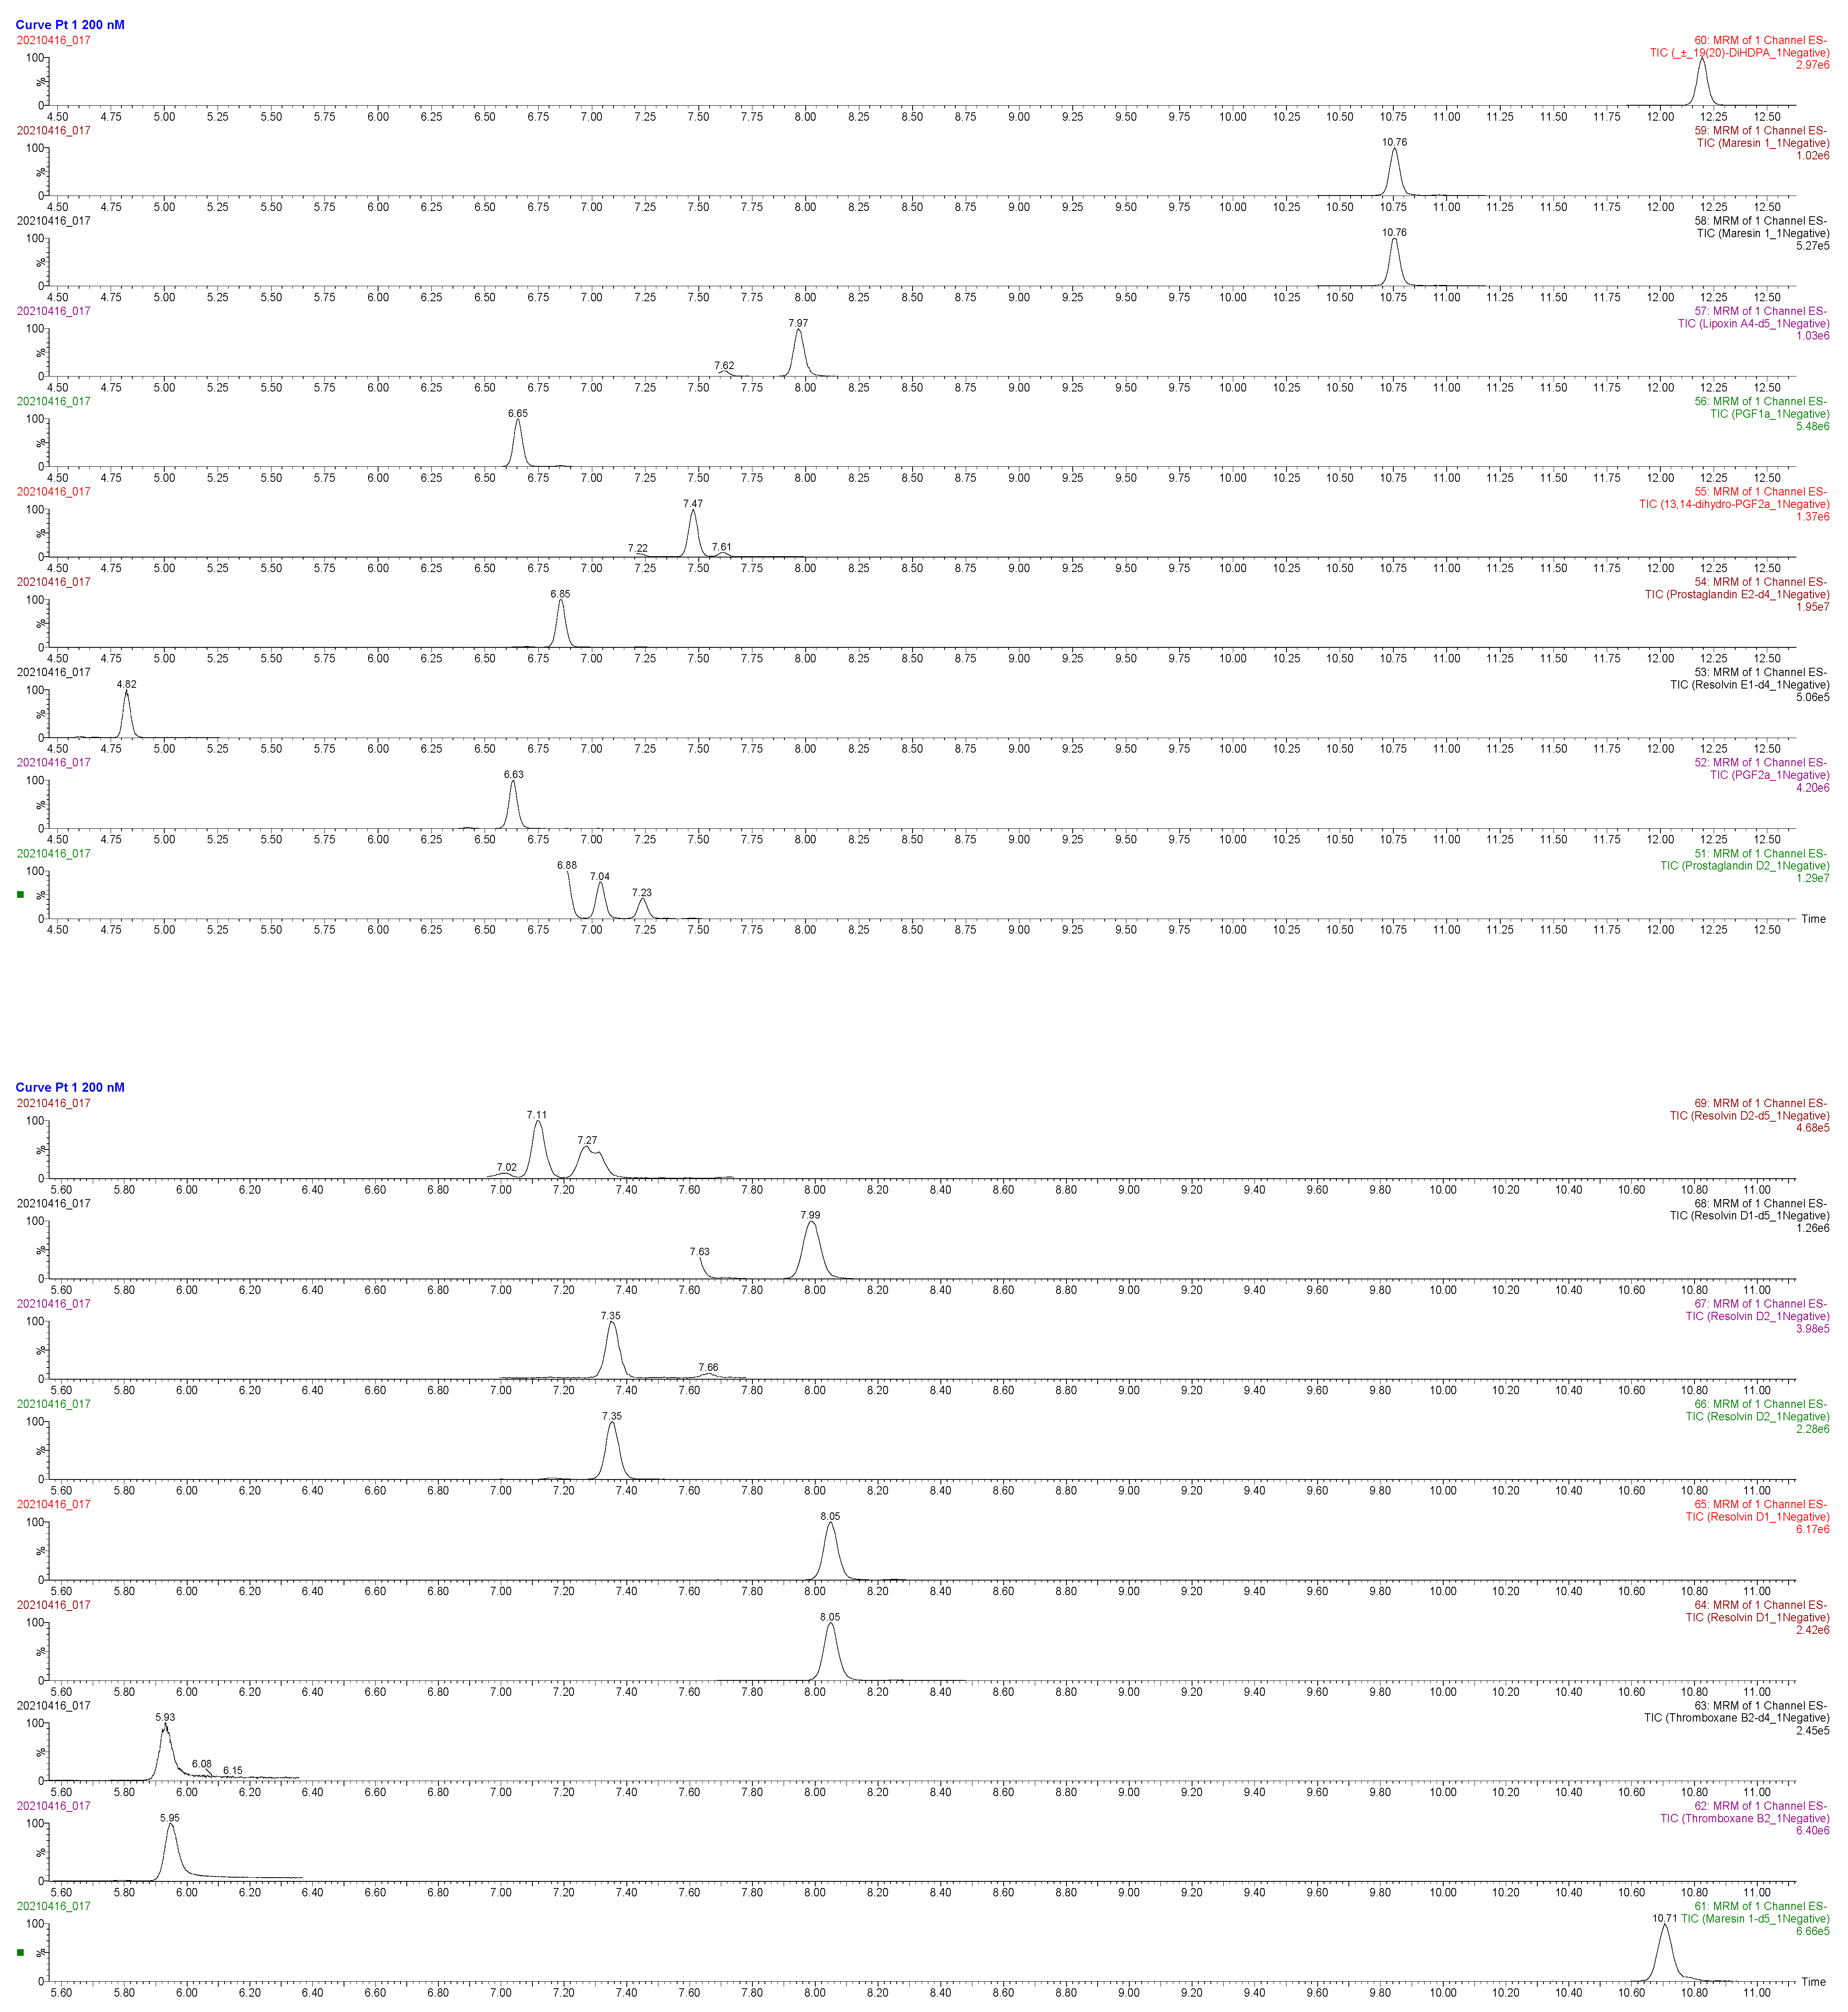
| Compound Name | RT (min) | Precursor Ion m/z | Product Ion m/z | Internal Standard |
|---|---|---|---|---|
| Leukotriene B4 | 11.01 | 335.2 | 195.1 | Leukotriene B4-d4 |
| (±) 7-HDHA | 15.99 | 343.2273 | 201.2 | 15(S)-HETE-d8 |
| (±) 7-HDHA | 15.99 | 343.2273 | 141.1 | 15(S)-HETE-d8 |
| (±) 17-HDHA | 15.35 | 343.2 | 281.3 | 15(S)-HETE-d8 |
| 5-HETE | 16.47 | 319.2 | 115.1 | 15(S)-HETE-d8 |
| (±) 8-HETE | 15.91 | 319.2 | 155.1 | 15(S)-HETE-d8 |
| (±) 9-HETE | 16.14 | 319.2 | 167.1 | 15(S)-HETE-d8 |
| (±) 11-HETE | 15.56 | 319.2 | 167.2 | 15(S)-HETE-d8 |
| (±) 12-HETE | 15.84 | 319.2 | 179.2 | 15(S)-HETE-d8 |
| 15-HETE | 15.16 | 319.2 | 219.2 | 15(S)-HETE-d8 |
| 9(S)-HOTrE | 13.14 | 293.2 | 171.1 | 9-HODE-d4 |
| Lipoxin A4 | 8.03 | 351.2 | 115 | Lipoxin A4-d5 |
| Maresin 1 | 10.79 | 359.2 | 250 | Maresin 1-d5 |
| Maresin 1 | 10.79 | 359.2 | 221 | Maresin 1-d5 |
| Resolvin E1 | 4.88 | 349.2 | 195 | Resolvin E1-d4 |
| Resolvin D1 | 8.08 | 375.2 | 141 | Resolvin D1-d5 |
| Resolvin D1 | 8.08 | 375.2 | 121 | Resolvin D1-d5 |
| Resolvin D2 | 7.39 | 375.2 | 175 | Resolvin D2-d5 |
| Resolvin D2 | 7.39 | 375.2 | 233 | Resolvin D2-d5 |
| Lipoxin A4-d5 | 7.99 | 356.2 | 115 | - |
| 15(S)-HETE-d8 | 15.03 | 327.2 | 182 | - |
| Maresin 1-d5 | 10.74 | 364.2 | 250 | - |
| Resolvin E1-d4 | 4.86 | 353.2 | 197 | - |
| Resolvin D1-d5 | 8.03 | 380.2 | 141 | - |
| Resolvin D2-d5 | 7.35 | 380.2 | 175 | - |
| Leukotriene B4-d4 | 10.96 | 339.2 | 197.1 | - |
| Prostaglandin E2-d4 | 6.88 | 355.2 | 275.2 | - |
| Thromboxane B2-d4 | 5.96 | 373.2 | 173 | - |
| 9-HODE-d4 | 14.74 | 299.2 | 172.1 | - |
| 9-HODE | 14.65 | 295.2 | 171.1 | 9-HODE-d4 |
| 13-HODE | 14.77 | 295.2 | 195.2 | 9-HODE-d4 |
| 5-HEPE | 14.73 | 317.2 | 115.1 | 15(S)-HETE-d8 |
| 9-HEPE | 14.35 | 317.2 | 149 | 15(S)-HETE-d8 |
| 12-HEPE | 14.36 | 317.2 | 179.1 | 15(S)-HETE-d8 |
| 15-HEPE | 13.97 | 317.2 | 219.2 | 15(S)-HETE-d8 |
| 5(S),15(S)-DiHETE | 10.78 | 335.2 | 115.2 | Leukotriene B4-d4 |
| 15(S)-HETrE | 16.14 | 321.2 | 221.2 | 9-HODE-d4 |
| 13-KODE | 15.26 | 293.2 | 113.1 | 9-HODE-d4 |
| CUDA | 11.31 | 339.2 | 214.3 | - |
Appendix C

References
- Shrestha, N.; Sleep, S.L.; Cuffe, J.S.M.; Holland, O.J.; Perkins, A.V.; Yau, S.Y.; McAinch, A.J.; Hryciw, D.H. Role of omega-6 and omega-3 fatty acids in fetal programming. Clin. Exp. Pharmacol. Physiol. 2020, 47, 907–915. [Google Scholar] [CrossRef] [PubMed] [Green Version]
- Dessardo, N.S.; Dessardo, S.; Mustać, E.; Banac, S.; Petrović, O.; Peter, B. Chronic lung disease of prematurity and early childhood wheezing: Is foetal inflammatory response syndrome to blame? Early Hum. Dev. 2014, 90, 493–499. [Google Scholar] [CrossRef] [PubMed]
- Strunk, T.; Inder, T.; Wang, X.; Burgner, D.; Mallard, C.; Levy, O. Infection-induced inflammation and cerebral injury in preterm infants. Lancet Infect. Dis. 2014, 14, 751–762. [Google Scholar] [CrossRef] [Green Version]
- Laker, R.C.; Wlodek, M.E.; Connelly, J.J.; Yan, Z. Epigenetic origins of metabolic disease: The impact of the maternal condition to the offspring epigenome and later health consequences. Food Sci. Hum. Wellness 2013, 2, 1–11. [Google Scholar] [CrossRef] [Green Version]
- Perera, F.; Herbstman, J. Prenatal environmental exposures, epigenetics, and disease. Reprod. Toxicol. 2011, 31, 363–373. [Google Scholar] [CrossRef] [Green Version]
- Emmett, P.M.; Jones, L.R.; Northstone, K. Dietary patterns in the Avon Longitudinal Study of Parents and Children. Nutr. Rev. 2015, 73 (Suppl. 3), 207–230. [Google Scholar] [CrossRef] [PubMed]
- Saccone, G.; Berghella, V. Omega-3 supplementation to prevent recurrent preterm birth: A systematic review and metaanalysis of randomized controlled trials. Am. J. Obstet. Gynecol. 2015, 213, 135–140. [Google Scholar] [CrossRef] [Green Version]
- Olsen, S.F. Is supplementation with marine omega-3 fatty acids during pregnancy a useful tool in the prevention of preterm birth? Clin. Obstet. Gynecol. 2004, 47, 768–774. [Google Scholar] [CrossRef]
- Olsen, S.F.; Secher, N.J. Low consumption of seafood in early pregnancy as a risk factor for preterm delivery: Prospective cohort study. BMJ 2002, 324, 447. [Google Scholar] [CrossRef] [Green Version]
- Olsen, S.F.; Secher, N.J. A possible preventive effect of low-dose fish oil on early delivery and pre-eclampsia: Indications from a 50-year-old controlled trial. Br. J. Nutr. 1990, 64, 599–609. [Google Scholar] [CrossRef]
- Olsen, S.F.; Østerdal, M.L.; Salvig, J.D.; Weber, T.; Tabor, A.; Secher, N.J. Duration of pregnancy in relation to fish oil supplementation and habitual fish intake: A randomised clinical trial with fish oil. Eur. J. Clin. Nutr. 2007, 61, 976–985. [Google Scholar] [CrossRef] [PubMed] [Green Version]
- Middleton, P.; Gomersall, J.C.; Gould, J.F.; Shepherd, E.; Olsen, S.F.; Makrides, M. Omega-3 fatty acid addition during pregnancy. Cochrane Database Syst. Rev. 2018, 11. Available online: https://www.cochranelibrary.com/cdsr/doi/10.1002/14651858.CD003402.pub3/full (accessed on 20 September 2019). [CrossRef] [PubMed]
- Makrides, M.; Gibson, R.A.; McPhee, A.J.; Yelland, L.; Quinlivan, J.; Ryan, P.; DOMInO Investigative Team. Effect of DHA supplementation during pregnancy on maternal depression and neurodevelopment of young children: A randomized controlled trial. JAMA 2010, 304, 1675–1683. [Google Scholar] [CrossRef] [Green Version]
- Nordgren, T.M.; Lyden, E.; Anderson-Berry, A.; Hanson, C. Omega-3 Fatty Acid Intake of Pregnant Women and Women of Childbearing Age in the United States: Potential for Deficiency? Nutrients 2017, 9, 197. [Google Scholar] [CrossRef] [PubMed] [Green Version]
- Carlson, S.E.; Colombo, J.; Gajewski, B.J.; Gustafson, K.M.; Mundy, D.; Yeast, J.; Georgieff, M.K.; Markley, L.A.; Kerling, E.H.; Shaddy, D.J. DHA supplementation and pregnancy outcomes. Am. J. Clin. Nutr. 2013, 97, 808–815. [Google Scholar] [CrossRef] [Green Version]
- Thompson, M.; Hein, N.; Hanson, C.; Smith, L.M.; Anderson-Berry, A.; Richter, C.K.; Stessy Bisselou, K.; Kusi Appiah, A.; Kris-Etherton, P.; Skulas-Ray, A.C.; et al. Omega-3 Fatty Acid Intake by Age, Gender, and Pregnancy Status in the United States: National Health and Nutrition Examination Survey 2003–2014. Nutrients 2019, 11, 177. [Google Scholar] [CrossRef] [Green Version]
- Muhlhausler, B.S.; Ailhaud, G.P. Omega-6 polyunsaturated fatty acids and the early origins of obesity. Curr. Opin. Endocrinol. Diabetes Obes. 2013, 20, 56–61. [Google Scholar] [CrossRef] [Green Version]
- Sleep, S.L.; Shrestha, N.; Cuffe, J.S.M.; Holland, O.J.; Headrick, J.P.; McAinch, A.J.; Hryciw, D.H. The effect of high maternal linoleic acid on endocannabinoid signalling in rodent hearts. J. Dev. Orig. Health Dis. 2020, 11, 617–622. [Google Scholar] [CrossRef] [Green Version]
- Lee, E.; Kim, H.; Kim, H.; Ha, E.-H.; Chang, N. Association of maternal omega-6 fatty acid intake with infant birth outcomes: Korean Mothers and Children’s Environmental Health (MOCEH). Nutr. J. 2018, 17, 47. [Google Scholar] [CrossRef]
- Calder, P.C. Eicosapentaenoic and docosahexaenoic acid derived specialised pro-resolving mediators: Concentrations in humans and the effects of age, sex, disease and increased omega-3 fatty acid intake. Biochimie 2020, 178, 105–123. [Google Scholar] [CrossRef]
- Kikut, J.; Komorniak, N.; Ziętek, M.; Palma, J.; Szczuko, M. Inflammation with the participation of arachidonic (AA) and linoleic acid (LA) derivatives (HETEs and HODEs) is necessary in the course of a normal reproductive cycle and pregnancy. J. Reprod. Immunol. 2020, 141, 103177. [Google Scholar] [CrossRef]
- Ishihara, T.; Yoshida, M.; Arita, M. Omega-3 fatty acid-derived mediators that control inflammation and tissue homeostasis. Int. Immunol. 2019, 31, 559–567. [Google Scholar] [CrossRef] [Green Version]
- Mozurkewich, E.L.; Greenwood, M.; Clinton, C.; Berman, D.; Romero, V.; Djuric, Z.; Qualls, C.; Gronert, K. Pathway Markers for Pro-resolving Lipid Mediators in Maternal and Umbilical Cord Blood: A Secondary Analysis of the Mothers, Omega-3, and Mental Health Study. Front. Pharmacol. 2016, 7, 274. [Google Scholar] [CrossRef] [PubMed] [Green Version]
- Best, K.P.; Gibson, R.A.; Yelland, L.N.; Leemaqz, S.; Gomersall, J.; Liu, G.; Makrides, M. Effect of omega-3 lcpufa supplementation on maternal fatty acid and oxylipin concentrations during pregnancy. Prostaglandins Leukot. Essent. Fat. Acids 2020, 162, 102181. [Google Scholar] [CrossRef]
- Schaible, A.M.; Koeberle, A.; Northoff, H.; Lawrenz, B.; Weinigel, C.; Barz, D.; Werz, O.; Pergola, C. High capacity for leukotriene biosynthesis in peripheral blood during pregnancy. Prostaglandins Leukot. Essent. Fat. Acids 2013, 89, 245–255. [Google Scholar] [CrossRef] [PubMed]
- Haggarty, P. Effect of placental function on fatty acid requirements during pregnancy. Eur. J. Clin. Nutr. 2004, 58, 1559–1570. [Google Scholar] [CrossRef] [PubMed] [Green Version]
- Gouveia-Figueira, S.; Martens, D.S.; Nawrot, T.S.; Nording, M.L. Cord blood eicosanoid signatures and newborn gestational age. Prostaglandins Other Lipid Mediat. 2017, 133, 123–127. [Google Scholar] [CrossRef] [PubMed]
- Ramsden, C.E.; Makrides, M.; Yuan, Z.-X.; Horowitz, M.S.; Zamora, D.; Yelland, L.N.; Best, K.; Jensen, J.; Taha, A.Y.; Gibson, R.A. Plasma oxylipins and unesterified precursor fatty acids are altered by DHA supplementation in pregnancy: Can they help predict risk of preterm birth? Prostaglandins Leukot. Essent. Fat. Acids 2020, 153, 102041. [Google Scholar] [CrossRef] [PubMed] [Green Version]
- Welch, B.M.; Keil, A.P.; van ’t Erve, T.J.; Deterding, L.J.; Williams, J.G.; Lih, F.B.; Cantonwine, D.E.; McElrath, T.F.; Ferguson, K.K. Longitudinal profiles of plasma eicosanoids during pregnancy and size for gestational age at delivery: A nested case-control study. PLoS Med. 2020, 17, e1003271. [Google Scholar] [CrossRef]
- Yuan, D.; Ran, Y.; Liu, Q.; Zhang, Y.; Li, H.; Li, P.; Zhu, D. Enhancement of the HIF-1α/15-LO/15-HETE Axis Promotes Hypoxia-Induced Endothelial Proliferation in Preeclamptic Pregnancy. PLoS ONE 2014, 9, e96510. [Google Scholar] [CrossRef]
- Fang, X.; Kaduce, T.L.; Spector, A.A. 13-(S)-Hydroxyoctadecadienoic acid (13-HODE) incorporation and conversion to novel products by endothelial cells. J. Lipid Res. 1999, 40, 699–707. [Google Scholar] [CrossRef]
- Serhan, C.N. Discovery of specialized pro-resolving mediators marks the dawn of resolution physiology and pharmacology. Mol. Asp. Med. 2017, 58, 1–11. [Google Scholar] [CrossRef]
- Gabbs, M.; Leng, S.; Devassy, J.G.; Monirujjaman, M.; Aukema, H.M. Advances in Our Understanding of Oxylipins Derived from Dietary PUFAs. Adv. Nutr. 2015, 6, 513–540. [Google Scholar] [CrossRef] [Green Version]
- Kogure, R.; Toyama, K.; Hiyamuta, S.; Kojima, I.; Takeda, S. 5-Hydroxy-eicosapentaenoic acid is an endogenous GPR119 agonist and enhances glucose-dependent insulin secretion. Biochem. Biophys. Res. Commun. 2011, 416, 58–63. [Google Scholar] [CrossRef] [PubMed]
- Zhang, M.; Sayyad, A.A.; Dhesi, A.; Orellana, A. Enantioselective Synthesis of 7(S)-Hydroxydocosahexaenoic Acid, a Possible Endogenous Ligand for PPARα. J. Org. Chem. 2020, 85, 13621–13629. [Google Scholar] [CrossRef] [PubMed]
- Suitor, C.J.; Gardner, J.; Willett, W.C. A comparison of food frequency and diet recall methods in studies of nutrient intake of low-income pregnant women. J. Am. Diet. Assoc. 1989, 89, 1786–1794. [Google Scholar] [CrossRef]
- Rimm, E.B.; Giovannucci, E.L.; Stampfer, M.J.; Colditz, G.A.; Litin, L.B.; Willett, W.C. Reproducibility and validity of an expanded self-administered semiquantitative food frequency questionnaire among male health professionals. Am. J. Epidemiol. 1992, 135, 1114–1126. [Google Scholar] [CrossRef] [PubMed]
- McCloskey, K.; Ponsonby, A.-L.; Collier, F.; Allen, K.; Tang, M.L.K.; Carlin, J.B.; Saffery, R.; Skilton, M.R.; Cheung, M.; Ranganathan, S.; et al. The association between higher maternal pre-pregnancy body mass index and increased birth weight, adiposity and inflammation in the newborn. Pediatr. Obes. 2018, 13, 46–53. [Google Scholar] [CrossRef]
- Pereira, P.P.d.S.; Da Mata, F.A.F.; Figueiredo, A.C.G.; de Andrade, K.R.C.; Pereira, M.G. Maternal Active Smoking During Pregnancy and Low Birth Weight in the Americas: A Systematic Review and Meta-analysis. Nicotine Tob. Res. 2017, 19, 497–505. [Google Scholar] [CrossRef]
- Yang, J.; Schmelzer, K.; Georgi, K.; Hammock, B.D. Quantitative profiling method for oxylipin metabolome by liquid chromatography electrospray ionization tandem mass spectrometry. Anal. Chem. 2009, 81, 8085–8093. [Google Scholar] [CrossRef] [Green Version]
- Strassburg, K.; Huijbrechts, A.M.L.; Kortekaas, K.A.; Lindeman, J.H.; Pedersen, T.L.; Dane, A.; Berger, R.; Brenkman, A.; Hankemeier, T.; van Duynhoven, J.; et al. Quantitative profiling of oxylipins through comprehensive LC-MS/MS analysis: Application in cardiac surgery. Anal. Bioanal. Chem. 2012, 404, 1413–1426. [Google Scholar] [CrossRef] [PubMed] [Green Version]
- MacLean, B.; Tomazela, D.M.; Shulman, N.; Chambers, M.; Finney, G.L.; Frewen, B.; Kern, R.; Tabb, D.L.; Liebler, D.C.; MacCoss, M.J. Skyline: An open source document editor for creating and analyzing targeted proteomics experiments. Bioinformatics 2010, 26, 966–968. [Google Scholar] [CrossRef] [PubMed] [Green Version]
- Jackson, K.H.; Klatt, K.C.; Caudill, M.A.; McDougall, M.Q.; West, A.A.; Perry, C.A.; Malysheva, O.V.; Harris, W.S. Baseline red blood cell and breast milk DHA levels affect responses to standard dose of DHA in lactating women on a controlled feeding diet. Prostaglandins Leukot. Essent. Fat. Acids 2021, 166, 102248. [Google Scholar] [CrossRef] [PubMed]

| Maternal Daily Intake of FAs | ||
|---|---|---|
| FAs | Median (g/Day) [IQR] | n |
| AA | 0.15 [0.11] | 103 |
| LA | 13.06 [7.91] | 103 |
| ALA | 1.42 [0.75] | 103 |
| Gamma (γ)-LA | 0.010 [0.01] | 103 |
| EPA | 0.020 [0.06] | 103 |
| DPA | 0.020 [0.03] | 103 |
| DHA | 0.090 [0.15] | 103 |
| Total Omega n-3 (EPA + DHA + ALA + supplementation) | 1.72 [1.01] | 103 |
| Total n-6 | 14.46 [7.43] | 103 |
| Ratio of n-6:n-3 | 8.73 [1.79] | 102 |
| Race | % | n |
|---|---|---|
| White | 62.18 | 74 |
| African American | 19.33 | 23 |
| Hispanic | 5.88 | 7 |
| Asian or Pacific islander | 0.84 | 1 |
| American Indian | 0.84 | 1 |
| Other/unknown | 10.92 | 13 |
| Obesity | % | n |
| <30 kg/m2 | 72.28 | 73 |
| ≥30 kg/m2 | 27.72 | 28 |
| Delivery Mode | % | n |
| Caesarian Section (C/S) | 25.42 | 30 |
| Vaginal | 74.58 | 88 |
| Maternal Smoking Status | % | n |
| None | 77.97 | 92 |
| Current smoker (at delivery) | 11.02 | 13 |
| Former smoker | 11.02 | 13 |
| Fish Oil/DHA Supplementation | % | n |
| No | 79.31 | 92 |
| Yes | 20.69 | 24 |
| n | Mean (SD) | Median [IQR] | |
|---|---|---|---|
| Gestational age, weeks | 119 | 38.17 (3.29) | 39.20 [2.00] |
| Birthweight, kilograms (kg) | 118 | 3.21 (0.77) | 3.35 [0.80] |
| Birthweight percentile (%) | 115 | 56.58 (28.86) | 60.77 [45.69] |
| Head circumference, centimeters (cm) | 115 | 34.09 (2.29) | 34.30 [2.60] |
| Head circumference percentile (%) | 115 | 58.5 (32.26) | 63.58 [57.03] |
| Birth length, cm | 114 | 49.1 (8.06) | 49.50 [2.80] |
| Birth length percentile (%) | 113 | 52.46 (33.41) | 55.90 [61.30] |
| Sex | n | (%) | |
| Female | 53 | 44.54 | |
| Male | 66 | 55.46 | |
| Maternal Parent Nutrient | Metabolite | n | rs | p-Value |
|---|---|---|---|---|
| Maternal Blood | ||||
| LA | 13-HODE | 52 | 0.097 | 0.49 |
| 9-HODE | 54 | −0.086 | 0.54 | |
| 13-KODE | 47 | −0.15 | 0.33 | |
| DGLA | 15-HETrE | 55 | 0.027 | 0.84 |
| AA | 5-HETE | 51 | −0.094 | 0.51 |
| 8-HETE | 54 | −0.032 | 0.82 | |
| 9-HETE | 54 | −0.067 | 0.63 | |
| 11-HETE | 54 | −0.073 | 0.60 | |
| 12-HETE | 55 | −0.068 | 0.62 | |
| 15-HETE | 43 | −0.24 | 0.11 | |
| Lipoxin A4 | 36 | 0.095 | 0.58 | |
| 5,15-DiHETE | 19 | −0.41 | 0.079 | |
| Cord Blood | ||||
| LA | 13-HODE | 56 | 0.02 | 0.83 |
| 9-HODE | 56 | 0.056 | 0.68 | |
| 13-KODE | 51 | −0.096 | 0.50 | |
| DGLA | 15-HETrE | 56 | −0.19 | 0.16 |
| AA | 5-HETE | 55 | −0.15 | 0.27 |
| 8-HETE | 56 | −0.24 | 0.074 | |
| 9-HETE | 56 | −0.16 | 0.25 | |
| 11-HETE | 56 | −0.23 | 0.083 | |
| 12-HETE | 50 | −0.072 | 0.62 | |
| 15-HETE | 55 | −0.29 | 0.030 * | |
| Lipoxin A4 | 47 | −0.40 | 0.0060 * | |
| 5,15-DiHETE | 33 | 0.051 | 0.78 | |
| Precursor | Metabolite | Source | Median (nM) [IQR] | Rho (rs) | p-Value |
|---|---|---|---|---|---|
| LA | 9-HODE | Maternal | 18.94 [19.57] | 0.091 | 0.37 |
| Cord | 9.83 [6.40] | ||||
| LA | 13-HODE | Maternal | 20.99 [14.56] | 0.22 | 0.029 * |
| Cord | 12.87 [8.70] | ||||
| LA | 13-KODE | Maternal | 2.31 [2.50] | 0.25 | 0.018 * |
| Cord | 1.44 [0.90] | ||||
| DGLA | 15-HETrE | Maternal | 0.72 [0.83] | 0.31 | 0.0011 * |
| Cord | 1.40 [1.09] | ||||
| AA | 5-HETE | Maternal | 5.86 [9.51] | 0.49 | <0.001 * |
| Cord | 5.86 [5.30] | ||||
| AA | 8-HETE | Maternal | 1.33 [1.76] | 0.42 | <0.001 * |
| Cord | 2.08 [1.36] | ||||
| AA | 9-HETE | Maternal | 1.06 [1.89] | 0.37 | 0.0001 * |
| Cord | 2.24 [1.53] | ||||
| AA | 11-HETE | Maternal | 1.81 [2.55] | 0.41 | <0.001 * |
| Cord | 2.42 [2.68] | ||||
| AA | 12-HETE | Maternal | 3.84 [6.59] | 0.26 | 0.0089 * |
| Cord | 8.32 [16.43] | ||||
| AA | 15-HETE | Maternal | 3.95 [5.62] | 0.65 | <0.001 * |
| Cord | 5.27 [5.22] | ||||
| AA | 5,15-DiHETE | Maternal | 0.27 [1.31] | 0.75 | <0.001 * |
| Cord | 0.16 [0.26] | ||||
| AA | Lipoxin A4 | Maternal | 10.29 [11.73] | 0.12 | 0.31 |
| Cord | 7.67 [7.61] |
| Maternal Parent Nutrient | Metabolite | n | rs | p-Value |
|---|---|---|---|---|
| Maternal Blood | ||||
| ALA | 9-HOTrE | 56 | 0.011 | 0.94 |
| EPA | 5-HEPE | 55 | 0.26 | 0.06 |
| 9-HEPE | − | − | -- | |
| 12-HEPE | 44 | 0.036 | 0.81 | |
| 15-HEPE | 28 | −0.22 | 0.27 | |
| DHA | 7-HDHA | 25 | −0.28 | 0.18 |
| 17-HDHA | 39 | −0.34 | 0.035 * | |
| Cord Blood | ||||
| ALA | 9-HOTrE | 55 | 0.25 | 0.25 |
| EPA | 5-HEPE | 56 | 0.11 | 0.41 |
| 9-HEPE | − | − | - | |
| 12-HEPE | 49 | −0.057 | 0.70 | |
| 15-HEPE | 24 | 0.29 | 0.18 | |
| DHA | 7-HDHA | 44 | −0.0020 | 0.99 |
| 17-HDHA | 46 | −0.34 | 0.023 * | |
| Precursor | Metabolite | Source | Median (nM) [IQR] | rs | p-Value |
|---|---|---|---|---|---|
| ALA | 9-HOTrE | Maternal | 1.46 [1.60] | 0.19 | 0.065 |
| Cord | 0.47 [0.31] | ||||
| EPA | 5-HEPE | Maternal | 0.40 [0.61] | 0.48 | <0.001 * |
| Cord | 0.39 [0.29] | ||||
| EPA | 9-HEPE | Maternal | 0.19 [0.48] | 0.36 | 0.080 |
| Cord | 0.12 [0.06] | ||||
| EPA | 12-HEPE | Maternal | 0.34 [0.82] | 0.0046 | 0.97 |
| Cord | 0.25 [0.91] | ||||
| EPA | 15-HEPE | Maternal | 0.29 [0.27] | 0.14 | 0.40 |
| Cord | 0.20 [0.14] | ||||
| DHA | 17-HDHA | Maternal | 1.83 [2.63] | 0.53 | <0.001 * |
| Cord | 2.16 [1.94] | ||||
| DHA | 7-HDHA | Maternal | 1.36 [2.54] | 0.56 | <0.001 * |
| Cord | 1.16 [0.93] |
| Intake | Metabolite | rs | p-Value |
|---|---|---|---|
| n-6: n-3 Ratio | Maternal 15-HETE | −0.24 | 0.03 |
| Maternal 17-HDHA | −0.25 | 0.03 | |
| Total n-6 | Cord 15-HETE | 0.26 | 0.01 |
| DHA | Maternal 9-HEPE | 0.36 | 0.033 |
| Maternal 7-HDHA | 0.36 | 0.003 | |
| Maternal 17-HDHA | 0.28 | 0.015 | |
| Total n-3 | Cord 17-HDHA | 0.22 | 0.04 |
| Growth Metric | Metabolite | rs | p-Value |
|---|---|---|---|
| Birth Weight Percentile | Cord 9-HETE | −0.311 | 0.0012 |
| Maternal 12-HETE | −0.20 | 0.040 | |
| Maternal 15-HETE | −0.21 | 0.043 | |
| Maternal 5,15-DiHETE | −0.34 | 0.016 | |
| Birth Length Percentile | Cord 11-HETE | 0.22 | 0.028 |
| Maternal 15-HETE | −0.21 | 0.046 | |
| Cord 9-HODE | 0.21 | 0.029 | |
| Cord 13-HODE | 0.22 | 0.026 | |
| Cord 13-KODE | 0.21 | 0.045 | |
| Birth Head Circumference Percentile | Cord 9-HETE | −0.22 | 0.023 |
| Linear Regression | |||
| Growth Metric | Metabolite | Beta (β) | p-Value |
| Birth Length Percentile | Cord 9-HODE | 0.13 | 0.039 |
| Cord 13-HODE | 0.20 | 0.0014 | |
| Cord 13-KODE | 0.19 | 0.016 | |
| Birth Weight Percentile | Maternal 5,15-DiHETE | −0.041 | 0.047 |
| Growth Metric | Metabolite | rs | p-Value |
|---|---|---|---|
| Birth Weight Percentile | Maternal 5-HEPE | −0.20 | 0.042 |
| Maternal 12-HEPE | −0.28 | 0.023 | |
| Maternal 15-HEPE | −0.32 | 0.0089 | |
| Maternal 7-HDHA | −0.34 | 0.0033 | |
| Birth Length Percentile | Cord 5-HEPE | 0.21 | 0.036 |
| Birth Head Circumference Percentile | Maternal 7 HDHA | −0.29 | 0.016 |
| Linear Regression | |||
| Growth Metrics | Metabolite | Beta (β) | p-Value |
| Birth Length Percentile | Cord 5-HEPE | 0.12 | 0.025 |
| Birth Weight Percentile | Maternal 7-HDHA | −0.062 | 0.025 |
| Gestational Age | Measured in Weeks |
|---|---|
| Birth weight | Measured in grams immediately following birth |
| Birth length | Measured in centimeters immediately following birth |
| Head circumference | Measured in centimeters immediately following birth |
| Birth weight percentile | The WHO growth standards are used to calculate birth weight percentile. Out of 100 infants the same age, an infant in the 50th percentile will have 50 infants smaller and 50 infants larger than them |
| Birth length percentile | The WHO growth standards are used to calculate the birth length percentile. Out of 100 infants the same age, an infant in the 50th percentile will have 50 infants shorter and 50 infants longer than them |
| Head circumference percentile | The WHO growth standards are used to calculate the head circumference percentile. Out of 100 infants the same age, an infant in the 50th percentile for head circumference will have 50 infants with smaller heads and 50 infants with larger heads |
| Maternal Smoking Status | Never smoker: the mother never smoked |
| Current/Former smoker: the mother reported previously smoking or smoking at the time of delivery | |
| BMI Categorization | Not obese: BMI ≤ 30 kg/m2 |
| Obese: BMI > 30 kg/m2 | |
| Delivery mode | Vaginal |
| Caesarean |
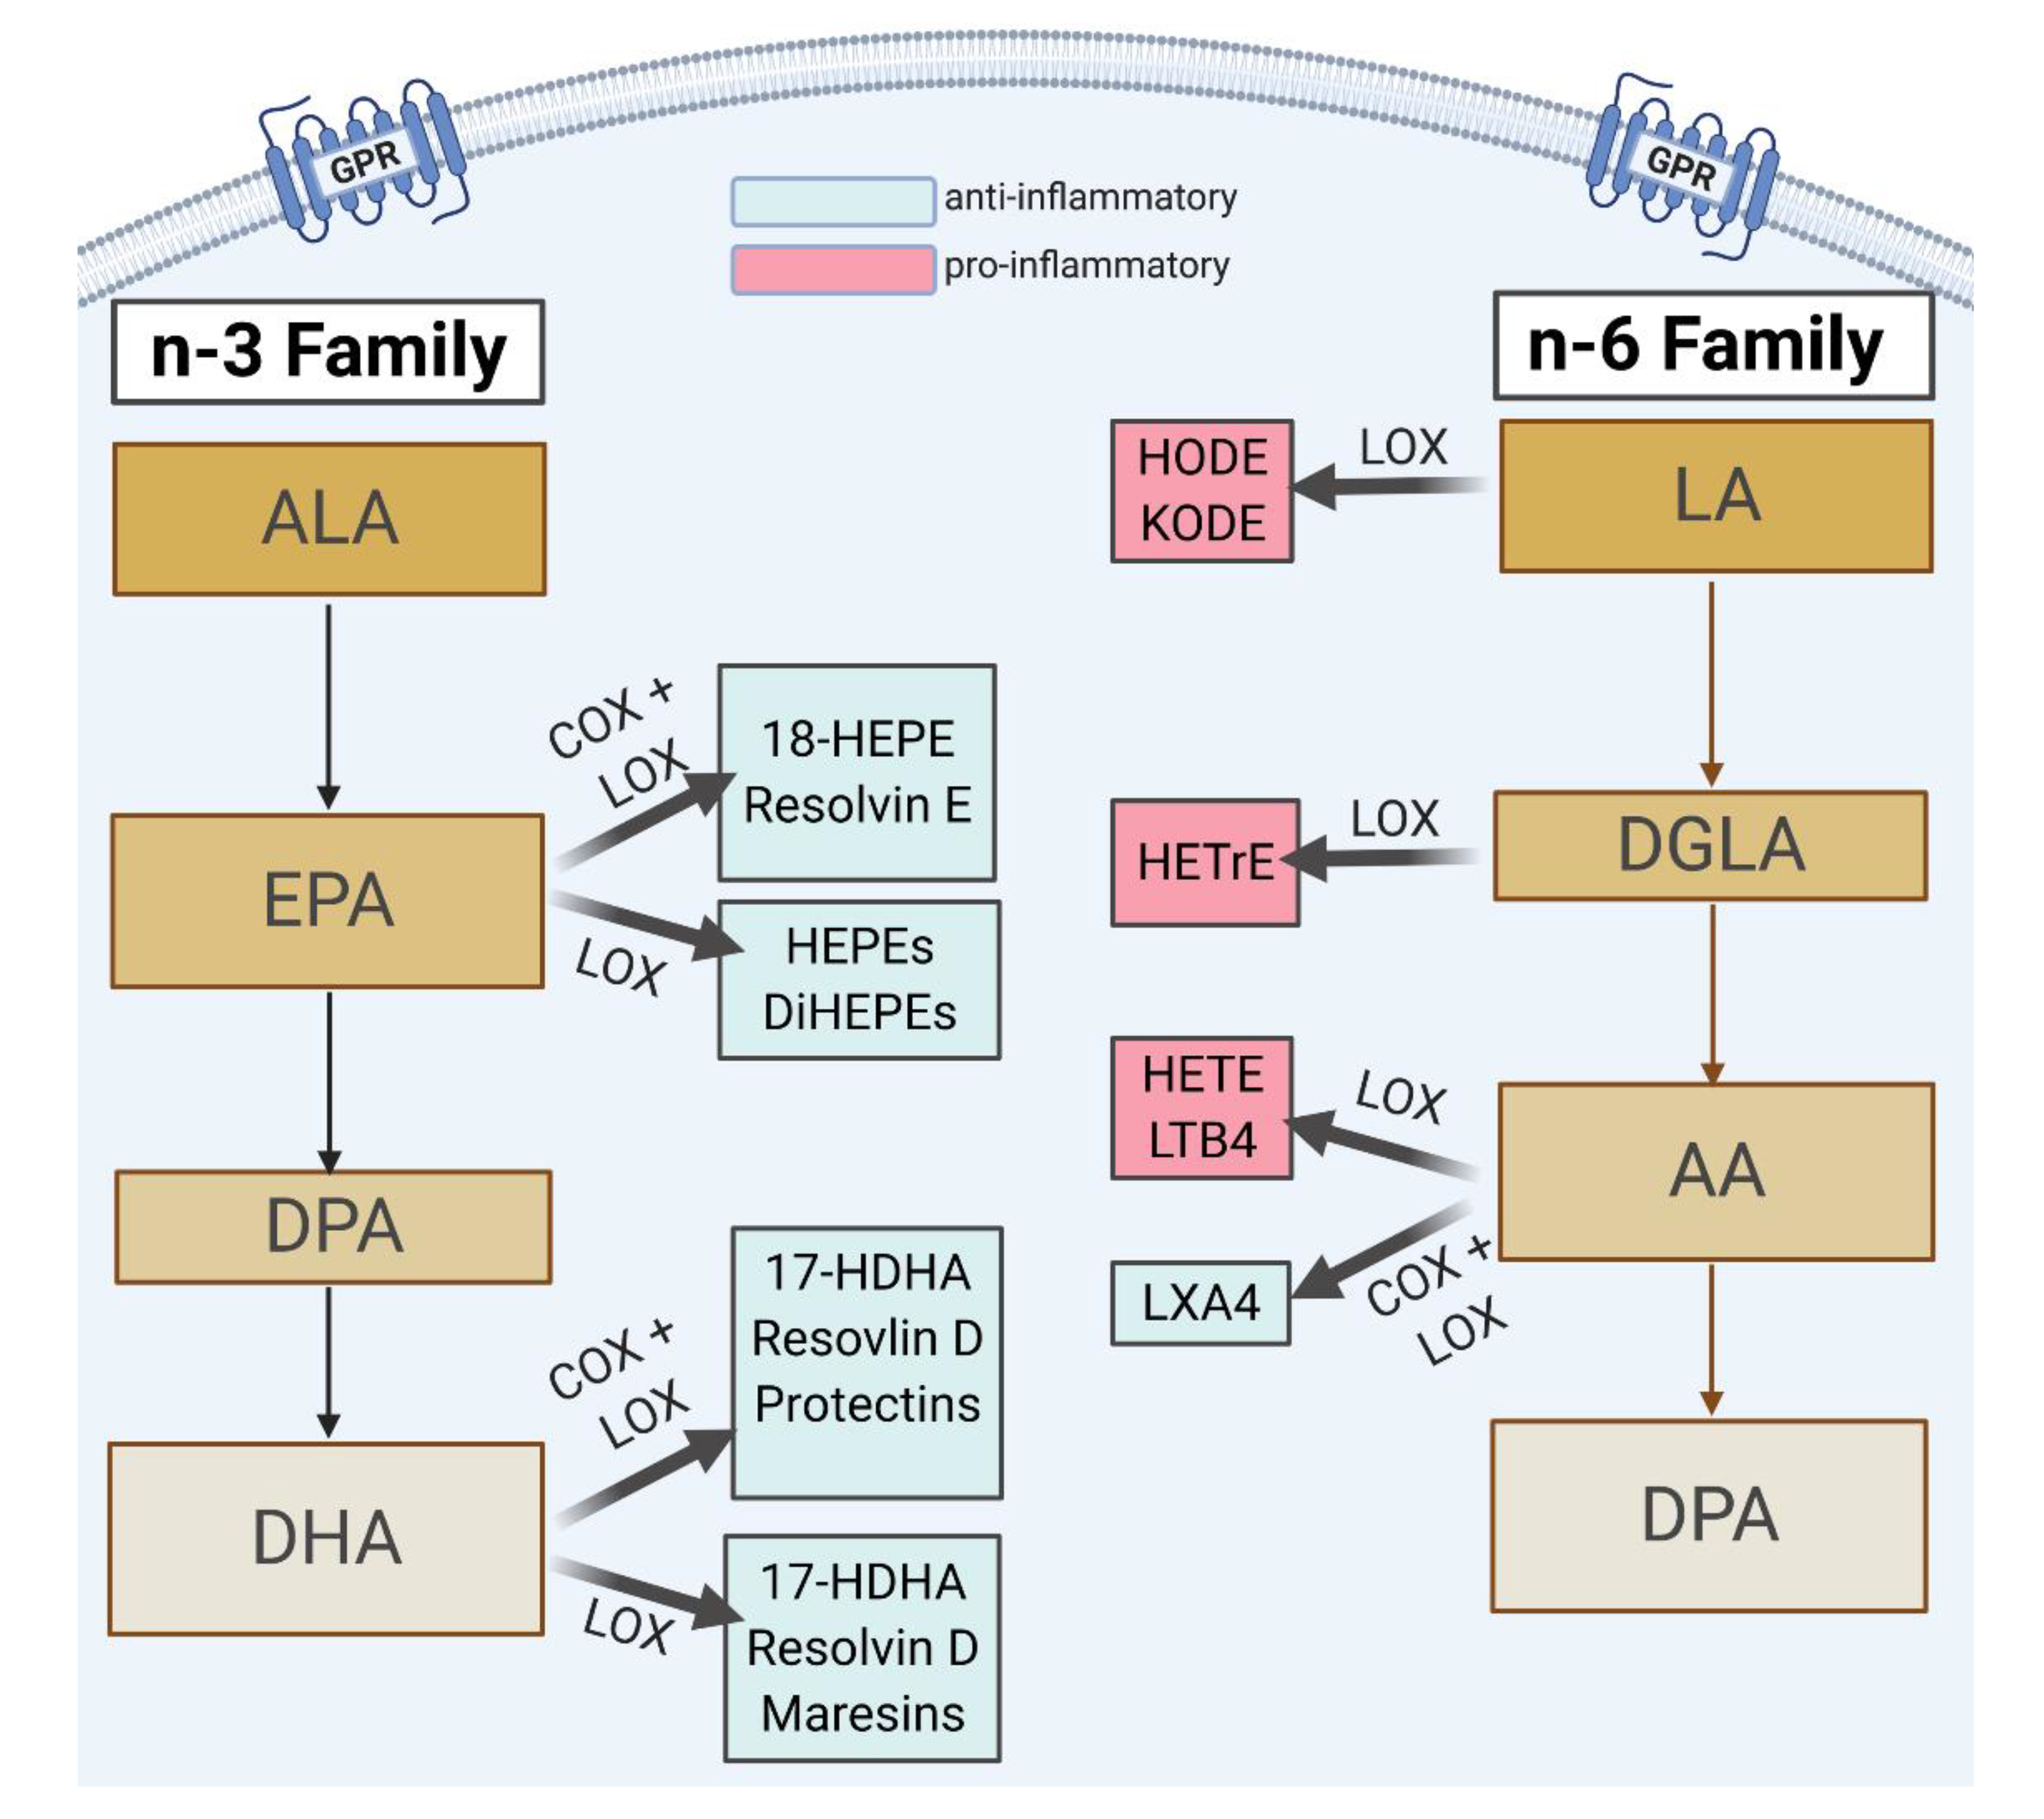
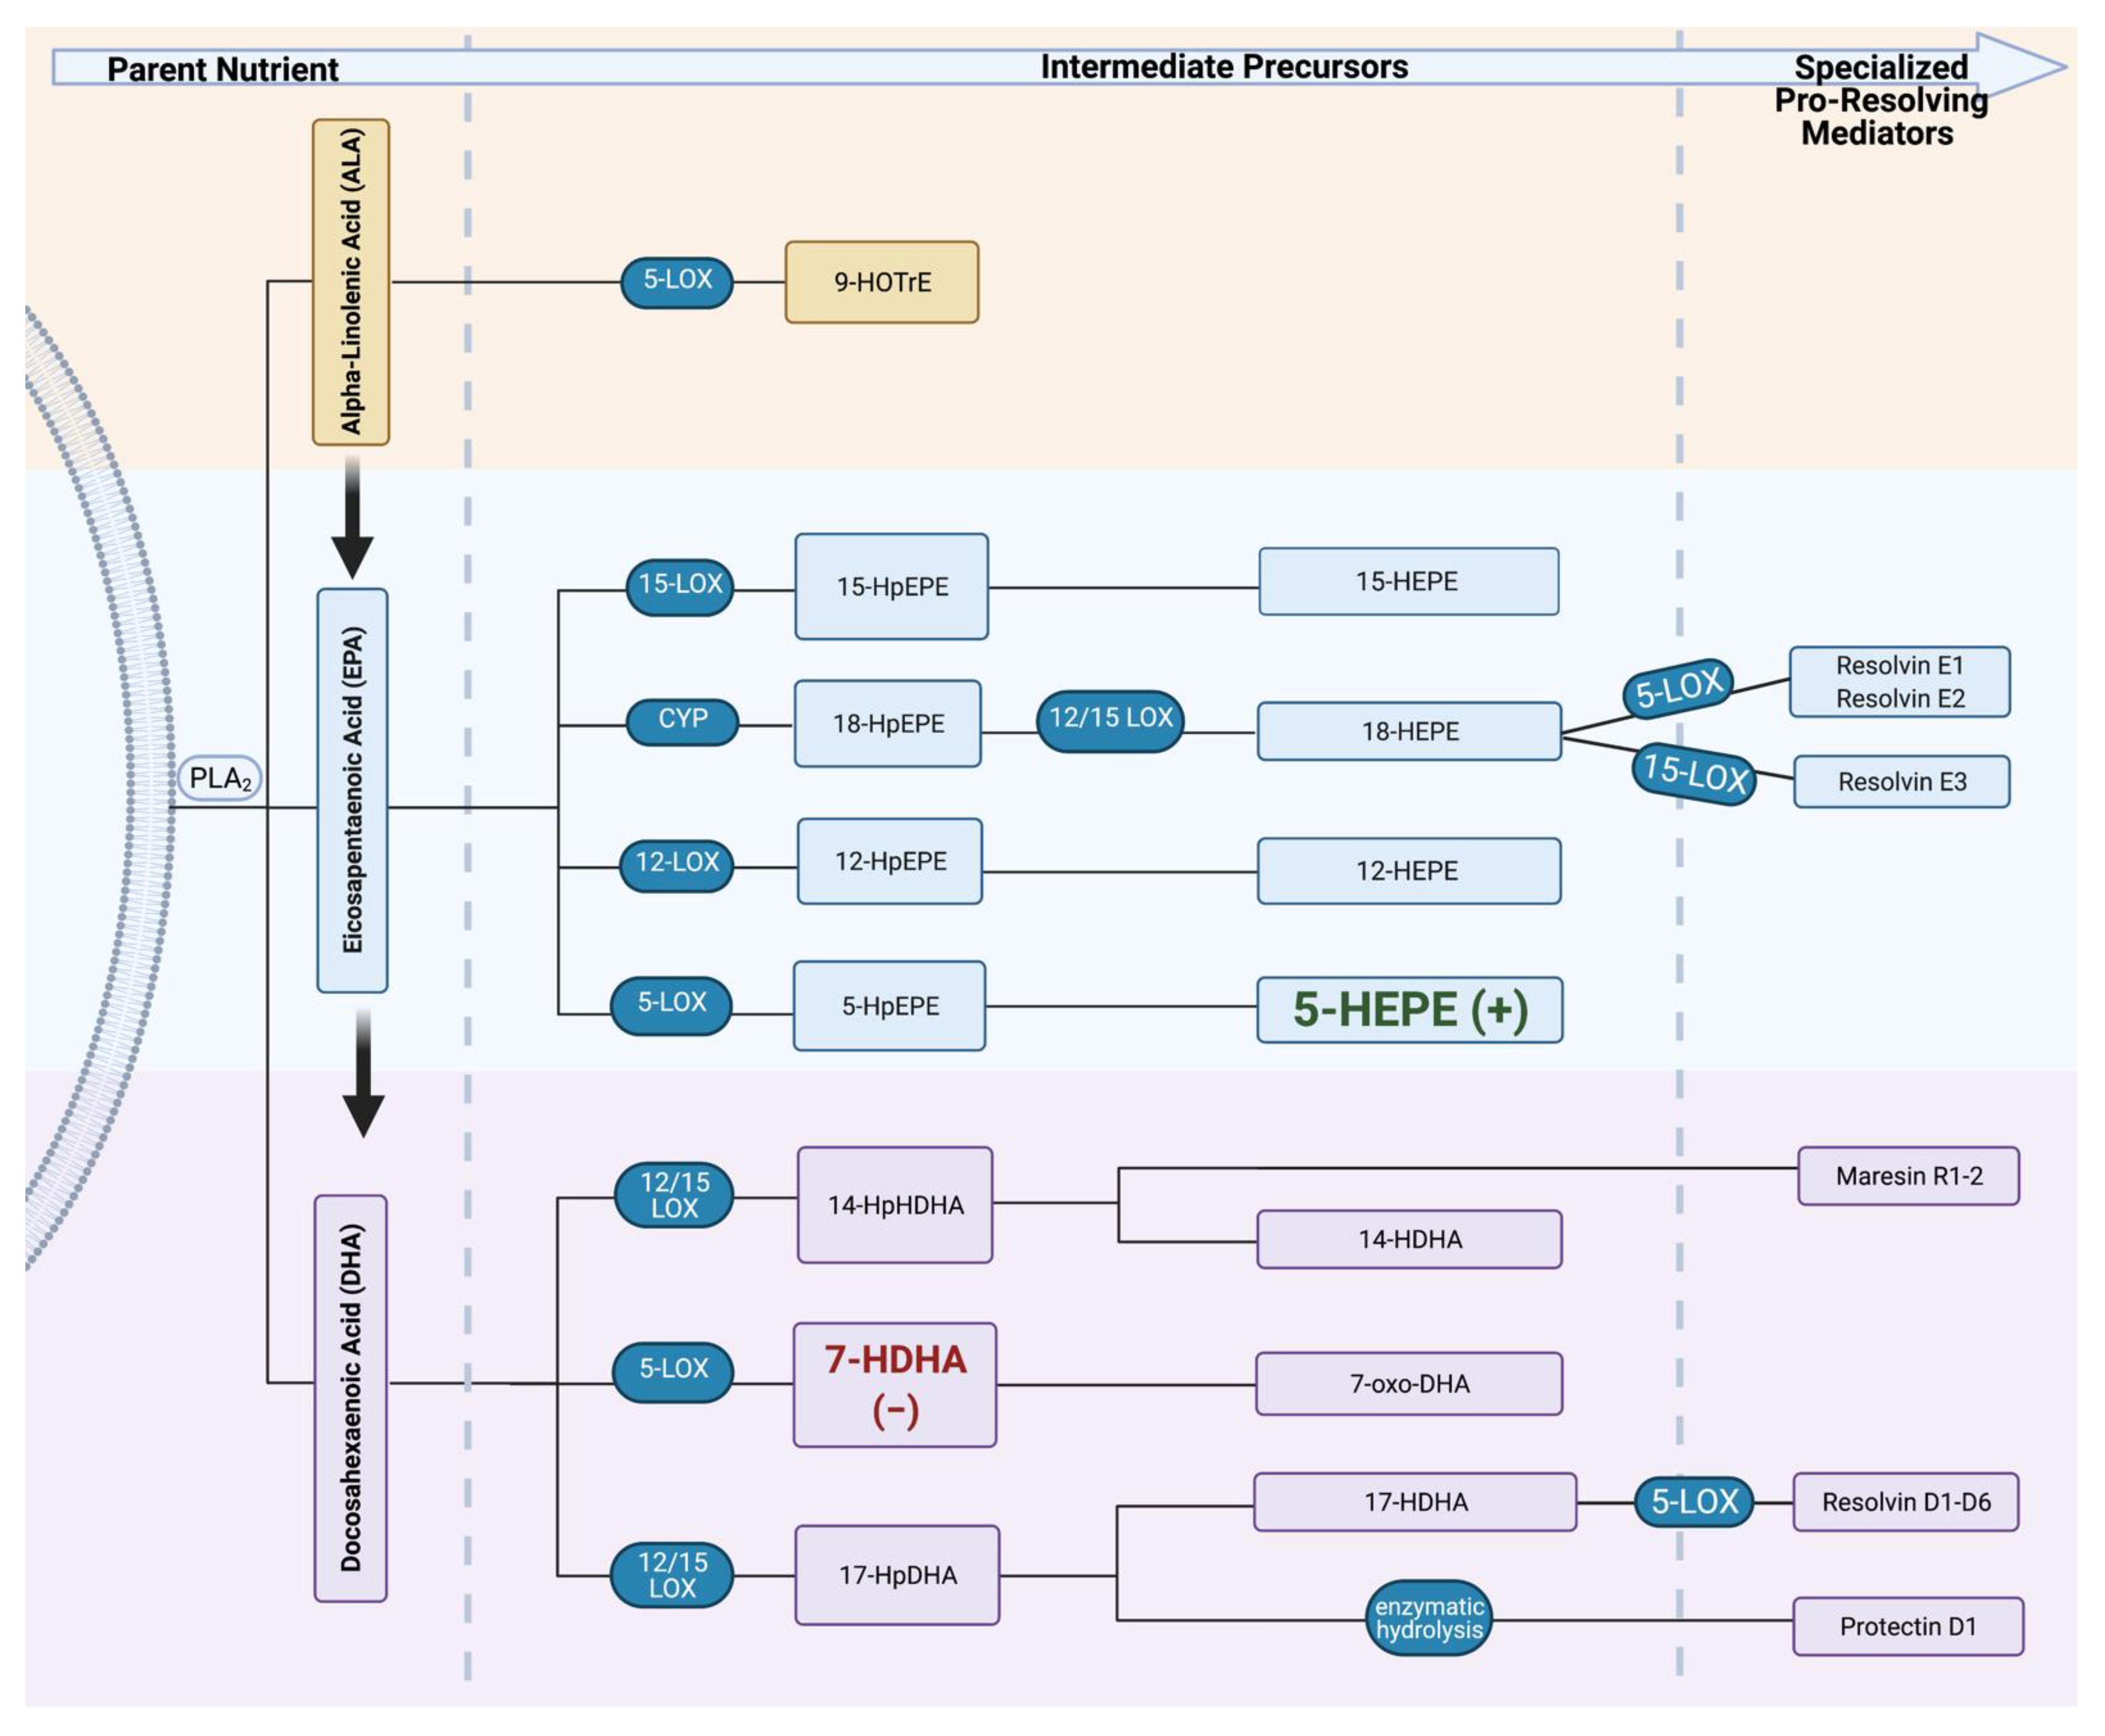
| Parent Nutrient | Metabolites | Abbreviation | Expected Effect |
|---|---|---|---|
| ALA | 9-hydroxyoctadecatrenoic acid | 9-HOTrE | Anti-inflammatory |
| EPA | 5-hydroxyeicosapentaenoic acid | 5-HEPE | |
| 12-hydroxyeicosapentaenoic acid | 12-HEPE | ||
| 15-hydroxyeicosapentaenoic acid | 15-HEPE | ||
| 18-hydroxyeicosapentaenoic acid | 18-HEPE | ||
| Resolvin E1 | RvE1 | ||
| DHA | 17-hydroxydocosahexaenoic acid | 17-HDHA | |
| 7-hydroxydocosahexaenoic acid | 7-HDHA | ||
| Resolvin D1 | RvD1 | ||
| Resolvin D2 | RvD2 | ||
| Maresin 1 | MaR1 |
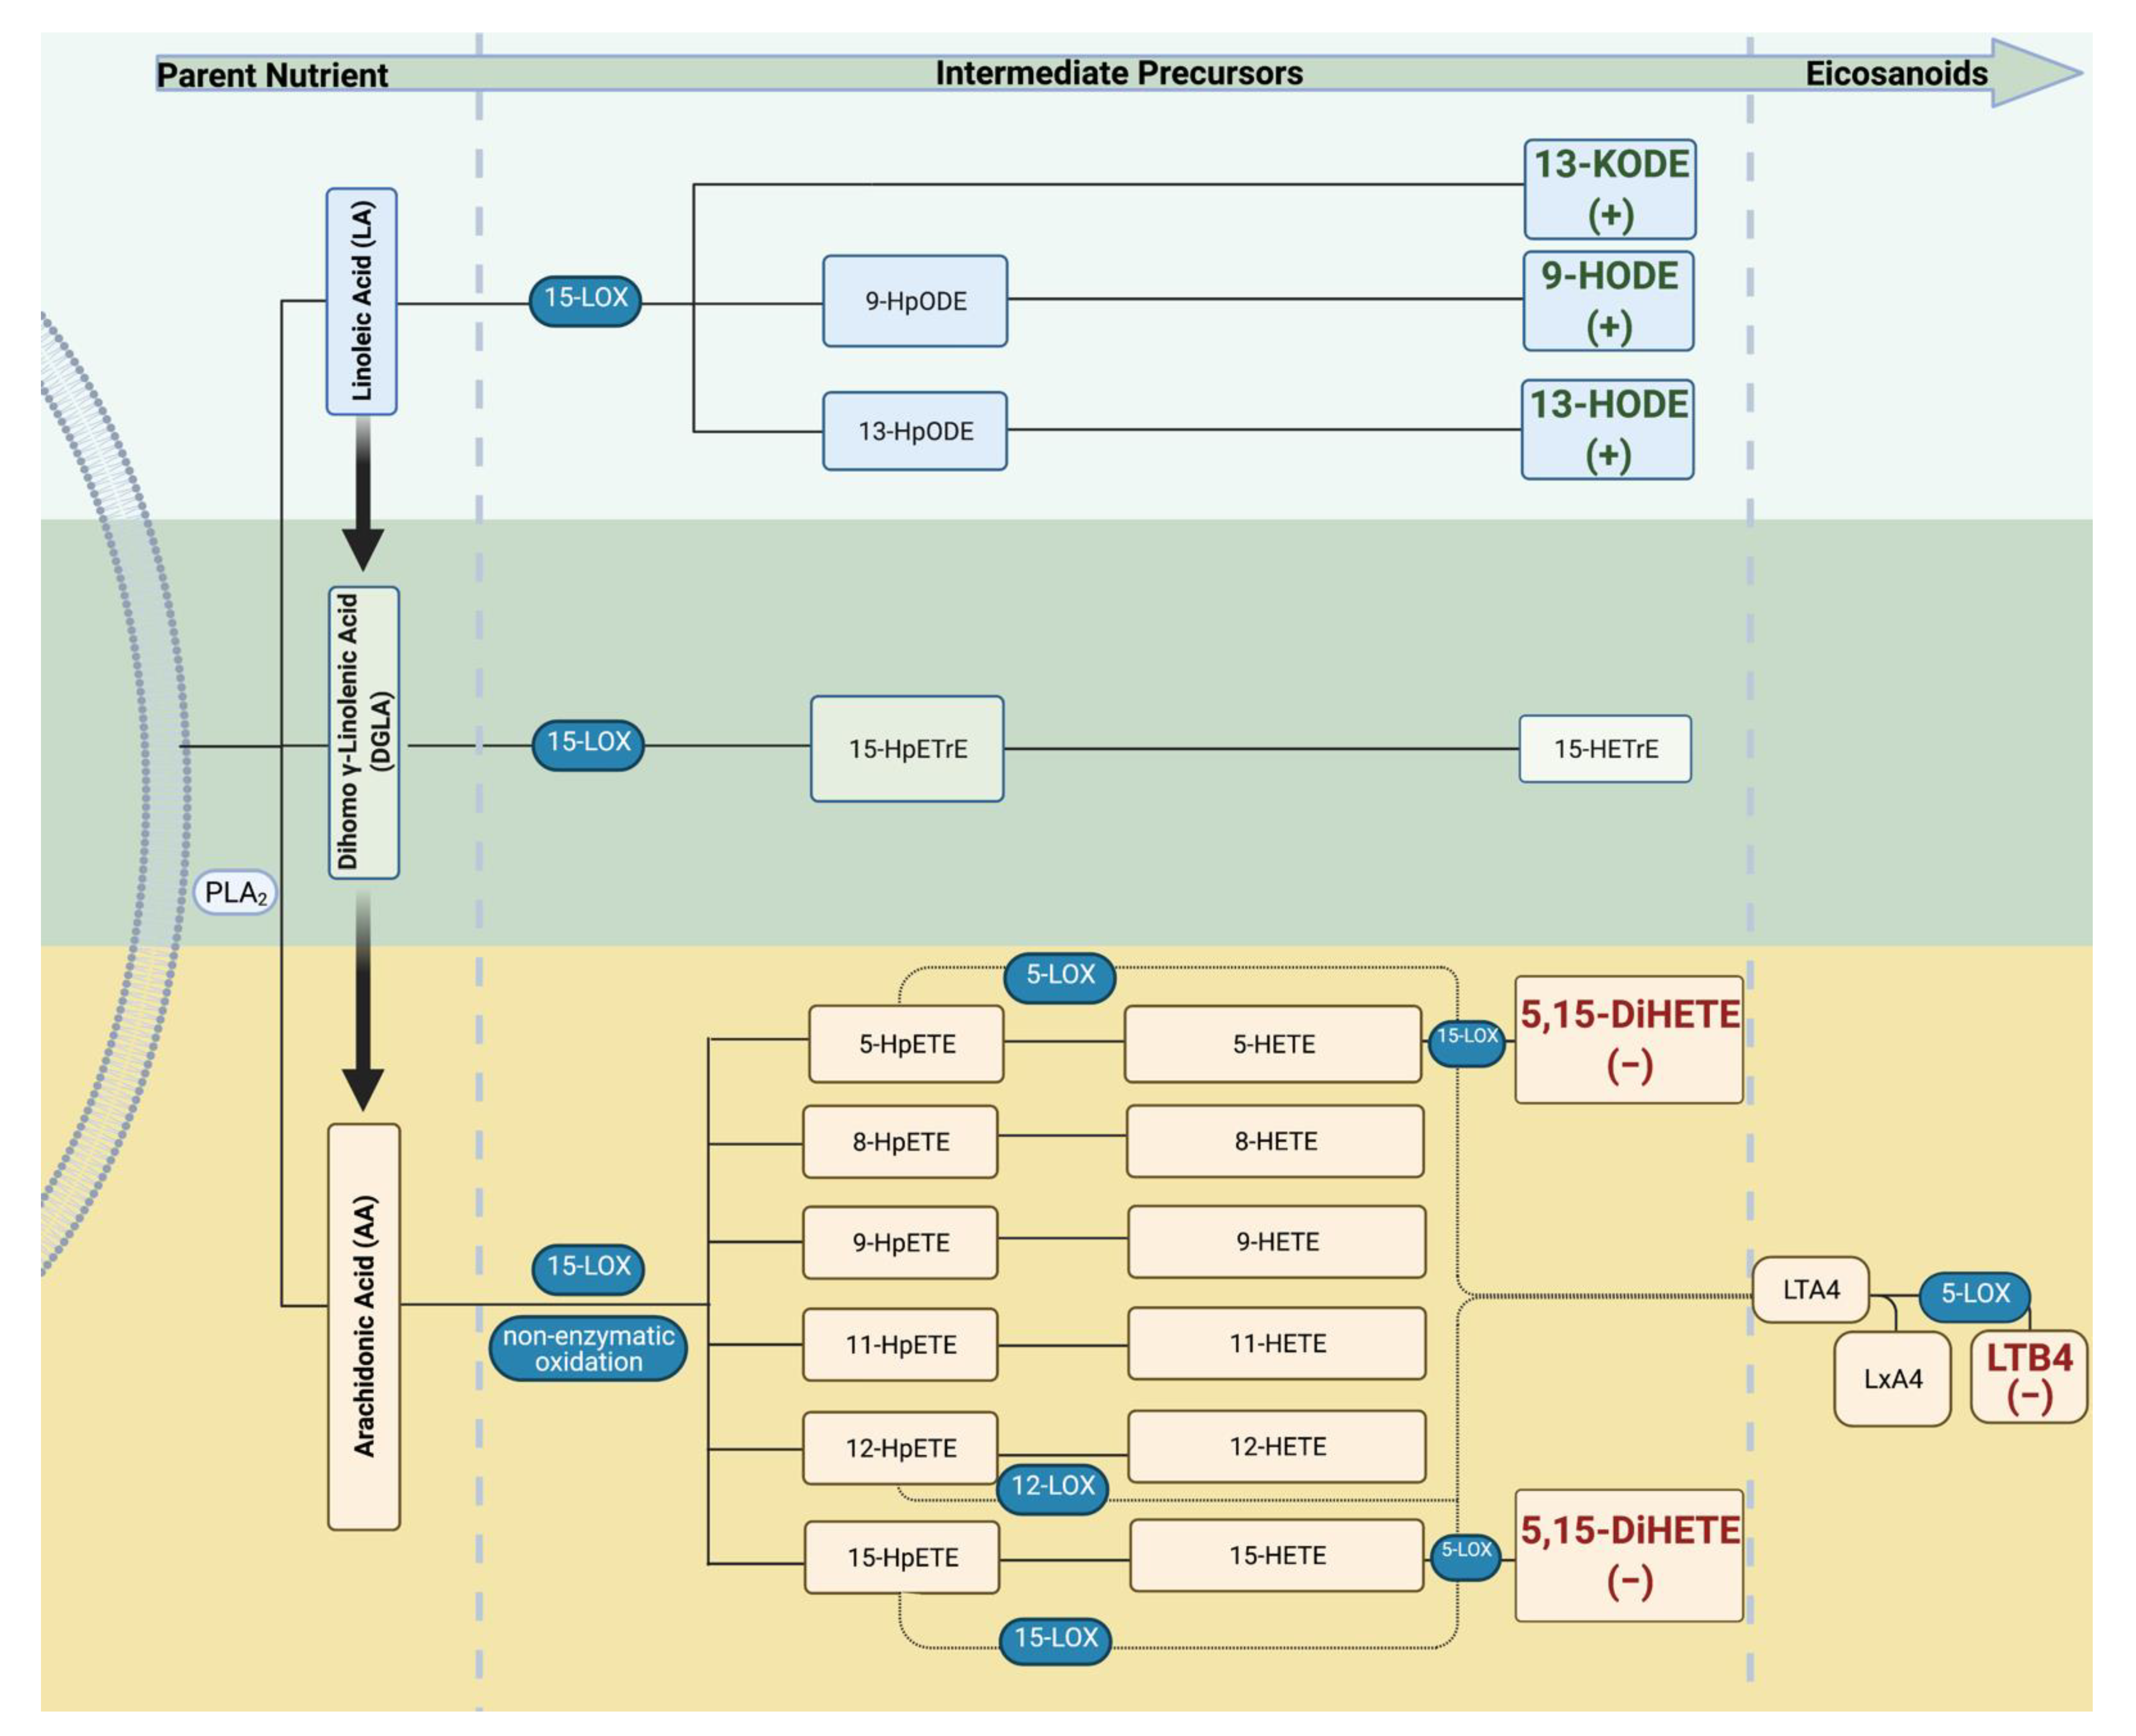
| Parent Nutrient | Metabolites | Abbreviation | Expected Effect |
|---|---|---|---|
| LA | 9-hydroxy-octadecadienoic acid | 9-HODE | Pro-inflammatory |
| 13-hydroxy-octadecadienoic acid | 13-HODE | ||
| 13-ketooctadecadienoic acid | 13-KODE | ||
| DGLA | 15-hydroxyeicosatrienoic acid | 15-HETrE | |
| AA | 5-hydroxyeicosatetraenoic acid | 5-HETE | |
| 8-hydroxyeicosatetraenoic acid | 8-HETE | ||
| 9-hydroxyeicosatetraenoic acid | 9-HETE | ||
| 11-hydroxyeicosatetraenoic acid | 11-HETE | ||
| 12-hydroxyeicosatetraenoic acid | 12-HETE | ||
| 15-hydroxyeicosatetraenoic acid | 15-HETE | ||
| 8,15-dihydroxyeicosatetraenoic acid | 8,15-DiHETE | ||
| 5,15-dihydroxyeicosatetraenoic acid | 5,15-DiHETE | ||
| Lipoxin A4 | LxA4 | Anti-inflammatory | |
| Leukotriene B4 | LTB4 | Pro-inflammatory |
Publisher’s Note: MDPI stays neutral with regard to jurisdictional claims in published maps and institutional affiliations. |
© 2022 by the authors. Licensee MDPI, Basel, Switzerland. This article is an open access article distributed under the terms and conditions of the Creative Commons Attribution (CC BY) license (https://creativecommons.org/licenses/by/4.0/).
Share and Cite
Thompson, M.; Ulu, A.; Yuil-Valdes, A.G.; Mukherjee, M.; Thoene, M.; Van Ormer, M.; Slotkowski, R.; Lyden, E.; Anderson Berry, A.; Hanson, C.K.; et al. Omega-6 and Omega-3 Fatty Acid-Derived Oxylipins from the Lipoxygenase Pathway in Maternal and Umbilical Cord Plasma at Delivery and Their Relationship with Infant Growth. Int. J. Mol. Sci. 2022, 23, 708. https://doi.org/10.3390/ijms23020708
Thompson M, Ulu A, Yuil-Valdes AG, Mukherjee M, Thoene M, Van Ormer M, Slotkowski R, Lyden E, Anderson Berry A, Hanson CK, et al. Omega-6 and Omega-3 Fatty Acid-Derived Oxylipins from the Lipoxygenase Pathway in Maternal and Umbilical Cord Plasma at Delivery and Their Relationship with Infant Growth. International Journal of Molecular Sciences. 2022; 23(2):708. https://doi.org/10.3390/ijms23020708
Chicago/Turabian StyleThompson, Maranda, Arzu Ulu, Ana G. Yuil-Valdes, Maheswari Mukherjee, Melissa Thoene, Matthew Van Ormer, Rebecca Slotkowski, Elizabeth Lyden, Ann Anderson Berry, Corrine K. Hanson, and et al. 2022. "Omega-6 and Omega-3 Fatty Acid-Derived Oxylipins from the Lipoxygenase Pathway in Maternal and Umbilical Cord Plasma at Delivery and Their Relationship with Infant Growth" International Journal of Molecular Sciences 23, no. 2: 708. https://doi.org/10.3390/ijms23020708
APA StyleThompson, M., Ulu, A., Yuil-Valdes, A. G., Mukherjee, M., Thoene, M., Van Ormer, M., Slotkowski, R., Lyden, E., Anderson Berry, A., Hanson, C. K., Nordgren, T. M., & Natarajan, S. K. (2022). Omega-6 and Omega-3 Fatty Acid-Derived Oxylipins from the Lipoxygenase Pathway in Maternal and Umbilical Cord Plasma at Delivery and Their Relationship with Infant Growth. International Journal of Molecular Sciences, 23(2), 708. https://doi.org/10.3390/ijms23020708