Article

LC-PDA-MS and GC-MS Analysis of Scorzonera hispanica Seeds and Their Effects on Human Breast Cancer Cell Lines

1
Department of Biotechnology, Faculty of Pharmacy, Medical University of Bialystok, ul. Kilińskiego 1, 15-089 Bialystok, Poland
2
Department of Pharmacognosy, Faculty of Pharmacy, Medical University of Bialystok, ul. Mickiewicza 2A, 15-230 Bialystok, Poland
3
Department of Pharmaceutical and Biopharmaceutical Analysis, Faculty of Pharmacy, Medical University of Bialystok, ul. Mickiewicza 2D, 15-222 Bialystok, Poland
4
Department of Synthesis and Technology of Drugs, Faculty of Pharmacy, Medical University of Bialystok, ul. Kilińskiego 1, 15-089 Bialystok, Poland
*
Author to whom correspondence should be addressed.
Int. J. Mol. Sci. 2022, 23(19), 11584; https://doi.org/10.3390/ijms231911584
Submission received: 25 August 2022 / Revised: 26 September 2022 / Accepted: 28 September 2022 / Published: 30 September 2022
(This article belongs to the Special Issue Targeting Breast Cancer: Strategies and Hopes)

Abstract

:
Scorzonera hispanica is an herbaceous perennial cultivated in Central and Southern Europe. This study aimed to qualitatively and quantitatively evaluate the composition of oil, extracts, and fractions (SH1-SH12) obtained from S. hispanica seeds. Furthermore, an evaluation of biological activities in breast cancer cell lines was also performed. GC-MS analysis revealed that the primary components of the seed oil (SH12) were fatty acids and β-sitosterol. In the evaluation of extracts (SH1-SH3, SH8-SH10) and fractions (SH4-SH7, SH11) composition, the presence of apigenin, derivatives of p-coumaric and caffeic acids, was reported. In the biological assays, methanolic extract (SH1), diethyl ether (SH4), and chloroform (SH11) fractions exhibited cytotoxicity toward cells. The highest activity was observed for fatty acids- and 3,4-dimethoxycinnamate-rich SH11 (IC50: 399.18 μg/mL for MCF-7, 781.26 μg/mL for MDA-MB-231). SH11 was also observed to induce apoptosis in MCF-7 cells (52.4%). SH1, SH4, and SH11 attenuate signaling pathways and affect the expression of apoptosis-, autophagy-, and inflammation-related proteins. SH12 was non-toxic toward either cancer or normal cell lines in concentrations up to 1 mg/mL. The results suggest that S. hispanica seeds exhibit a wide range of potential uses as a source of oil and bioactive compounds for complementary therapy of breast cancer.

1. Introduction

Scorzonera L. (Asteraceae) is a genus comprising approximately 200 plants, growing across Europe, Asia, and northern Africa [1,2]. In desert regions, some Scorzonera species are used as forage [3]. An species endemic to Central Asia, S. tau-saghyz Lipsch. and Bosse, is cultivated as a rubber-bearing plant [4]. In traditional medicine, plants of the genus Scorzonera play a particular role, including their antidiabetic, analgesic, or antipyretic activities [5,6,7,8]. Scorzonera species have also been a subject of interest in terms of their content of bioactive compounds [9]. The cytotoxic [10,11], anti-inflammatory [12,13,14], and wound healing [15,16] activities of extracts from Scorzonera species, in addition to isolated compounds, were evaluated in multiple in vitro and in vivo studies.
Scorzonera hispanica L. (black salsify) syn.: Pseudopodospermum hispanicum (L.) Zaika, Sukhor. and N. Kilian (Asteraceae) is a perennial plant, spread across Europe and southern Siberia [17]. In the traditional medicine of Europe, S. hispanica roots were used to treat colds, stimulate appetite, and as a mucolytic agent in lung diseases [8,18]. In modern times, black salsify root is a valued vegetable. Previous studies on the species have indicated that aerial parts of the plant contain flavonoids, in addition to caffeic acid and its derivatives [17,19]. In the aerial parts, the presence of lignans, sesquiterpenoids, caffeic acid derivatives, and inulin was reported [17,18,20]. (−)-Syringaresinol, isolated from the roots of black salsify [17], was previously observed to exhibit cytotoxicity to several carcinoma cell lines, including breast cancer [21,22]. No previous reports on the composition or biological activity of the seeds of S. hispanica are available in the literature. To our best knowledge, this is the first attempt to evaluate the phytochemical profile and bioactivity of these products obtained from S. hispanica seeds.
The aim of this study was to obtain and elucidate the components of oil, extracts, and fractions obtained from the seeds of S. hispanica and their activities against two human mammary carcinoma cell lines in addition to normal cells (human skin fibroblasts). The GC-MS analysis and cytotoxicity assessment of the oil were aimed to evaluate the seeds as a novel plant oil source. Six extracts and five fractions using various methods were obtained and their phytochemical profiles using LC-PDA-MS and GC-MS techniques, in addition to their influence on viability and DNA biosynthesis in the mentioned cell lines, were evaluated. The effect of the three most promising products on apoptosis induction in the MCF-7 cell line was assessed. Then, the expression of apoptosis- and autophagy-related proteins using the Western blot technique was investigated. The influence of selected extracts on the concentration of proteins participating in cell signaling pathways and their anti-inflammatory potential was also assessed. As the anticancer activity of S. hispanica seeds is yet to be elucidated, we investigated their effect on the concentration of phosphorylated extracellular signal-regulated kinases 1 and 2 (ERK 1/2), in addition to phosphorylated protein kinase B (p-Akt), as previous clinical studies have indicated a correlation between the expression of those two proteins in breast cancer patients. Coexpression of p-Akt and p-Erk 1/2 was reported as a potential predictor of a reduced disease-free survival time for patients diagnosed in the early stage of breast cancer [23]. Therefore, inhibition of those two proteins involved in cell signaling pathways leads to cell death and is the desired effect of anticancer agents. As focal adhesion kinase (FAK) is involved in cell migration, adhesion, and apoptosis, and regulates PI3K/Akt cell signaling pathway [24,25], we assessed the influence of SH1, SH4, and SH11 on the expression of phosphorylated FAK (p-FAK) in MCF-7 breast cancer cells. Finally, ERK 1/2 and Akt both lead to the inhibition of the expression of pro-apoptotic Bad protein which inhibits the activity of anti-apoptotic BCL-2. BCL-2 in turn blocks the expression of Bax [26]. Additionally, BCL-2 prevents Beclin-1 from initiating the process of autophagy [27]. Apoptosis and autophagy often occur simultaneously in the cell [28]. Hence, to investigate the influence of the assessed extract and fractions on autophagy in breast cancer cells, we evaluated the expression of ATG5 and LC3B proteins. In addition to the apoptosis-autophagy investigation, we assessed the influence of SH1, SH4, and SH11 on pro- (IL-8, TNF-α) and anti-inflammatory (IL-10) cytokines. As IL-8 and TNF-α are associated with cancer progression and metastasis [29,30], the inhibitory effect of the extracts on those cytokines was anticipated. Interleukin-10, which is generally considered to possess anti-inflammatory properties, plays a dual role in breast cancer. It can exert both pro-tumor and anti-tumor activity [31,32]. Therefore, we investigated how SH1, SH4, and SH11 affect the concentration of IL-10 in MCF-7 cells.

2. Results

2.1. GC-MS Analysis of SH1, SH9-SH12

The GC-MS analysis of SH1, SH9-SH11 revealed that the dominating groups of compounds for SH1 were carbohydrates (54.6% relative content; with sucrose as the main constituent) and organic polyols (15.8%; main constituent: D-chiro-inositol). Another interesting group present in SH1 was phenolic compounds, with caffeic acid as the primary phenolic acid detected in the sample. The presence of quinic acid was also reported in SH1. For SH9 and SH12, 41.7% and 62.2% of the relative composition were fatty acids, with most being linoleic acid. Fatty acid esters, with butyl 9,12-octadecadienoate and conjugated linoleic acid esters, were 18.8% of relative extract SH9 composition. Noteworthily, SH9 and SH12 were observed to contain a notable amount of phytosterols like β-sitosterol, 5α-stigmast-7-en-3β-ol, and stigmasterol. SH10 relatively consisted of 44.2% fatty acids, with linoleic acid (LA), oleic acid (OA), and palmitic acid (PA) as the primary fatty acids. Glycerol was 15.7% of the total phytochemicals detected in SH10. SH11 relatively consisted of 33% fatty acids (linoleic acid, conjugated linoleic acid, oleic, and palmitic acids) and 21.16% methyl 3,4-dimethoxycinnamate. The primary components of SH12 were fatty acids (61.8%; including 27.2% linoleic acid) and phytosterols (31.4%; main constituent: β-sitosterol—21.9%). Notable amounts of α-tocopherol and α-amyrin were also observed. Campesterol, 2,3-butanediol, and 3-hexanol were detected only in SH12. Noteworthily, the ratio of fatty acids (LA:OA:PA) in SH1 and SH10-SH12 remained similar (approximately 2.5:1.1:1), with a prevailing share of linoleic acid. The greatest similarities in the LA:OA:PA ratio were observed between SH1 and SH10 and between SH11 and SH12. All compounds identified in SH1, SH9-SH12 are listed in Table 1.

2.2. LC-PDA-MS Characterization of SH1-SH8

2.2.1. Qualitative Analysis

Qualitative evaluation of the extracts and fractions confirmed free phenolic acids in the composition (7), (2, 4–5, 10, 13–14, 16, 18, and 20), and p-coumaric acid (3, 12). The flavonoids were represented in free (22, 24) and bound form (15, 19). All 24 compounds listed in Table 2 were present in the extracts and fractions, displaying selectivity to the corresponding solvent, as indicated in Figures S1 and S2 (Supplementary Materials).

2.2.2. Quantitative Analysis

The quantitative assessment of apigenin and caffeoylquinic derivatives in SH1-SH8 is presented in Table 3.
The chemical structures of the main components of SH1-SH12 detected and identified in GC-MS and LC-PDA-MS analyses are presented in Figure 1.

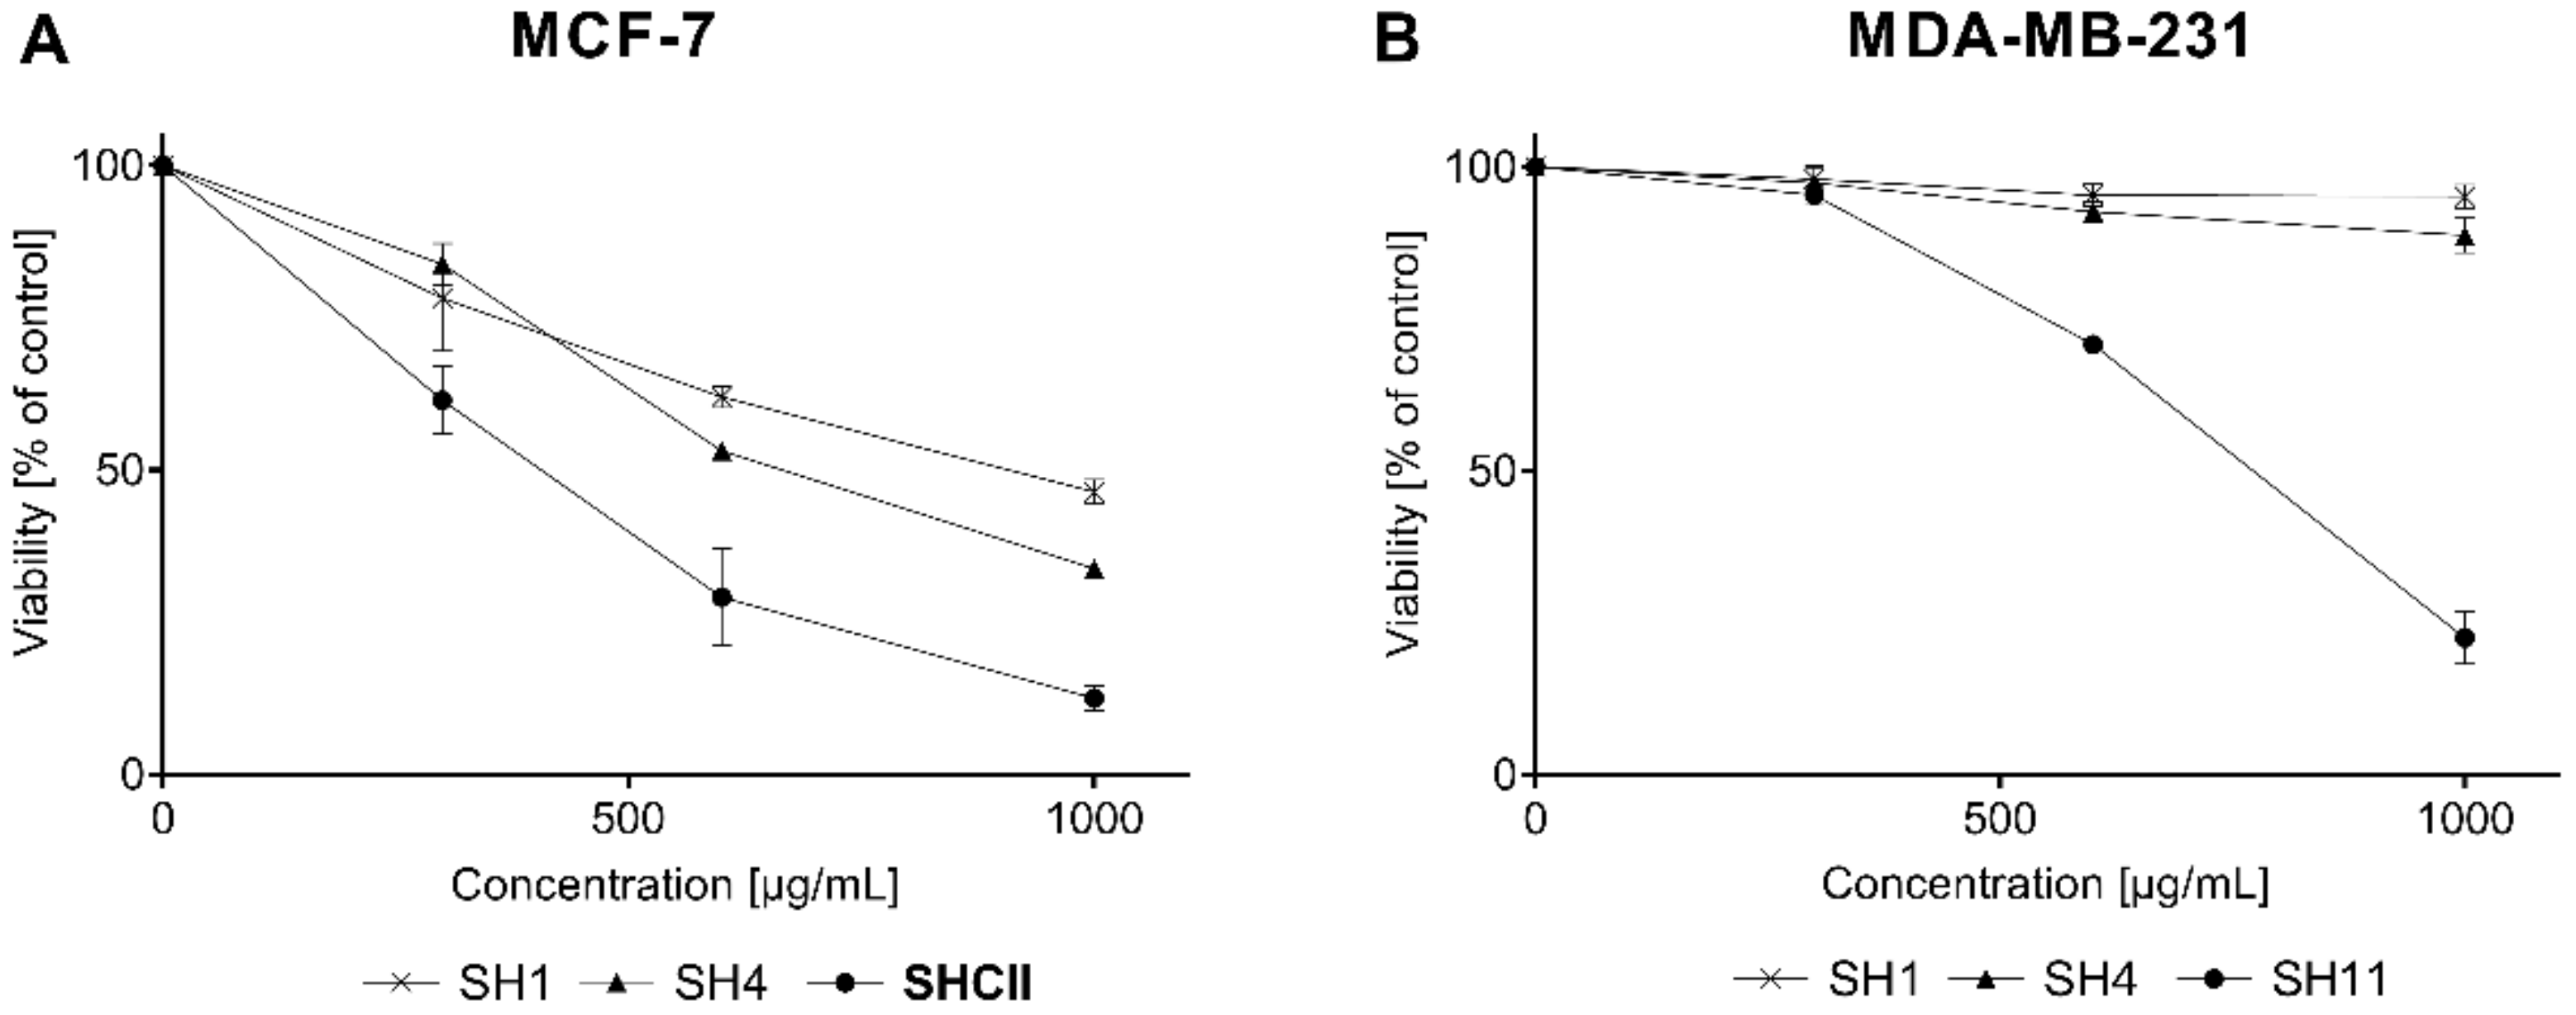
2.3. Cell Viability Assay

A preliminary cell viability test indicated that three (SH1, SH4, and SH11) out of the eleven obtained extracts and fractions from S. hispanica seeds displayed cytotoxicity against MCF-7 and MDA-MB-231 human mammary carcinoma cell lines. The remaining extracts and fractions (SH2-3, SH5-SH10) and SH12 did not exhibit any cytotoxicity toward either breast cancer cell lines or normal skin fibroblast cells at concentrations up to 1000 µg/mL.
Figure 2A presents the cytotoxic activity of SH1, SH4, and SH11 against MCF-7 cells. Figure 2B portrays the cytotoxicity of the extracts in MDA-MB-231 cells. The greatest cytotoxic activity was observed for SH11. IC50 values for the tested cell lines were 399.18 ± 54.15 μg/mL for MCF-7 and 781.26 ± 21.43 μg/mL for MDA-MB-231. SH1 and SH4 was active only in MCF-7 cells with IC50 values of 847.72 ± 69.25 μg/mL, 626.01 ± 5.07 μg/mL, respectively. Data obtained from the phytochemical analysis indicate that SH1, SH4, and SH11 were characterized by the greatest content of potentially bioactive compounds and therefore their influence on the process of cell proliferation was evaluated. In a previous study by the research team, cisPt—a reference compound in this study—inhibited the growth of 50% of breast cancer cells at concentrations of 93 ± 2 μM for MCF-7 and 82 ± 2 μM for MDA-MB-231 [33].

2.4. DNA Biosynthesis Assay

To confirm the results obtained in the preliminary cytotoxicity assay, the effect of SH1, SH4, and SH11 on [3H]-thymidine incorporation in breast cancer cells was evaluated. The results are presented in Figure 3.
The results obtained in the DNA biosynthesis assay indicate that SH11 was similarly effective as a proliferation inhibitor in both cell lines, with IC50 of 293.64 ± 16.61 μg/mL (MCF-7) and 265.05 ± 25.44 μg/mL (MDA-MB-231). The reference compound cisPt was previously reported to reduce the incorporation of [3H]-thymidine by 50% at 98 ± 2 and 86 ± 2 μM for MCF-7 and MDA-MB-231 cells, respectively [33]. Table 4 summarizes all IC50 values obtained in the assay.

2.5. Annexin V/PI Binding Assay

To examine whether the molecular mechanism of cytotoxicity of SH1, SH4, and SH11 in MCF-7 cells was associated with their ability to induce apoptosis, an analysis of Annexin V/PI binding was performed.
All extracts, in addition to cisPt used as a reference, were applied at concentrations that are approximately IC25 and IC50 values evaluated in the preliminary cytotoxicity assays. The results obtained in the performed assay reveal that SH1, SH4, and SH11 induce the apoptosis process in MCF-7 cells in a concentration-dependent manner. Figure 4 indicates that the greatest pro-apoptotic activity was exhibited by SH11; 24 h incubation with the extract at a concentration of 200 μg/mL resulted in the detection of 32.5% of early and late apoptotic cells. At a higher concentration (400 μg/mL), the total percentage of apoptotic cells increased to 53.4%. For SH4, 39.9% of apoptotic cells were detected after incubation with 600 μg/mL, and 49.6% for 800 μg/mL. SH1 did not exhibit a similarly strong pro-apoptotic effect. Incubation for 24 h with the extract resulted in the detection of 11.5% and 13.4% of apoptotic cells for concentrations of 600 and 800 μg/mL, respectively. For cisPt, 19.7% of total apoptotic cells after incubation with 50 μM and 26.6% of early and late apoptotic cells for a 100 μM concentration of the compound were detected. The number of necrotic cells did not exceed 2% in the analyzed samples, which suggests that apoptosis, not necrosis, is the dominant mechanism of cytotoxicity for SH1, SH4, and SH11.

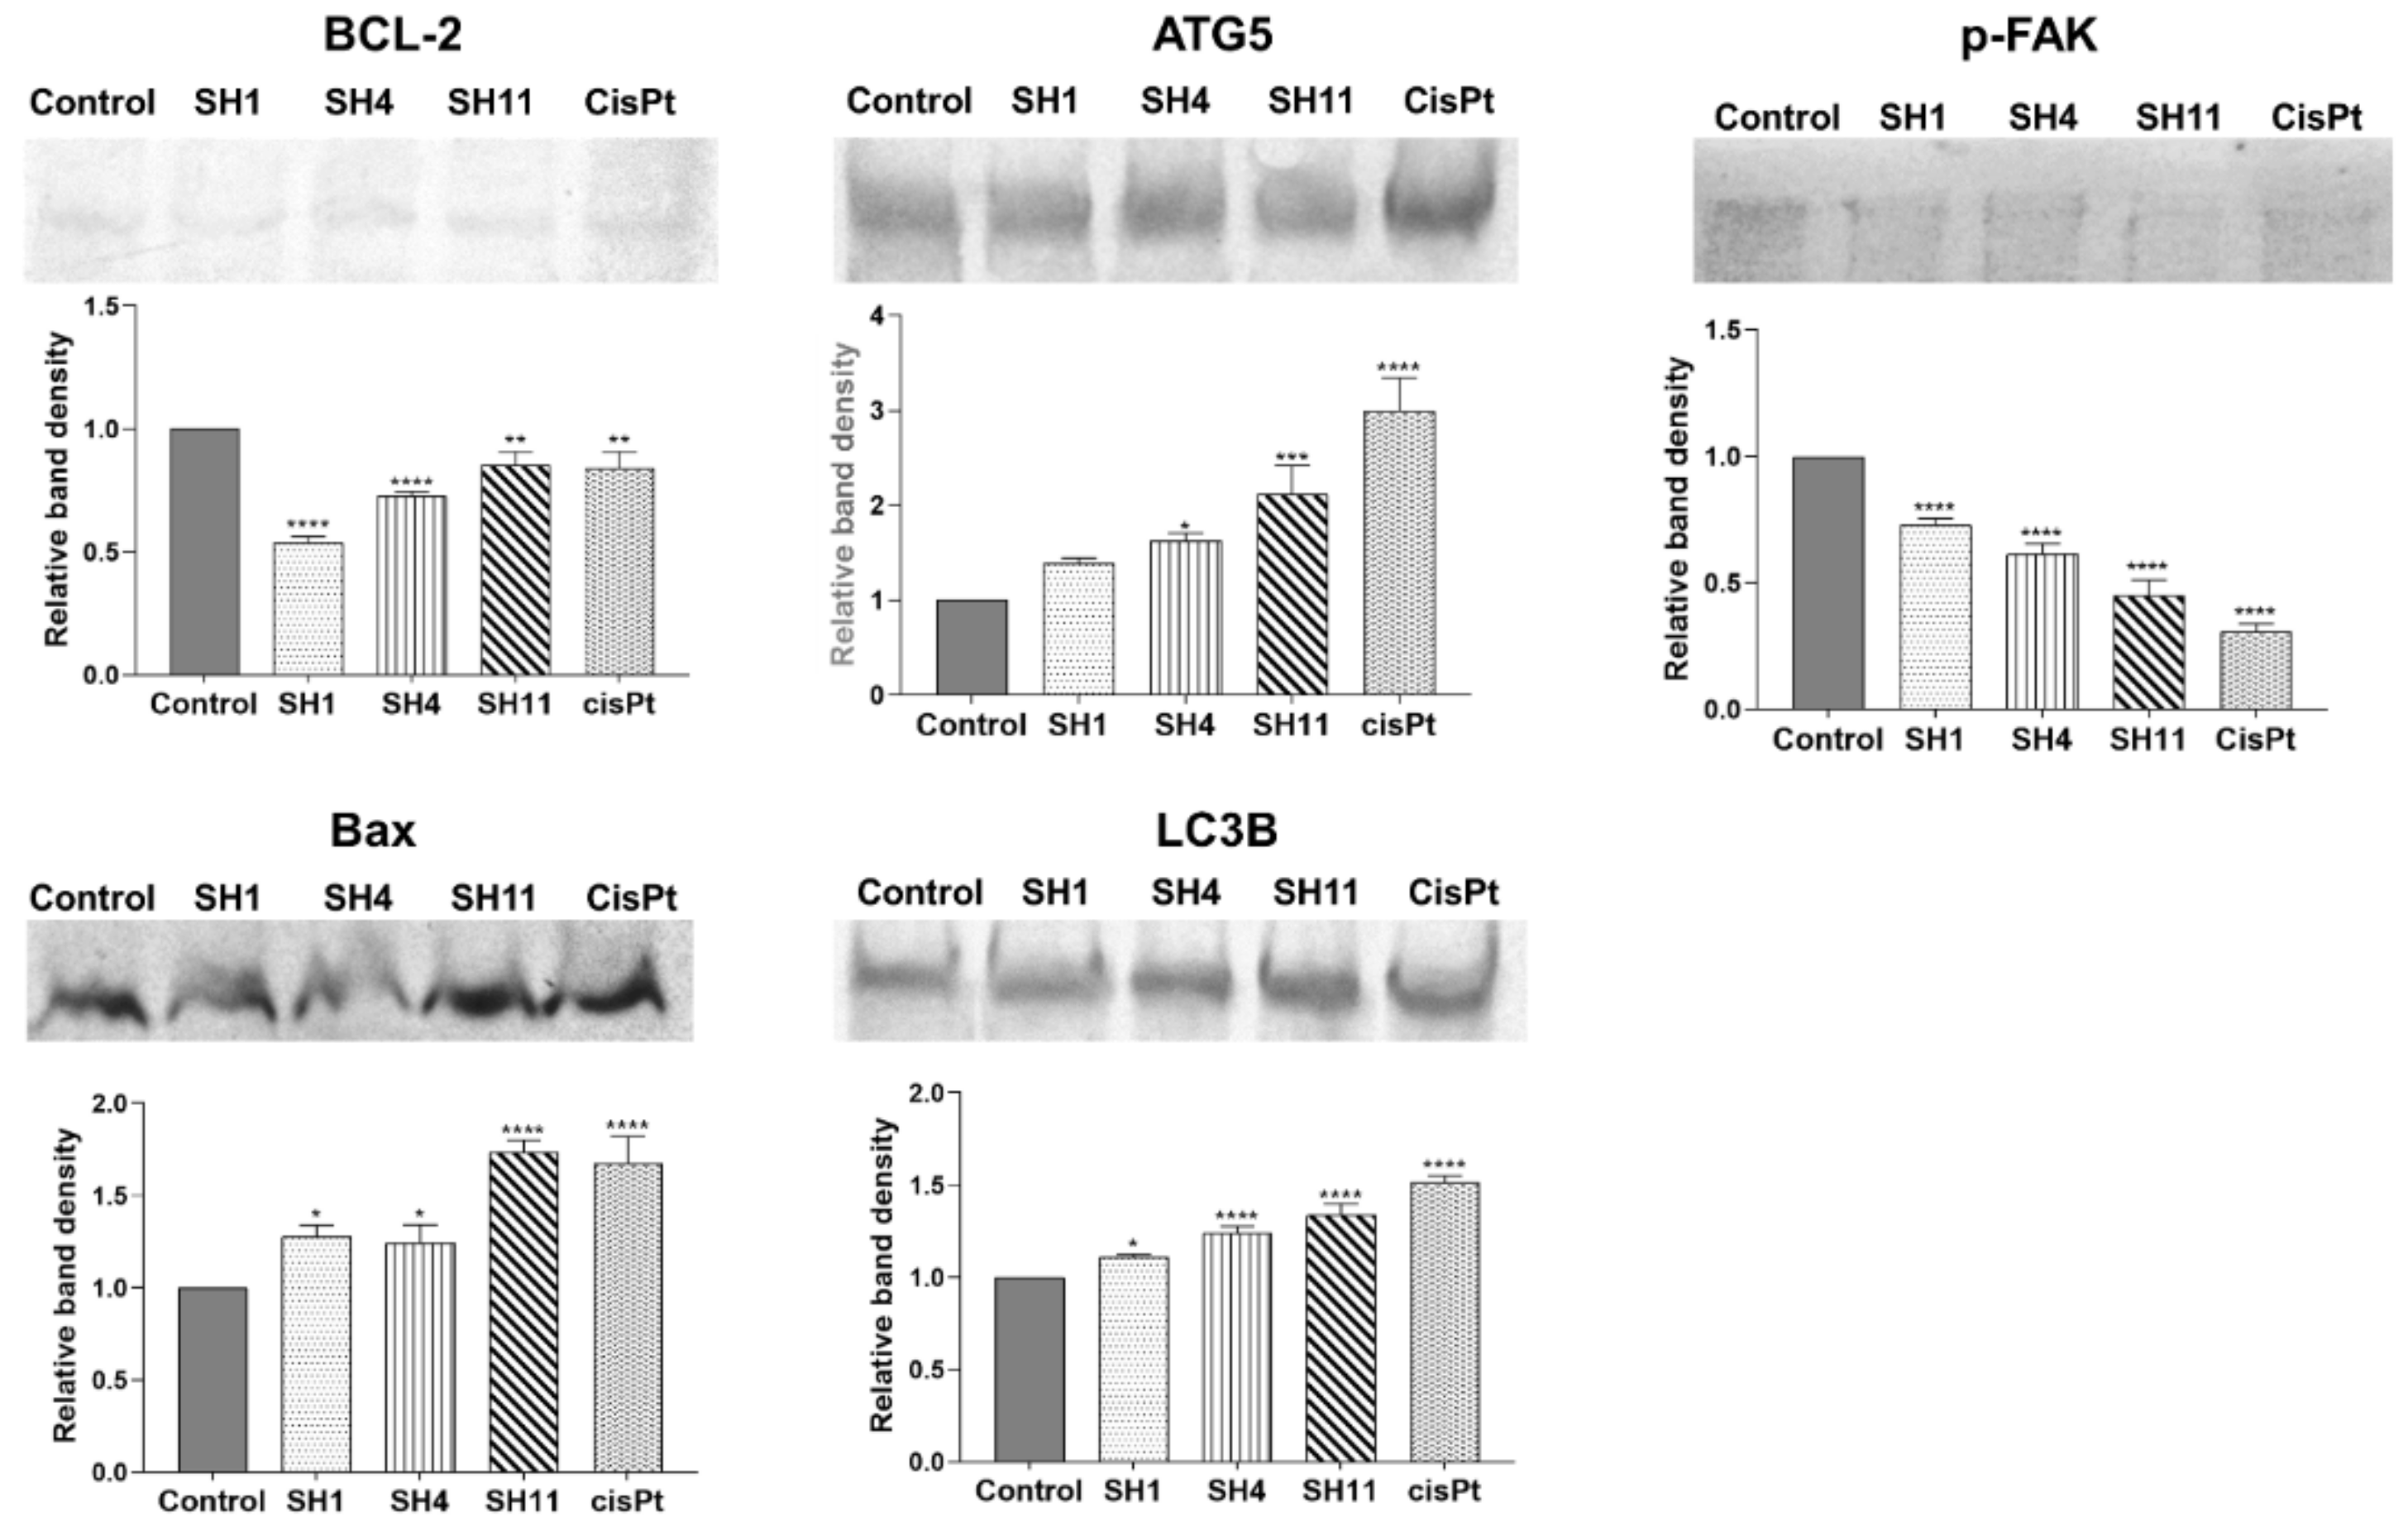
2.6. Western Blot Evaluation of the Expression of Apoptosis- and Autophagy-Related Protein

A deeper investigation of the pro-apoptotic and pro-autophagic effects of SH1, SH4, and SH11 in MCF-7 cells was performed. To assess how the extract and fractions affect the expression of proteins involved in the processes of apoptosis and autophagy (BCL-2, Bax, ATG5, and LC3B), in addition to phosphorylated focal adhesion kinase (p-FAK), the Western blot technique was used.
In the Western blot analyses, extracts and cisPt were applied to MCF-7 cells at concentrations that corresponded to the approximate IC50 values determined in the viability and DNA biosynthesis assays—for SH1 and SH4: 800 μg/mL; SH11: 400 μg/mL. CisPt used as reference was applied at 100 μM. Results of the Western blot analyses are presented in Figure 5. SH1, SH4, and SH11, in addition to cisPt, were observed to exhibit the ability to inhibit the expression of pro-survival protein BCL-2 and increased the expression of apoptosis-accelerating protein Bax. For BCL-2, the greatest inhibition was observed for SH1. After 24 h of incubation with SH4 and SH11, the attenuative activity on BCL-2 expression was observed as well. CisPt decreased the concentration of BCL-2 to a degree comparable to SH11. For the apoptosis regulator Bax, enhanced expression was observed in all the examined samples. The most potent activity was observed for SH11—the intensity of the band increased the most compared with the untreated control cells. The reference drug cisPt caused a similar effect on Bax expression. SH1 and SH4 enhanced Bax expression; SH1, SH4, SH11, and cisPt all increased the concentration of autophagy-related proteins ATG5 and LC3B. Enhancement of ATG5 expression was significant. The intensity of the SH11 band was doubled in comparison with the control band. SH1 and SH4 increased the expression of ATG5 to a notable degree as well. For cisPt, the greatest enhancement in band density was observed. The expression of autophagy marker LC3B was intensified in all the analyzed samples. SH1, SH4, and SH11 all increased the expression of LC3B compared with the untreated control cells. The reference drug cisPt increased the expression of the protein to the greatest degree, by approximately 50%. Significant inhibition of p-FAK expression was observed in all assessed extracts, in addition to cisPt. The most significant inhibitory effect was observed for cisPt and SH11—the relative intensity of the bands was below 50% compared with the control band for both samples.

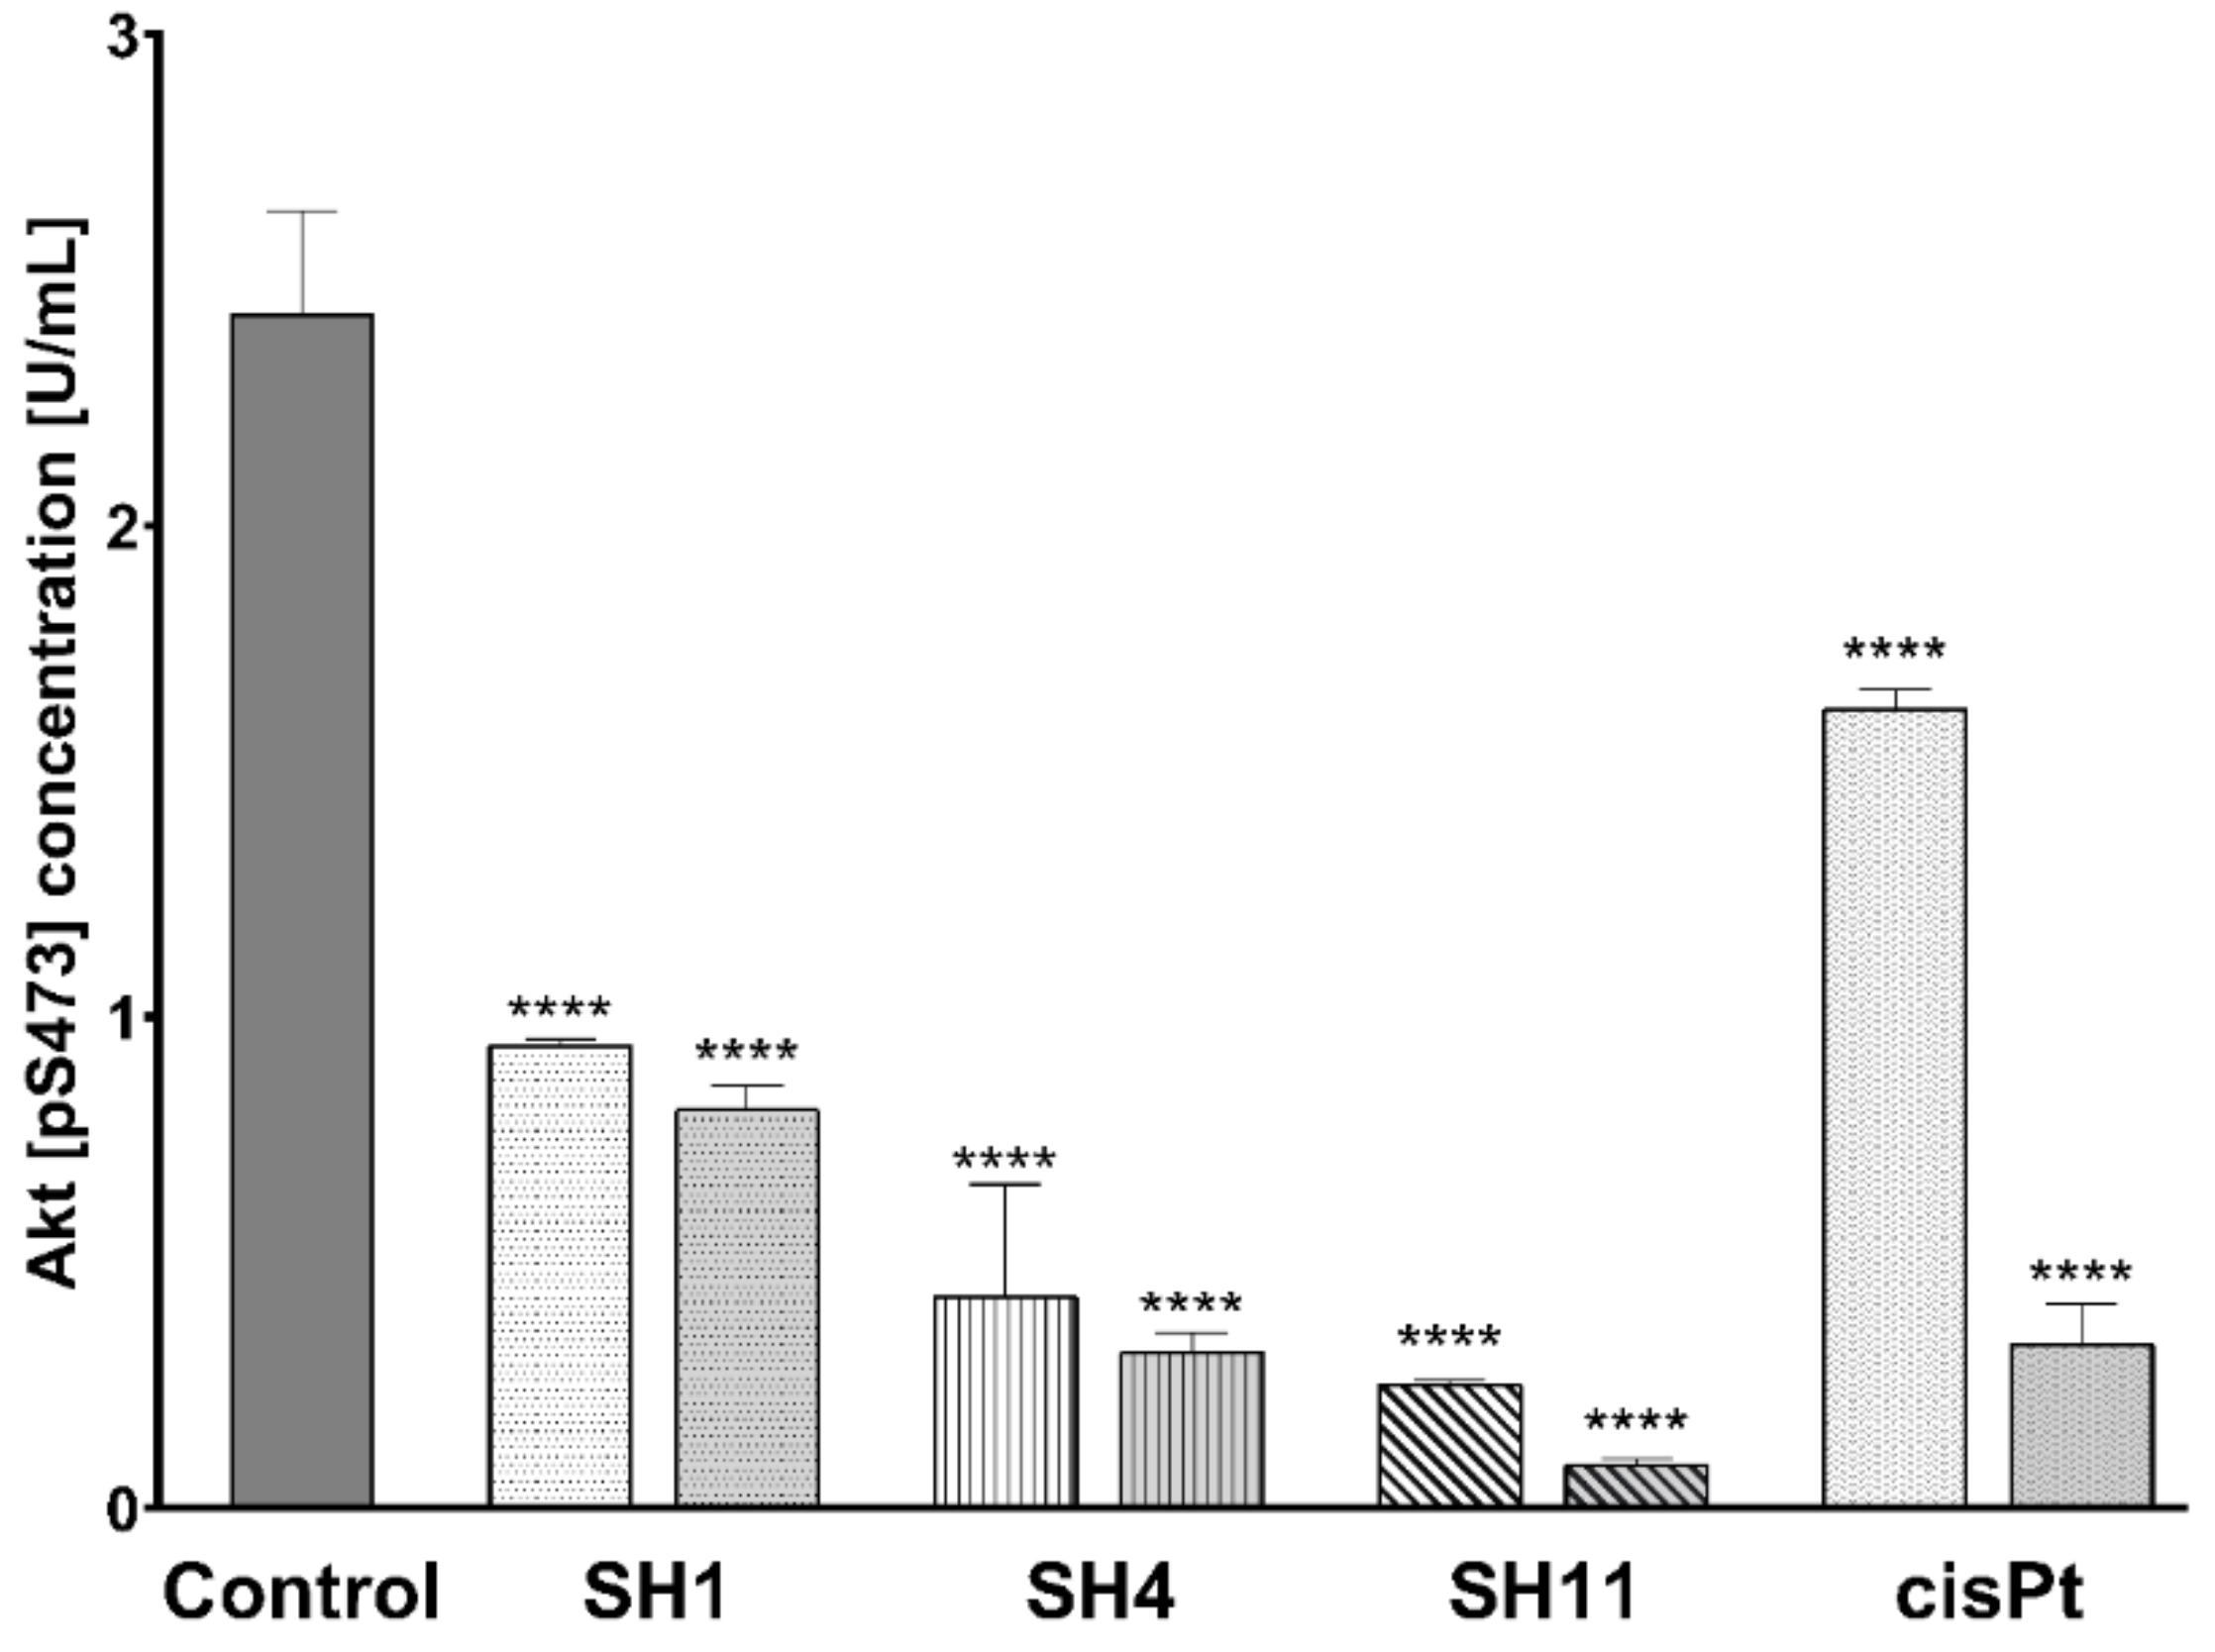
2.7. Influence of SH1, SH4, and SH11 on the Expression of Proteins Related to Cell Survival and Proliferation

An inhibitory effect on phosphorylated Akt (p-Akt) was observed in all the examined samples. As demonstrated in Figure 6, the most significant decrease was observed for SH11—from 2.43 U/mL in untreated control cells to 0.25 U/mL for 200 μg/mL and 0.9 U/mL for 400 μg/mL. After incubation with SH4 at 600 and 800 μg/mL, the concentration of p-Akt was lowered to 0.43 and 0.32 U/mL, respectively. SH1 caused a decline in p-Akt concentration to 0.94 and 0.81 U/mL, respectively. Incubation of cells with cisPt used as reference resulted in the detection of 1.63 and 0.34 U p-Akt/mL for 50 and 100 μM, respectively.
Figure 7 presents a dose-dependent, inhibitory effect of all the analyzed S. hispanica extracts and fractions on the concentration of phosphorylated ERK 1/2 (p-ERK 1/2) in MCF-7 cells. In the untreated control cells, the concentration of p-ERK 1/2 was 150.33 pg/mL. The most significant decrease in p-ERK 1/2 expression was observed in SH11—84.33 pg/mL at 200 μg/mL and 38.67 pg/mL at 400 μg/mL. 24 h incubation with SH4 resulted in the reduction of p-ERK 1/2 concentration to 93 pg/mL at 600 μg/mL, and 80.67 pg/mL at 800 μg/mL SH4. For SH1, the concentration of p-ERK 1/2 declined to 128 pg/mL and 126.33 pg/mL for the lower and the higher concentrations, respectively. The reference drug cisPt inhibited p-ERK 1/2 expression to 122.67 pg/mL at 50 μM and 81.33 pg/mL at 100 μM cisPt.

2.8. Influence of SH1, SH4, and SH11 on the Concentration of TNF-α, Interleukin-8, and Interleukin-10

The effect of SH1, SH4, and SH11 on the concentrations of pro-inflammatory cytokines tumor necrosis factor α (TNF-α) and interleukin-8 (IL-8), in addition to anti-inflammatory interleukin-10 (IL-10), in MCF-7 cells was investigated.
As demonstrated in Figure 8A, the inhibitory activity towards TNF-α was observed for all three extracts. For SH1, the concentration of this cytokine was reduced from 36.72 pg/mL in the control cells to 34.82 pg/mL and 32.99 pg/mL at the concentrations of 600 μg/mL and 800 μg/mL, respectively. At 600 and 800 μg/mL concentrations of SH4, the TNF-α concentration decreased to 34.46 and 31.10 pg/mL, respectively. For SH11, the observed concentrations of TNF-α were 35.66 pg/mL for 200 μg/mL and 33.93 pg/mL for 400 μg/mL SH4. As it is portrayed in Figure 8B, all three extracts caused a notable inhibition of IL-8 concentration. The inhibitory activity of SH1, SH4, and SH11 was more significant in comparison with the control than for TNF-α. The 24-h incubation with SH1 at 600 and 800 μg/mL resulted in a decrease in IL-8 concentration from 32.58 pg/mL in the control cells to 5.69 and 4.87 pg/mL, respectively. The analysis indicated that SH4 decreased the concentration of IL-8 to a more notable degree with 4.48 pg/mL for 600 μg/mL and 4.00 pg/mL for 800 μg/mL. Incubation with SH11 led to a decline in IL-8 concentration to 5.16 pg/mL for 200 μg/mL and 4.21 pg/mL for 400 μg/mL. Figure 8C illustrates that the enhancement of IL-10 concentration was observed for SH1, SH4, and SH11. In comparison with control cells (71.84 pg/mL), the greatest increase in the concentration of IL-10 was detected for SH4 (92.55 pg/mL and 111.10 pg/mL for 600 and 800 μg/mL, respectively). SH1 and SH11 caused a similar enhancement of IL-10 concentration. 24 h incubation with 600 μg/mL SH1 resulted in the detection of IL-10 in the concentration of 84.31 pg/mL For 800 μg/mL, the concentration of IL-10 was 89.93 pg/mL. For SH11 at 200 and 400 μg/mL, the concentration of the cytokine went up to 84.63 and 87.26 pg/mL, respectively.

3. Discussion

Plant-based medicinal products can have varied effects on cancer patients, including influence on the activity of hormones and enzymes, stimulation of immune cells, or alleviating the side effects of treatment [34]. In Europe, breast cancer patients are frequent users of phytotherapy as complementary medicine along with their standard therapy [35,36]. Plant products are reported to be applied to bring physical and emotional comfort, relieve the side effects of therapy, avert tumor relapse, and improve the patient’s immune system [37]. Anti-breast cancer activity of various medicinal plants, in addition to phytochemicals isolated from them, was reported in multiple studies. The activity of some of them was not only proven in in vitro studies but also clinical trials regarding their anticancer properties were designed and conducted [38].
The chemical composition of the seeds of S. hispanica has not been previously reported in the literature. However, there are reports on the evaluation of the phytochemical composition of aerial and subaerial parts of the plant. While the dominant groups of compounds in the aerial part extracts are flavonoids and phenolic acids, the subaerial parts contain mostly phenolic acids, steroids, terpenoids, and fatty acids [9]. Linoleic acid (LA) was the primary fatty acid of SH1 and SH9-SH12. The presence of LA was also reported in S. hispanica subaerial part ethyl acetate extract [18]. The presence of caffeoylquinic acid derivatives, including CA, 3-CQa, 4-CQa, 4,5-dCQa, and 3,5-dCQa was reported in the subaerial parts as well [17]. Those compounds have been reported in SH1-SH8 as well, particularly in SH4.
A significant amount of β-sitosterol in the oil obtained from the S. hispanica seeds (SH12) indicated that the oil might possess health-promoting properties, as β-sitosterol is known to lower cholesterol levels, increase the activity of vitamin D, or even possess anti-breast cancer properties [39,40]. The notable amount of unsaturated fatty acids (44.8% of all constituents, 72.5% of all fatty acids) in SH12 suggests that it can be utilized in the food industry. Unsaturated fatty acids must be delivered with food, as humans are not able to synthesize those compounds [41].
Although the yield of oil pressing was not as efficient as other oilseeds, such as lemon (Citrus limon L., Rutaceae) or pumpkin (Cucurbita pepo L., Cucurbitaceae) (approx. 33–37%), [42,43], SH12 is an interesting product in other aspects, including attractive composition and lack of cytotoxicity at high concentrations. In the wild, S. hispanica grows in a warm steppe environment but is easy to cultivate in temperate climates. When cultivated, the plant is characterized by a high tolerance for low temperatures and requires extensive exposure to sunlight. Additionally, the oil pressure procedure is uncomplicated, and the yield might be improved by optimization of the process conditions in the future.
Out of 12 products obtained in this study, 3 were cytotoxic toward breast cancer cells—methanolic extract SH1, and fractions of methanolic extracts diethyl ether (SH4) and chloroform (SH11). Phytochemical analysis of SH1 revealed that the primary constituents of the extract are carbohydrates. Although little is understood about the anticancer activity of sucrose (which was the primary carbohydrate in the extract), the pro-apoptotic activity might be a result of interactions between the remaining components, including inositol, CA, and QA. Phosphorylated inositol—inositol hexaphosphate—was cytotoxic toward mammary carcinoma cells and its synergy with doxorubicin and tamoxifen was observed [44]. The attenuative activity of CA on multi-drug resistance in cancer cells, including breast cancer cells, was reported as well. CA was observed to modify the estrogen receptors of MCF-7 cells [45,46]. This might suggest that the CA present in SH1 sensitizes the cells to other extract components, and therefore enhances its activity in MCF-7 cells.
The major phytocomponents of SH4 were phenolic acids, including CA, 4,5-dCQa, and a flavonoid apigenin (A). Phenolic acids have been reported in several papers as anti-breast cancer agents in vitro [47,48]. Apigenin, which was the major flavonoid in SH4, was reported to be selectively cytotoxic toward MCF-7 cells [49]. A combination of apigenin, CA, and 4,5-dCQa present in SH4 might be responsible for its selective cytotoxicity in MCF-7 observed in this study.
The greatest inhibitory activity on the growth of breast cancer cells was observed for SH11. This fraction contained notable amounts of LA, conjugated linoleic acid (CLA), and cinnamic acid derivatives. All those compounds were previously observed to decrease the viability of breast cancer cells [50,51,52].
Based on preliminary viability tests and phytochemical composition, a series of assays was performed to investigate the molecular mechanism of the activity of those three products from S. hispanica seeds in breast cancer cells in vitro.
To assess the influence of SH1, SH4, and SH11 on the cellular signaling pathways, the concentrations of proteins crucial in the pathways associated with cell survival: phosphorylated Akt and ERK 1/2, in addition to the expression of phosphorylated focal adhesion kinase (p-FAK), were evaluated in MCF-7 cells. The PI3K/Akt- and ERK 1/2-mediated pathways are essential for cell survival and proliferation. Phosphorylated Akt inhibits apoptosis by, among others, the inactivation of FOX proteins or BAD and the upregulation of NF-κB activation [53]. Inhibition of PI3K/Akt signaling via a decrease of phosphorylated Akt activates BAX and therefore promotes apoptosis in cells, including MCF-7 cells [54]. Approximately three out of ten human breast cancers are reported to be characterized by dysregulations in the ERK 1/2 cell signaling pathway [51]. Attenuation of ERK 1/2 phosphorylation leads to the initiation of apoptosis via the mitochondrial pathway [55]. FAK is a kinase whose expression promotes both PI3K/Akt and ERK 1/2 signaling pathways. Additionally, FAK is considered a crucial mediator, overexpressed in many breast cancer types. FAK promotes tumorigenesis and progression of breast cancer [56]. Disruption of Akt and ERK 1/2 phosphorylation caused by fruit-derived polyphenols was suggested to be related to apoptosis induction in breast carcinoma cells [57]. In this study, it was indicated that the phytochemicals present in S. hispanica seeds, particularly in SH11, inhibit the concentrations of phosphorylated Akt, FAK, and ERK 1/2 and therefore suppress their pro-survival activity in breast cancer cells. This correlated with the observations from the Annexin V binding assay, where 24-h incubation with SH11 induced apoptosis in over 50% of cells. This may be due to the high content of LA, CLA, and dimethyl cinnamate. A Cinnamomum cassia (L.) J. Presl (Lauraceae) ethanolic extract, where major components were cinnamic acid and derivatives, decreased the viability, and promoted apoptosis in carcinoma cells [58]. In the literature, plant extracts rich in cinnamic acid derivatives was observed to activate apoptotic pathways in MCF-7 cells [50]. Additionally, LA was previously reported as pro-apoptotic for breast cancer cells via the ERK 1/2-mediated pathway [51]. CLA exhibits pro-apoptotic activity on MCF-7 cells via the intrinsic pathway [52]. However, the oil obtained from the seeds in this study did not exhibit any toxicity towards the cells, even at the highest concentration (1 mg/mL), although over 27% of its relative composition was LA. This might suggest that the cytotoxicity of SH11 was caused by compounds other than LA or that the activity against cancer cells was an effect of synergy between the constituents of SH11.
To confirm the ability of SH1, SH4, and SH11 to induce apoptosis on the mitochondrial pathway, their influence on the expression of proteins involved in the process of apoptosis, BCL-2 and Bax, was assessed. BCL-2 is a regulatory protein involved in the mitochondrial pathway of apoptosis, characterized by inhibitory activity on pro-apoptotic proteins—Bax and BAK [59]. Inhibition of BCL-2 expression leads to an increase in Bax and BAK concentrations, which consequently initiates apoptosis on the intrinsic pathway [60]. Previously, downregulation of BCL-2 and upregulation of Bax concentrations in MCF-7 cells were observed for extracts of Cassia fistula Linn. (Fabaceae) In the phytochemical analysis, the authors demonstrated that in n-butanol extract, the primary component was inositol [61]. In this study, the greatest inhibitory activity on BCL-2 was exhibited by SH1, which contains notable amounts of inositol. However, the greatest expression of Bax was observed in SH11, in which dimethyl cinnamate was one of the major constituents. Cinnamic acid derivatives were reported to possess cytotoxic and pro-apoptotic activity in cancer cells [62].
Along with apoptosis, the pro-autophagic activity of SH1, SH4, and SH11 in MCF-7 cells was assessed by analyzing ATG5 and LC3B expression after exposure to the assessed products. Autophagy is a process of degradation of redundant or faulty cytoplasm components, in response to, among others, a deficiency in nutrients or chemotherapy. Autophagy can promote either cell survival or death. Autophagy and apoptosis may be induced in the cell simultaneously. In this case, the activation of both pathways leads to cell death [28]. In this study, it was demonstrated that SH1, SH4, and SH11 affected the expression of proteins involved in autophagy—ATG5 and LC3B. Interactions between ATG5 and BCL-XL in an autophagic cell indirectly promote apoptosis [63]. LC3B, involved in the formation of autophagosomes, is considered one of the most used autophagy markers [64]. Previously, the pro-autophagic activity of plant-derived products in breast cancer cells was reported [65]. Additionally, extract from the roots of Bryonia multiflora L. (Cucurbitaceae) enhanced the expression of LC3B in breast cancer cell lines. Interestingly, the major components of the extract were phenolic acids, including cynarine (1,5-di-caffeoylquinic acid), p-coumaric acid, and trans-ferulic acid [66]. Those and the derived compounds were present in SH1, SH4, and SH11, investigated in this study.
Progression of cancers, including breast cancers, involves pro-inflammatory cytokines as well [67]. Therefore, the effect of SH1, SH4, and SH11 on the expression of IL-8 and TNF-α was assessed. IL-8 is a proinflammatory chemokine that is a significant factor in signaling pathways, including the ones involved in angiogenesis, proliferation, and metastasis in tumors. Inhibitory activity on IL-8 signaling is a desired effect of therapeutic agents in cancer treatment [29]. In the literature, inhibition of IL-8 concentration in breast cancer cells after exposure to plant-derived products was reported in several papers [68,69]. In the present study, all three examined S. hispanica seed extracts and fractions lowered the concentration of IL-8 in MCF-7 cell lysates to a significant degree (by approximately 90%). No previous studies on the anti-inflammatory activities of S. hispanica have been reported in the literature.
Independently, the influence of SH1, SH4, and SH11 on another pro-inflammatory cytokine, TNF-α, was assessed. Present in the microenvironment of the tumor, it takes part in the development and metastasis of breast cancer, in addition to its relapse. TNF-α plays a dual role in breast cancer—it can promote apoptosis and proliferation in different breast cancer cell lines, however, the original cellular response to TNF-α is increased proliferation and induction of breast cancer metastasis. Therefore, TNF-α antagonists are suspected to suppress metastasis based on the results of preclinical research [30]. The in vitro investigation of the anti-inflammatory properties of several Scorzonera species present in Turkey revealed that aqueous methanolic extracts from the aerial parts of the plants can inhibit TNF-α production in LPS-treated leukemia cells [70]. Costantini and colleagues [71] reported that a hydrophilic fraction of the oil from pomegranate [(Punica granatum L. (Lythraceae)] seeds caused a decrease in viability and TNF-α concentration in breast cancer cell lines, but no significant impact on apoptosis was discovered. This study demonstrated that the extract and fractions from S. hispanica seeds inhibit TNF-α production in the cells, but only SH4 at the higher concentration exhibits a statistically significant inhibitory activity. Contrary to the study, all the assessed products (SH1, SH4, SH11) exhibited pro-apoptotic properties.
Scorzonera hispanica seeds yielded biologically active products, particularly SH11. According to the chemical characterization and biological studies performed for the purpose of this study, the seeds from S. hispanica can be a material of wide interest, with potential applicability in the field the breast cancer treatment.

4. Materials and Methods

4.1. Chemicals and Equipment

Hexane, BSTFA:TMCS (99:1) (N,O-Bis(trimethylsilyl)trifluoroacetamide with 1% trimethylsilyl chloride), a C7-C40 n-alkanes calibration standard, DMSO (dimethyl sulfoxide), MTT (3-(4,5-dimethylthiazole-2-yl)-2,5-diphenyltetrazolium bromide)), TRIS (2-amino-2-(hydroxymethyl)-1,3-propanediol), and SDS (sodium dodecyl sulfate) were purchased from Sigma-Aldrich (St Louis, MO, USA). For LC-MS analysis, acetonitrile Optima (ACN) (Fisher Chemical, Loughborough, UK) and ultrapure water, freshly prepared using the system POLWATER DL3-100 system (Kraków, Poland), were used. The phase modifier formic acid (FA) was ordered from Merck. The standards apigenin (A) and 3-caffeoylquinic acid (3-CQa), 4-caffeoylquinic acid (4-CQa), 5-caffeoylquinic acid (5-CQa), 3,5-di-caffeoylquinic acid (3,5-dCQa), and 4,5-di-caffeoylquinic acid (4,5-dCQa) used for the LC-MS analysis were purchased from BIOKOM (Janki, Poland). Caffeic acid (CA) was purchased from Carl Roth (Karlsruhe, Germany), while apigenin 7-O-glucuronide and luteolin (purity > 98%) were previously isolated in the Department of Pharmacognosy of the Medical University of Bialystok, Poland [72,73]. Extraction of the analyzed plant material was assisted by ultrasound generated by an ultrasonic bath (Sonic-5, Polsonic, Warsaw, Poland). Extracts and fractions were filtered and concentrated to dryness under vacuum (BÜCHI system (Flawil, Switzerland)) at a controlled temperature (40 ± 2°C) and subjected to lyophilization using Lymph-Lock 1.0 (LABCONCO, Kansas City, MO, USA) vacuum concentrator until a constant weight was obtained. The seed oil was pressed using a Wartmann oil press (Ronic, Lodz, Poland). All samples were centrifuged in an MPW-380R centrifuge (MPW Med Instruments, Warsaw, Poland). Analysis of the chemical composition of the samples was performed using an Agilent Infinity 1260 liquid chromatography system coupled with a 6230 MS/TOF mass spectrometer (Agilent, Santa Clara, CA, USA). Separation was performed on Kinetex XB-C18 column (150 × 2.1 mm, 1.7 µm) (Phenomenex, Torrance, CA, USA). The 7890A GC System coupled with a Q mass spectrometer (5975C VL MSD) (Agilent Technologies, Palo Alto, CA, USA) was used for the GC-MS analysis of samples. Cell lines (MCF-7, MDA-MB-231, and human skin fibroblasts) were purchased from American Type Culture Collection (ATCC, Manassas, VA, USA). Dulbecco’s modification of eagle medium (DMEM), 1% streptomycin/penicillin mixture, phosphate-buffered saline (PBS) without calcium and magnesium, and 0.05% trypsin with 0.02% EDTA were purchased from Corning (Kennebunk, ME, USA), 10% FBS (fetal bovine serum) was purchased from Eurx (Gdansk, Poland). Hydrogen chloride (HCl) and sodium chloride (NaCl) were purchased from POCH (Gliwice, Poland). Sodium hydroxide (NaOH) and trichloroacetic acid (TCA) were purchased from Stanlab (Lublin, Poland). [3H]-thymidine (7 Ci/mmol) was purchased from Moravek Biochemicals (Brea, CA, USA). Tween 20 and non-fat dairy milk were purchased from BIO-RAD (Warsaw, Poland). Primary and secondary antibodies for Western blot analyses were purchased from Cell Signaling Technology (Davers, MA, USA). Round 100 mm plates and 6-well plates for adherent cell culture were purchased from Sarstedt (Nümbrecht, Germany). UV-VIS Helios Gamma Spectrophotometer (Unicam/ThermoFisher Scientific Inc., Waltham, MA, USA) was used to measure the absorbance in the cell viability assay. Radioactivity in the DNA biosynthesis assay was measured in TRI-CARB 1900TR Liquid Scintillation Counter (Packard, Perkin Elmer, Inc., San Jose, CA, USA). BD Annexin V: FITC Apoptosis Detection Kit II, (ThermoFisher Scientific Inc., Waltham, MA, USA). The analysis of Annexin V: FITC was performed with a BD FACSCanto II flow cytometer (BD Biosciences Systems, San Jose, CA, USA) using FACSDiva software (version 6.1.3, BD Biosciences Systems, San Jose, CA, USA). LKB 2117 Multiphor II Electrophoresis Unit (LKB, Stockholm, Sweden) was used to perform electrophoresis. Images of the nitrocellulose membranes were captured using Bioanalytical Imaging System Azure 280 (Azure Biosystems Inc., Dublin, CA, USA). Analysis of the images was performed with ImageJ (version 1.53, National Institute of Health, Bethesda, MD, USA). High sensitivity ELISA kit for the analysis of Akt [pS473] concentration was purchased from Invitrogen (ThermoFisher Scientific, Waltham, MA, USA). ELISA kits for the quantification of ERK 1/2 [pT202/Y204], IL-8, IL-10, and TNF-α, in addition to Sigmafast NBT/BCIP solution, were purchased from Abcam (Cambridge, UK).

4.2. Plant Material, Preparation of Extracts, Fractions, and Oil

S. hispanica seeds were purchased from W. Legutko (batch number 68347; Jutrosin, Poland). For the preparation of the extracts and fractions, S. hispanica seeds were broken into pieces using an electric mill. Powdered seeds (15 g, each) were then treated with ultrasound-enhanced extraction for 5 × 15 min. at 40 °C using 100 mL of solvent for each time. Finally, elimination of the solvent yielded the extracts: SH1 (methanol) (9.1%), SH2 (50% methanol) (10.5%), SH3 (water) (21.3%), and SH8 (70% acetone (v/v)) (27.9%). In addition, the fractured seeds (90 g) were continuously extracted with petrol (SH9; 3 L × 25 h) (15.1%), then chloroform (SH10; 3.5 L × 25 h) (3.2%) using the Soxhlet apparatus. Then, the cleaned source was etched with methanol (1.5 L × 26) and 50% methanol (v/v, 1.5 L × 5) for 1 h each time. The combined alcoholic extracts were suspended in water and subjected to fractioning with solvents of increasing polarity: chloroform (SH11; 40 × 150 mL) (0.43%), diethyl ether (SH4; 59 × 150 mL) (0.37%), ethyl acetate (SH5; 60 × 150 mL) (0.63%), and n-butanol (SH6; 34 × 150 mL) (1.28%). Water residue was filtered and treated as an additional fraction named SH7 (1.58%). Fractions SH1-SH8 were freeze-dried. Cold pressing the seeds (150 g, triplicate, at 35 °C) provided the oil (SH12). The crude oil was then centrifuged (2000 rpm, 10 min, at 25 °C) and then separated from the precipitate. The pressing procedure yielded 4.8 mL of the oil (3.2%).

4.3. GC-MS Analysis of SH1, SH9-SH12

For GC-MS analysis, 15 mg of SH9 was diluted three times with hexane. However, to prepare the SH1, SH10-SH12 samples, derivatization to trimethylsilyl (TMS) derivatives was performed. For this purpose, 200 µL of BSTFA:TMCS (99:1) was mixed with 15 mg of the dry residue of the samples. The reaction mixture was then sealed and heated at 80 °C for 30 min. The SH9 and TMS derivatives of SH1, SH10, and SH11 were analyzed on a GC System coupled with a Q mass spectrometer with a source of electron ionization (EI) (the energy of ionization was 70 eV). Chromatographic separation was performed on an HP-5ms capillary column (internal diameter: 0.25 mm, film thickness: 0.25 µm, length: 30 m, Agilent Technologies), equipped with electronic pressure control and a split/splitless injector. The helium flow rate through the column was 1 mL min−1 in constant flow mode. The injector (300 °C) worked in split mode (split ratio 1:10). The injection volume was 1 µL. The initial temperature of the column was 40 °C, increased by 3 °C/min until 300 °C was reached, and maintained at 300 °C for 15 min. The MSD detector acquisition parameters were as follows: transfer line temperature—300 °C; and the MS source temperature—230 °C. Detection was performed in full scan mode from 40 to 850 amu [74]. Subsequently to integration, the calculation of the fraction of separated components in the total ion current (TIC) was performed.

4.4. Identification of the Chemical Composition of SH1, SH9-SH12

Both mass spectral data and the calculated retention indices (RI) were utilized in the identification of the compounds. The calculation of linear-temperature-programmed RI was done from the equation:
R I x = 100 n + 100 t R x t R n t R n + 1 + t R n
where t R x is the retention time of the analyzed compound (x) and t R n and t R n + 1 are retention times of n-alkanes leaving the chromatographic column before and after the under consideration.
Therefore, the dichloromethane solution of C7-C40 n-alkanes was previously separated under the above-mentioned conditions. The MS libraries used were Wiley and NIST [75]. The MS library was searched using a probability-based matching algorithm. Other literature was used to identify individuals [76,77,78,79,80]. The percentage of individual component relative number was presented as percent peak area relative to total peak area (%) (semiquantitative analysis).

4.5. LC-PDA-MS Conditions

Separation and qualitative evaluation of the extracts were performed on a C18 column using a liquid chromatograph. The qualitative and quantitative assessments were done under the following conditions: eluent A and B: UPW and ACN with 0.1% FA, respectively, flow rate: 300 μL/min; thermostat temperature 25 ± 0.8 °C; chromatogram wavelength 325 and 340 nm, UV-Vis spectrum at range 190–500 nm, injection: 1 μL. The gradient starts from 5 min of the 5% B starting condition and forms two isocrats—18% B between 15–40 min and 65% between 72–80 min with corresponding increments. Equilibration was 10 min. The MS/TOF conditions were as follows: the flow of dying and shielding—12 L/min at 350 °C. The nebulizer pressure was set at 45 psi, the capillary voltage at 2500 V with nozzle voltage 1000 V for negative ion mode. The acquisition was set at 120–1700 m/z controlled by Mass Hunter Data Acquisition 10.1. Data analysis was performed in Mass Hunter Qualitative b10.0 with a ChemStation integrator.

4.6. LC-PDA-MS Optimization and Validation

4.6.1. Preparation of Standard Solutions and Samples

The 5CQa and A were prepared in 50% MeOH, then filtered through a 0.45-μm PVDF membrane. Final solutions were achieved through the serial dilution of stock solution in volumetric flasks with the initial phase position. The working concentration range was 0.5–100 µg/mL and 2.5–100 µg/mL for 5CQa and A, respectively. Samples were prepared by carefully making aliquots, dissolving, centrifuging, and diluting in the initial mixture of phases to 1 mg/mL.

4.6.2. Chromatographic Optimization

Separation optimization allowed for the separation of substances confirmed using PDA and MS detectors. The linearity of the detector operation was assessed with a satisfactory result. Limits of detection (LOD) and quantification (LOQ) were plotted from the value of dividing the standard error of the response by slope. For LOD, multiplication by 3.3 was assumed, and for LOQ, 10 times this value. The validation process meets the ICH standards [81] and the parameters are summarized in Table 5.

4.7. Cell Culture

The cell culture medium was DMEM (10% FBS and a 1% streptomycin/penicillin mixture were added to the medium). Cell culture was maintained in 100 mm plates and placed in an incubator in the proper conditions: 37 °C, 5% CO2, and 90% humidity. After the achievement of desired confluence (approximately 85%), the cells were detached from the plate using PBS and 0.05% trypsin with 0.02% EDTA. Then, the cells, suspended in DMEM, were transferred to six-well plates with a density of 5 × 10⁵ cells per well. After 24 h of incubation in six-well plates, the cells were used for the assays presented below.

4.8. Cell Viability Assay

The investigate how SH1-SH12 affect the viability of selected cell lines, the MTT assay was performed following the modified method introduced by Carmichael et al. [82]. Cells were seeded and cultured in 6-well plates, as described in Section 4.7. Then, the cells were incubated with increasing concentrations of SH1-SH12 (up to 1000 μg/mL) in duplicate. After incubation with MTT, the solution was aspirated and DMSO was added to dissolve formazan crystals. The absorbance (read at 570 nm) in each well was referred to the untreated control cells (taken as 100%) and expressed as a percent of the mean control value, according to the method described in the previous study by the research team [83].

4.9. DNA Biosynthesis Assay

The extract and fractions selected in the preliminary cytotoxicity assay (SH1, SH4, SH11) were assessed in the DNA biosynthesis assay where the amount of [3H]-thymidine incorporated into the DNA of cells is measured as described in the previous study [84]. The mean radioactivity of untreated control wells was considered 100%. Values observed in the tested wells were expressed as a percent of the mean control value.

4.10. Flow Cytometry Evaluation of Annexin V Binding

To assess the ability of SH1, SH4, SH11, and cisplatin (cisPt) to induce apoptosis in MCF-7 cells, a flow cytometric assay with Annexin V-FITC Apoptosis Detection Kit II was performed, according to the producer’s protocol. In brief, after 24 h of incubation with various concentrations of the tested extracts and reference drug, the cells were transferred from 6-well plates to test tubes and suspended in a binding buffer. Annexin V-FITC and PI (propidium iodide) (5 μL, each) were added to each sample and the mixtures were subsequently incubated at room temperature for 15 min. The analysis was performed using a flow cytometer and FACSDiva software.

4.11. Analysis of Protein Expression Using Western Blot Technique

Cell lysate samples (SH1 and SH4: 800 μg/mL, SH11 400 μg/mL, cisPt 100 μM) containing 30 μg of protein each were subjected to SDS-PAGE. The electrophoresis was run at 100 V for 1.5 h.
The protein transfer to nitrocellulose membranes was done in the electrophoresis unit (1 h at 20 mA). After the transfer, nitrocellulose was washed with 5% non-fat dairy milk in TBS-T (TRIS-buffered saline with Tween 20 (20 mM TRIS-HCl buffer, pH 7.6, with 150 mM NaCl and 0.05% Tween 20)) for 1 h. Subsequently, overnight incubation of membranes with monoclonal antibodies against BCL-2, Bax, ATG5, LC3B, and p-FAK in TBS-T took place. Then, secondary alkaline phosphatase-conjugated antibodies against rabbit immunoglobulin (1:1000) diluted in TBS-T were added to each nitrocellulose membrane and 1 h of incubation with gentle shaking took place. After the incubation, the nitrocellulose membranes were washed with TBS-T four times and exposed to Sigmafast BCIP/NBT in the darkness. Images of the nitrocellulose membranes were subsequently captured and analyzed.

4.12. Analysis of Protein Concentration Using ELISA Technique

The evaluation of the protein concentrations (p-Akt, p-ERK 1/2, IL-8, IL-10, TNF-α) in MCF-7 cell lysates was done using high-sensitivity assay kits. Cell lysates were obtained and stored as described previously [85]. Untreated cells acted as the control. All tests were performed according to the producer’s protocols, on microplates precoated with specific antibodies, provided with the kits.

4.13. Statistical Analysis

Data from three replicates are summarized as mean ± standard deviation (SD). Statistical analysis was done in GraphPad Prism Version 6.0 (GraphPad Software, Inc., San Diego, CA, USA). The one-way ANOVA with Bonferroni multiple comparison test was performed to calculate the differences between the results obtained in the control and tested cells, in addition to linear regression parameters confirming their statistical significance. Calculations for regression parameters were made using MS Excel 2019. Statistically significant differences were defined as p < 0.05.

5. Conclusions

The results obtained throughout this study demonstrate that S. hispanica seeds, particularly the oil, are a source of multiple natural products, including saturated and unsaturated fatty acids, and phytosterols. SH12 might be a product of special interest in the future. The procedure of oil cold pressing is uncomplicated and this product exhibits no cytotoxicity toward cells in vitro. However, extracts and fractions obtained from S. hispanica seeds contain multiple bioactive compounds such as polyphenols including quinic and cinnamic acid derivatives, and apigenin, but also fatty acids and organic polyols. In the biological assays, SH1, SH4, and SH11 exhibited cytotoxic activity in the MCF-7 human mammary carcinoma cell line via the inhibition of the PI3K/Akt and ERK 1/2 cell signaling pathways. SH1, SH4, and SH11 were also observed to alter the expression of proteins related to both apoptosis and autophagy. Their inhibitory activity on IL-8 expression may lead to the suppression of angiogenesis and tumor metastasis. Nevertheless, an in-depth investigation of the activity of the extracts, in addition to their constituents, is required. So far, the results obtained in this study might suggest that S. hispanica seeds are a promising source of bioactive compounds that could potentially find use in breast cancer therapy.

Supplementary Materials

The supporting information can be downloaded at: https://www.mdpi.com/article/10.3390/ijms231911584/s1

Author Contributions

Conceptualization, K.L., A.G., M.T. and A.B.; Methodology, K.L., A.G., J.W.S. and K.B. (Katarzyna Bielawska), R.C., B.P., M.T. and W.M.; Formal analysis, K.L., J.W.S., K.B. (Katarzyna Bielawska), and B.P.; Investigation, K.L., J.W.S., K.B. (Katarzyna Bielawska), R.C. and B.P.; Resources, K.B. (Krzysztof Bielawski), M.T., W.M. and A.B.; Writing—original draft preparation, K.L., J.W.S. and K.B. (Katarzyna Bielawska); Writing—review and editing, A.G., K.B. (Krzysztof Bielawski), M.T., W.M. and A.B.; Visualization, K.L.; Supervision, A.G. and K.B. (Krzysztof Bielawski), A.B.; Project administration, A.G. and A.B.; Funding acquisition, A.G. and A.B. All authors have read and agreed to the published version of the manuscript.

Funding

This work has been financed by the Medical University of Bialystok, grant numbers: SUB/2/DN/22/001/2229 and SUB/2/DN/22/002/2229.

Institutional Review Board Statement

Not applicable.

Informed Consent Statement

Not applicable.

Data Availability Statement

The datasets used and/or analyzed during the current study are available from the corresponding author upon reasonable request.

Conflicts of Interest

The authors declare no conflict of interest.

Abbreviations

3:5-dCQa3:5-di-caffeoylquinic acid
3-CQa3-caffeoylquinic acid
4,5-dCQa4,5-di-caffeoylquinic acid
4-CQa4-caffeoylquinic acid
5-CQa5-caffeoylquinic acid
AApigenin
ACNAcetonitrile
AktProtein kinase B
ATG5Autophagy-related protein 5
BAKBCL-2 homologous antagonist
BaxBCL-2-like protein 4
BCL-2B-cell lymphoma 2
BCL-xLB-cell lymphoma extra-large
CACaffeic acid
cisPtCisplatin
CLAConjugated linoleic acid
DMEMDulbecco’s modification of Eagle medium
EDTAEthylenediaminetetraacetic acid
EIElectron ionization
ERKExtracellular signal-regulated kinase
FAFormic acid
FAKFocal adhesion kinase
FBSFetal bovine serum
GC-MSGas chromatography-mass spectrometry
IC25Quarter-maximal inhibitory concentration
IC50Half-maximal inhibitory concentration
IL-8Interleukin 8
LALinoleic acid
LC-PDA-MSLiquid chromatography-photodiode array-mass spectrometry
LC3BLight chain 3B
LODLimit of detection
LOQLimit of quantification
MTT3-(4,5-dimethylthiazol-2-yl)-2,5-diphenyl-2H-tetrazolium bromide
NF-κBNuclear factor kappa B
OAOleic acid
PAPalmitic acid
PAGEPolyacrylamide gel electrophoresis
PBSPhosphate-buffered saline
PIPropidium iodide
PI3KPhosphoinositide 3-kinase
QAQuinic acid
RIRetention index
SDSSodium dodecyl sulfate
TBS-TTRIS-buffered saline with Tween 20
TCATrichloroacetic acid
TICTotal ion current
TMSTrimethylsilyl
TNF-αTumor necrosis factor-alpha
TRISTris(hydroxymethyl)aminomethane
UFAUnsaturated fatty acids
UPWUltra-pure water

References

  1. Duran, A.; Hamzaoğlu, E. A New Species of Scorzonera L. (Asteraceae) from South Anatolia, Turkey. Biologia 2004, 59, 47–50. [Google Scholar]
  2. Zaika, M.A.; Kilian, N.; Jones, K.; Krinitsina, A.A.; Nilova, M.V.; Speranskaya, A.S.; Sukhorukov, A.P. Scorzonera sensu lato (Asteraceae, Cichorieae)—Taxonomic reassessment in the light of new molecular phylogenetic and carpological analyses. PhytoKeys 2020, 137, 1–85. [Google Scholar] [CrossRef] [PubMed]
  3. Wang, Y.; Edrada-Ebel, R.; Tsevegsuren, N.; Sendker, J.; Braun, M.; Wray, V.; Lin, W.; Proksch, P. Dihydrostilbene derivatives from the Mongolian medicinal plant Scorzonera radiata. J. Nat. Prod. 2009, 72, 671–675. [Google Scholar] [CrossRef] [PubMed]
  4. Buranov, A.U.; Elmuradov, B.J. Extraction and characterization of latex and natural rubber from rubber-bearing plants. J. Agric. Food Chem. 2010, 58, 734–743. [Google Scholar] [CrossRef]
  5. Bahadır Acıkara, Ö.; Citoğlu Gülçin, S.; Dall’Acqua, S.; Özbek, H.; Cvačka, J.; Žemlička, M.; Šmejkal, K. Bioassay-guided isolation of the antinociceptive compounds motiol and β-sitosterol from Scorzonera latifolia root extract. Pharmazie 2014, 69, 711–714. [Google Scholar] [CrossRef]
  6. Karakaya, S.; Polat, A.; Aksakal, Ö.; Sümbüllü, Y.Z.; İncekara, Ü. Ethnobotanical study of medicinal plants in Aziziye district (Erzurum, Turkey). Turk. J. Pharm. Sci. 2020, 17, 211–220. [Google Scholar] [CrossRef]
  7. Yaldiz, G.; Koca Çalişkan, U.; Aka, C. In vitro screening of natural drug potentials for mass production. Not. Bot. Horti Agrobot. Cluj-Napoca 2017, 45, 292–300. [Google Scholar] [CrossRef]
  8. Tsevegsuren, N.; Edrada, R.A.; Lin, W.; Ebel, R.; Torre, C.; Ortlepp, S.; Wray, V.; Proksch, P. Biologically active natural products from Mongolian medicinal plants Scorzonera divaricata and Scorzonera pseudodivaricata. J. Nat. Prod. 2007, 70, 962–967. [Google Scholar] [CrossRef]
  9. Lendzion, K.; Gornowicz, A.; Bielawski, K.; Bielawska, A. phytochemical composition and biological activities of Scorzonera species. Int. J. Mol. Sci. 2021, 22, 5128. [Google Scholar] [CrossRef]
  10. Wu, Q.-X.; Su, Y.-B.; Zhu, Y. Triterpenes and steroids from the roots of Scorzonera austriaca. Fitoterapia 2011, 82, 493–496. [Google Scholar] [CrossRef]
  11. Yang, Y.-J.; Yao, J.; Jin, X.-J.; Shi, Z.-N.; Shen, T.-F.; Fang, J.-G.; Yao, X.-J.; Zhu, Y. Sesquiterpenoids and tirucallane triterpenoids from the roots of Scorzonera divaricata. Phytochemistry 2016, 124, 86–98. [Google Scholar] [CrossRef] [PubMed]
  12. Bahadır-Acıkara, Ö.; Özbilgin, S.; Saltan-İşcan, G.; Dall’Acqua, S.; Rjašková, V.; Özgökçe, F.; Suchý, V.; Šmejkal, K. Phytochemical analysis of Podospermum and Scorzonera n-hexane extracts and the HPLC quantitation of triterpenes. Molecules 2018, 23, 1813. [Google Scholar] [CrossRef] [PubMed]
  13. Bahadır Acıkara, Ö.; Akkol, E.K.; Süntar, I.; Ergene, B.; Saltan-Çitoğlu, G.; Çoban, T. Assessment of anti-inflammatory and free radical scavenger activities of selected Scorzonera species and determination of active components. Int. J. Pharmacogn. Phytochem. Res. 2014, 6, 492–498. [Google Scholar]
  14. Donia, A.E.R.M. Phytochemical and pharmacological studies on Scorzonera alexandrina Boiss. J. Saudi Chem. Soc. 2016, 20, S433–S439. [Google Scholar] [CrossRef]
  15. Akkol, E.K.; Acikara, O.B.; Süntar, I.; Citolu, G.S.; Kele, H.; Ergene, B. Enhancement of wound healing by topical application of Scorzonera species: Determination of the constituents by HPLC with new validated reverse phase method. J. Ethnopharmacol. 2011, 137, 1018–1027. [Google Scholar] [CrossRef]
  16. Akkol, E.K.; Šmejkal, K.; Kurtul, E.; Ilhan, M.; Güragac, F.T.; Çitoğlu, G.S.; Acıkara, Ö.B.; Cvačka, J.; Buděšínský, M. Inhibitory activity of Scorzonera latifolia and its components on enzymes connected with healing process. J. Ethnopharmacol. 2019, 245, 112168. [Google Scholar] [CrossRef]
  17. Granica, S.; Lohwasser, U.; Jöhrer, K.; Zidorn, C. Qualitative and quantitative analyses of secondary metabolites in aerial and subaerial of Scorzonera hispanica L. (black salsify). Food Chem. 2015, 173, 321–331. [Google Scholar] [CrossRef]
  18. Zidorn, C.; Ellmerer-Müller, E.P.; Stuppner, H. Sesquiterpenoids from Scorzonera hispanica L. Pharmazie 2000, 55, 550–551. [Google Scholar]
  19. Granica, S.; Zidorn, C. Phenolic compounds from aerial parts as chemosystematic markers in the Scorzonerinae (Asteraceae). Biochem. Syst. Ecol. 2015, 58, 102–113. [Google Scholar] [CrossRef]
  20. Petkova, N. Characterization of inulin from black salsify (Scorzonera hispanica L.) for food and pharmaceutical purposes. Asian J. Pharm. Clin. Res. 2018, 11, 221–225. [Google Scholar] [CrossRef]
  21. Park, B.Y.; Oh, S.R.; Ahn, K.S.; Kwon, O.K.; Lee, H.K. (-)-Syringaresinol inhibits proliferation of human promyelocytic HL-60 leukemia cells via G1 arrest and apoptosis. Int. Immunopharmacol. 2008, 8, 967–973. [Google Scholar] [CrossRef] [PubMed]
  22. Jeong, Y.H.; Chung, S.Y.; Han, A.R.; Sung, M.K.; Jang, D.S.; Lee, J.; Kwon, Y.; Lee, H.J.; Seo, E.K. P-glycoprotein inhibitory activity of two phenolic compounds, (-)-syringaresinol and tricin from Sasa borealis. Chem. Biodivers. 2007, 4, 12–16. [Google Scholar] [CrossRef] [PubMed]
  23. Liu, W.; Zhang, L.; Shi, J.; Liu, Y.; Zhou, L.; Hou, K.; Qu, X.; Teng, Y. clinical significance of pAkt and pErk1/2 expression in early-stage breast cancer patients treated with anthracycline-based adjuvant chemotherapy. Oncol Lett 2015, 9, 1707–1714. [Google Scholar] [CrossRef] [PubMed]
  24. Han, Q.; Xiao, F.; Ma, L.; Zhou, J.; Wang, L.; Cheng, H.; Zhu, J.; Yao, F.; Lyu, J.; Du, L. DDR1 promotes migration and invasion of breast cancer by modulating the Src-FAK signaling. Neoplasma 2022, 220316N289. [Google Scholar] [CrossRef] [PubMed]
  25. Sulzmaier, F.J.; Jean, C.; Schlaepfer, D.D. FAK in cancer: Mechanistic findings and clinical applications. Nat. Rev. Cancer 2014, 14, 598–610. [Google Scholar] [CrossRef]
  26. Lindsay, J.; Esposti, M.D.; Gilmore, A.P. Bcl-2 Proteins and Mitochondria—Specificity in membrane targeting for death. Biochim. Biophys. Acta (BBA) Mol. Cell Res. 2011, 1813, 532–539. [Google Scholar] [CrossRef]
  27. Marquez, R.T.; Xu, L. Bcl-2:Beclin 1 Complex: Multiple, Mechanisms Regulating Autophagy/Apoptosis Toggle Switch. Am. J. Cancer Res. 2012, 2, 214. [Google Scholar]
  28. Buzun, K.; Gornowicz, A.; Lesyk, R.; Bielawski, K.; Bielawska, A. Autophagy Modulators in Cancer Therapy. Int. J. Mol. Sci. 2021, 22, 5804. [Google Scholar] [CrossRef]
  29. Waugh, D.J.J.; Wilson, C. The Interleukin-8 pathway in Cancer. Clin. Cancer Res. 2008, 14, 6735–6741. [Google Scholar] [CrossRef]
  30. Cruceriu, D.; Baldasici, O.; Balacescu, O.; Berindan-Neagoe, I. The Dual Role of Tumor Necrosis Factor-Alpha (TNF-α) in Breast Cancer: Molecular Insights and Therapeutic Approaches. Cell. Oncol. 2020, 43, 1–8. [Google Scholar] [CrossRef]
  31. Dennis, K.L.; Blatner, N.R.; Gounari, F.; Khazaie, K. Current Status of IL-10 and Regulatory T-Cells in Cancer. Curr. Opin. Oncol. 2013, 25, 637. [Google Scholar] [CrossRef] [PubMed]
  32. Chang, C.M.; Lam, H.Y.P.; Hsu, H.J.; Jiang, S.J. Interleukin-10: A double-edged sword in breast cancer. Tzu Chi Med. J. 2021, 33, 203–211. [Google Scholar] [CrossRef] [PubMed]
  33. Gornowicz, A.; Kałuża, Z.; Bielawska, A.; Gabryel-Porowska, H.; Czarnomysy, R.; Bielawski, K. Cytotoxic efficacy of a novel dinuclear platinum(II) complex used with anti-MUC1 in human breast cancer cells. Mol. Cell. Biochem. 2014, 392, 161–174. [Google Scholar] [CrossRef] [PubMed]
  34. Lopes, C.M.; Dourado, A.; Oliveira, R. Phytotherapy and nutritional supplements on breast cancer. Biomed. Res. Int. 2017, 2017, 7207983. [Google Scholar] [CrossRef] [PubMed]
  35. Puskulluoglu, M.; Uchańska, B.; Tomaszewski, K.A.; Zygulska, A.L.; Zielińska, P.; Grela-Wojewoda, A. Use of complementary and alternative medicine among Polish cancer patients. Nowotwory. J. Oncol. 2021, 71, 274–281. [Google Scholar] [CrossRef]
  36. Drozdoff, L.; Klein, E.; Kiechle, M.; Paepke, D. Use of biologically-based complementary medicine in breast and gynecological cancer patients during systemic therapy. BMC Complement. Altern. Med. 2018, 18, 259. [Google Scholar] [CrossRef]
  37. Leggett, S.; Koczwara, B.; Miller, M. The impact of complementary and alternative medicines on cancer symptoms, treatment side effects, quality of life, and survival in women with breast cancer—A systematic review. Nutr. Cancer 2015, 67, 373–391. [Google Scholar] [CrossRef]
  38. McGrowder, D.A.; Miller, F.G.; Nwokocha, C.R.; Anderson, M.S.; Wilson-Clarke, C.; Vaz, K.; Anderson-Jackson, L.; Brown, J. medicinal herbs used in traditional management of breast cancer: Mechanisms of action. Medicines 2020, 7, 47. [Google Scholar] [CrossRef]
  39. Gharby, S.; Harhar, H.; Bouzoubaa, Z.; Asdadi, A.; El Yadini, A.; Charrouf, Z. Chemical characterization and oxidative stability of seeds and oil of sesame grown in Morocco. J. Saudi Soc. Agric. Sci. 2017, 16, 105–111. [Google Scholar] [CrossRef]
  40. Xu, H.; Li, Y.; Han, B.; Li, Z.; Wang, B.; Jiang, P.; Zhang, J.; Ma, W.; Zhou, D.; Li, X.; et al. Anti-breast-cancer activity exerted by β-sitosterol- d -glucoside from sweet potato via upregulation of microRNA-10a and via the PI3K-Akt signaling pathway. J. Agric. Food Chem. 2018, 66, 9704–9718. [Google Scholar] [CrossRef]
  41. Zhao, M.; Zhong, Q.; Tian, M.; Han, R.; Ren, Y. Comparative transcriptome analysis reveals differentially expressed genes associated with the development of Jerusalem artichoke tuber (Helianthus tuberosus L.). Ind. Crops Prod. 2020, 151, 112455. [Google Scholar] [CrossRef]
  42. Yilmaz, E.; Güneşer, B.A. Cold pressed versus solvent extracted lemon (Citrus limon L.) seed oils: Yield and properties. J. Food Sci. Technol. 2017, 54, 1891–1900. [Google Scholar] [CrossRef]
  43. Konopka, I.; Roszkowska, B.; Czaplicki, S.; Tańska, M. Optimization of pumpkin oil recovery by using aqueous enzymatic extraction and comparison of the quality of the obtained oil with the quality of cold-pressed oil. Food Technol. Biotechnol. 2016, 54, 413–420. [Google Scholar] [CrossRef] [PubMed]
  44. Tantivejkul, K.; Vucenik, I.; Eiseman, J.; Shamsuddin, A.K.M. Inositol hexaphosphate (IP6) enhances the anti-proliferative effects of adriamycin and tamoxifen in breast cancer. Breast Cancer Res. Treat. 2003, 79, 301–312. [Google Scholar] [CrossRef] [PubMed]
  45. Teng, Y.N.; Wang, C.C.N.; Liao, W.C.; Lan, Y.H.; Hung, C.C. caffeic acid attenuates multi-drug resistance in cancer cells by inhibiting efflux function of human P-glycoprotein. Molecules 2020, 25, 247. [Google Scholar] [CrossRef]
  46. Rosendahl, A.H.; Perks, C.M.; Zeng, L.; Markkula, A.; Simonsson, M.; Rose, C.; Ingvar, C.; Holly, J.M.P.; Jernström, H. Caffeine and caffeic acid inhibit growth and modify estrogen receptor and insulin-like growth factor I receptor levels in human breast cancer. Clin. Cancer Res. 2015, 21, 1877–1887. [Google Scholar] [CrossRef] [PubMed]
  47. Ghasemzadeh, A.; Talei, D.; Jaafar, H.Z.E.; Juraimi, A.S.; Mohamed, M.T.M.; Puteh, A.; Halim, M.R.A. Plant-growth regulators alter phytochemical constituents and pharmaceutical quality in Sweet potato (Ipomoea batatas L.). BMC Complement. Altern. Med. 2016, 16, 152. [Google Scholar] [CrossRef]
  48. Elansary, H.O.; Szopa, A.; Kubica, P.; Ekiert, H.; Al-Mana, F.A.; El-Shafei, A.A. Polyphenols of Frangula alnus and Peganum harmala leaves and associated biological activities. Plants 2020, 9, 1086. [Google Scholar] [CrossRef]
  49. Shendge, A.K.; Chaudhuri, D.; Basu, T.; Mandal, N. A natural flavonoid, apigenin isolated from Clerodendrum viscosum leaves, induces G2/M phase cell cycle arrest and apoptosis in MCF-7 cells through the regulation of p53 and caspase-cascade pathway. Clin. Transl. Oncol. 2021, 23, 718–730. [Google Scholar] [CrossRef]
  50. Hostanska, K.; Nisslein, T.; Freudenstein, J.; Reichling, J.; Saller, R. evaluation of cell death caused by triterpene glycosides and phenolic substances from Cimicifuga racemosa extract in human MCF-7 breast cancer cells. Biol. Pharm. Bull. 2004, 27, 1970–1975. [Google Scholar] [CrossRef]
  51. Whyte, J.; Bergin, O.; Bianchi, A.; McNally, S.; Martin, F. Key signalling nodes in mammary gland development and cancer. Mitogen-activated protein kinase signalling in experimental models of breast cancer progression and in mammary gland development. Breast Cancer Res. 2009, 11, 209. [Google Scholar] [CrossRef] [PubMed]
  52. Seo, J.H.; Moon, H.S.; Kim, I.Y.; Guo, D.D.; Lee, H.G.; Choi, Y.J.; Cho, C.S. PEGylated conjugated linoleic acid stimulation of apoptosis via a p53-mediated signaling pathway in MCF-7 breast cancer cells. Eur. J. Pharm. Biopharm. 2008, 70, 621–626. [Google Scholar] [CrossRef] [PubMed]
  53. Dan, H.C.; Cooper, M.J.; Cogswell, P.C.; Duncan, J.A.; Ting, J.P.Y.; Baldwin, A.S. Akt-dependent regulation of NF-κB is controlled by mTOR and Raptor in association with IKK. Genes Dev. 2008, 22, 1490–1500. [Google Scholar] [CrossRef] [PubMed]
  54. Kello, M.; Takac, P.; Kubatka, P.; Kuruc, T.; Petrova, K.; Mojzis, J. Oxidative stress-induced DNA damage and apoptosis in clove buds-treated MCF-7 cells. Biomolecules 2020, 10, 139. [Google Scholar] [CrossRef] [PubMed] [Green Version]
  55. Chun, J.; Han, L.; Xu, M.Y.; Wang, B.; Cheng, M.S.; Kim, Y.S. The induction of apoptosis by a newly synthesized diosgenyl saponin through the suppression of estrogen receptor-α in MCF-7 human breast cancer cells. Arch. Pharm. Res. 2014, 37, 1477–1486. [Google Scholar] [CrossRef] [PubMed]
  56. Luo, M.; Guan, J.L. Focal Adhesion Kinase: A prominent determinant in breast cancer initiation, progression and metastasis. Cancer Lett 2010, 289, 127–139. [Google Scholar] [CrossRef]
  57. Kello, M.; Kulikova, L.; Vaskova, J.; Nagyova, A.; Mojzis, J. Fruit Peel Polyphenolic Extract-Induced Apoptosis in Human Breast Cancer Cells Is Associated with ROS Production and Modulation of p38MAPK/Erk1/2 and the Akt Signaling Pathway. Nutr. Cancer 2017, 69, 920–931. [Google Scholar] [CrossRef]
  58. Yu, C.H.; Chu, S.C.; Yang, S.F.; Hsieh, Y.S.; Lee, C.Y.; Chen, P.N. Induction of apoptotic but not autophagic cell death by Cinnamomum cassia extracts on human oral cancer cells. J. Cell. Physiol. 2019, 234, 5289–5303. [Google Scholar] [CrossRef]
  59. Marie Hardwick, J.; Soane, L. Multiple functions of BCL-2 family proteins. Cold Spring Harb. Perspect. Biol. 2013, 5, a008722. [Google Scholar] [CrossRef]
  60. Edlich, F. BCL-2 proteins and apoptosis: Recent insights and unknowns. Biochem. Biophys. Res. Commun. 2018, 500, 26–34. [Google Scholar] [CrossRef]
  61. Irshad, M.; Jafar Mehdi, S.; Al-Fatlawi, A.A.; Zafaryab, M.; Ali, A.; Ahmad, I.; Singh, M.; Moshahid Rizvi, M.A. Phytochemical composition of Cassia fistula fruit extracts and its anticancer activity against human cancer cell lines. J. Biol. Act. Prod. Nat. 2014, 4, 158–170. [Google Scholar] [CrossRef]
  62. Ruwizhi, N.; Aderibigbe, B.A. Cinnamic acid derivatives and their biological efficacy. Int. J. Mol. Sci. 2020, 21, 5712. [Google Scholar] [CrossRef] [PubMed]
  63. Yousefi, S.; Perozzo, R.; Schmid, I.; Ziemiecki, A.; Schaffner, T.; Scapozza, L.; Brunner, T.; Simon, H.U. Calpain-mediated cleavage of Atg5 switches autophagy to apoptosis. Nat. Cell Biol. 2006, 8, 1124–1132. [Google Scholar] [CrossRef] [PubMed]
  64. Koukourakis, M.I.; Kalamida, D.; Giatromanolaki, A.; Zois, C.E.; Sivridis, E.; Pouliliou, S.; Mitrakas, A.; Gatter, K.C.; Harris, A.L. Autophagosome proteins LC3A, LC3B and LC3C have distinct subcellular distribution kinetics and expression in cancer cell lines. PLoS ONE 2015, 10, e0137675. [Google Scholar] [CrossRef] [PubMed] [Green Version]
  65. Weng, J.R.; Yen, M.H.; Lin, W.Y. Cytotoxic constituents from Celastrus paniculatus induce apoptosis and autophagy in breast cancer cells. Phytochemistry 2013, 94, 211–219. [Google Scholar] [CrossRef]
  66. Tokgun, O.; Tokgun, P.E.; Turel, S.; Inal, B.; Inci, K.; Tan, S.; Can Alvur, O. Bryonia multiflora extract induces autophagy via regulating long non-coding RNAs in breast cancer cells. Nutr. Cancer 2021, 73, 1792–1803. [Google Scholar] [CrossRef]
  67. Esquivel-Velázquez, M.; Ostoa-Saloma, P.; Palacios-Arreola, M.I.; Nava-Castro, K.E.; Castro, J.I.; Morales-Montor, J. The role of cytokines in breast cancer development and progression. J. Interf. Cytokine Res. 2015, 35, 1–16. [Google Scholar] [CrossRef]
  68. Santos, A.F.; Santos Mota, N.S.R.; Schiefer, E.M.; da Cunha, R.S.; Junkert, A.M.; Stinghen, A.E.M.; Pontarolo, R.; Crisma, A.R.; Weffort-Santos, A.M.; Pedrosa, R.C.; et al. The toxicity of Aspidosperma subincanum to MCF7 cells is related to modulation of oxidative status and proinflammatory pathways. J. Ethnopharmacol. 2021, 281, 114512. [Google Scholar] [CrossRef]
  69. Kim, S.J.; Pham, T.H.; Bak, Y.; Ryu, H.W.; Oh, S.R.; Yoon, D.Y. 7-Methoxy-luteolin-8-C-β-6-deoxy-xylo-pyranos-3-uloside exactly (mLU8C-PU) isolated from Arthraxon hispidus inhibits migratory and invasive responses mediated via downregulation of MMP-9 and IL-8 expression in MCF-7 breast cancer cells. Environ. Toxicol. 2018, 33, 1143–1152. [Google Scholar] [CrossRef]
  70. Bahadır Acikara, Ö.; Hošek, J.; Babula, P.; Cvačka, J.; Budešínský, M.; Dračinský, M.; Saltan İşcan, G.; Kadlecová, D.; Ballová, L.; Šmejkal, K. Turkish Scorzonera species extracts attenuate cytokine secretion via inhibition of NF-κB activation, showing anti-inflammatory effect in vitro. Molecules 2016, 21, 43. [Google Scholar] [CrossRef]
  71. Costantini, S.; Rusolo, F.; De Vito, V.; Moccia, S.; Picariello, G.; Capone, F.; Guerriero, E.; Castello, G.; Volpe, M.G. Potential anti-inflammatory effects of the hydrophilic fraction of pomegranate (Punica granatum L.) seed oil on breast cancer cell lines. Molecules 2014, 19, 8644–8660. [Google Scholar] [CrossRef] [PubMed]
  72. Nazaruk, J.; Jakoniuk, P. Flavonoid composition and antimicrobial activity of Cirsium rivulare (Jacq.) All. flowers. J. Ethnopharmacol. 2005, 102, 208–212. [Google Scholar] [CrossRef] [PubMed]
  73. Juszczak, A.M.; Czarnomysy, R.; Strawa, J.W.; Končić, M.Z.; Bielawski, K.; Tomczyk, M. In vitro anticancer potential of Jasione montana and its main components against human amelanotic melanoma cells. Int. J. Mol. Sci. 2021, 22, 3345. [Google Scholar] [CrossRef] [PubMed]
  74. Isidorov, V.A.; Smolewska, M.; Purzyåska-Pugacewicz, A.; Tyszkiewicz, Z. Chemical composition of volatile and extractive compounds of pine and spruce leaf litter in the initial stages of decomposition. Biogeosciences 2010, 7, 2785–2794. [Google Scholar] [CrossRef] [Green Version]
  75. National Institute of Standard and Technology. NIST Chemistry WebBook; National Institute of Standard and Technology: Gaithersburg, MD, USA, 2013. [Google Scholar]
  76. Isidorov, V.A.; Kotowska, U.; Vinogorova, V.T. GC identification of organic compounds based on partition coefficients of their TMS derivatives in a hexane-acetonitrile system and retention indices. Anal. Sci. 2005, 21, 1483–1489. [Google Scholar] [CrossRef]
  77. Isidorov, V.A.; Szczepaniak, L. Gas chromatographic retention indices of biologically and environmentally important organic compounds on capillary columns with low-polar stationary phases. J. Chromatogr. A 2009, 1216, 8998–9007. [Google Scholar] [CrossRef]
  78. Isidorov, V.A.; Stocki, M.; Vetchinikova, L. Inheritance of specific secondary volatile metabolites in buds of white birch Betula pendula and Betula pubescens hybrids. Trees Struct. Funct. 2019, 33, 1329–1344. [Google Scholar] [CrossRef]
  79. Babushok, V.I.; Linstrom, P.J.; Zenkevich, I.G. Retention indices for frequently reported compounds of plant essential oils. J. Phys. Chem. Ref. Data 2011, 40, 043101. [Google Scholar] [CrossRef]
  80. Adams, R.P. Identification of Essential Oil Components by Gas Chromatography/Mass Spectrometry, 4th ed.; Allured Publishing Corporation: Carol Streams, IL, USA, 2007; ISBN 1932633219. [Google Scholar]
  81. ICH. In Proceedings of the 6th International Conference on Harmonization. Geneva, Switzerland, 1 November 2005. [Google Scholar]
  82. Carmichael, J.; DeGraff, W.G.; Gazdgar, A.F.; Minna, J.D.; Mitchel, J.B. evaluation of a tetrazolium-based semiautomated colorimetric assay: Assessment of chemosensitivity testing. Cancer Res. 1987, 47, 936–942. [Google Scholar]
  83. Gornowicz, A.; Szymanowski, W.; Bielawski, K.; Kałuża, Z.; Michalak, O.; Bielawska, A. Mucin 1 as a molecular target of a novel diisoquinoline derivative combined with anti-MUC1 antibody in AGS gastric cancer cells. Molecules 2021, 26, 6504. [Google Scholar] [CrossRef]
  84. Gornowicz, A.; Szymanowski, W.; Czarnomysy, R.; Bielawski, K.; Bielawska, A. Anti-HER2 monoclonal antibodies intensify the susceptibility of human gastric cancer cells to etoposide by promoting apoptosis, but not autophagy. PLoS ONE 2021, 16, e0255585. [Google Scholar] [CrossRef] [PubMed]
  85. Buzun, K.; Gornowicz, A.; Lesyk, R.; Kryshchyshyn-Dylevych, A.; Gzella, A.; Czarnomysy, R.; Latacz, G.; Olejarz-Maciej, A.; Handzlik, J.; Bielawski, K.; et al. 2-{5-[(Z,2Z)-2-Chloro-3-(4-nitrophenyl)-2-propenylidene]-4-oxo-2-thioxothiazolidin-3-yl}-3-methylbutanoic acid as a potential anti-breast cancer molecule. Int. J. Mol. Sci. 2022, 23, 4091. [Google Scholar] [CrossRef] [PubMed]
Figure 1. Structures of major compounds (D-chiro-inositol, β-sitosterol, methyl 3,4-dimethoxycinnamate, caffeic acid, cis-3,5-dicaffeoylquinic acid, linoleic acid, palmitic acid, oleic acid) identified in SH1-SH12.
Ijms 23 11584 g001
Figure 2. The influence of SH1, SH4, and SH11 on the viability of MCF-7 (A) and MDA-MB-231 (B) cell lines after 24 h of incubation with increasing concentrations of the given extract and fractions (300–1000 μg/mL). Values are presented as mean ± SD from three independent experiments performed in duplicate.
Ijms 23 11584 g002
Figure 3. The effect of SH1, SH4, and SH11 on the process of DNA biosynthesis in MCF-7 (A) and MDA-MB-231 (B) cell lines after 24 h of incubation with increasing concentrations of the given extract and fractions (300–1000 μg/mL). Values are presented as mean ± SD from three independent experiments performed in duplicate.
Ijms 23 11584 g003
Figure 4. Apoptosis induction in MCF-7 breast cancer cells after 24-h incubation with SH1, SH4, SH11, and cisPt as a reference. The tested concentrations were 600 and 800 μg/mL for SH1 and SH4, 200 and 400 μg/mL for SH11, and 50 and 100 μM for cisPt. The number of total early and late apoptotic cells, in addition to the number of necrotic cells, are the mean percentage from three experiments performed in duplicate.
Ijms 23 11584 g004
Figure 5. Western blot analyses of BCL-2, Bax, ATG5, LC3B, and p-FAK expression in MCF-7 cells after 24-h incubation with SH1, SH4, SH11, and cisPt. The tested concentrations were 800 μg/mL for SH1 and SH4, 400 μg/mL for SH11, and 100 μM for cisPt. Results are presented as mean optical density ± SD from three measurements. Statistical significance was calculated using one-way ANOVA with Bonferroni multiple comparison test. Differences were considered statistically significant at * (p ≤ 0.05), ** (p ≤ 0.005), *** (p ≤ 0.0005), and **** (p ≤ 0.0001).
Ijms 23 11584 g005
Figure 6. Concentrations of Akt [pS473] in MCF-7 human breast cancer cells after 24-h incubation with SH1 and SH4 at concentrations of 600 μg/mL and 800 μg/mL, SH11 at 200 μg/mL and 400 μg/mL, and cisPt at 50 μM and 100 μM. Results are presented as mean ± SD from three experiments performed in duplicate. Statistical significance was calculated using one-way ANOVA with Bonferroni multiple comparison test. Differences were considered statistically significant at **** (p ≤ 0.0001).
Ijms 23 11584 g006
Figure 7. Concentrations of ERK 1/2 [pT202/Y204] in MCF-7 cells after 24-h incubation with SH1, SH4, SH11, and cisPt. The tested concentrations were 600 μg/mL and 800 μg/mL for SH1 and SH4, 200 μg/mL and 400 μg/mL for SH11, and 50 μM and 100 μM for cisPt. Results are presented as mean ± SD from three independent experiments performed in duplicate. Statistical significance was calculated using one-way ANOVA with Bonferroni multiple comparison test. Differences were considered statistically significant at * (p ≤ 0.05), ** (p ≤ 0.005), and **** (p ≤ 0.0001).
Ijms 23 11584 g007
Figure 8. Concentrations of pro-inflammatory cytokines TNF-α (A) and IL-8 (B), and anti-inflammatory cytokine IL-10 (C) in MCF-7 human breast cancer cells after 24-h incubation with SH1 and SH4 at concentrations of 600 μg/mL and 800 μg/mL and SH11 at concentrations of 200 μg/mL and 400 μg/mL. Results are presented as mean ± SD from three experiments performed in duplicate. Statistical significance was calculated using one-way ANOVA with Bonferroni multiple comparison test. Differences were considered statistically significant at **** (p ≤ 0.0001), *** (p ≤ 0.0005), ** (p ≤ 0.005), and * (p ≤ 0.05).
Ijms 23 11584 g008
Table 1. GC-MS analysis of compound groups identified in SH1, SH9-SH12.
CompoundsAnalytical ParametersRelative Composition, %
RIExpRILitTarget Ions, m/zM+SH1SH9SH10SH11SH12
Organic Acids 11.241.753.041.062.2
Fatty acids 7.541.744.233.061.8
Linoleic acid (LA, 18:2), mono-TMS2220221573 (100), 75 (99), 337 (86), 67 (62), 81 (59)3523.738.718.89.927.2
Oleic acid (OA, 18:1), mono-TMS22252220339 (100), 73 (93), 117 (92), 75 (86), 129 (76)3541.4 9.06.516.0
Palmitic acid (PA, 16:0), mono-TMS20542052313 (100), 117 (91), 73 (71), 75 (51), 132 (42)3281.2 6.95.915.7
Conjugated linoleic acid (CLA, 18:2), mono-TMS 73 (100), 75 (83), 117 (62), 129 (50), 105 (48)3520.32.10.42.4
Aliphatic monocarboxylic acids 0.1 1.41.60.4
Hexanoic acid (6:0), mono-TMS1078107175 (100), 173 (87), 73 (85), 117 (38), 131 (15)1880.02 0.80.80.4
Nonanoic acid (9:0), mono-TMS1366135873 (100), 75 (76), 215 (74), 117 (61), 129 (25)230 0.20.4
Octanoic acid (8:0), mono-TMS1269126273 (100), 75 (86), 201 (84), 117 (60), 129 (23)2160.03 0.20.2
Aliphatic dicarboxylic acid 1.2 6.12.2
Glutaric acid, di-TMS1388139473 (100), 147 (85), 131 (41), 103 (23), 59 (16)2760.3 4.10.4
Azelaic acid, di-TMS1810181273 (100), 75 (78), 317 (53), 201 (41), 129 (33)332 1.00.7
Malic acid, tri-TMS1513151073 (100), 147 (70), 233 (26), 245 (16), 133 (12)3500.6
Sebacic acid, di-TMS1907190573 (100), 75 (76), 331 (65), 215 (36), 129 (34) 0.30.4
Aromatic acids 0.03 0.30.7
Benzoic acid, mono-TMS12471248179 (100), 147 (81), 105 (69), 135 (48), 77 (46)1940.03 0.10.2
Phenylacetic acid, mono-TMS1300130273 (100), 75 (32), 164 (19), 91 (17), 193 (16)208 0.2
Salicylic acid, di-TMS1518151373 (100), 267 (46), 147 (29), 103 (24), 75 (19) 0.2
Aliphatic hydroxy acids 0.6 0.60.6
L (+)-Lactic acid, di-TMS1073107373 (100), 147 (77), 117 (62), 198 (18), 191 (15) 0.1 0.2
β-Lactic acid, di-TMS11551145147 (100), 73 (31), 177 (18), 119 (17), 148 (15) 0.03 0.2
Glycolic acid, di-TMS10861085147 (100), 73 (76), 148 (17), 66 (16), 133 (11) 0.05 0.2
2-Isopropyl-3-ketobutyrate, di-O-TMS1461146373 (100), 273 (80), 147 (42), 155 (31), 183 (22)288 0.25
Glyceric acid, tri-TMS1351135073 (100), 147 (69), 189 (39), 292 (31), 199 (27) 0.18 0.17
Aromatic hydroxy acids 1.8 0.22.0
Quinic acid, penta-TMS1899190273 (100), 345 (60), 147 (32), 75 (27), 255 (25) 1.5 0.1
Shikimic acid, tetra-TMS18441845252 (100), 73 (88), 204 (83), 131 (56), 103 (36) 1.2
Hydroxybenzoic acid, di-TMS1623162373 (100), 267 (42), 193 (33), 282 (32), 103 (13)2820.02 0.5
α,β-Unsaturated carboxylic acids 0.1 0.10.9
Cinnamic acid, mono-TMS15461549205 (100), 131 (81), 103 (54), 161 (50), 73 (47)220 0.4
E-p-Coumaric acid, di-TMS1947194773 (100), 293 (81), 219 (87), 308 (69), 249 (45)3080.1 0.10.4
Organic esters, carbonyl compounds 0.520.13.827.9
Fatty acid esters 0.318.82.74.3
Methyl linolelaidate 2095209573 (100), 67 (56), 81 (48), 95 (33), 55 (33)2800.1 0.50.9
9-Octadecenoic acid, 18-TMS, methyl ester2434243573 (100), 225 (55), 75 (42), 130 (27), 369 (19)3840.2 0.70.3
Butyl 9,12-octadecadienoate2470247867 (100), 81 (84), 55 (62), 95 (58), 79 (56)336 8.8
Octadecadienoic acid (CLA), ester2474-55 (100), 67 (76), 81 (71), 69 (60), 95 (56)356 5.7
α,β-Unsaturated carboxylic esters 0.04 22.8
Cinnamic acid, 3,4-di-TMS, methyl ester20202018219 (100), 238 (58),73 (41), 220 (17), 339 (16)3380.04 21.16
Cinnamic acid, methyl ester18561858252 (100), 73 (76), 179 (71), 166 (64), 209 (64) 1.19
Carbonyl compounds 0.21.31.10.8
2,4-Decadienal, (E, E)-1316131581 (100), 41 (16), 67 (13), 83 (11), 55 (10)1520.20.50.9
Benzaldehyde, 3,5-dimethoxy-4-[(TMS)oxy]-17081711224 (100), 239 (43), 223 (29), 254 (27), 73 (25)254 0.2
2′,4′-Dihydroxyacetophenone, di-TMS, ether1703170973 (100), 194 (94),70 (61), 281 (53), 44 (52)296 0.2
2,4-Decadienal, (E, Z)-1292129181 (100), 41 (23), 83 (18), 67 (18), 55 (15)152 0.3
2-Decennial, E-1260126270 (100), 55 (88), 41 (82), 43 (74), 83 (68) 0.2
Organic alcohols, diols, polyols 16.30.819.54.10.2
Organic alcohols 0.30.80.14.10.2
5-Allyl-1-methoxy-2,3-dihydroxybenzene, di-TMS, ether1953195073 (100), 324 (91), 293 (56), 394 (39), 204 (38)3240.1 3.7
3-Heptene, 4-ol, mono-TMS981986171 (100), 172 (17), 73 (10), 173 (8), 78 (7)1860.2
2-Phenylethanol, mono-TMS1229122773 (100), 103 (42), 179 (40), 75 (35), 77 (21)194 0.1
Z,E-2,13-Octadecadien-1-ol2071207699 (100), 67 (68), 55 (66), 79 (59), 81 (58) 0.5
3-Hexanol, mono-TMS99899475 (100), 159 (95), 73 (46), 103 (21), 77 (17) 0.2
Diols 0.1 1.6 0.3
Ethylene glycol, di-TMS998992147 (100), 73 (41), 191 (15), 148 (15), 103 (13) 0.05 0.9
Propylene glycol, di-TMS10141013117 (100), 147 (66), 73 (64), 66 (11), 148 (10) 0.02 0.5
2,3-Butanediol, di-TMS, rac10491049147 (100), 73 (97), 174 (24), 262 (18), 77 (17) 0.3
Polyols 15.8 17.8
Glycerol, tri-TMS12961295147 (100), 73 (95), 205 (83), 117 (40), 103 (32) 2.1 15.7
Inositol, Hexa-OTMS, D-chiro-19991996318 (100), 305 (85), 73 (75), 217 (71), 147 (53)6127.2
D-(+)-Arabitol, Penta-TMS1759176073 (100), 217 (92), 147 (56), 103 (48), 205 (43) 2.0 0.3
Carbohydrates 54.6 5.40.1
Sucrose, octa-OTMS27122712361 (100), 73 (56), 117 (40), 362 (33), 147 (21) 18.0 2.9
Maltose, octa-TMS, methyloxime (isomer 2)2731273373 (100), 361 (88), 217 (75), 289 (64), 147 (36) 5.4
α-D-Fructofuranose, penta-TMS1845184373 (100), 217 (89), 147 (34), 437 (26), 218 (17) 3.8 0.3
β-D-Fructofuranose, penta-TMS18561854217 (100), 73 (71), 437 (31), 147 (30), 218 (21) 3.0
Phosphorous/Organophosphorous compounds 1.6 10.83.8
Phosphoric acid, tri-TMS12921285299 (100), 300 (25), 73 (21), 314 (17), 301 (14)3140.9 8.23.1
Phosphoric acid, di-TMS monomethyl ester1192-241 (100), 242 (17), 133 (13), 73 (12), 211 (11)2560.01 1.30.3
Phosphoric acid, di-TMS, 2,3-di[(TMS)oxy]propyl ester1799179373 (100), 357 (56), 299 (48), 147 (36), 129 (21) 0.8 0.3
Phenols 3.1 0.86.5
E-Ferulic acid, di-TMS2102210473 (100), 338 (89), 323 (48), 322 (42), 309 (39)3380.1 0.24.2
Caffeic acid, tris-TMS21582159396 (100), 219 (94), 73 (65), 397 (36), 381 (24)3962.7
Vanillin, mono-TMS15381545194 (100), 193 (51), 209 (47), 224 (27), 73 (24)224 0.10.5
Vanillic acid, di-TMS17771776297 (100), 267 (71), 73 (68), 312 (56), 223 (54)3120.04 0.10.3
Sterols 1.413.52.33.331.4
β-Sitosterol, mono-TMS 33483342129 (100), 357 (56),73 (58), 396 (54), 81 (47)4860.78.01.91.321.9
Stigmasterol, mono-TMS3290328655 (100), 83 (91), 81 (78), 73 (75), 67 (67)4840.21.10.50.72.6
5α-Stigmast-7-en-3β-ol33593355414 (100), 255 (85), 55 (53), 81 (50), 43 (46)414 1.6
5α-Stigmast-7-en-3β-ol, mono-TMS3401340173 (100), 255 (92), 487 (79), 147 (45), 229 (20)486 4.8
Campesterol, mono-TMS 3253325173 (100), 129 (62), 343 (36), 147 (30), 382 (23)472 2.1
Amino acids 3.0 0.6 0.3
L-Proline, di- TMS13031302142 (100), 73 (28), 143 (14), 147 (7), 216 (5)2590.9 0.2
Pyroglutamic acid, di-TMS15321524156 (100), 73 (60), 147 (28), 157 (13), 217 (13)2730.5 0.3
Threonine, tri-TMS1406140873 (100), 218 (60), 219 (54), 117 (41), 147 (30) 0.3
Glycerolipids 0.93.31.84.5
2-Monolinolenin, di-TMS27762780129 (100), 73 (97), 147 (60), 103 (48), 67 (41)4980.5 1.12.1
2-Monoolein, di-TMS 27422744103 (100), 73 (84), 129 (79), 67 (43), 55 (35) 0.2 0.51.5
Glycerol 1-monolinolate2688269767 (100), 81 (88), 55 (74), 95 (62), 79 (56)354 2.8
Tocopherols 0.22.60.2 2.4
(+)-α-Tocopherol, OTMS-31523156502 (100), 73 (80), 237 (68), 55 (51), 67 (41)5020.2 0.2 2.4
α-Tocopherol 31303130165 (100), 430 (86), 164 (31), 431 (28), 166 (12)430 2.3
α-Tocopheryl acetate 31413132165 (100), 55 (67), 430 (61), 67 (59), 81 (56) 0.3
Nucleosides 1.0 0.2
Cytidine, 2′,3′,5′-tri-TMS ether2822281173 (100), 217 (69), 147 (34), 147 (28), 151 (24)4590.5
5-Methyluridine, tri-TMS derivative2429242873 (100), 217 (81), 75 (34), 55 (30), 67 (25)4740.2 0.2
Uridine, 2′,3′,5′-tri-OTMS2461246973 (100), 217 (62), 103 (23), 259 (21), 147 (21)4600.2
Terpenoids 0.26.2 0.2
Monoterpenes, Monoterpenoids 0.6
p-Menthane, trans-98497897 (100), 55 (67), 41 (20), 96 (20), 57 (19)140 0.2
Carvone1241124282 (100), 54 (38), 108 (36), 93 (36), 107 (25)150 0.2
Camphor1143114395 (100), 81 (86), 67 (64), 152 (59), 55 (54)152 0.1
Triterpenes 0.25.4 2.0
α-Amyrin, mono-TMS33843382218 (100), 73 (35), 189 (25), 190 (20), 219 (19)4980.2 2.0
α-Amyrin33763376218 (100), 207 (22), 95 (22), 135 (22), 203 (22)426 4.2
β-Amyrin33303337218 (100), 203 (48), 207 (26), 55 (24), 81 (23)426 1.2
Sesquiterpenes, Sesquiterpenoids 0.2
α-Longipinene 1363136041 (100), 55 (96), 43 (87), 91 (78), 44 (71)204 0.1
β-E-Caryophyllene 1415141641 (100), 91 (99), 105 (93), 55 (91), 79 (89)204 0.1
Hydrocarbons 4.8
Aliphatic hydrocarbons 3.9
Alicyclic hydrocarbons 0.6
Aromatic hydrocarbons 0.3
Flavonoids 0.4
Other compounds 1.21.10.81.90.4
Non-identified compounds 3.56.02.36.50.6
Table 2. LC-PDA-TOF/MS qualitative analysis of extracts and fractions of S. hispanica seeds.
NoRetention Time [min]UV λ max [nm][M-H]-[m/z]Compound Name
113.46290 sh, 325250, 300, 310unknown
218.23290 sh, 3263535-CQa S
319.16290 sh, 3403393-p-CoumQa
421.61250, 290 sh, 325191, 353, 7053-CQa S
522.45290 sh, 3253534-CQa S
623.06295 sh, 325292unknown
723.27295 sh, 326179CA S
823.91325306unknown
924.89325530unknown
1028.65310367methylated 4-CQa
1131.83295 sh, 325435unknown
1245.38300 sh, 325133, 161, 387, 549p-CoumQA derivatives
1348.73295 sh, 325147, 353, 5153,5-dCQa S
1450.26295 sh, 325353, 515cis-3,5-dCQa
1552.39265, 338269, 445apigenin 7-O-glucuronide S
1653.47295 sh, 325353, 5154,5-dCQa S
1757.16295 sh, 325507unknown
1857.47295 sh, 320529methylated-diCQa
1958.42265 sh, 338268, 459luteolin 7-O-glucuronide
2058.76295 sh, 320339, 529methylated-diCQa
2159.26295 sh, 328437unknown
2259.58265 sh, 338285luteolin S
2360.26295 sh, 325353, 515, 677triCQa
2463.17265, 340151, 269apigenin (A) S
S—comparisons with chemical standards were made, sh—value on the deflection of the UV spectrum, bold—most abundant ion.
Table 3. Assessment of apigenin and caffeoylquinic derivatives content in extracts (SH1-SH3, SH8) and fractions (SH4-SH7) of S. hispanica seeds.
No.Content mg Per g of Extract/Fraction a
SH1SH2SH3SH4SH5SH6SH7SH8
2ndblqndndndblqblqblq
43.80 ± 0.0312.37 ± 0.18blqblqnd54.34 ± 0.136.23 ± 0.0613.39 ± 0.18
5ndndndnd2.90 ± 0.102.25 ± 0.03blqnd
7ndnd1.16 ± 0.0320.97 ± 0.07ndndndnd
10ndndnd4.87 ± 0.07ndndndnd
147.75 ± 0.0413.57 ± 0.19blq36.54 ± 0.2242.00 ± 0.2013.54 ± 0.13nd20.54 ± 0.33
15ndndnd5.55 ± 0.7ndndndnd
163.96 ± 0.178.48 ± 0.09ndndnd48.18 ± 0.41nd10.36 ± 0.12
17blqblqnd16.82 ± 0.4955.6 ± 0.2010.31 ± 0.13ndblq
19ndndnd1.60 ± 0.04ndndndnd
21ndndndblqndndndnd
24blqblqnd13.98 ± 0.376.00 ± 0.10ndnd0.80 ± 0.29
251.98 ± 0.091.10 ± 0.15blq5.90 ± 0.11ndndndblq
Total CQa11.5525.951.16100.33306.580.446.2334.73
a—content expressed as mean with standard deviation; blq—below the limit of quantification; nd—not detected.
Table 4. The influence of SH1, SH4, and SH11 on the DNA biosynthesis in MCF-7 and MDA-MB-231 cell lines.
Sample NameIC50 for MCF-7 [μg/mL]IC50 for MDA-MB-231 [μg/mL]
SH1943.23 ± 55.5863.21 ± 35.81
SH4630.52 ± 64.96648.61 ± 182.62
SH11293.64 ± 16.61265.05 ± 25.44
Results are presented as mean IC50 values ± SD from three independent experiments performed in duplicate.
Table 5. Validation parameters for CQAs and A derivatives analysis by LC-MS.
Parameter5CQaA
Linear Range [µg/mL]0.5–1002.5–100
r2 (n = 6)0.99980.9995
Regression Equation ay = 19.692x + 10.238y = 11.494x + 7.493
LOD [µg/mL]0.640.91
LOQ [µg/mL]1.922.76
Accuracy [%]101.45 ± 4.47101.77 ± 6.59
Intraday precision (%CV) (N = 6)1.280.97
Interday precision (%CV) (N = 9)1.820.87
a—the value for y corresponds to the peak area and x to the concentration, respectively.
Publisher’s Note: MDPI stays neutral with regard to jurisdictional claims in published maps and institutional affiliations.

