
Development, Evaluation, and Implementation of a House-Made Targeted Next-Generation Sequencing Spoligotyping in a French Laboratory

 , and
on behalf of the Lyon TB Study Group
, and
on behalf of the Lyon TB Study Group
Abstract
1. Introduction
2. Results
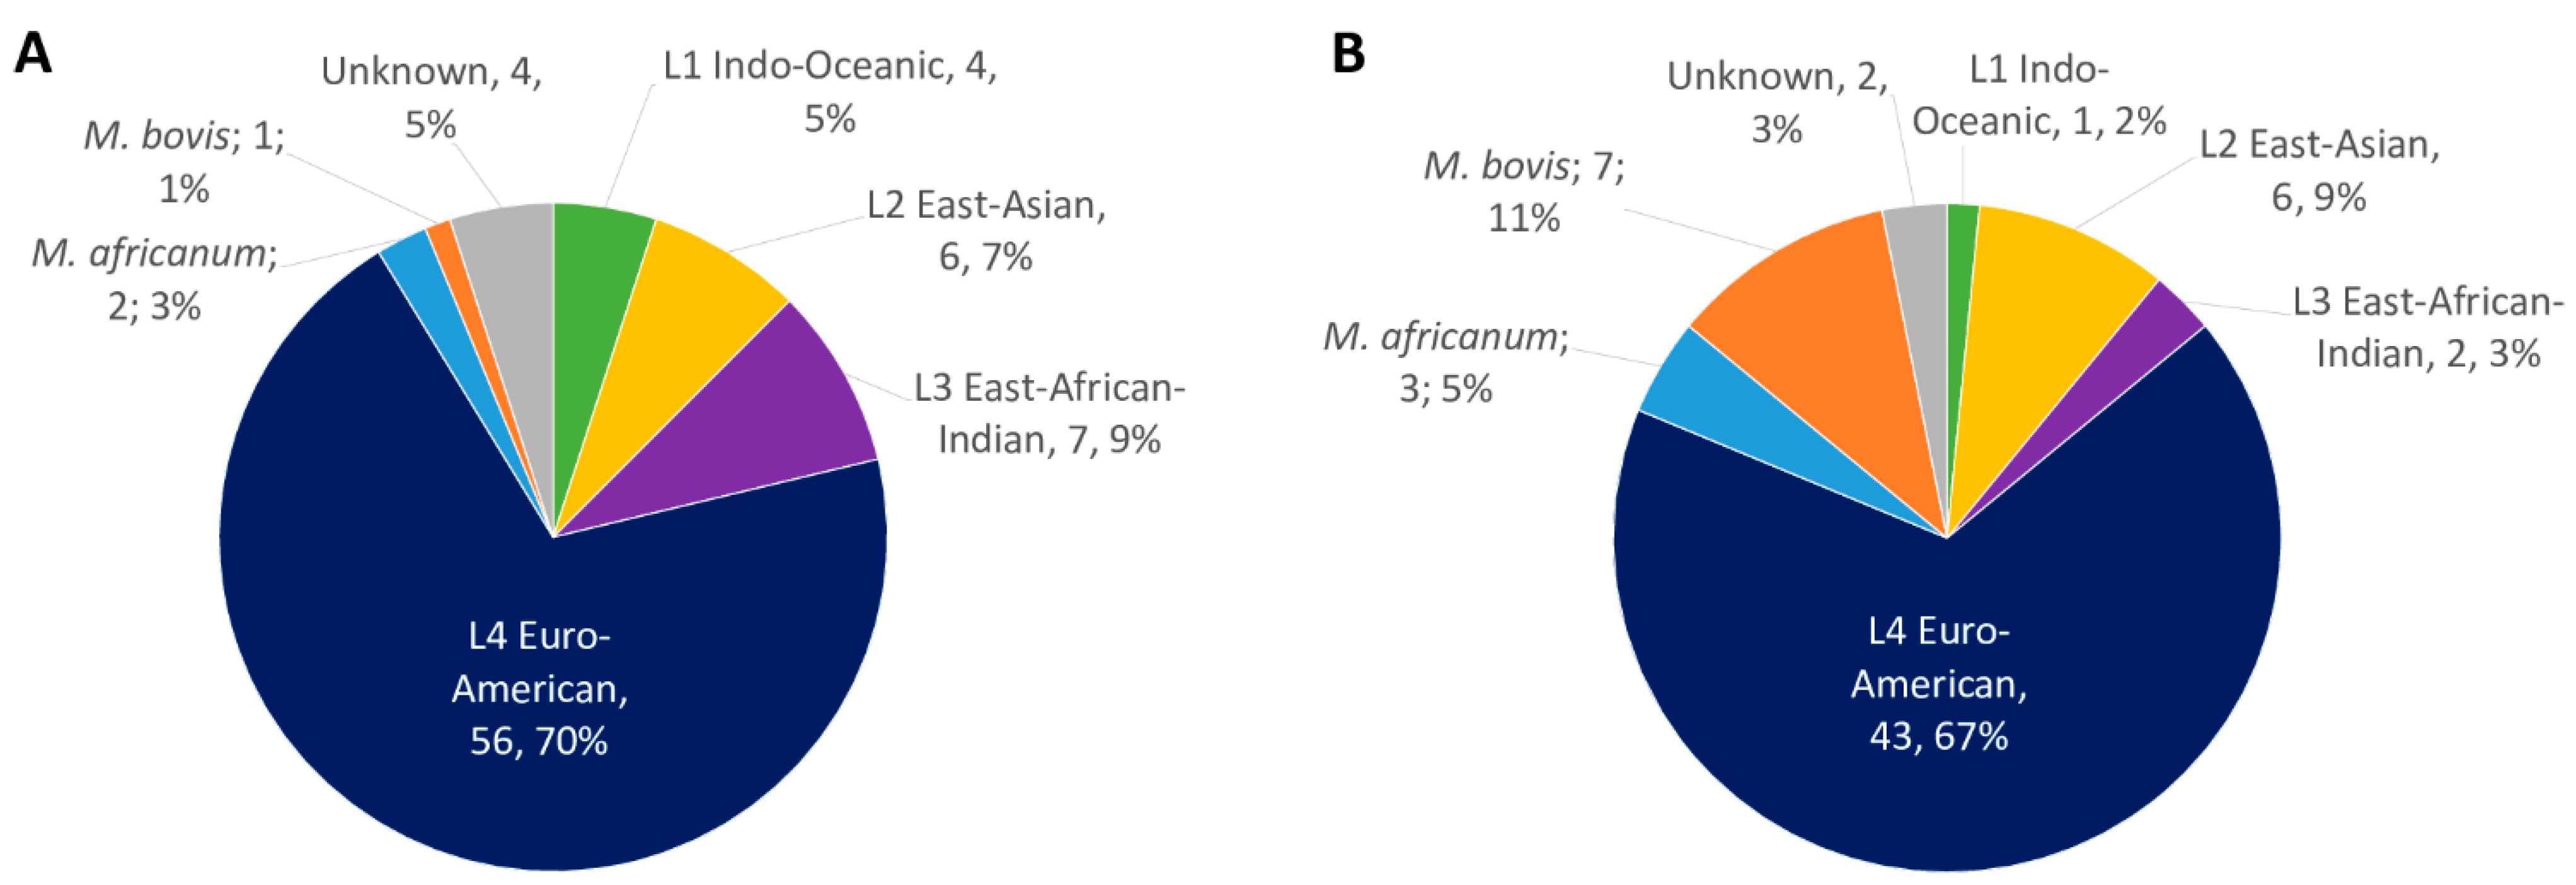
2.1. MTBC Isolates
2.2. Identification of Thresholds Defining the “Presence” or “Absence” of Spacers
- -
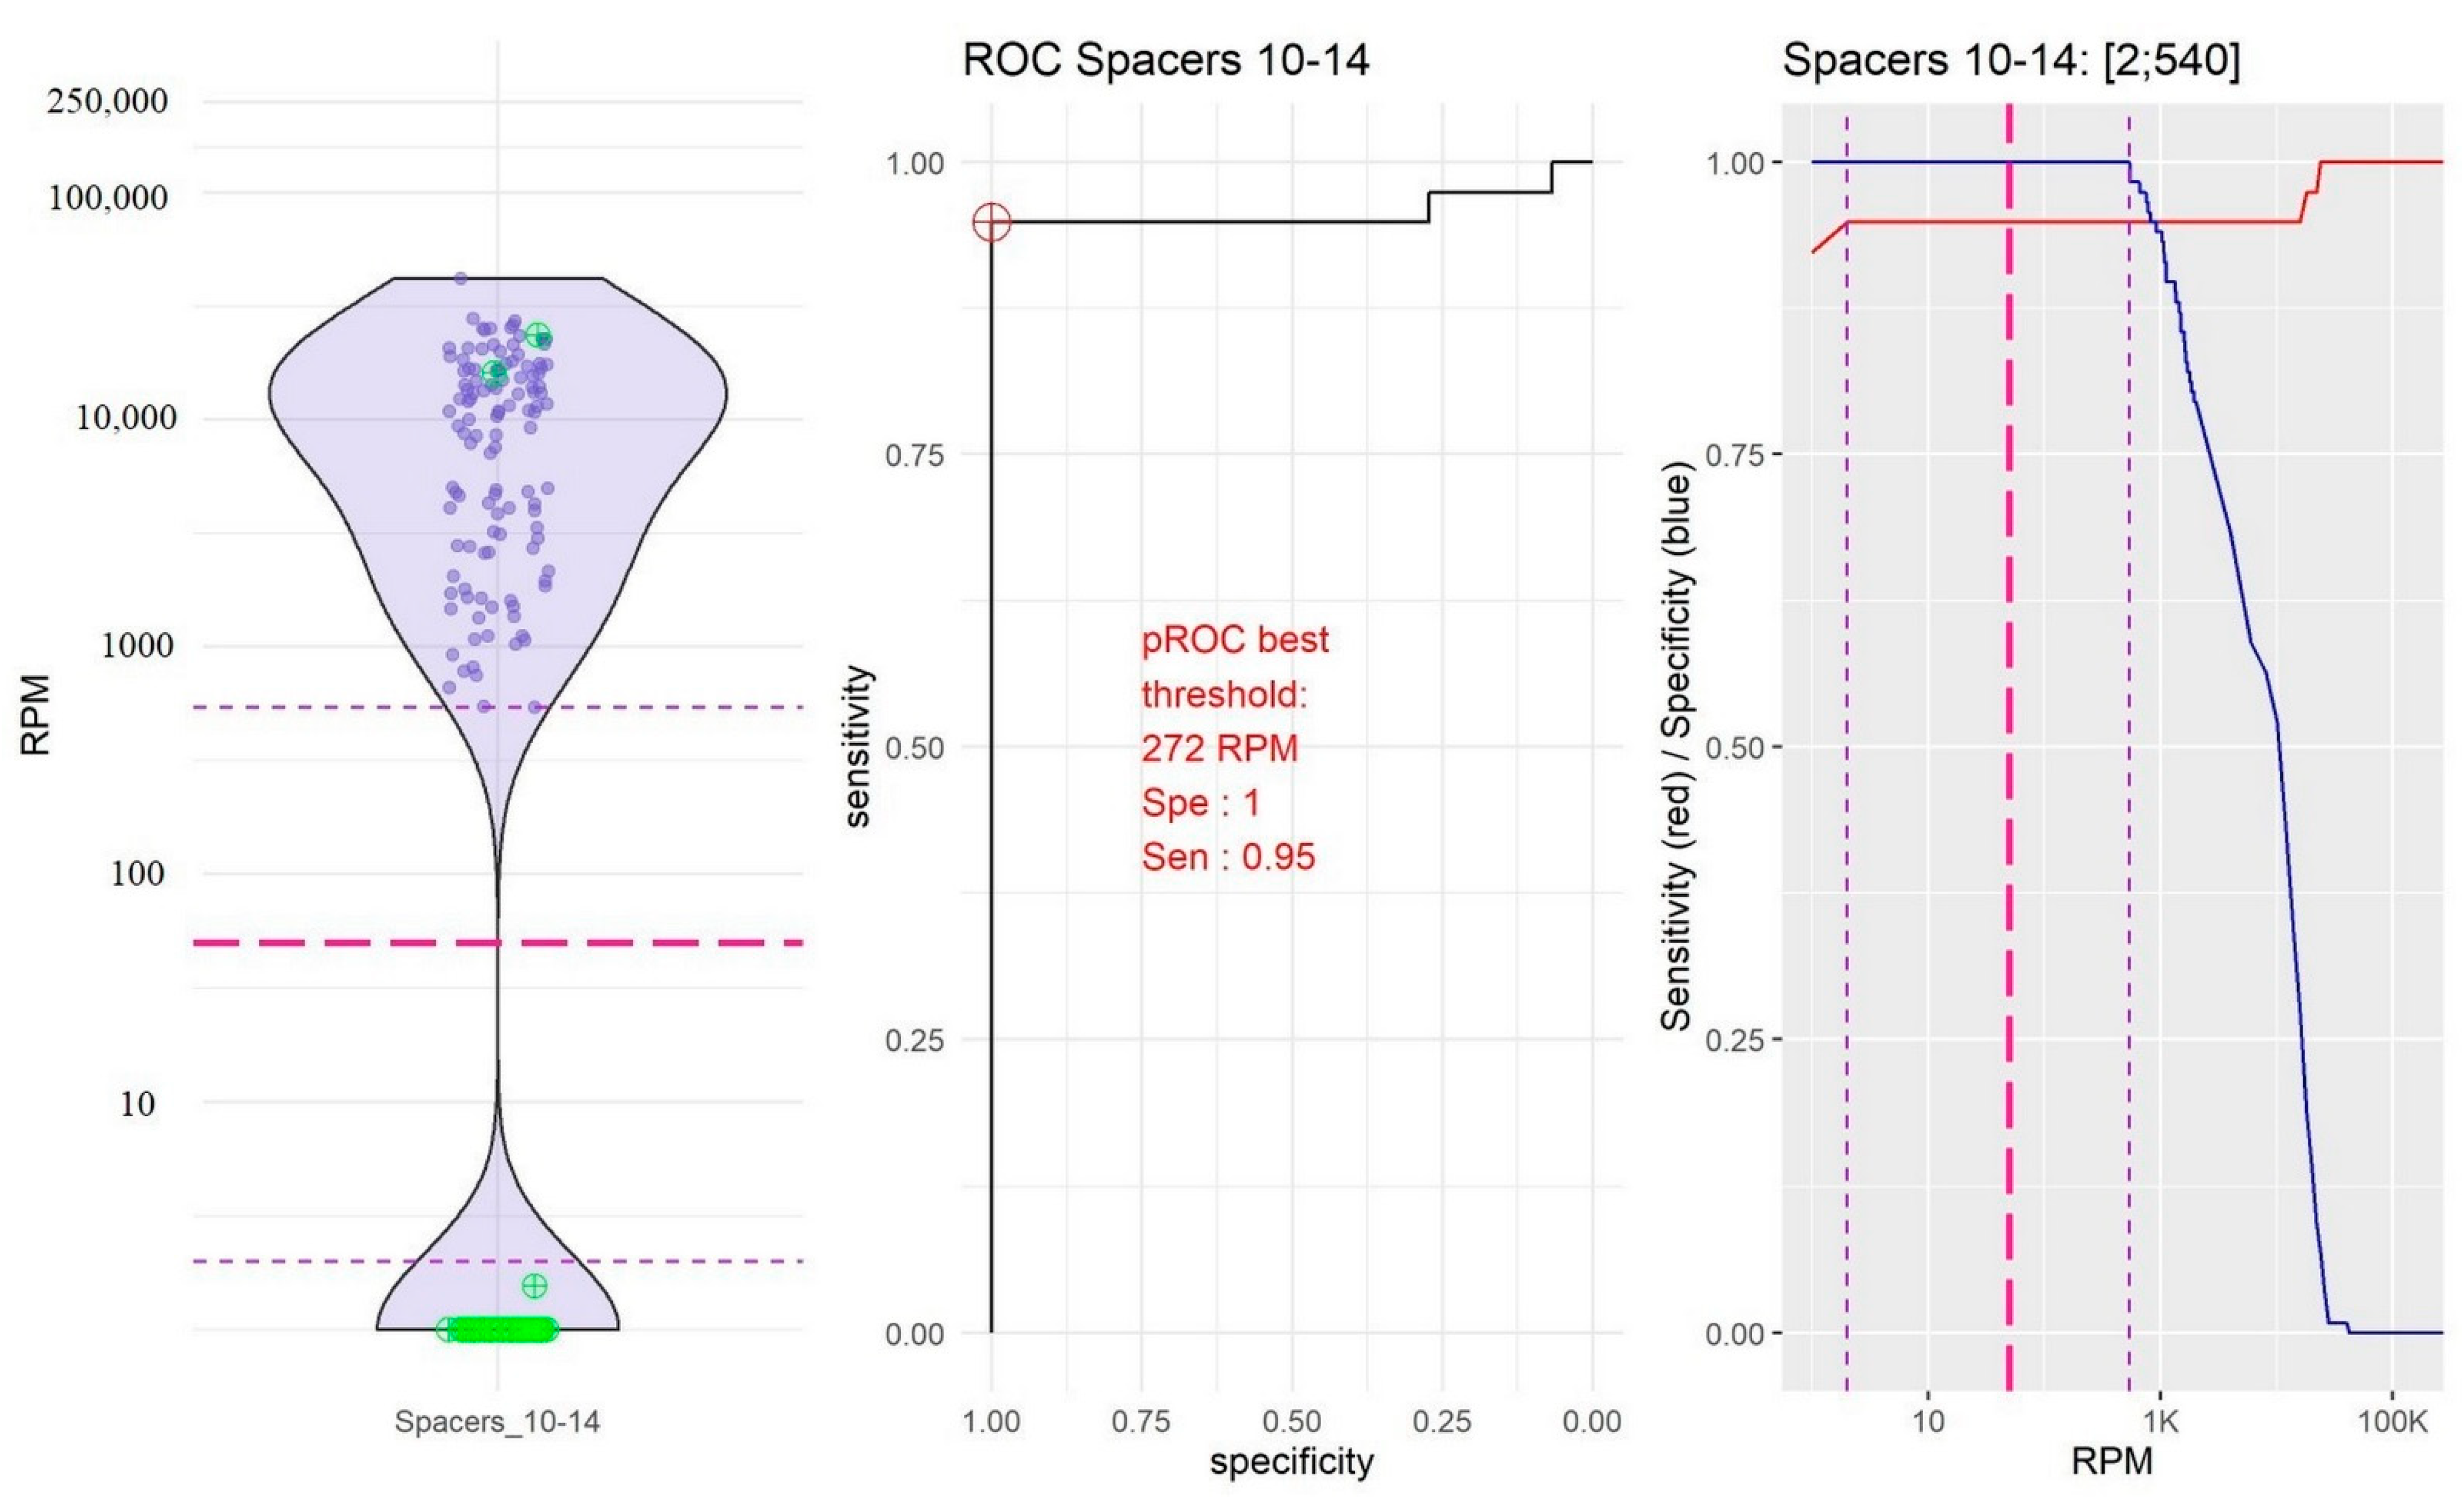
- The group of spacers 10 and 14 in which the RPM mean value of “present” spacers was the lowest (10,754.39, 95% confidence interval, CI [9251.10; 12,257.67]) and the RPM mean value of “absent” spacers was very low (0.04, 95% CI [−0.04; 0.18]; Figure 2).
- -
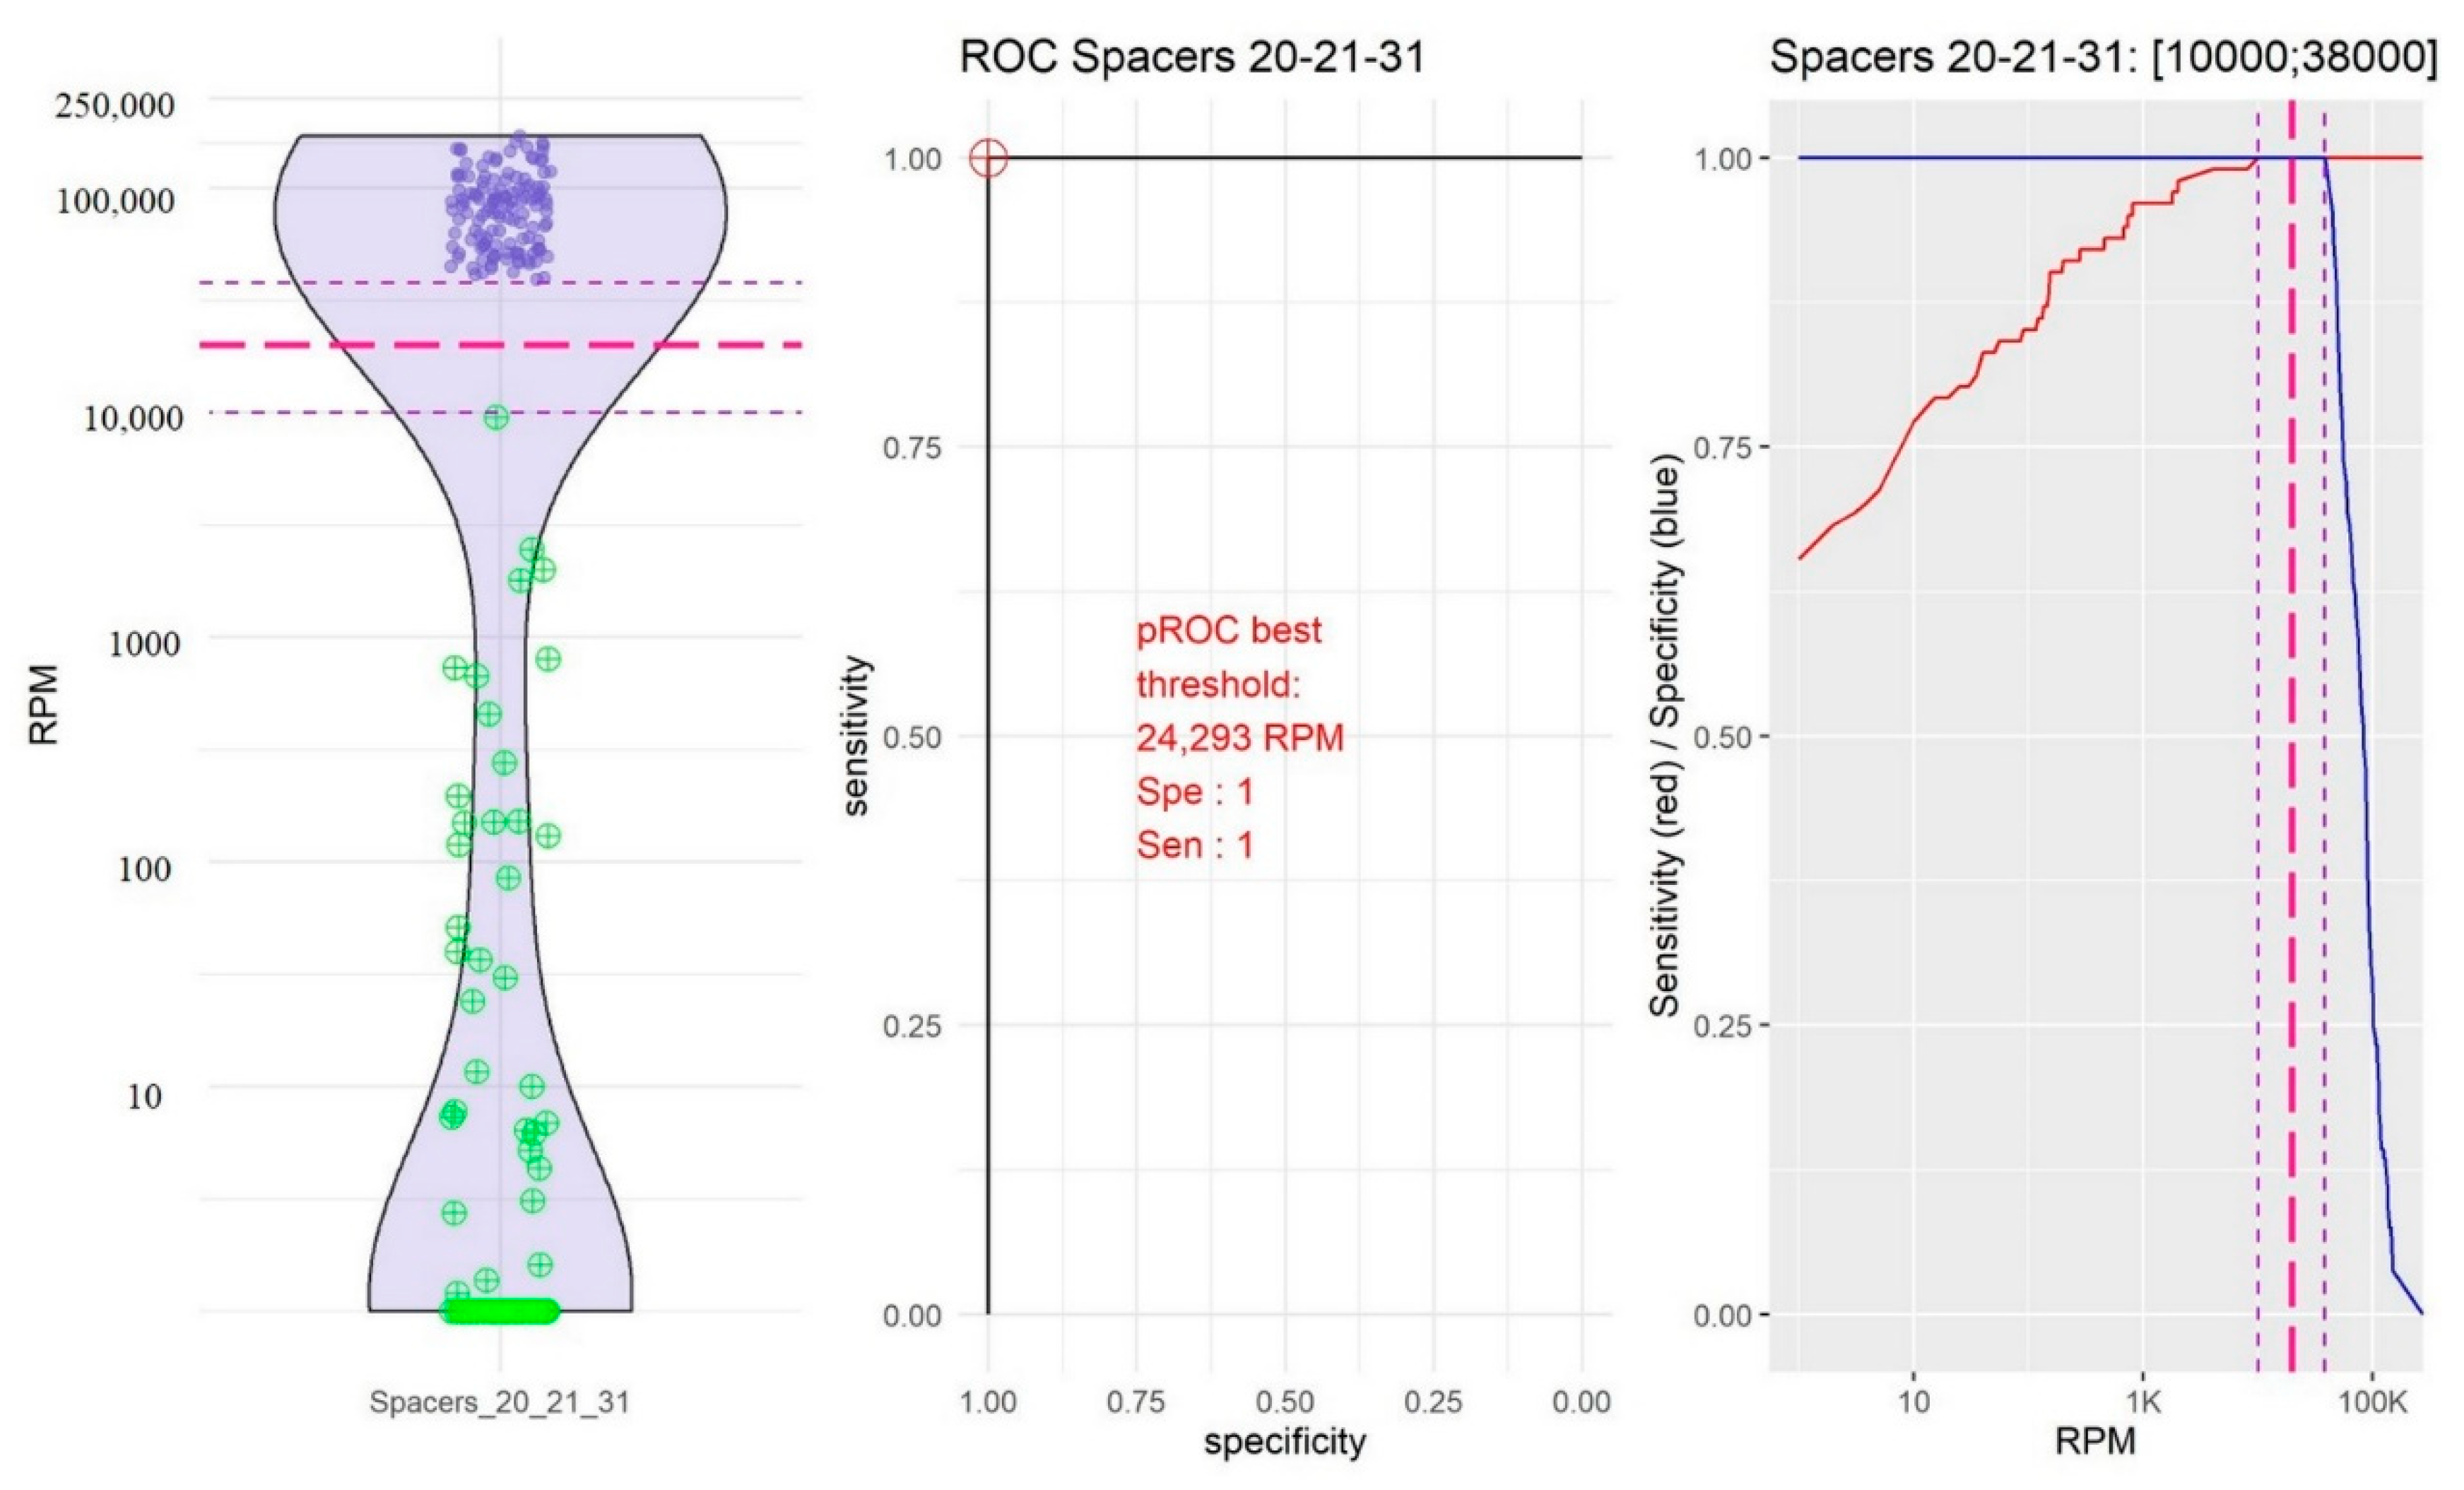
- The group of spacers 20, 21, and 31 in which the RPM mean value of “present” spacers was high (84,941.72, 95% CI [79,478.97; 90,404.48]) and the RPM mean value of “absent” spacers was the highest (192.39, 95% CI [2.437339; 382.353323]; Figure 3).
- -
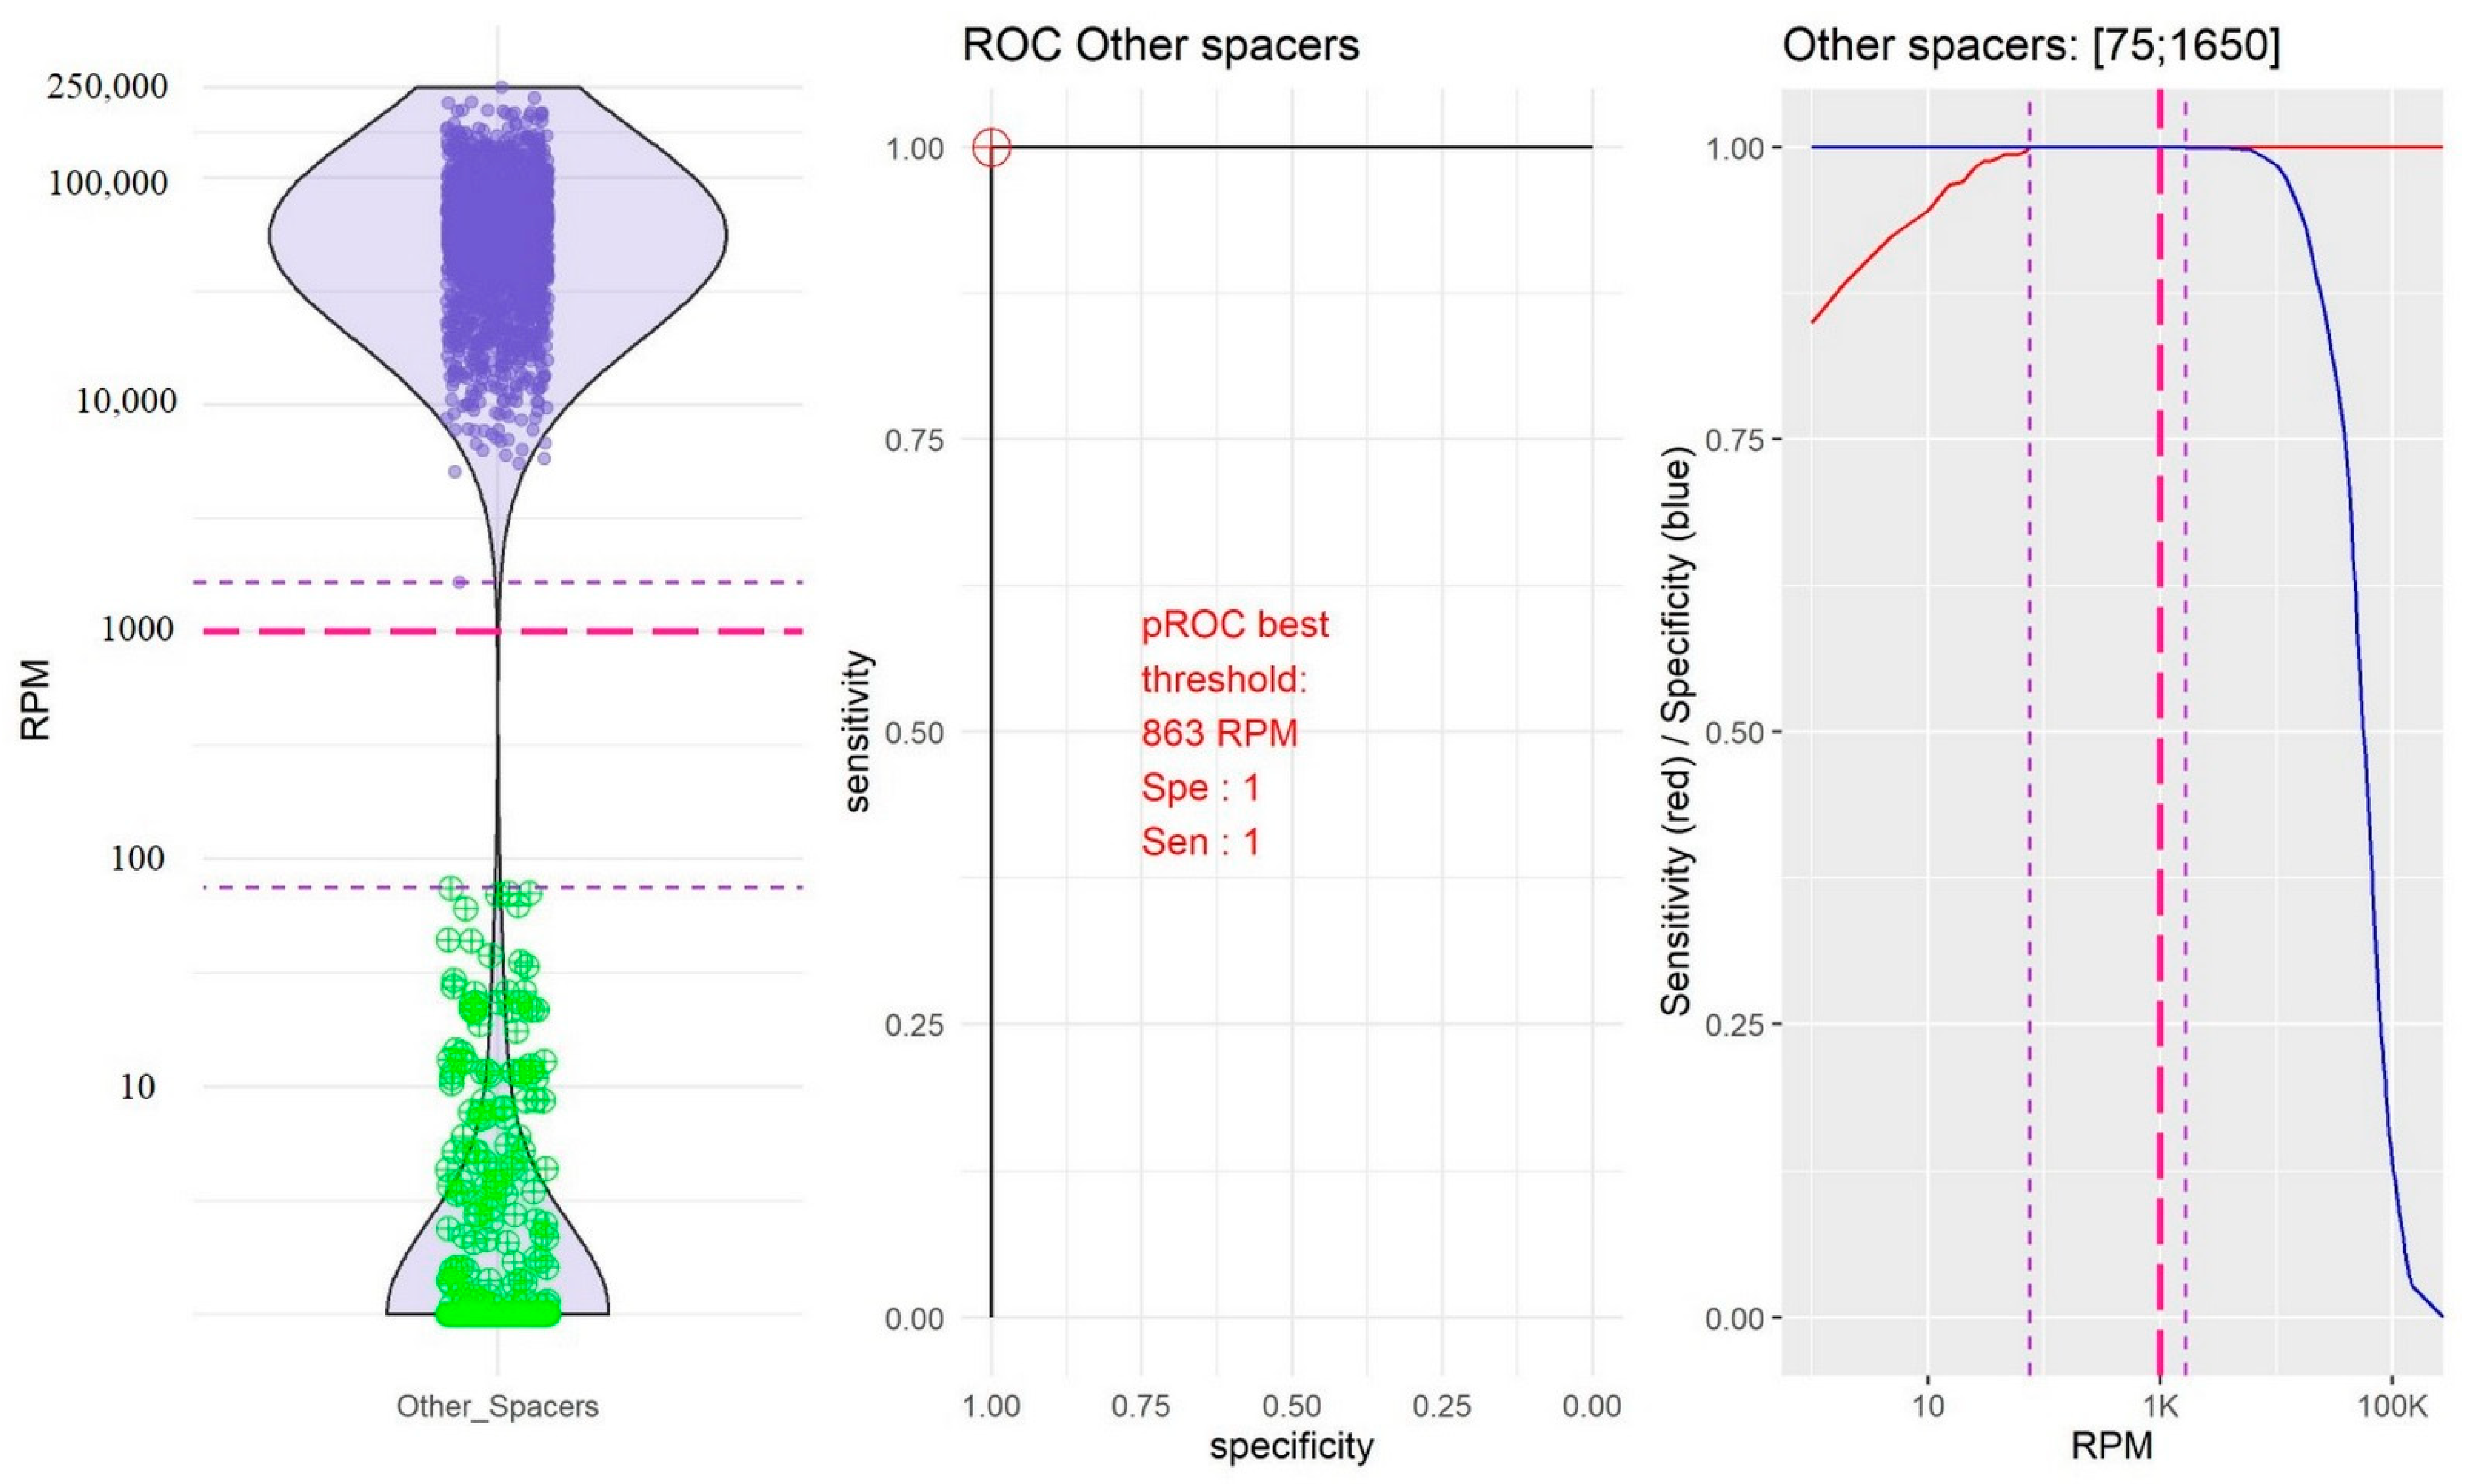
- The group of the other spacers in which the RPM mean value of “present” spacers was high (61,400.65, 95% CI [59,776.49; 63,024.80]) and the RPM mean value of “absent” spacers was low (11.45; 95% CI [4.14; 18.76]; Figure 4).
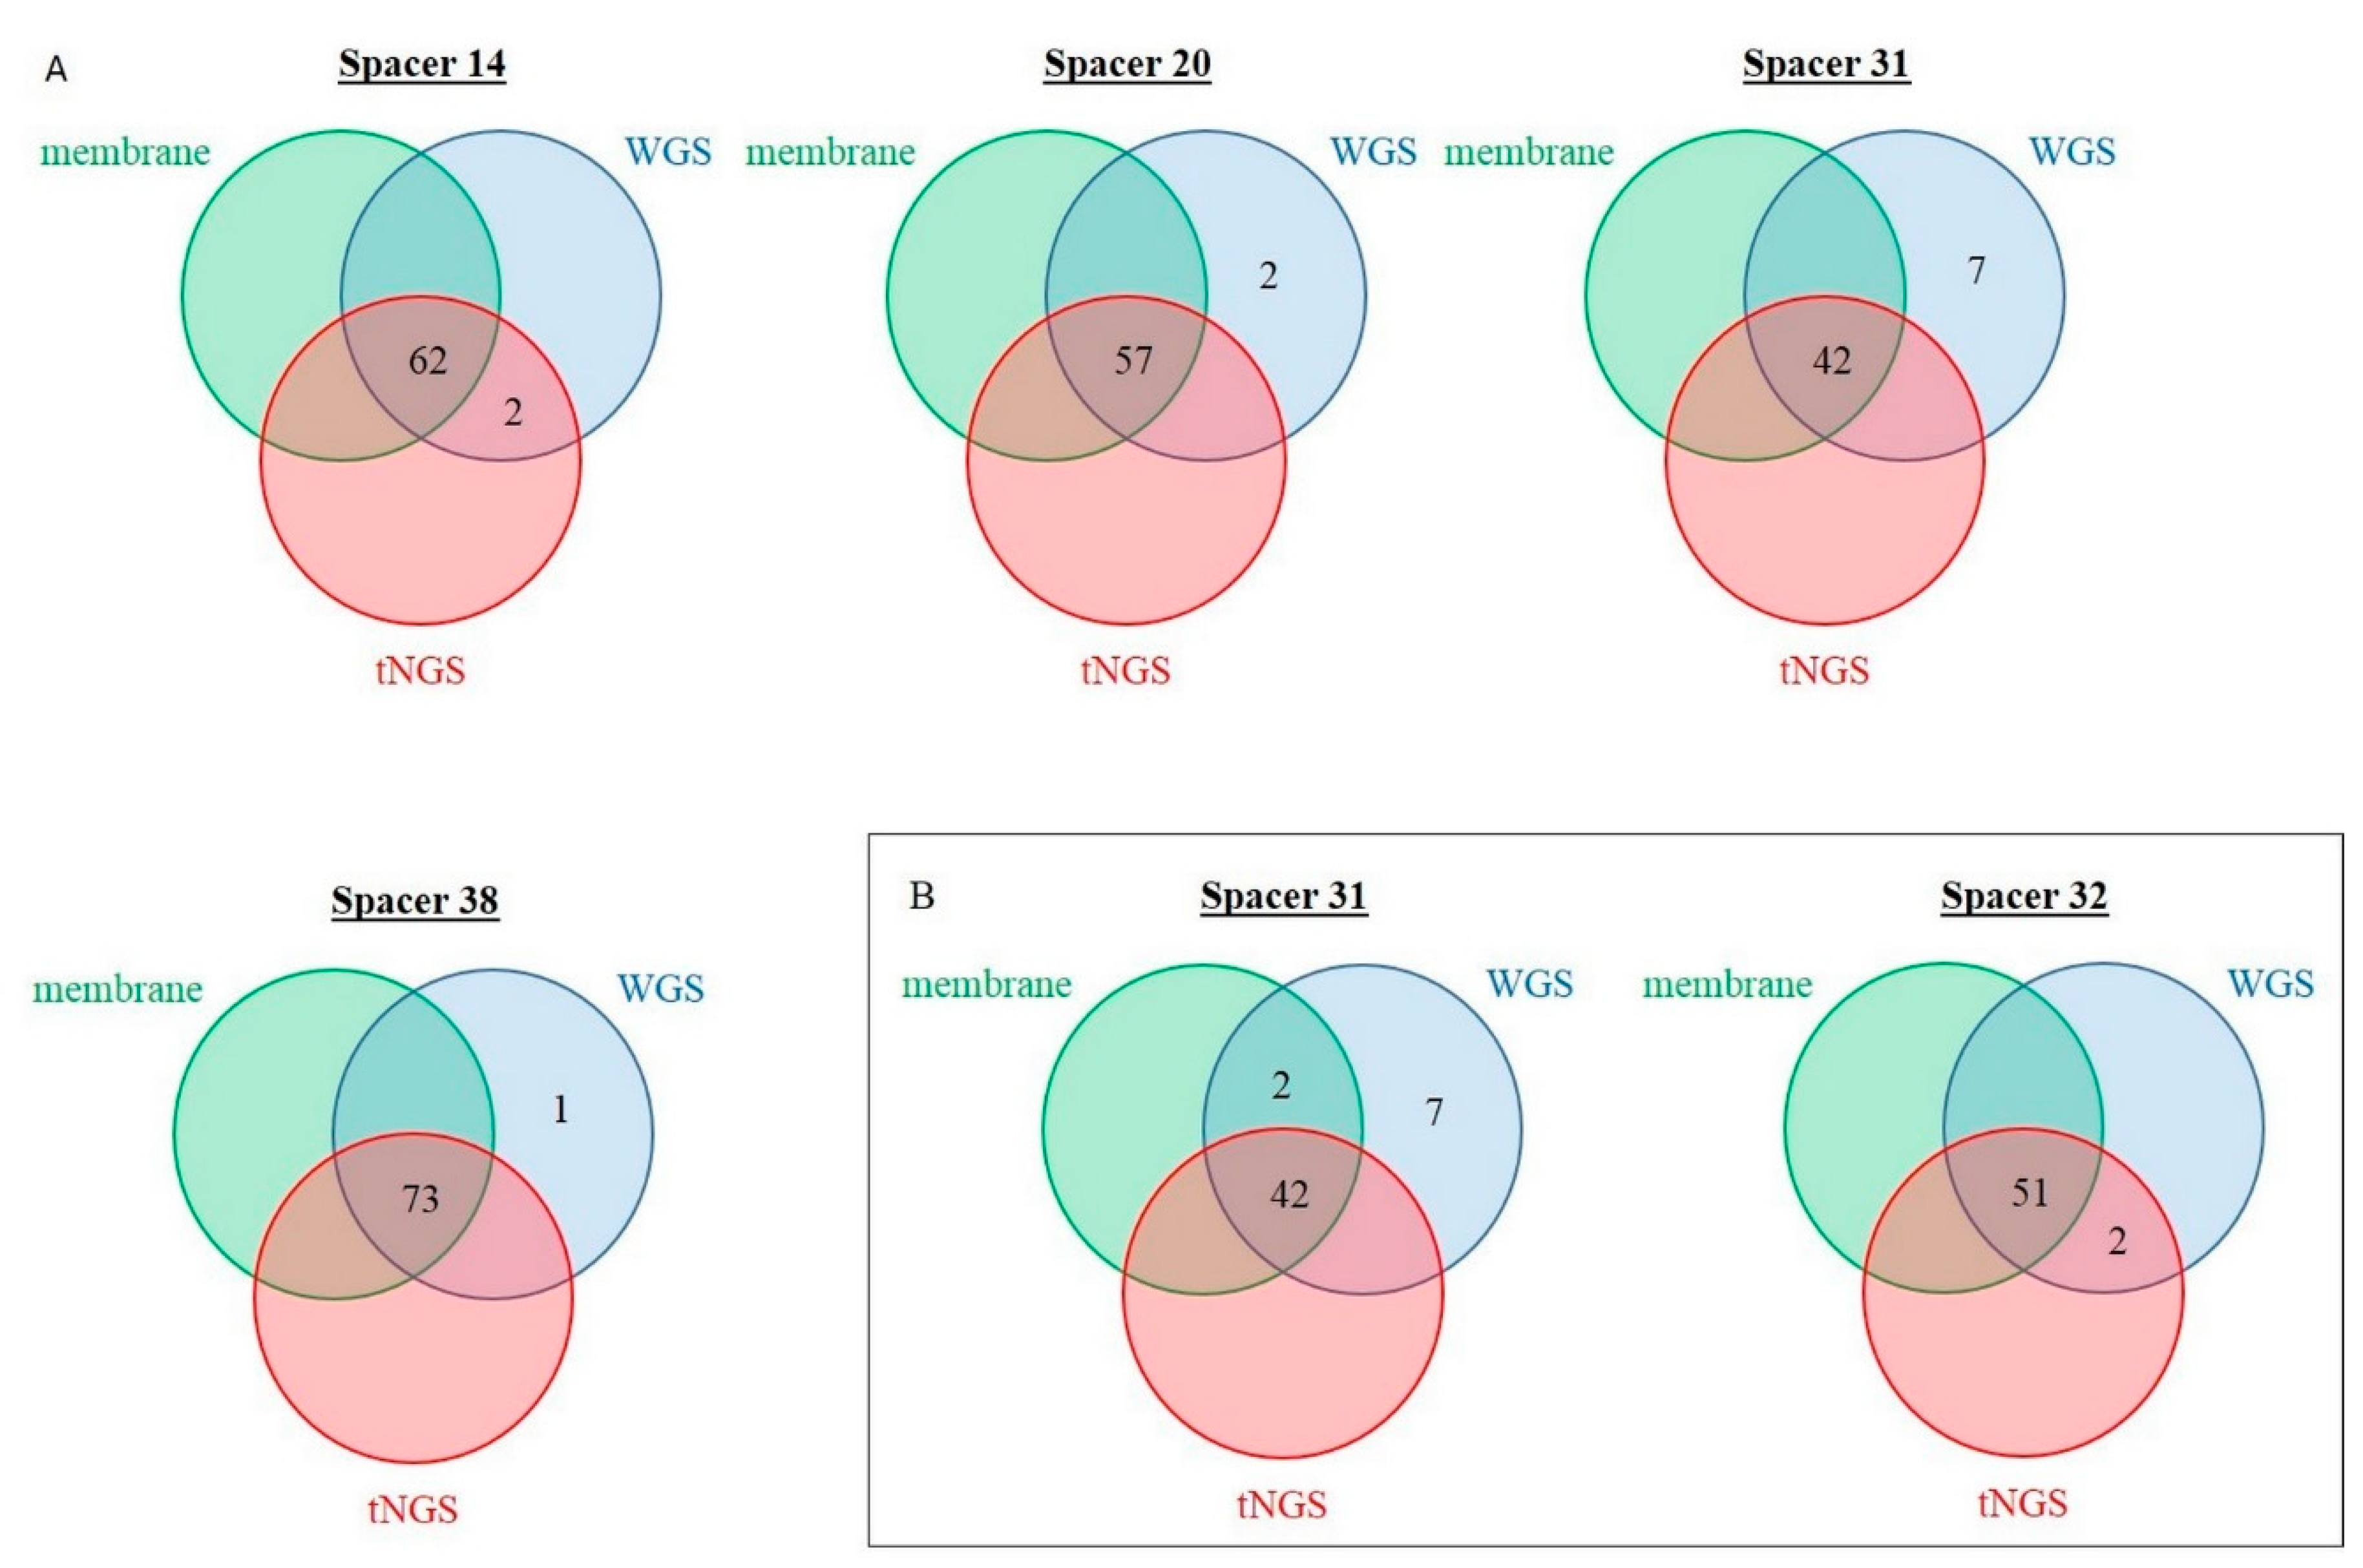
2.3. Validation of the Defined Thresholds and Concordance between Membrane-Based Spoligotyping and tNGS Spoligotyping
2.4. Discrepancy Analysis between Membrane-Based, tNGS, and In Silico Spoligotyping
3. Discussion
4. Materials and Methods
4.1. MTBC Conventional Spoligotyping
4.2. MTBC DR Locus tNGS
4.3. tNGS Spoligotyping
4.4. MTBC In Silico WGS-Based Spoligotyping
4.5. Discrepancy Analysis
4.6. Data Analysis
5. Conclusions
Supplementary Materials
Author Contributions
Funding
Institutional Review Board Statement
Informed Consent Statement
Data Availability Statement
Acknowledgments
Conflicts of Interest
References
- Genestet, C.; Paret, R.; Pichat, C.; Berland, J.-L.; Jacomo, V.; Carret, G.; Fredenucci, I.; Hodille, E.; Rasigade, J.-P.; Boisset, S.; et al. Routine Survey of Mycobacterium tuberculosis Isolates Reveals Nosocomial Transmission. Eur. Respir. J. 2020, 55, 1901888. [Google Scholar] [CrossRef] [PubMed]
- Genestet, C.; Tatai, C.; Berland, J.-L.; Claude, J.-B.; Westeel, E.; Hodille, E.; Fredenucci, I.; Rasigade, J.-P.; Ponsoda, M.; Jacomo, V.; et al. Prospective Whole-Genome Sequencing in Tuberculosis Outbreak Investigation, France, 2017–2018. Emerg. Infect. Dis. 2019, 25, 589–592. [Google Scholar] [CrossRef] [PubMed]
- Pichat, C.; Couvin, D.; Carret, G.; Frédénucci, I.; Jacomo, V.; Carricajo, A.; Boisset, S.; Dumitrescu, O.; Flandrois, J.-P.; Lina, G.; et al. Combined Genotypic, Phylogenetic, and Epidemiologic Analyses of Mycobacterium tuberculosis Genetic Diversity in the Rhône Alpes Region, France. PLoS ONE 2016, 11, e0153580. [Google Scholar] [CrossRef] [PubMed]
- Rasoahanitralisoa, R.; Rakotosamimanana, N.; Stucki, D.; Sola, C.; Gagneux, S.; Rasolofo Razanamparany, V. Evaluation of Spoligotyping, SNPs and Customised MIRU-VNTR Combination for Genotyping Mycobacterium tuberculosis Clinical Isolates in Madagascar. PLoS ONE 2017, 12, e0186088. [Google Scholar] [CrossRef]
- Kamerbeek, J.; Schouls, L.; Kolk, A.; van Agterveld, M.; van Soolingen, D.; Kuijper, S.; Bunschoten, A.; Molhuizen, H.; Shaw, R.; Goyal, M.; et al. Simultaneous Detection and Strain Differentiation of Mycobacterium tuberculosis for Diagnosis and Epidemiology. J. Clin. Microbiol. 1997, 35, 907–914. [Google Scholar] [CrossRef]
- Refrégier, G.; Sola, C.; Guyeux, C. Unexpected Diversity of CRISPR Unveils Some Evolutionary Patterns of Repeated Sequences in Mycobacterium tuberculosis. BMC Genom. 2020, 21, 841. [Google Scholar] [CrossRef]
- Wyllie, D.H.; Davidson, J.A.; Grace Smith, E.; Rathod, P.; Crook, D.W.; Peto, T.E.A.; Robinson, E.; Walker, T.; Campbell, C. A Quantitative Evaluation of MIRU-VNTR Typing Against Whole-Genome Sequencing for Identifying Mycobacterium tuberculosis Transmission: A Prospective Observational Cohort Study. EBioMedicine 2018, 34, 122–130. [Google Scholar] [CrossRef]
- Genestet, C.; Hodille, E.; Berland, J.-L.; Ginevra, C.; Bryant, J.E.; Ader, F.; Lina, G.; Dumitrescu, O.; Lyon TB Study Group. Whole Genome Sequencing in Drug Susceptibility Testing of Mycobacterium tuberculosis in Routine Practice in Lyon, France. Int. J. Antimicrob. Agents 2020, 55, 105912. [Google Scholar] [CrossRef]
- Xia, E.; Teo, Y.-Y.; Ong, R.T.-H. SpoTyping: Fast and Accurate in Silico Mycobacterium Spoligotyping from Sequence Reads. Genome Med. 2016, 8, 19. [Google Scholar] [CrossRef]
- Genestet, C.; Hodille, E.; Bernard, A.; Vallée, M.; Lina, G.; Le Meur, A.; Refrégier, G.; Dumitrescua, O.; Lyon TB Study Group. Consistency of Mycobacterium tuberculosis Complex Spoligotyping between the Membrane-Based Method and In Silico Approach. Microbiol. Spectr. 2022, 10, e0022322. [Google Scholar] [CrossRef]
- Jouet, A.; Gaudin, C.; Badalato, N.; Allix-Béguec, C.; Duthoy, S.; Ferré, A.; Diels, M.; Laurent, Y.; Contreras, S.; Feuerriegel, S.; et al. Deep Amplicon Sequencing for Culture-Free Prediction of Susceptibility or Resistance to 13 Anti-Tuberculous Drugs. Eur. Respir. J. 2021, 57, 2002338. [Google Scholar] [CrossRef] [PubMed]
- Bonnet, I.; Enouf, V.; Morel, F.; Ok, V.; Jaffré, J.; Jarlier, V.; Aubry, A.; Robert, J.; Sougakoff, W. A Comprehensive Evaluation of GeneLEAD VIII DNA Platform Combined to Deeplex Myc-TB® Assay to Detect in 8 Days Drug Resistance to 13 Antituberculous Drugs and Transmission of Mycobacterium tuberculosis Complex Directly From Clinical Samples. Front. Cell. Infect. Microbiol. 2021, 11, 707244. [Google Scholar] [CrossRef] [PubMed]
- Barbier, M.; Dumitrescu, O.; Pichat, C.; Carret, G.; Ronnaux-Baron, A.-S.; Blasquez, G.; Godin-Benhaim, C.; Boisset, S.; Carricajo, A.; Jacomo, V.; et al. Changing Patterns of Human Migrations Shaped the Global Population Structure of Mycobacterium tuberculosis in France. Sci. Rep. 2018, 8, 5855. [Google Scholar] [CrossRef] [PubMed]
- Guyeux, C.; Sola, C.; Noûs, C.; Refrégier, G. CRISPRbuilder-TB: “CRISPR-Builder for Tuberculosis”. Exhaustive Reconstruction of the CRISPR Locus in Mycobacterium tuberculosis Complex Using SRA. PLoS Comput. Biol. 2021, 17, e1008500. [Google Scholar] [CrossRef] [PubMed]
- Fang, Z.; Morrison, N.; Watt, B.; Doig, C.; Forbes, K.J. IS6110 Transposition and Evolutionary Scenario of the Direct Repeat Locus in a Group of Closely Related Mycobacterium tuberculosis Strains. J. Bacteriol. 1998, 180, 2102–2109. [Google Scholar] [CrossRef] [PubMed]
- Filliol, I.; Sola, C.; Rastogi, N. Detection of a Previously Unamplified Spacer within the DR Locus of Mycobacterium tuberculosis: Epidemiological Implications. J. Clin. Microbiol. 2000, 38, 1231–1234. [Google Scholar] [CrossRef]
- Legrand, E.; Filliol, I.; Sola, C.; Rastogi, N. Use of Spoligotyping to Study the Evolution of the Direct Repeat Locus by IS6110 Transposition in Mycobacterium tuberculosis. J. Clin. Microbiol. 2001, 39, 1595–1599. [Google Scholar] [CrossRef]
- Zeng, X.; Li, H.; Zheng, R.; Kurepina, N.; Kreiswirth, B.N.; Zhao, X.; Xu, Y.; Li, Q. Spoligotyping of Mycobacterium tuberculosis Complex Isolates by Use of Ligation-Based Amplification and Melting Curve Analysis. J. Clin. Microbiol. 2016, 54, 2384–2387. [Google Scholar] [CrossRef]
- Marín, A.V.; Rastogi, N.; Couvin, D.; Mape, V.; Murcia, M.I. First Approach to the Population Structure of Mycobacterium tuberculosis Complex in the Indigenous Population in Puerto Nariño-Amazonas, Colombia. PLoS ONE 2021, 16, e0245084. [Google Scholar] [CrossRef]
- Streit, E.; Millet, J.; Rastogi, N. Mycobacterium tuberculosis Polyclonal Infections and Microevolution Identified by MIRU-VNTRs in an Epidemiological Study. Int. J. Mycobacteriol. 2015, 4, 222–227. [Google Scholar] [CrossRef]
- Couvin, D.; Segretier, W.; Stattner, E.; Rastogi, N. Novel Methods Included in SpolLineages Tool for Fast and Precise Prediction of Mycobacterium tuberculosis Complex Spoligotype Families. Database 2020, 2020, baaa108. [Google Scholar] [CrossRef] [PubMed]
- Demay, C.; Liens, B.; Burguière, T.; Hill, V.; Couvin, D.; Millet, J.; Mokrousov, I.; Sola, C.; Zozio, T.; Rastogi, N. SITVITWEB—A Publicly Available International Multimarker Database for Studying Mycobacterium tuberculosis Genetic Diversity and Molecular Epidemiology. Infect. Genet. Evol. 2012, 12, 755–766. [Google Scholar] [CrossRef] [PubMed]
- Chen, S.; Huang, T.; Wen, T.; Li, H.; Xu, M.; Gu, J. MutScan: Fast Detection and Visualization of Target Mutations by Scanning FASTQ Data. BMC Bioinform. 2018, 19, 16. [Google Scholar] [CrossRef] [PubMed]
- Tange, O. GNU Parallel 2018; Tange, O., Ed.; Lulu. Com: Morrisville, NC, USA, 2018; ISBN 978-1-387-50988-1. [Google Scholar]
- Landis, J.R.; Koch, G.G. The Measurement of Observer Agreement for Categorical Data. Biometrics 1977, 33, 159–174. [Google Scholar] [CrossRef] [PubMed]


| Discordant Spacer (Number) | Prevalence in Membrane-Based Spoligotyping, n | Number of Concerned Isolates | Overall Agreement, % | Cohen’s Kappa | |
|---|---|---|---|---|---|
| Training set | |||||
| “0” in membrane, “1” in tNGS | 14 | 62 | 2 | 97.5 | 0.911 |
| Validation set | |||||
| “0” in membrane, “1” in tNGS | 32 | 51 | 2 | 96.9 | 0.898 |
| “1” in membrane, “0” in tNGS | 31 | 44 | 2 | 96.9 | 0.929 |
Publisher’s Note: MDPI stays neutral with regard to jurisdictional claims in published maps and institutional affiliations. |
© 2022 by the authors. Licensee MDPI, Basel, Switzerland. This article is an open access article distributed under the terms and conditions of the Creative Commons Attribution (CC BY) license (https://creativecommons.org/licenses/by/4.0/).
Share and Cite
Genestet, C.; Baffert, Y.; Vallée, M.; Bernard, A.; Benito, Y.; Lina, G.; Hodille, E.; Dumitrescu, O., on behalf of the Lyon TB Study Group. Development, Evaluation, and Implementation of a House-Made Targeted Next-Generation Sequencing Spoligotyping in a French Laboratory. Int. J. Mol. Sci. 2022, 23, 11302. https://doi.org/10.3390/ijms231911302
Genestet C, Baffert Y, Vallée M, Bernard A, Benito Y, Lina G, Hodille E, Dumitrescu O on behalf of the Lyon TB Study Group. Development, Evaluation, and Implementation of a House-Made Targeted Next-Generation Sequencing Spoligotyping in a French Laboratory. International Journal of Molecular Sciences. 2022; 23(19):11302. https://doi.org/10.3390/ijms231911302
Chicago/Turabian StyleGenestet, Charlotte, Yannick Baffert, Maxime Vallée, Albin Bernard, Yvonne Benito, Gérard Lina, Elisabeth Hodille, and Oana Dumitrescu on behalf of the Lyon TB Study Group. 2022. "Development, Evaluation, and Implementation of a House-Made Targeted Next-Generation Sequencing Spoligotyping in a French Laboratory" International Journal of Molecular Sciences 23, no. 19: 11302. https://doi.org/10.3390/ijms231911302
APA StyleGenestet, C., Baffert, Y., Vallée, M., Bernard, A., Benito, Y., Lina, G., Hodille, E., & Dumitrescu, O., on behalf of the Lyon TB Study Group. (2022). Development, Evaluation, and Implementation of a House-Made Targeted Next-Generation Sequencing Spoligotyping in a French Laboratory. International Journal of Molecular Sciences, 23(19), 11302. https://doi.org/10.3390/ijms231911302