
The Glutathione S-Transferase PtGSTF1 Improves Biomass Production and Salt Tolerance through Regulating Xylem Cell Proliferation, Ion Homeostasis and Reactive Oxygen Species Scavenging in Poplar

 , and
, and 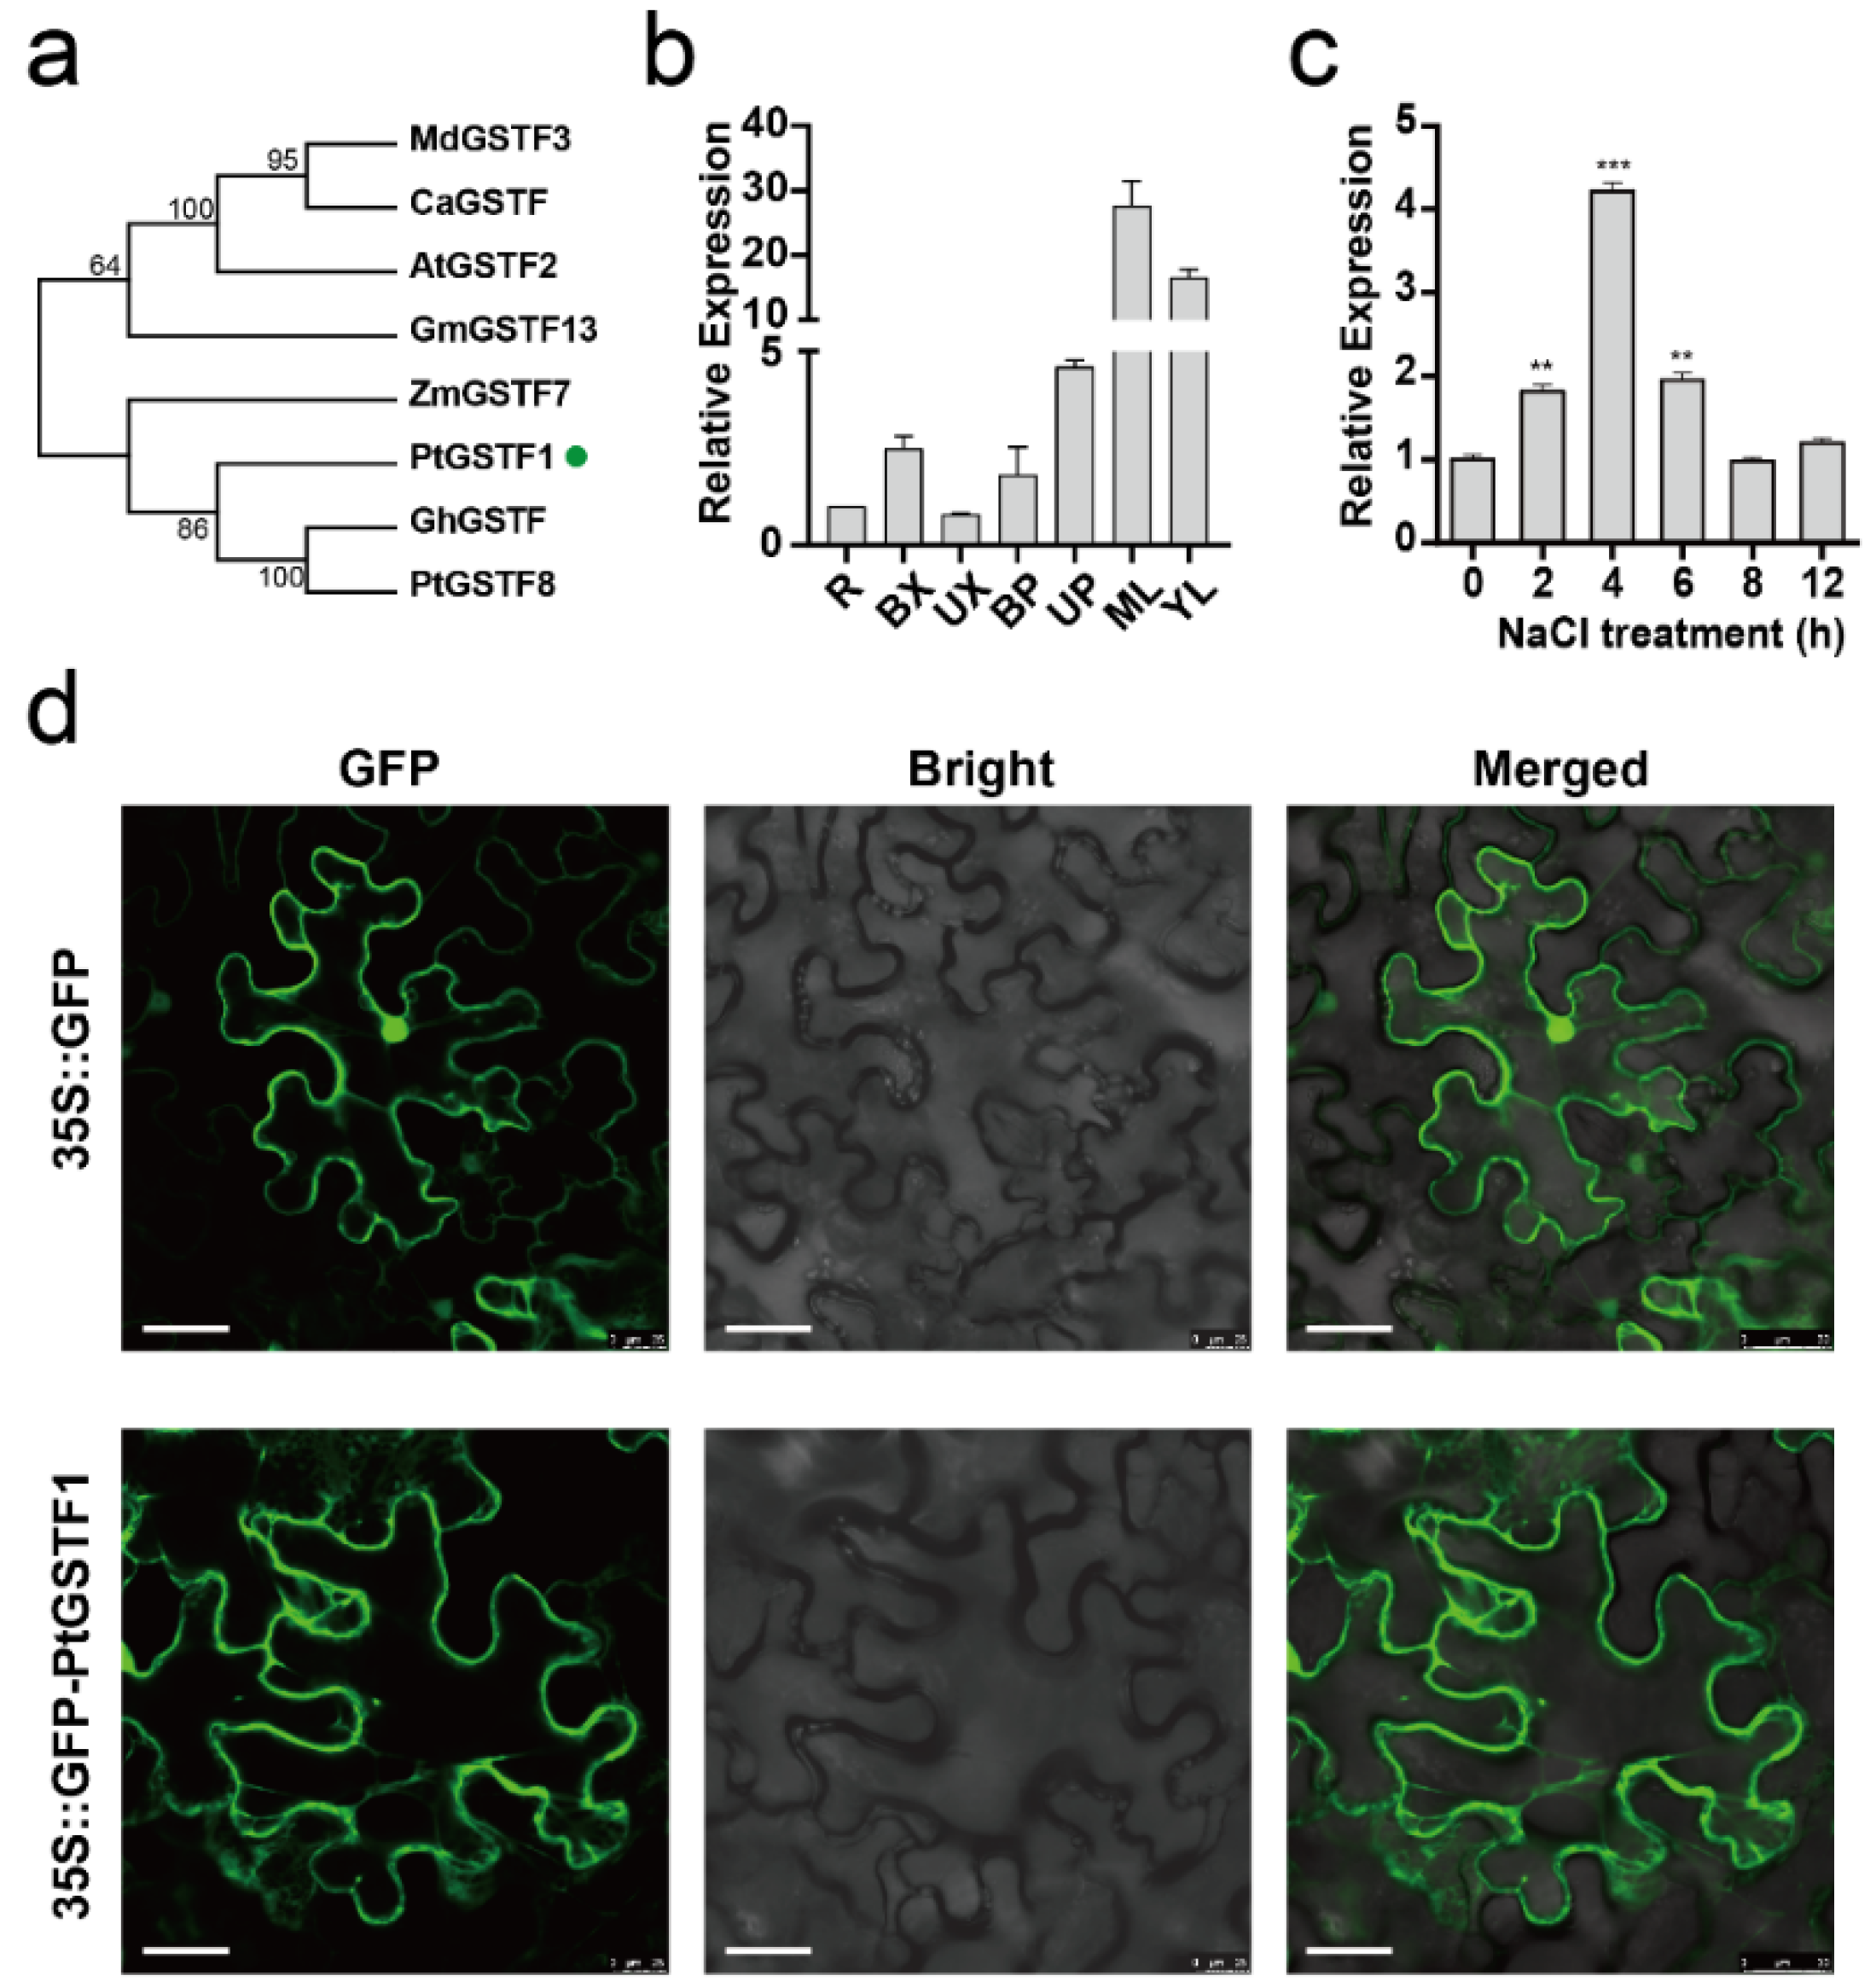
Abstract
1. Introduction
2. Results
2.1. PtGSTF1 Encodes a Cytoplasmic Phi Class Glutathione S-Transferase with Salt Stress Induced Expression in Poplar
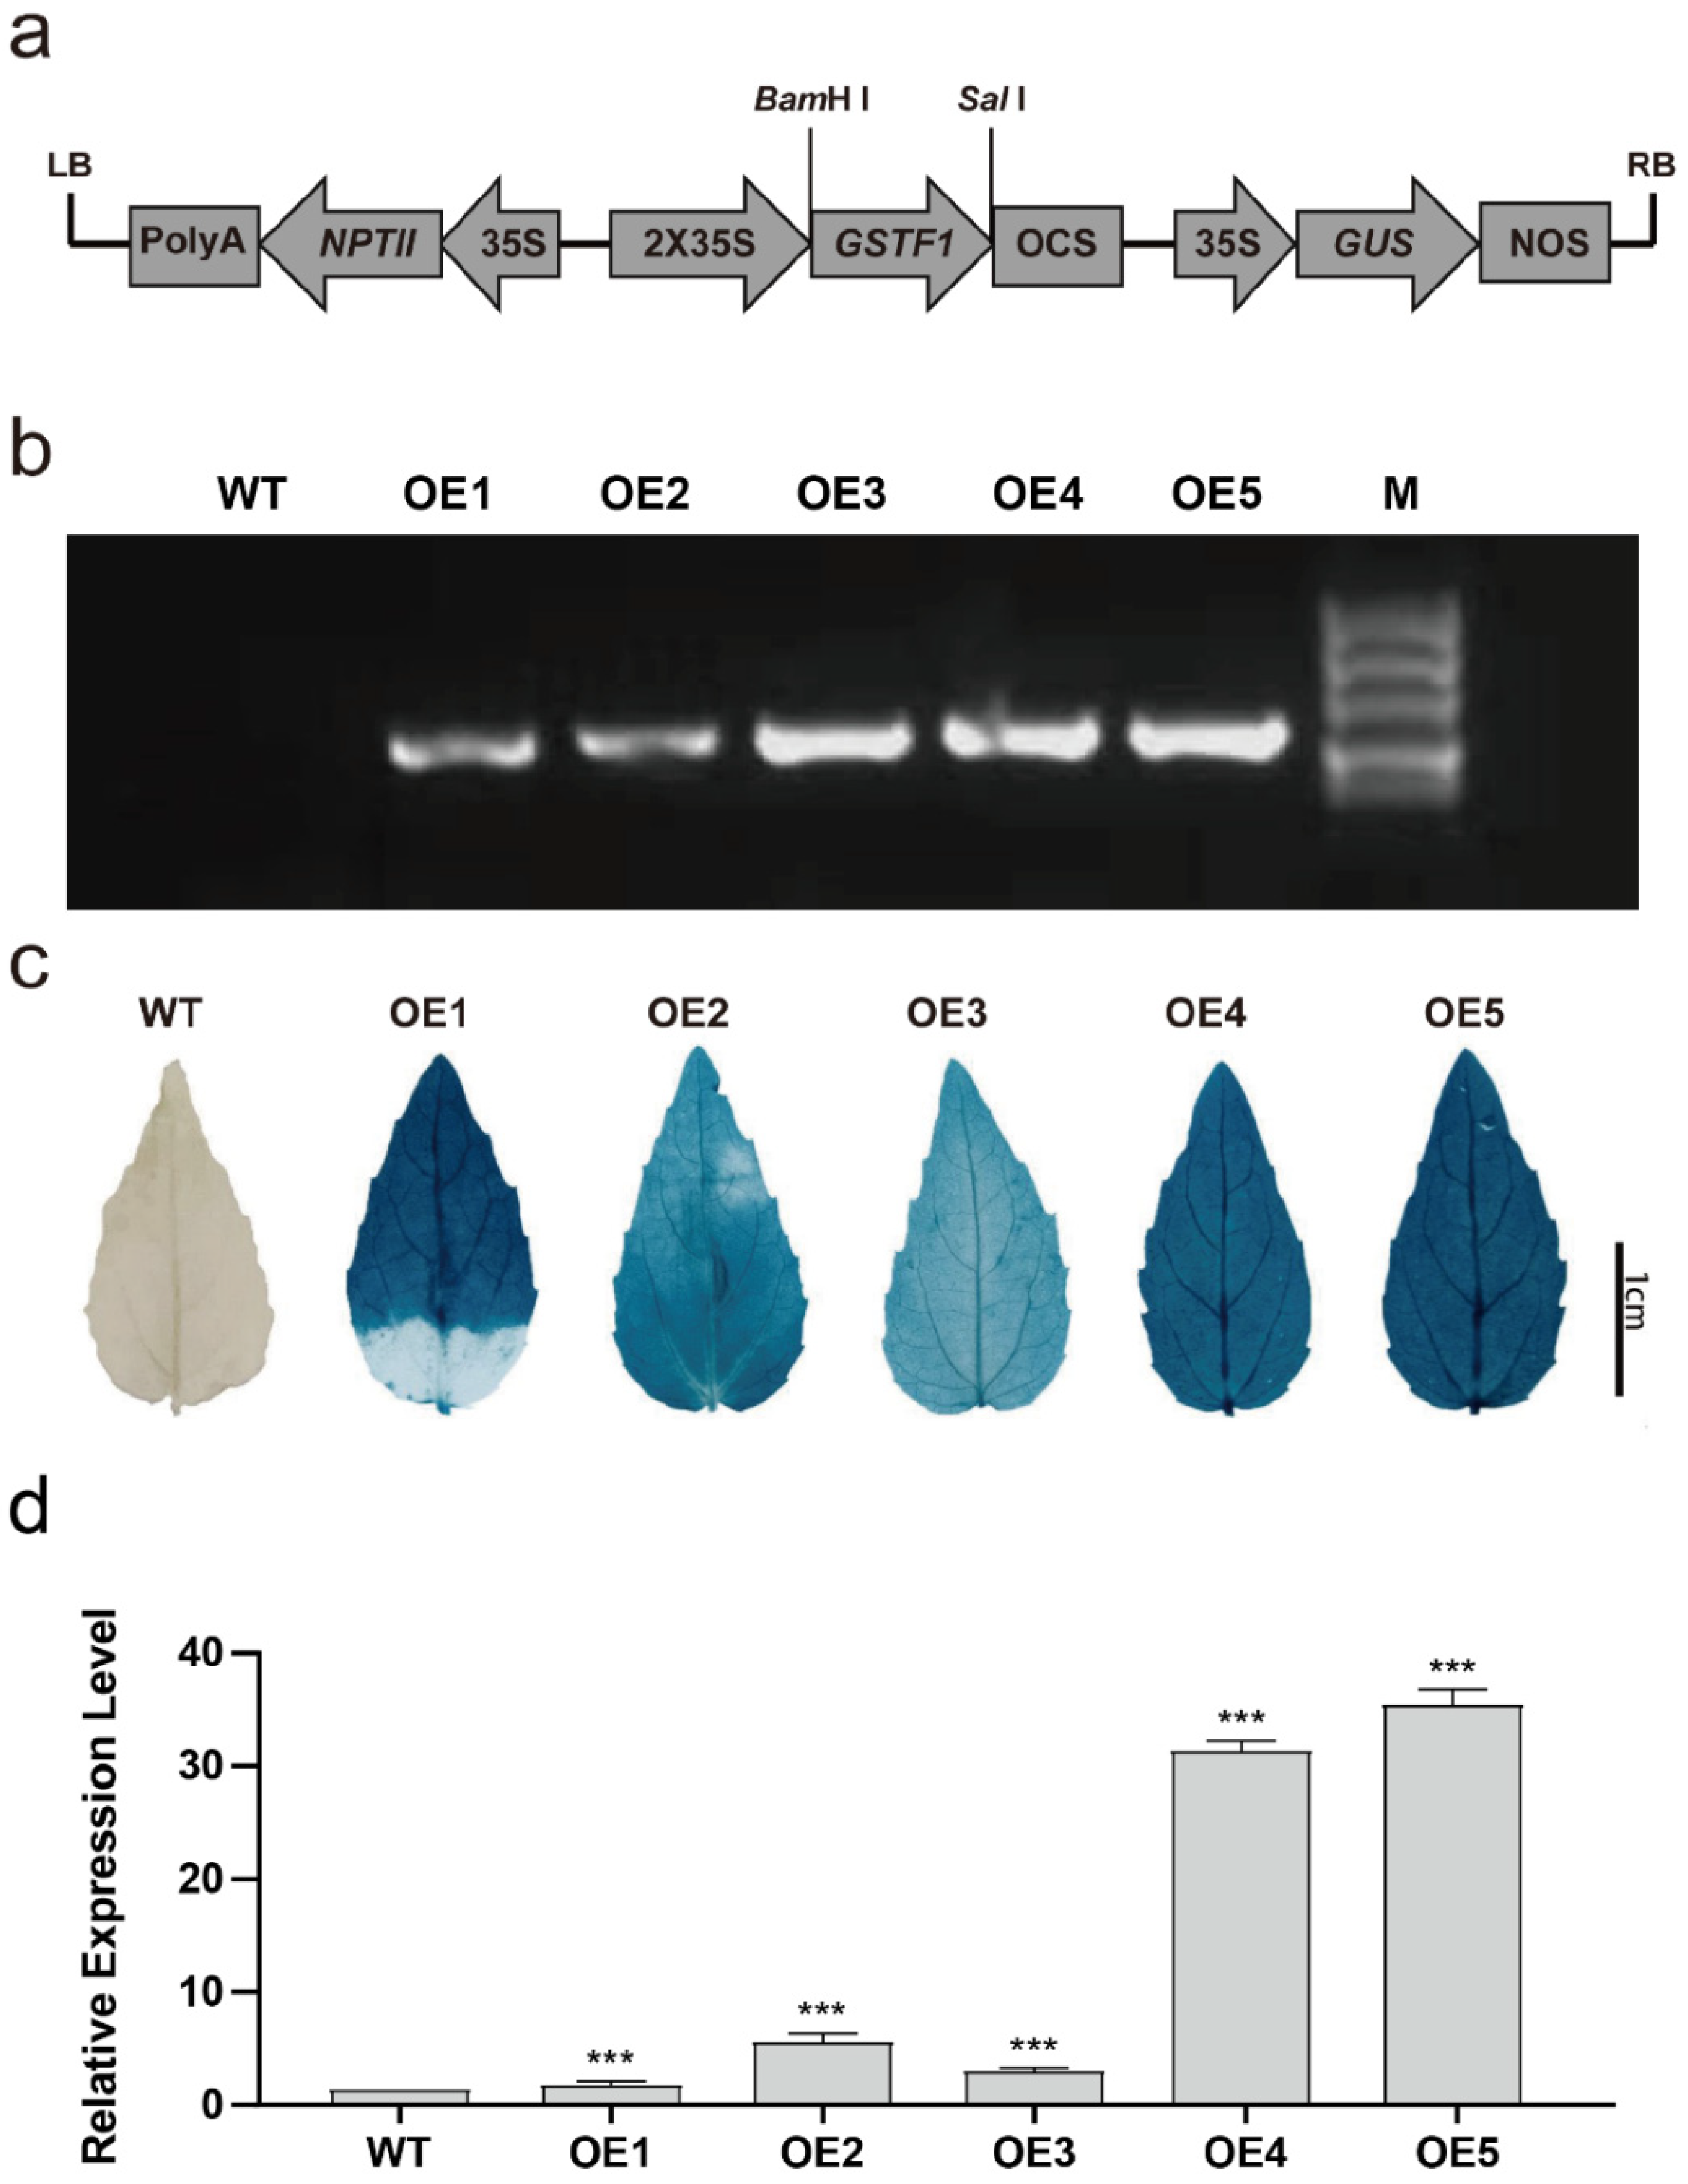
2.2. Transgenic Poplar Plants Overexpressing PtGSTF1 Are Generated
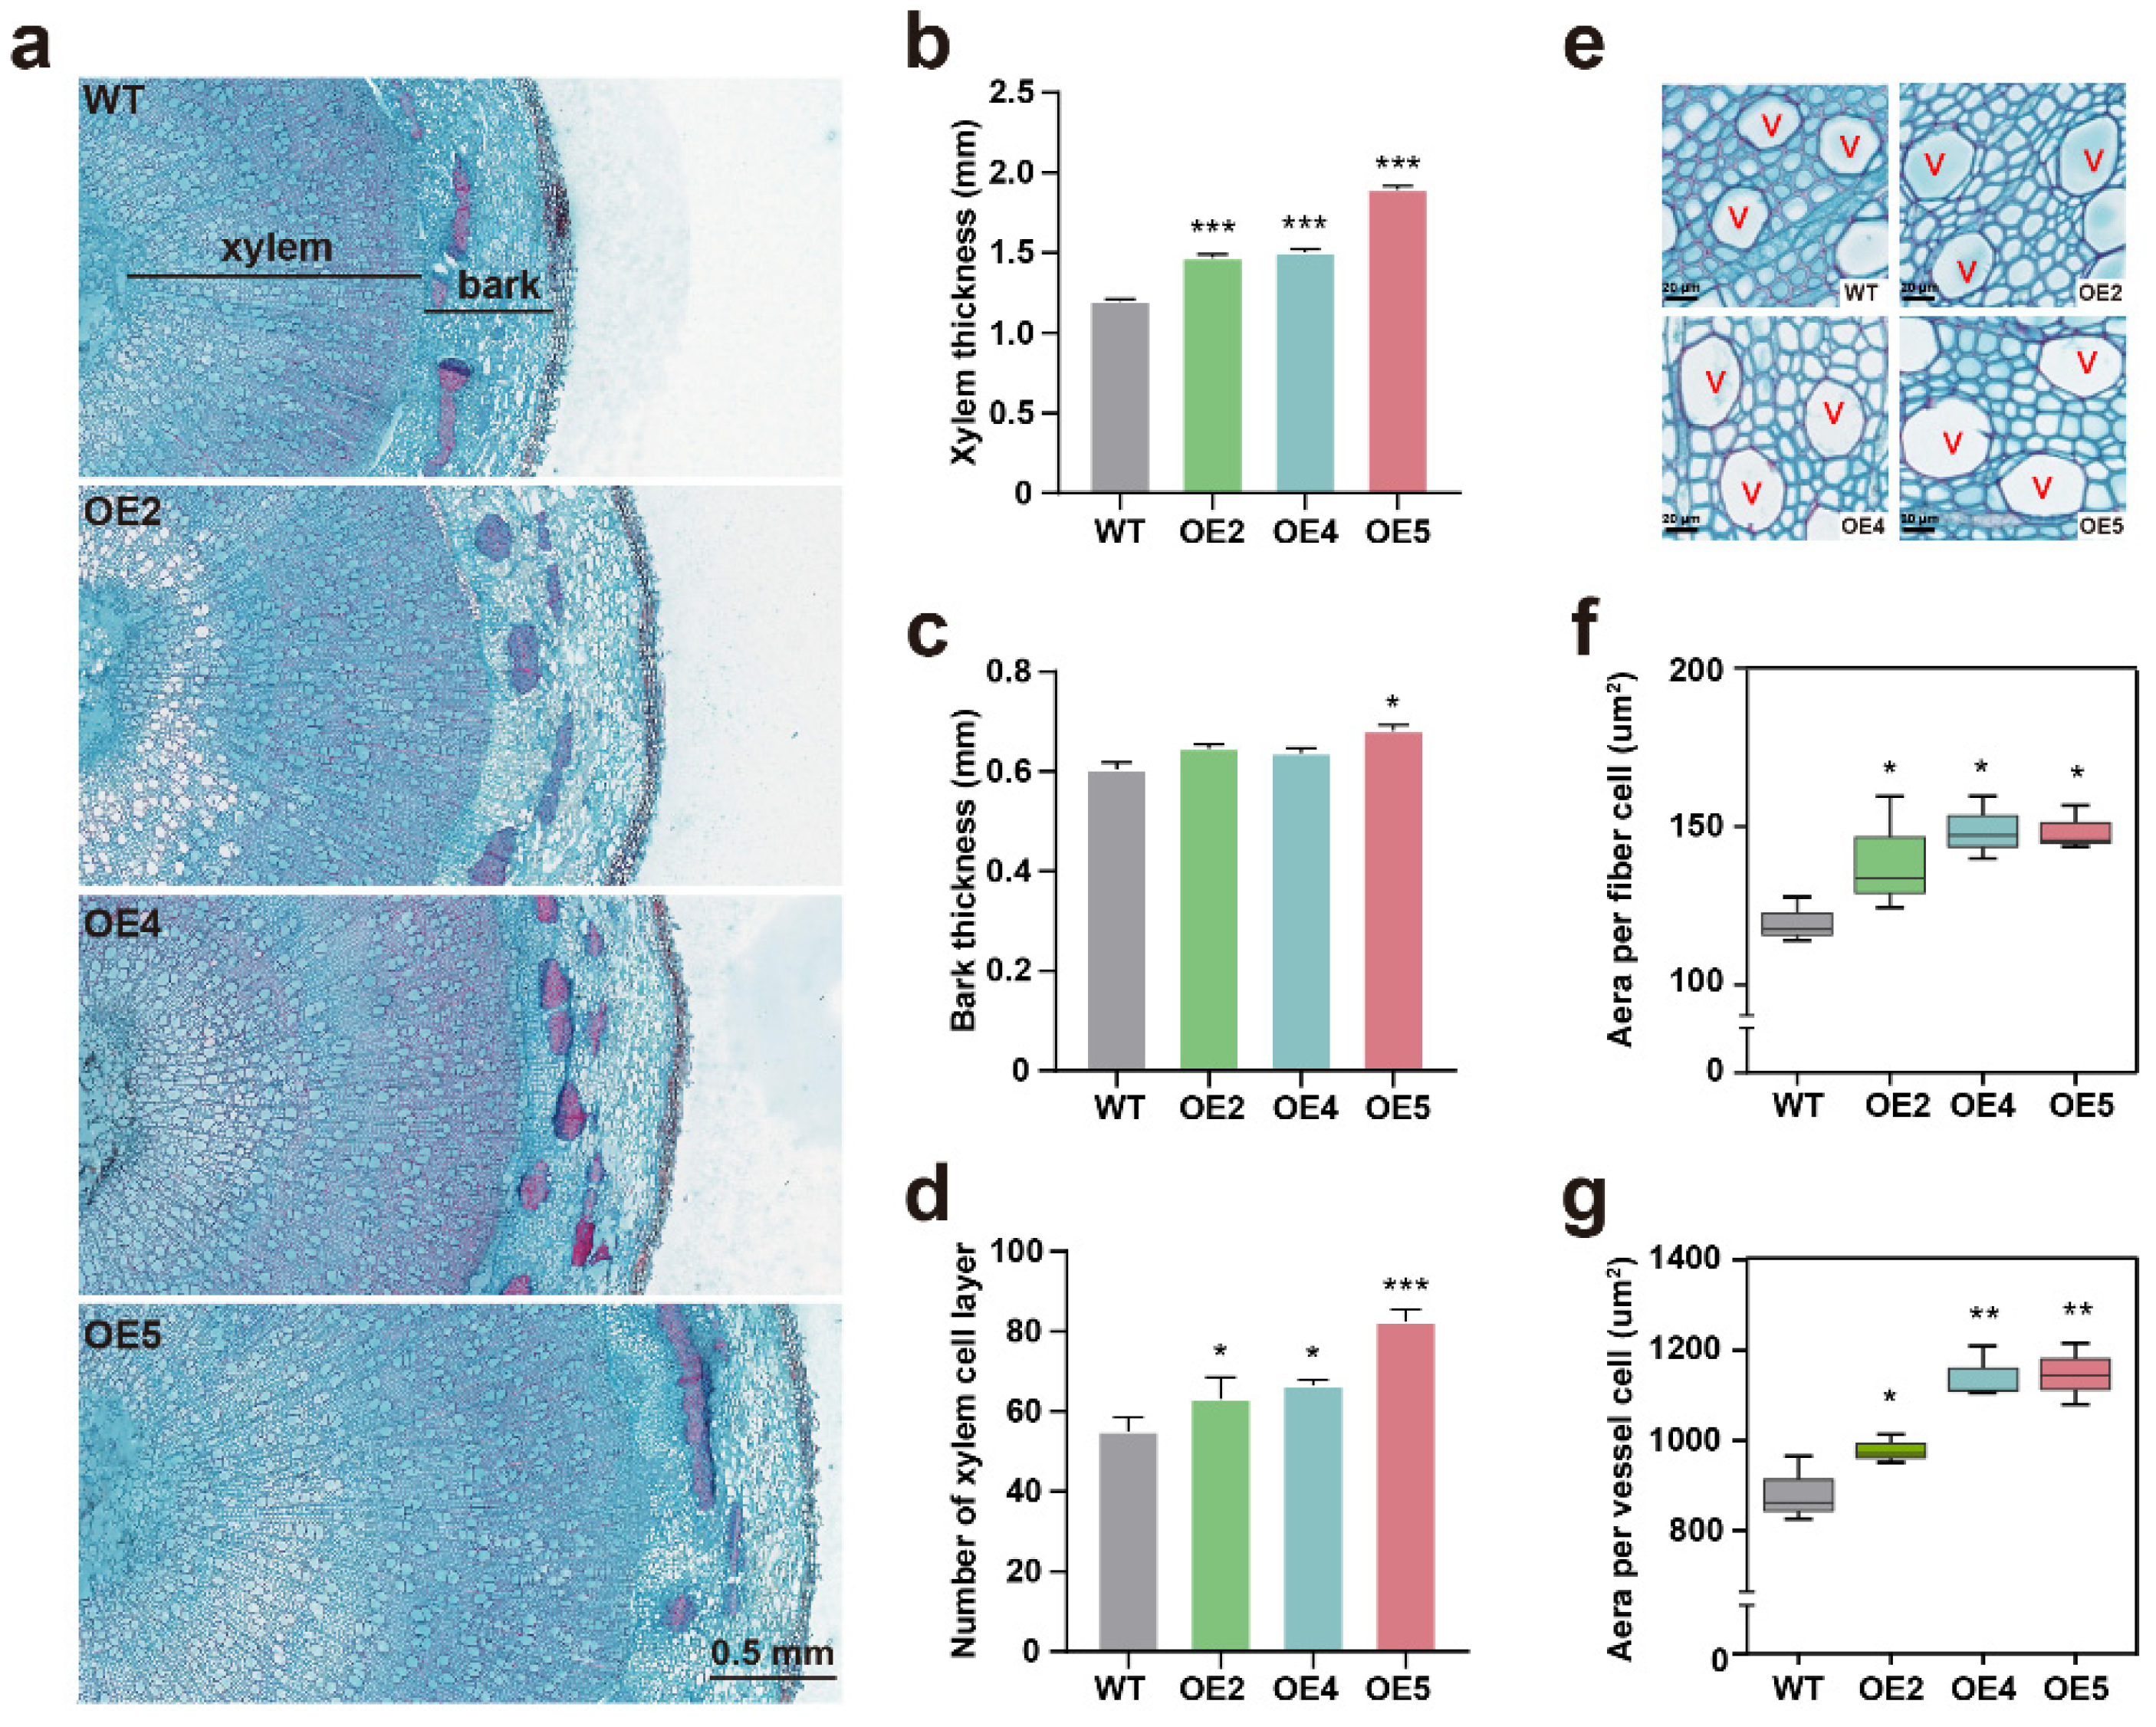
2.3. PtGSTF1 Promotes Shoot Growth and Wood Formation in Transgenic Poplar
2.4. Overexpression of PtGSTF1 Confers Salt Tolerance on Transgenic Poplar
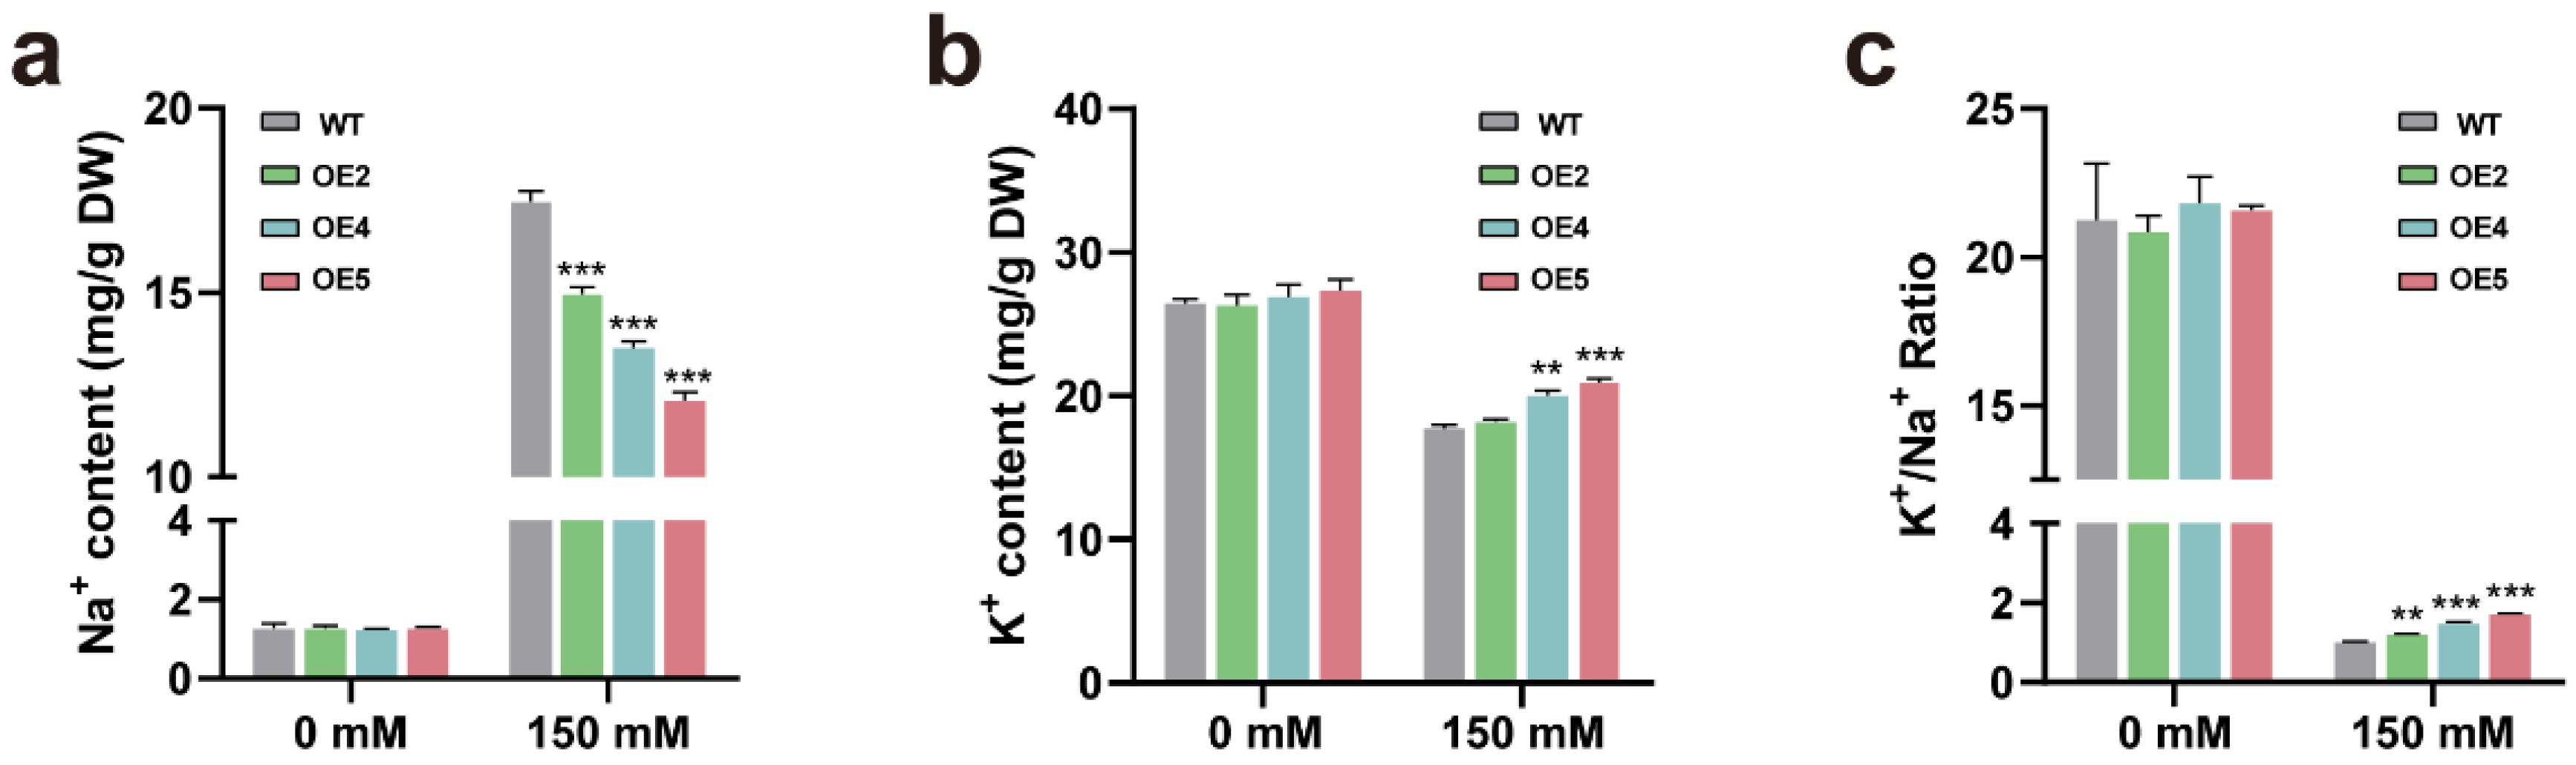
2.5. Transgenic Plants Overexpressing PtGSTF1 Accumulate Less Na+ and More K+ under Salt Stress Condition
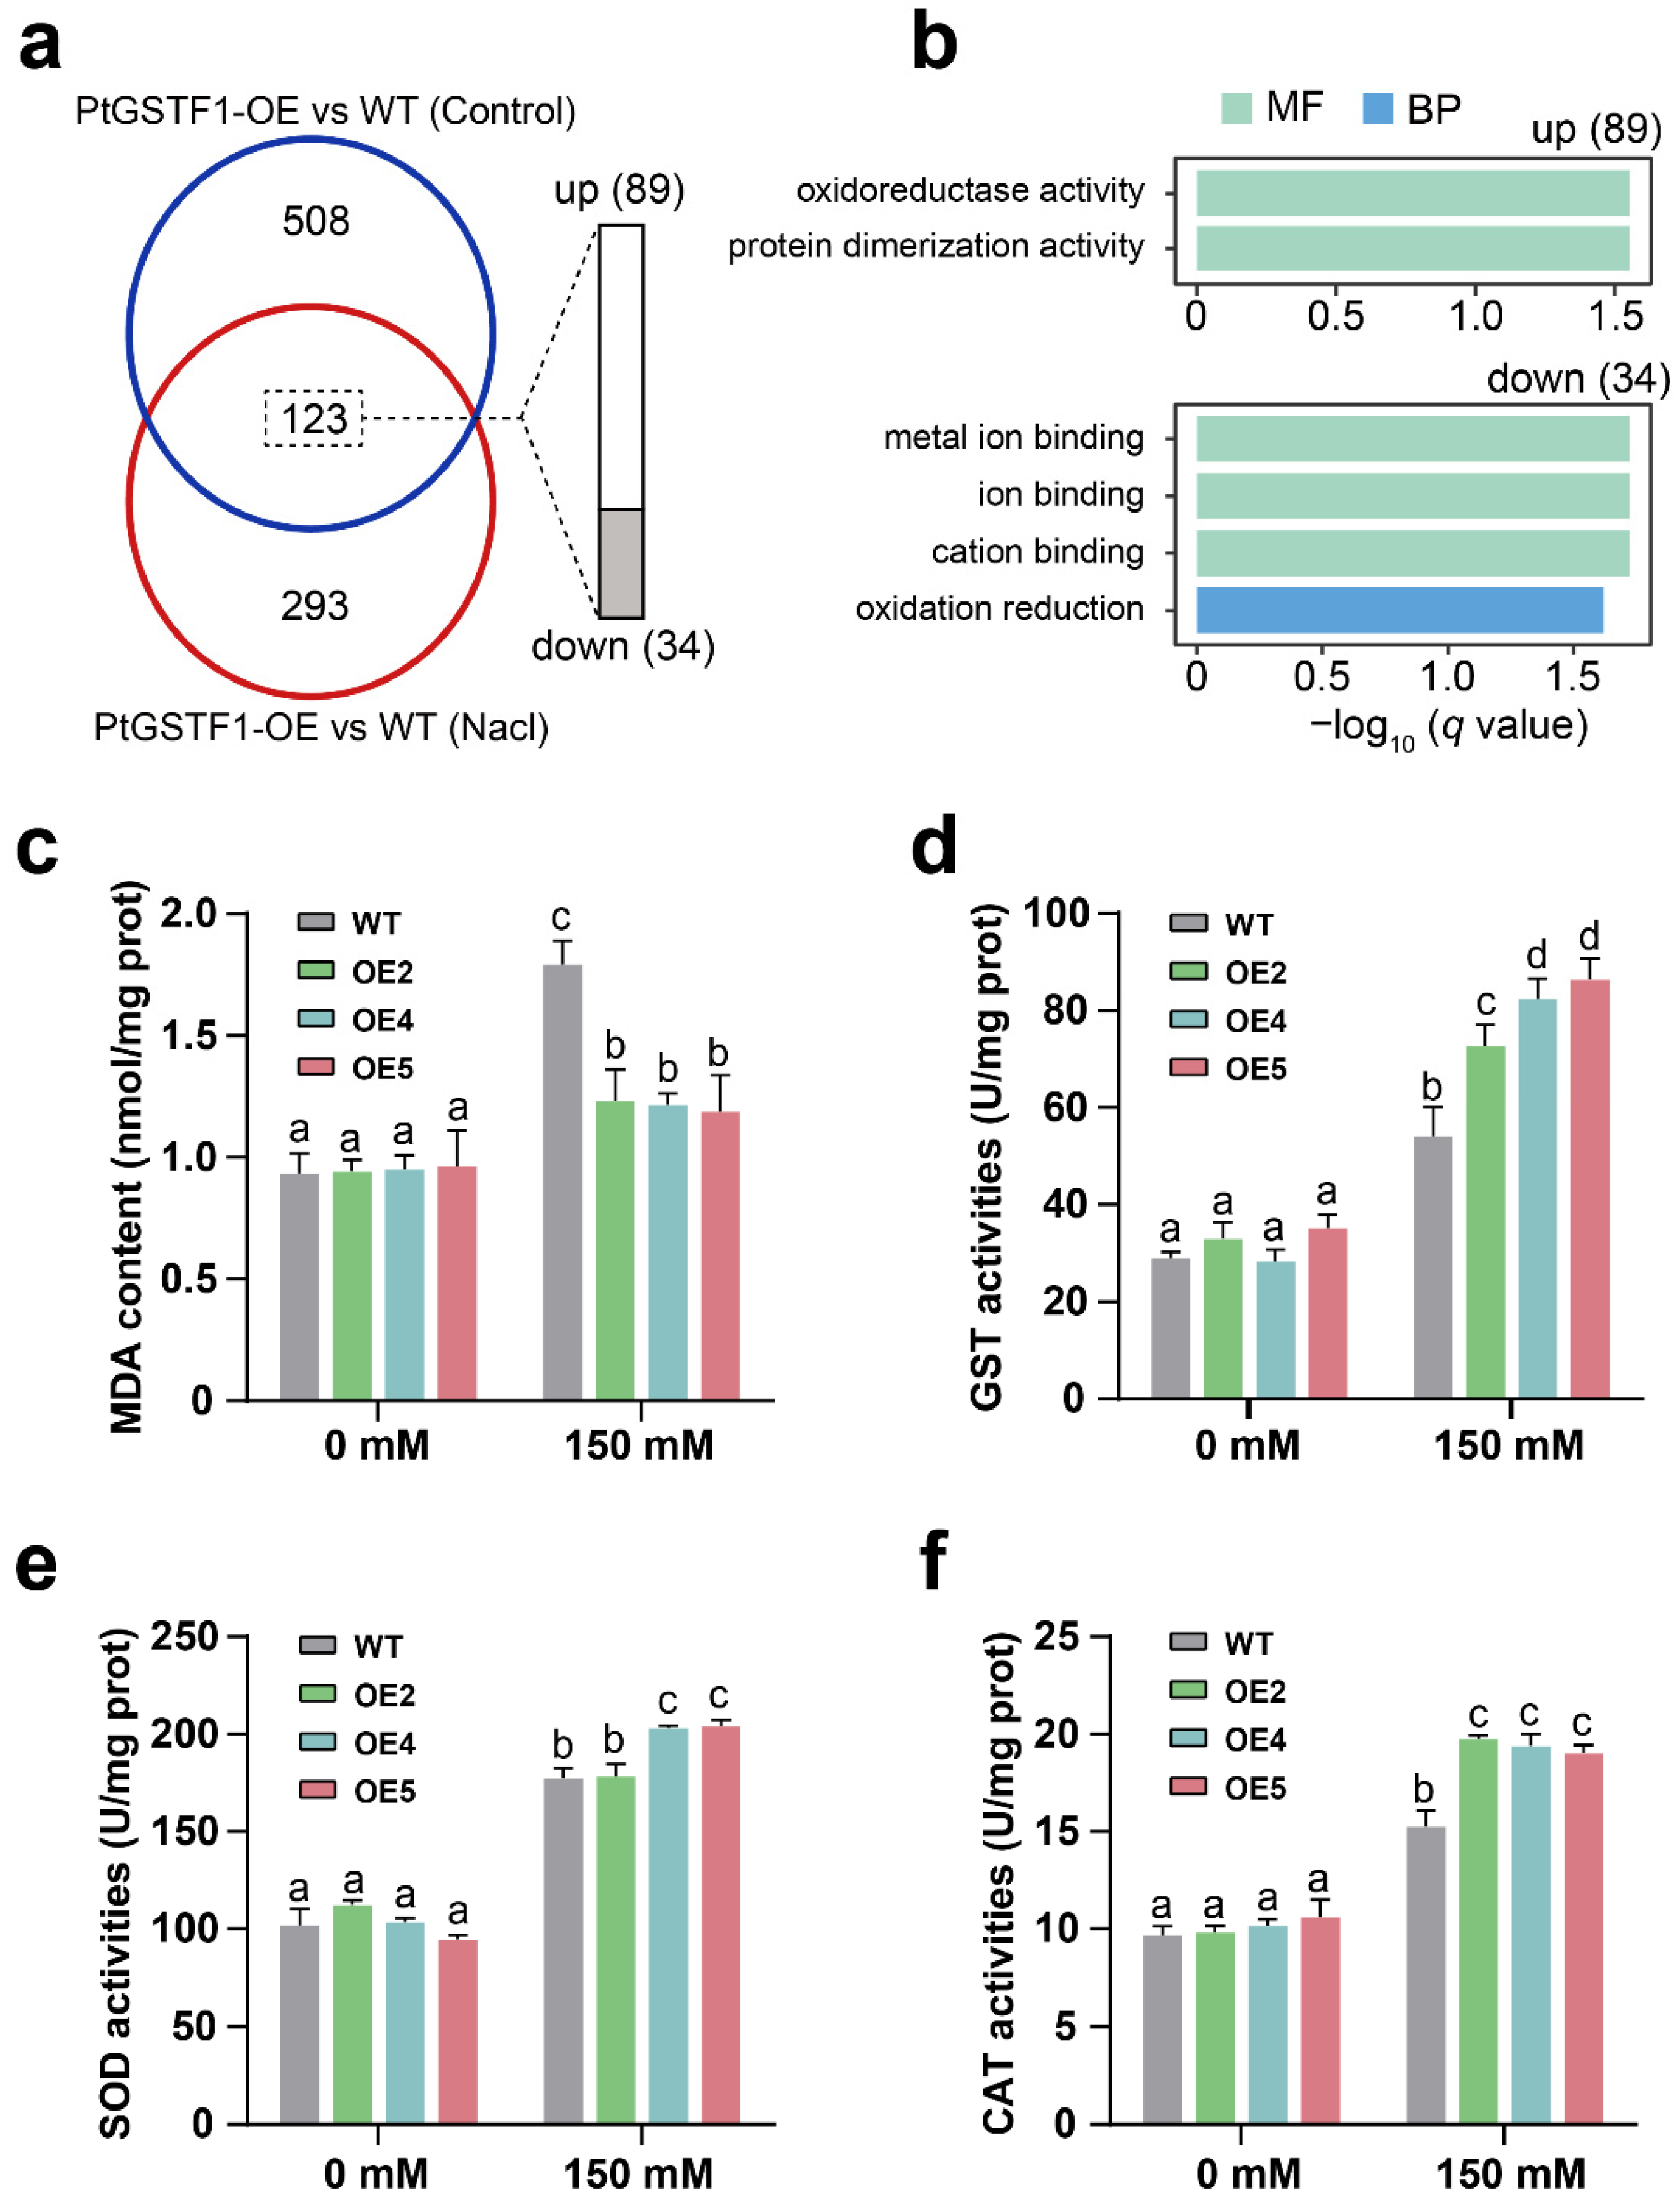
2.6. Growth and Stress Related Gene Expression Is Up- or Down-Regulated in Transgenic Plants
2.7. Overexpression of PtGSTF1 Increases ROS Scavenging Ability of Transgenic Plants
2.8. Genes Related to ABA Biosynthesis and Signal Transduction Are Up-Regulated in Transgenic Plants under Salt Stress Conditions
3. Discussion
4. Materials and Methods
4.1. Plant Materials, Growth Condition and Transformation
4.2. Histochemical Staining Analyses
4.3. Salt Tolerance Analysis
4.4. Subcellular Localization of PtGSTF1 Protein
4.5. ABA Treatment Analysis
4.6. Na+ and K+ Content Determination
4.7. Cross-Sectioning and Histological Staining of Poplar Plants
4.8. RNA-Seq Assays
4.9. Malondialdehyde Content, Glutathione S-Transferase and Antioxidant Enzyme Activity Assays
4.10. RNA Isolation, PCR and qRT-PCR Analysis
4.11. Statistical Analyses
5. Patents
Supplementary Materials
Author Contributions
Funding
Institutional Review Board Statement
Informed Consent Statement
Data Availability Statement
Conflicts of Interest
References
- Edwards, R.; Dixon, D.P.; Walbot, V. Plant glutathione S-transferases: Enzymes with multiple functions in sickness and in health. Trends Plant Sci. 2000, 5, 193–198. [Google Scholar] [CrossRef]
- Frova, C. The plant glutathione transferase gene family: Genomic structure, functions, expression and evolution. Physiol. Plant. 2003, 119, 469–479. [Google Scholar] [CrossRef]
- Csiszár, J.; Hecker, A.; Labrou, N.E.; Schröder, P.; Riechers, D.E. Plant glutathione transferases: Diverse, multi-tasking enzymes with yet-to-be discovered functions. Front. Plant Sci. 2019, 10, 1304. [Google Scholar] [CrossRef] [PubMed]
- Foyer, C.H.; Theodoulou, F.L.; Delrot, S. The functions of inter-and intracellular glutathione transport systems in plants. Trends Plant Sci. 2001, 6, 486–492. [Google Scholar] [CrossRef]
- Gullner, G.; Komives, T.; Király, L.; Schröder, P. Glutathione S-transferase enzymes in plant-pathogen interactions. Front. Plant Sci. 2018, 9, 1836. [Google Scholar] [CrossRef]
- Allocati, N.; Masulli, M.; Di Ilio, C.; Federici, L. Glutathione transferases: Substrates, inihibitors and pro-drugs in cancer and neurodegenerative diseases. Oncogenesis 2018, 7, 8. [Google Scholar] [CrossRef]
- Pascal, S.; Scalla, R. Purification and characterization of a safener-induced glutathione S-transferase from wheat (Triticum aestivum). Physiol. Plant. 1999, 106, 17–27. [Google Scholar] [CrossRef]
- Pégeot, H.; Koh, C.S.; Petre, B.; Mathiot, S.; Duplessis, S.; Hecker, A.; Didierjean, C.; Rouhier, N. The poplar Phi class glutathione transferase: Expression, activity and structure of GSTF1. Front. Plant Sci. 2014, 5, 712. [Google Scholar]
- Dixon, D.P.; Lapthorn, A.; Edwards, R. Plant glutathione transferases. Genome Biol. 2002, 3, reviews3004.1. [Google Scholar] [CrossRef][Green Version]
- Bohlmann, F.; Suding, H.; Cuatrecasas, J.; King, R.M.; Robinson, H. Neue diterpene aus der subtribus espeletiinae. Phytochemistry 1980, 19, 267–271. [Google Scholar] [CrossRef]
- DeRidder, B.P.; Goldsbrough, P.B. Organ-Specific Expression of Glutathione S-Transferases and the Efficacy of Herbicide Safeners in Arabidopsis. Plant Physiol. 2005, 140, 167–175. [Google Scholar] [CrossRef] [PubMed]
- Dixon, D.P.; Cummins, I.; Cole, D.J.; Edwards, R. Glutathione-mediated detoxification systems in plants. Curr. Opin. Plant Biol. 1998, 1, 258–266. [Google Scholar] [CrossRef]
- Evans Jr, A.F.; O’Brien, S.R.; Ma, R.; Hager, A.G.; Riggins, C.W.; Lambert, K.N.; Riechers, D.E. Biochemical characterization of metabolism-based atrazine resistance in Amaranthus tuberculatus and identification of an expressed GST associated with resistance. Plant Biotechnol. J. 2017, 15, 1238–1249. [Google Scholar] [CrossRef]
- Li, D.; Xu, L.; Pang, S.; Liu, Z.; Zhao, W.; Wang, C. Multiple Pesticides Detoxification Function of Maize (Zea mays) GST34. J. Agric. Food Chem. 2017, 65, 1847–1853. [Google Scholar] [CrossRef] [PubMed]
- Timmerman, K.P. Molecular characterization of corn glutathione S-transferase isozymes involved in herbicide detoxication. Physiol. Plant. 1989, 77, 465–471. [Google Scholar] [CrossRef]
- Ugalde, J.M.; Lamig, L.; Herrera-Vásquez, A.; Fuchs, P.; Homagk, M.; Kopriva, S.; Müller-Schüssele, S.J.; Holuigue, L.; Meyer, A.J. A dual role for glutathione transferase U7 in plant growth and protection from methyl viologen-induced oxidative stress. Plant Physiol. 2021, 187, 2451–2468. [Google Scholar] [CrossRef]
- Dixon, D.P.; Skipsey, M.; Edwards, R. Roles for glutathione transferases in plant secondary metabolism. Phytochemistry 2010, 71, 338–350. [Google Scholar] [CrossRef]
- Nianiou-Obeidat, I.; Madesis, P.; Kissoudis, C.; Voulgari, G.; Chronopoulou, E.; Tsaftaris, A.; Labrou, N.E. Plant glutathione transferase-mediated stress tolerance: Functions and biotechnological applications. Plant Cell Rep. 2017, 36, 791–805. [Google Scholar] [CrossRef]
- Cummins, I.; Bryant, D.N.; Edwards, R. Safener responsiveness and multiple herbicide resistance in the weed black-grass (Alopecurus myosuroides). Plant Biotechnol. J. 2009, 7, 807–820. [Google Scholar] [CrossRef]
- Du, B.; Zhao, W.; An, Y.; Li, Y.; Zhang, X.; Song, L.; Guo, C. Overexpression of an alfalfa glutathione S-transferase gene improved the saline-alkali tolerance of transgenic tobacco. Biol. Open 2019, 8, bio043505. [Google Scholar] [CrossRef]
- Mueller, S.; Hilbert, B.; Dueckershoff, K.; Roitsch, T.; Krischke, M.; Mueller, M.J.; Berger, S. General detoxification and stress responses are mediated by oxidized lipids through TGA transcription factors in Arabidopsis. Plant Cell 2008, 20, 768–785. [Google Scholar] [CrossRef] [PubMed]
- Nguyen, K.H.; Mostofa, M.G.; Watanabe, Y.; Tran, C.D.; Rahman, M.M.; Tran, L.-S.P. Overexpression of GmNAC085 enhances drought tolerance in Arabidopsis by regulating glutathione biosynthesis, redox balance and glutathione-dependent detoxification of reactive oxygen species and methylglyoxal. Environ. Exp. Bot. 2019, 161, 242–254. [Google Scholar] [CrossRef]
- Roxas, V.P.; Lodhi, S.A.; Garrett, D.K.; Mahan, J.R.; Allen, R.D. Stress tolerance in transgenic tobacco seedlings that overexpress glutathione S-transferase/glutathione peroxidase. Plant Cell Physiol. 2000, 41, 1229–1234. [Google Scholar] [CrossRef]
- Stotz, H.U.; Mueller, S.; Zoeller, M.; Mueller, M.J.; Berger, S. TGA transcription factors and jasmonate-independent COI1 signalling regulate specific plant responses to reactive oxylipins. J. Exp. Bot. 2013, 64, 963–975. [Google Scholar] [CrossRef]
- Yang, G.; Peng, S.; Wang, T.; Gao, X.; Li, D.; Li, M.; Chen, S.; Xu, Z. Walnut ethylene response factor JrERF2-2 interact with JrWRKY7 to regulate the GSTs in plant drought tolerance. Ecotoxicol. Environ. Saf. 2021, 228, 112945. [Google Scholar] [CrossRef]
- Cheng, X.; He, Q.; Tang, S.; Wang, H.; Zhang, X.; Lv, M.; Liu, H.; Gao, Q.; Zhou, Y.; Wang, Q. The miR172/IDS1 signaling module confers salt tolerance through maintaining ROS homeostasis in cereal crops. New Phytol. 2021, 230, 1017–1033. [Google Scholar] [CrossRef]
- Cummins, I.; Wortley, D.J.; Sabbadin, F.; He, Z.; Coxon, C.R.; Straker, H.E.; Sellars, J.D.; Knight, K.; Edwards, L.; Hughes, D. Key role for a glutathione transferase in multiple-herbicide resistance in grass weeds. Proc. Natl. Acad. Sci. USA 2013, 110, 5812–5817. [Google Scholar] [CrossRef]
- Xu, J.; Tian, Y.-S.; Xing, X.-J.; Xu, Z.-S.; Zhu, B.; Fu, X.-Y.; Peng, R.-H.; Yao, Q.-H. Enhancement of phenol stress tolerance in transgenic Arabidopsis plants overexpressing glutathione S-transferase. Plant Growth Regul. 2017, 82, 37–45. [Google Scholar] [CrossRef]
- Moons, A. Regulatory and functional interactions of plant growth regulators and plant glutathione S-transferases (GSTs). Vitam. Horm. 2005, 72, 155–202. [Google Scholar]
- Zhou, H.; Zhang, F.; Zhai, F.; Su, Y.; Zhou, Y.; Ge, Z.; Tilak, P.; Eirich, J.; Finkemeier, I.; Fu, L. Rice GLUTATHIONE PEROXIDASE1-mediated oxidation of bZIP68 positively regulates ABA-independent osmotic stress signaling. Mol. Plant 2021, 15, 651–670. [Google Scholar] [CrossRef]
- Jiang, H.-W.; Liu, M.-J.; Chen, I.-C.; Huang, C.-H.; Chao, L.-Y.; Hsieh, H.-L. A glutathione S-transferase regulated by light and hormones participates in the modulation of Arabidopsis seedling development. Plant Physiol. 2010, 154, 1646–1658. [Google Scholar] [CrossRef] [PubMed]
- Kao, C.-W.; Bakshi, M.; Sherameti, I.; Dong, S.; Reichelt, M.; Oelmüller, R.; Yeh, K.-W. A Chinese cabbage (Brassica campetris subsp. Chinensis) τ-type glutathione-S-transferase stimulates Arabidopsis development and primes against abiotic and biotic stress. Plant Mol. Biol. 2016, 92, 643–659. [Google Scholar] [CrossRef] [PubMed]
- Sharma, R.; Sahoo, A.; Devendran, R.; Jain, M. Over-expression of a rice tau class glutathione s-transferase gene improves tolerance to salinity and oxidative stresses in Arabidopsis. PLoS ONE 2014, 9, e92900. [Google Scholar] [CrossRef]
- Kumar, S.; Asif, M.H.; Chakrabarty, D.; Tripathi, R.D.; Dubey, R.S.; Trivedi, P.K. Expression of a rice Lambda class of glutathione S-transferase, OsGSTL2, in Arabidopsis provides tolerance to heavy metal and other abiotic stresses. J. Hazard. Mater. 2013, 248, 228–237. [Google Scholar] [CrossRef] [PubMed]
- Lan, T.; Yang, Z.-L.; Yang, X.; Liu, Y.-J.; Wang, X.-R.; Zeng, Q.-Y. Extensive functional diversification of the Populus glutathione S-transferase supergene family. Plant Cell 2009, 21, 3749–3766. [Google Scholar] [CrossRef] [PubMed]
- Cohen, D.; Bogeat-Triboulot, M.-B.; Tisserant, E.; Balzergue, S.; Martin-Magniette, M.-L.; Lelandais, G.; Ningre, N.; Renou, J.-P.; Tamby, J.-P.; Le Thiec, D. Comparative transcriptomics of drought responses in Populus: A meta-analysis of genome-wide expression profiling in mature leaves and root apices across two genotypes. BMC Genom. 2010, 11, 630. [Google Scholar] [CrossRef]
- Ralph, S.; Oddy, C.; Cooper, D.; Yueh, H.; Jancsik, S.; Kolosova, N.; Philippe, R.N.; Aeschliman, D.; White, R.; Huber, D. Genomics of hybrid poplar (Populus trichocarpa × deltoides) interacting with forest tent caterpillars (Malacosoma disstria): Normalized and full-length cDNA libraries, expressed sequence tags, and a cDNA microarray for the study of insect-induced defences in poplar. Mol. Ecol. 2006, 15, 1275–1297. [Google Scholar]
- Chen, F.; Zhang, S.; Jiang, H.; Ma, W.; Korpelainen, H.; Li, C. Comparative proteomics analysis of salt response reveals sex-related photosynthetic inhibition by salinity in Populus cathayana cuttings. J. Proteome Res. 2011, 10, 3944–3958. [Google Scholar] [CrossRef]
- Kieffer, P.; Schröder, P.; Dommes, J.; Hoffmann, L.; Renaut, J.; Hausman, J.-F. Proteomic and enzymatic response of poplar to cadmium stress. J. Proteom. 2009, 72, 379–396. [Google Scholar] [CrossRef]
- Zhang, S.; Feng, L.; Jiang, H.; Ma, W.; Korpelainen, H.; Li, C. Biochemical and proteomic analyses reveal that Populus cathayana males and females have different metabolic activities under chilling stress. J. Proteome Res. 2012, 11, 5815–5826. [Google Scholar] [CrossRef]
- Mano, J.; Kanameda, S.; Kuramitsu, R.; Matsuura, N.; Yamauchi, Y. Detoxification of reactive carbonyl species by glutathione transferase tau isozymes. Front. Plant Sci. 2019, 10, 487. [Google Scholar] [CrossRef] [PubMed]
- Gong, H.; Jiao, Y.; Hu, W.-W.; Pua, E.-C. Expression of glutathione-S-transferase and its role in plant growth and development in vivo and shoot morphogenesis in vitro. Plant Mol. Biol. 2005, 57, 53–66. [Google Scholar] [CrossRef] [PubMed]
- Wang, Q.; Guo, J.; Jin, P.; Guo, M.; Guo, J.; Cheng, P.; Li, Q.; Wang, B. Glutathione S-transferase interactions enhance wheat resistance to powdery mildew but not wheat stripe rust. Plant Physiol. 2022, kiac326. [Google Scholar] [CrossRef] [PubMed]
- Li, G.; Peng, X.; Xuan, H.; Wei, L.; Yang, Y.; Guo, T.; Kang, G. Proteomic analysis of leaves and roots of common wheat (Triticum aestivum L.) under copper-stress conditions. J. Proteome Res. 2013, 12, 4846–4861. [Google Scholar] [CrossRef]
- Jiang, S.; Chen, M.; He, N.; Chen, X.; Wang, N.; Sun, Q.; Zhang, T.; Xu, H.; Fang, H.; Wang, Y. MdGSTF6, activated by MdMYB1, plays an essential role in anthocyanin accumulation in apple. Hortic. Res. 2019, 6, 40. [Google Scholar] [CrossRef]
- Ito, J.; Batth, T.S.; Petzold, C.J.; Redding-Johanson, A.M.; Mukhopadhyay, A.; Verboom, R.; Meyer, E.H.; Millar, A.H.; Heazlewood, J.L. Analysis of the Arabidopsis cytosolic proteome highlights subcellular partitioning of central plant metabolism. J. Proteome Res. 2011, 10, 1571–1582. [Google Scholar] [CrossRef]
- Zhang, Y.; He, J.; Xiao, Y.; Zhang, Y.; Liu, Y.; Wan, S.; Liu, L.; Dong, Y.; Liu, H.; Yu, Y. CsGSTU8, a Glutathione S-Transferase From Camellia sinensis, Is Regulated by CsWRKY48 and Plays a Positive Role in Drought Tolerance. Front. Plant Sci. 2021, 12, 795919. [Google Scholar] [CrossRef]
- Jin, Y.-L.; Tang, R.-J.; Wang, H.-H.; Jiang, C.-M.; Bao, Y.; Yang, Y.; Liang, M.-X.; Sun, Z.-C.; Kong, F.-J.; Li, B.; et al. Overexpression of Populus trichocarpa CYP85A3 promotes growth and biomass production in transgenic trees. Plant Biotechnol. J. 2017, 15, 1309–1321. [Google Scholar] [CrossRef]
- Yang, Y.; Tang, R.; Li, B.; Wang, H.; Jin, Y.; Jiang, C.; Bao, Y.; Su, H.; Zhao, N.; Ma, X. Overexpression of a Populus trichocarpa H+-pyrophosphatase gene PtVP1.1 confers salt tolerance on transgenic poplar. Tree Physiol. 2015, 35, 663–677. [Google Scholar] [CrossRef]
- Yang, Y.; Tang, R.-J.; Jiang, C.-M.; Li, B.; Kang, T.; Liu, H.; Zhao, N.; Ma, X.-J.; Yang, L.; Chen, S.-L.; et al. Overexpression of the PtSOS2 gene improves tolerance to salt stress in transgenic poplar plants. Plant Biotechnol. J. 2015, 13, 962–973. [Google Scholar] [CrossRef]
- Al Hassan, M.; Morosan, M.; López-Gresa, M.D.P.; Prohens, J.; Vicente, O.; Boscaiu, M. Salinity-induced variation in biochemical markers provides insight into the mechanisms of salt tolerance in common (Phaseolus vulgaris) and runner (P. coccineus) beans. Int. J. Mol. Sci. 2016, 17, 1582. [Google Scholar] [CrossRef] [PubMed]
- Huang, Y.; Cui, X.; Cen, H.; Wang, K.; Zhang, Y. Transcriptomic analysis reveals vacuolar Na+(K+)/H+ antiporter gene contributing to growth, development, and defense in switchgrass (Panicum virgatum L.). BMC Plant Biol. 2018, 18, 57. [Google Scholar] [CrossRef] [PubMed]
- Skliros, D.; Kalloniati, C.; Karalias, G.; Skaracis, G.N.; Rennenberg, H.; Flemetakis, E. Global metabolomics analysis reveals distinctive tolerance mechanisms in different plant organs of lentil (Lens culinaris) upon salinity stress. Plant Soil 2018, 429, 451–468. [Google Scholar] [CrossRef]
- Wu, H.; Zhu, M.; Shabala, L.; Zhou, M.; Shabala, S. K+ retention in leaf mesophyll, an overlooked component of salinity tolerance mechanism: A case study for barley. J. Integr. Plant Biol. 2015, 57, 171–185. [Google Scholar] [CrossRef] [PubMed]
- Wang, Z.; Hong, Y.; Zhu, G.; Li, Y.; Niu, Q.; Yao, J.; Hua, K.; Bai, J.; Zhu, Y.; Shi, H. Loss of salt tolerance during tomato domestication conferred by variation in a Na+/K+ transporter. EMBO J. 2020, 39, e103256. [Google Scholar] [CrossRef]
- Tian, Q.; Shen, L.; Luan, J.; Zhou, Z.; Guo, D.; Shen, Y.; Jing, W.; Zhang, B.; Zhang, Q.; Zhang, W. Rice shaker potassium channel OsAKT2 positively regulates salt tolerance and grain yield by mediating K+ redistribution. Plant Cell Environ. 2021, 44, 2951–2965. [Google Scholar] [CrossRef]
- Xia, X.-J.; Zhou, Y.-H.; Shi, K.; Zhou, J.; Foyer, C.H.; Yu, J.-Q. Interplay between reactive oxygen species and hormones in the control of plant development and stress tolerance. J. Exp. Bot. 2015, 66, 2839–2856. [Google Scholar] [CrossRef]
- Bose, J.; Rodrigo-Moreno, A.; Shabala, S. ROS homeostasis in halophytes in the context of salinity stress tolerance. J. Exp. Bot. 2014, 65, 1241–1257. [Google Scholar] [CrossRef]
- Julkowska, M.M.; Testerink, C. Tuning plant signaling and growth to survive salt. Trends Plant Sci. 2015, 20, 586–594. [Google Scholar] [CrossRef]
- Waszczak, C.; Carmody, M.; Kangasjärvi, J. Reactive oxygen species in plant signaling. Annu. Rev. Plant Biol. 2018, 69, 209–236. [Google Scholar] [CrossRef]
- Kumar, S.; Trivedi, P.K. Glutathione S-transferases: Role in combating abiotic stresses including arsenic detoxification in plants. Front. Plant Sci. 2018, 9, 751. [Google Scholar] [CrossRef] [PubMed]
- Sun, C.; Dudley, S.; McGinnis, M.; Trumble, J.; Gan, J. Acetaminophen detoxification in cucumber plants via induction of glutathione S-transferases. Sci. Total Environ. 2019, 649, 431–439. [Google Scholar] [CrossRef]
- Liu, Y.-J.; Han, X.-M.; Ren, L.-L.; Yang, H.-L.; Zeng, Q.-Y. Functional divergence of the glutathione S-transferase supergene family in Physcomitrella patens reveals complex patterns of large gene family evolution in land plants. Plant Physiol. 2013, 161, 773–786. [Google Scholar] [CrossRef]
- Chen, J.-H.; Jiang, H.-W.; Hsieh, E.-J.; Chen, H.-Y.; Chien, C.-T.; Hsieh, H.-L.; Lin, T.-P. Drought and salt stress tolerance of an Arabidopsis glutathione S-transferase U17 knockout mutant are attributed to the combined effect of glutathione and abscisic acid. Plant Physiol. 2012, 158, 340–351. [Google Scholar] [CrossRef]
- Hu, B.; Zhao, J.; Lai, B.; Qin, Y.; Wang, H.; Hu, G. LcGST4 is an anthocyanin-related glutathione S-transferase gene in Litchi chinensis Sonn. Plant Cell Rep. 2016, 35, 831–843. [Google Scholar] [CrossRef] [PubMed]
- Smith, A.P.; Nourizadeh, S.D.; Peer, W.A.; Xu, J.; Bandyopadhyay, A.; Murphy, A.S.; Goldsbrough, P.B. Arabidopsis AtGSTF2 is regulated by ethylene and auxin, and encodes a glutathione S-transferase that interacts with flavonoids. Plant J. 2003, 36, 433–442. [Google Scholar] [CrossRef] [PubMed]
- Dixon, D.P.; Sellars, J.D.; Edwards, R. The Arabidopsis phi class glutathione transferase At GSTF2: Binding and regulation by biologically active heterocyclic ligands. Biochem. J. 2011, 438, 63–70. [Google Scholar] [CrossRef]
- Wang, H.; Wang, C.; Liu, H.; Tang, R.; Zhang, H. An efficient Agrobacterium-mediated transformation and regeneration system for leaf explants of two elite aspen hybrid clones Populus alba × P. berolinensis and Populus davidiana × P. bolleana. Plant Cell Rep. 2011, 30, 2037–2044. [Google Scholar] [CrossRef]
- Gao, H.; Huang, H.; Lu, K.; Wang, C.; Liu, X.; Song, Z.; Zhou, H.; Yang, L.; Li, B.; Yu, C. OsCYP714D1 improves plant growth and salt tolerance through regulating gibberellin and ion homeostasis in transgenic poplar. Plant Physiol. Biochem. 2021, 168, 447–456. [Google Scholar] [CrossRef]
- Tang, R.-J.; Liu, H.; Yang, Y.; Yang, L.; Gao, X.-S.; Garcia, V.J.; Luan, S.; Zhang, H.-X. Tonoplast calcium sensors CBL2 and CBL3 control plant growth and ion homeostasis through regulating V-ATPase activity in Arabidopsis. Cell Res. 2012, 22, 1650–1665. [Google Scholar] [CrossRef]
- Wang, B. Comparison of extractive methods of Na+, K+ in wheat leaves. Plant Physiol. Commun. 1995, 31, 50–52. [Google Scholar]
- Draper, H.; Squires, E.; Mahmoodi, H.; Wu, J.; Agarwal, S.; Hadley, M. A comparative evaluation of thiobarbituric acid methods for the determination of malondialdehyde in biological materials. Free Radic. Biol. Med. 1993, 15, 353–363. [Google Scholar] [CrossRef]


Publisher’s Note: MDPI stays neutral with regard to jurisdictional claims in published maps and institutional affiliations. |
© 2022 by the authors. Licensee MDPI, Basel, Switzerland. This article is an open access article distributed under the terms and conditions of the Creative Commons Attribution (CC BY) license (https://creativecommons.org/licenses/by/4.0/).
Share and Cite
Gao, H.; Yu, C.; Liu, R.; Li, X.; Huang, H.; Wang, X.; Zhang, C.; Jiang, N.; Li, X.; Cheng, S.; et al. The Glutathione S-Transferase PtGSTF1 Improves Biomass Production and Salt Tolerance through Regulating Xylem Cell Proliferation, Ion Homeostasis and Reactive Oxygen Species Scavenging in Poplar. Int. J. Mol. Sci. 2022, 23, 11288. https://doi.org/10.3390/ijms231911288
Gao H, Yu C, Liu R, Li X, Huang H, Wang X, Zhang C, Jiang N, Li X, Cheng S, et al. The Glutathione S-Transferase PtGSTF1 Improves Biomass Production and Salt Tolerance through Regulating Xylem Cell Proliferation, Ion Homeostasis and Reactive Oxygen Species Scavenging in Poplar. International Journal of Molecular Sciences. 2022; 23(19):11288. https://doi.org/10.3390/ijms231911288
Chicago/Turabian StyleGao, Hongsheng, Chunyan Yu, Ruichao Liu, Xiaoyan Li, Huiqing Huang, Xueting Wang, Chao Zhang, Ning Jiang, Xiaofang Li, Shuang Cheng, and et al. 2022. "The Glutathione S-Transferase PtGSTF1 Improves Biomass Production and Salt Tolerance through Regulating Xylem Cell Proliferation, Ion Homeostasis and Reactive Oxygen Species Scavenging in Poplar" International Journal of Molecular Sciences 23, no. 19: 11288. https://doi.org/10.3390/ijms231911288
APA StyleGao, H., Yu, C., Liu, R., Li, X., Huang, H., Wang, X., Zhang, C., Jiang, N., Li, X., Cheng, S., Zhang, H., & Li, B. (2022). The Glutathione S-Transferase PtGSTF1 Improves Biomass Production and Salt Tolerance through Regulating Xylem Cell Proliferation, Ion Homeostasis and Reactive Oxygen Species Scavenging in Poplar. International Journal of Molecular Sciences, 23(19), 11288. https://doi.org/10.3390/ijms231911288