1. Introduction
1.1. Machine Learning and Metabolomics
The use of metabolomics for personalized medicine is a rapidly emerging field. This growth has been supported by recent technological innovations that allow for the quantitative analysis of hundreds to thousands of molecules in a single sample and the application of advanced statistical and classification techniques. To deal with a large number of variables, feature selection and classification methods such as partial least-squares discriminant analysis (PLS-DA), principal component analysis (PCA), and machine learning have been largely employed [
1,
2,
3,
4,
5]. The use of these methods is especially necessary for diagnostic models [
6,
7].
Machine learning, which is a sub-domain of artificial intelligence, can be divided into three categories: (1) supervised learning, (2) unsupervised learning, and (3) semi-supervised learning. Supervised machine learning algorithms utilize intensively statistical approaches to train a model on labeled data and make predictions about unknown (unlabeled) data. By contrast, unsupervised models deal with unlabeled data for training. Machine learning is the most ideal application for mass spectrometry data owing to its ability to cope with both linear and non-linear data. However, using machine learning for mass spectrometry applications is not a novel concept; an early study in the 1990s demonstrated the performance of artificial neural networks (ANNs) in classifying mass spectra [
8]. Afterward, many other supervised algorithms were applied to mass spectrometry data to improve the classification of mass spectra [
9]. In the twenty-first century, mass spectrometry diagnostic research using machine learning began to grow.
In the early 21st century, one of the most significant studies on the combination of machine learning and mass spectrometry data showed early promise for disease diagnosis [
10]. The ability of ANNs to measure protein expression levels in cancer patients was investigated. Authors obtained 98% accuracy using surface-enhanced laser desorption/ionization time of flight mass spectrometry technology [
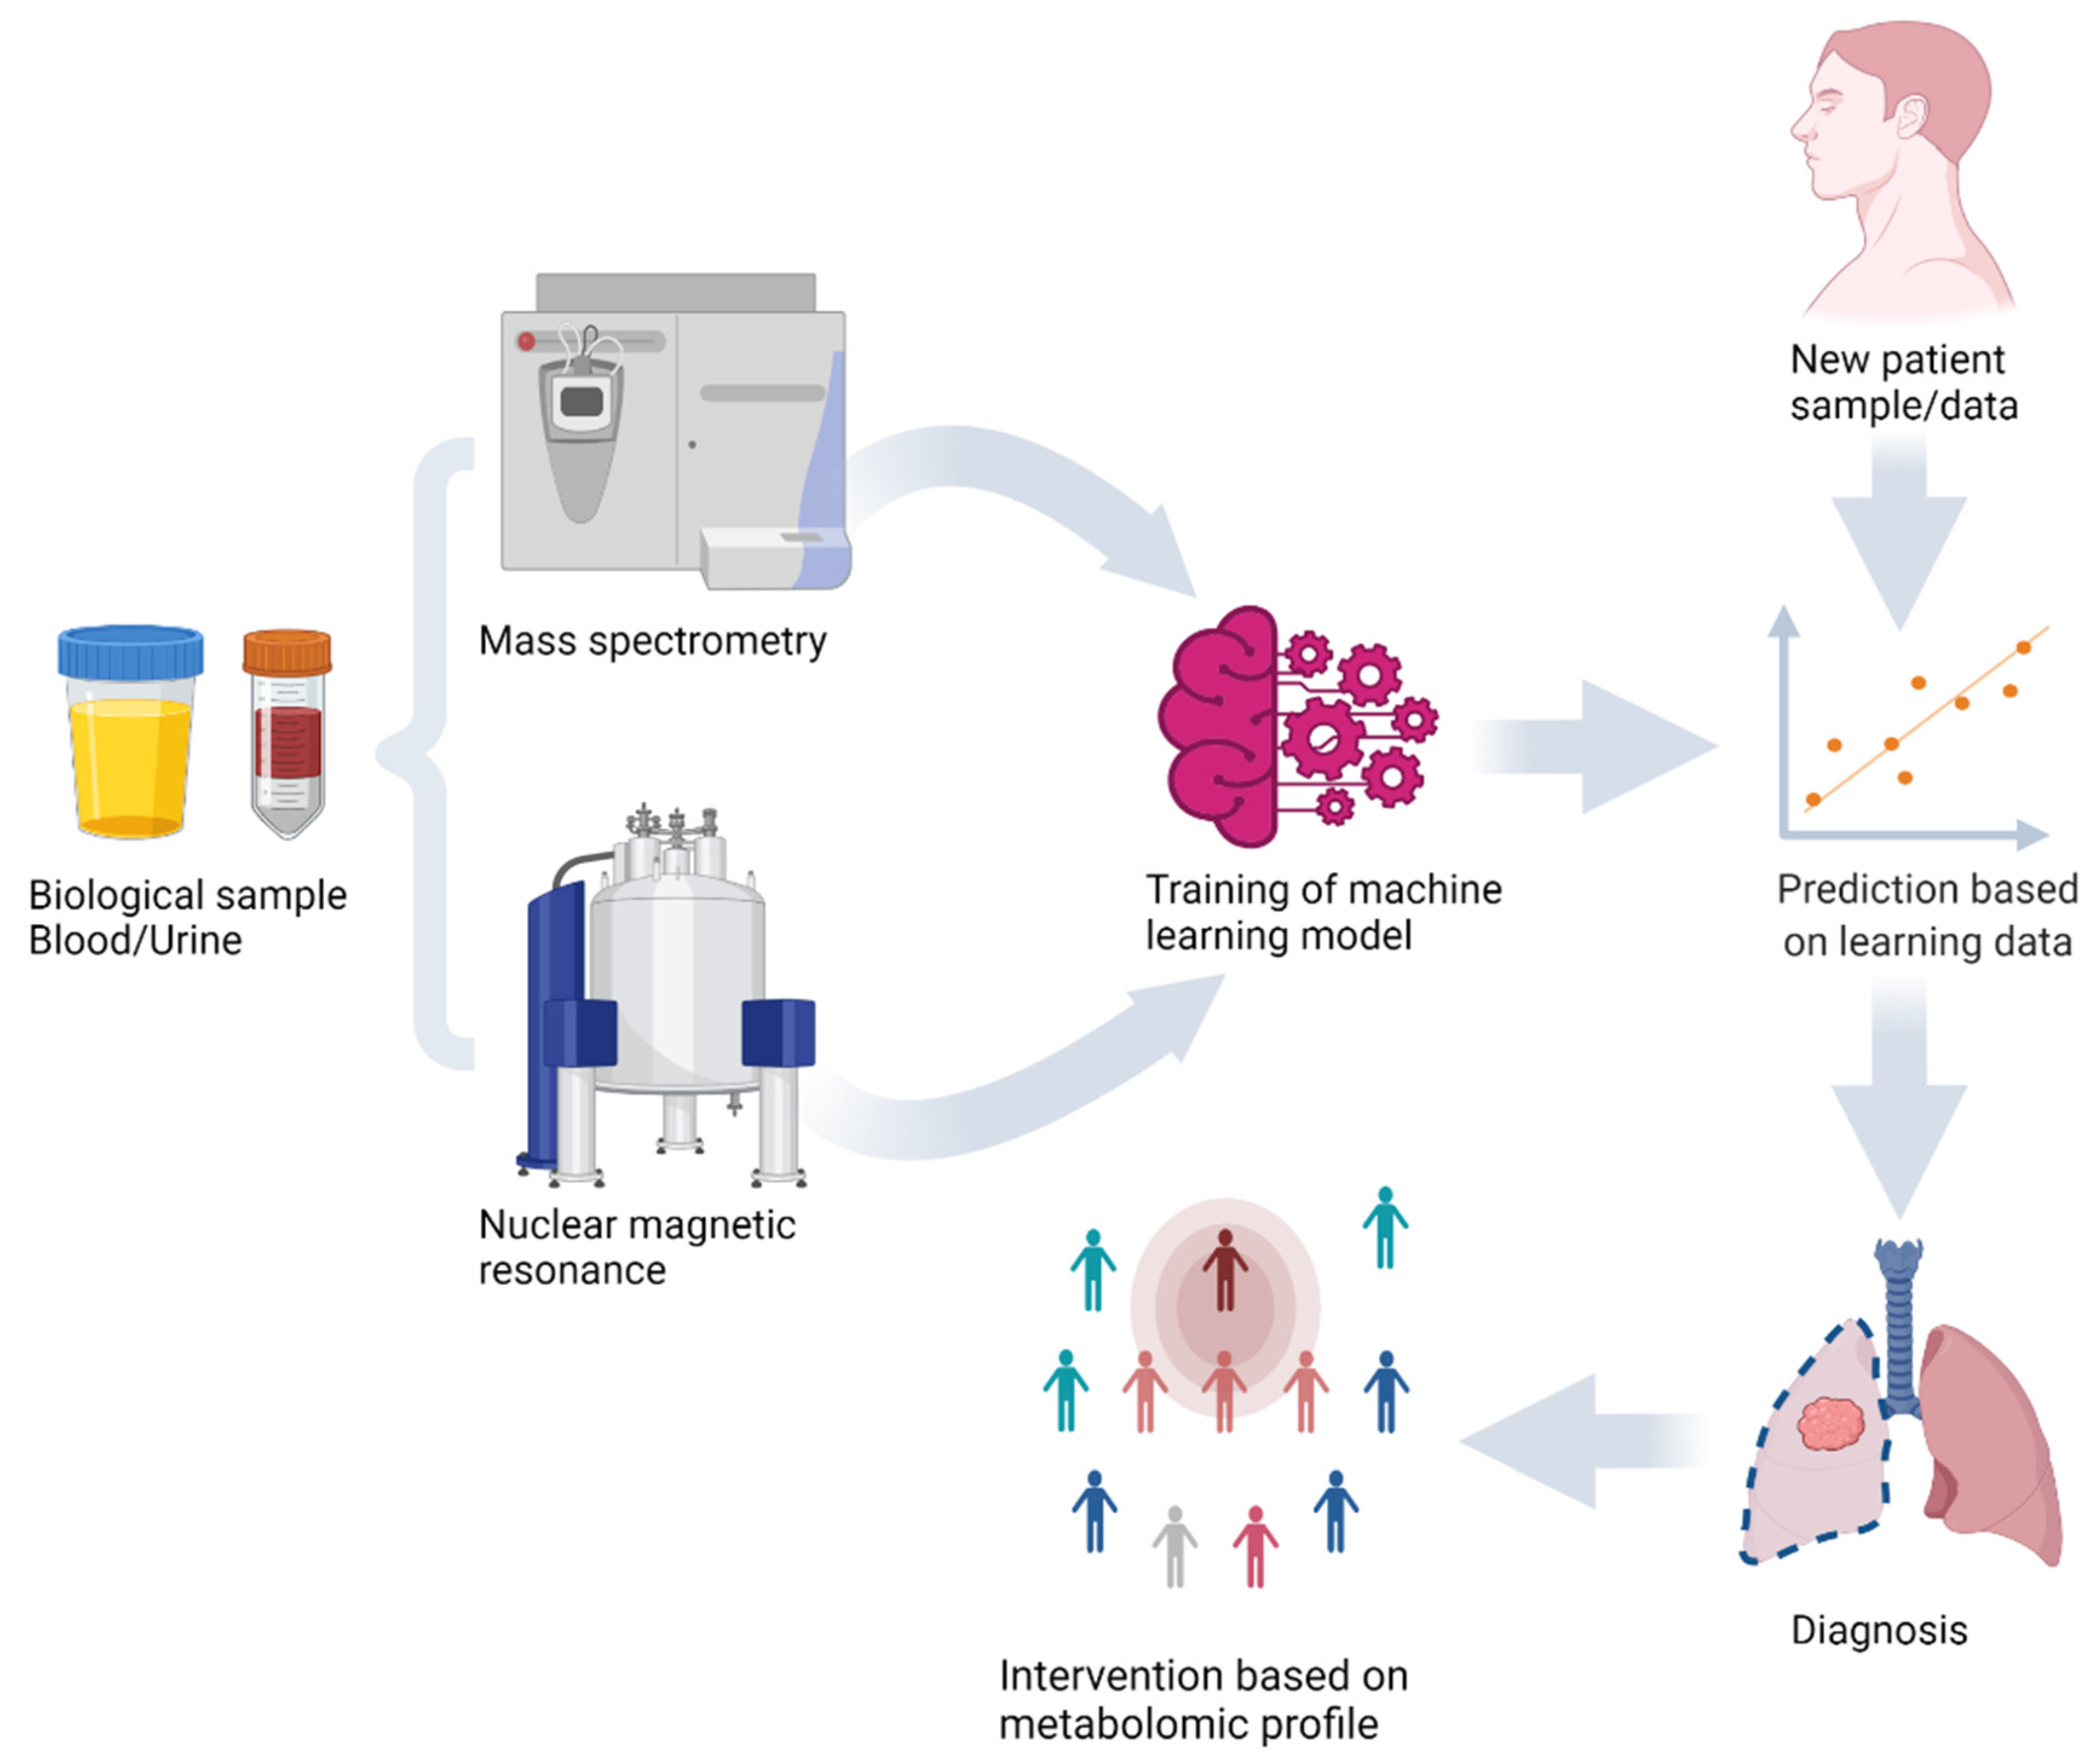
10]. Several other studies [
11,
12,
13] have demonstrated that machine learning algorithms can enable personalized therapy through the analysis of omics data (
Figure 1).
Today, machine learning excels at object classification, reasoning, and complicated decision making. DeepMind’s AlphaGo recently demonstrated stunning performance, proving that machine learning algorithms can manage complicated decisions when applied to real-world circumstances [
14]. For example, a study by Li et al. [
15] showed that machine learning can be used to detect focal nodular hyperplasia and atypical hepatocellular carcinoma from ultrasonic data. The authors found that machine learning algorithms achieved higher scores when the feature selection was assisted by radiologists, suggesting the use of the algorithm to support clinical decision making.
Two well-known machine learning techniques for biomarker discovery and patient classification are feature selection algorithms and supervised classifier algorithms. The dataset must first be subjected to a feature selection approach in order to eliminate redundant and irrelevant information, as well as noise and computational burden. Following the feature selection step, which identifies the most discriminating subsets of features, a classifier algorithm is used to learn patterns from samples and predict unknown samples, which serves as the diagnostic model of disease. A machine learning application using a stepwise process for biomarker discovery and diagnostic modeling is illustrated in
Figure 2.
In the following sections, we present and discuss the application of machine learning strategies to metabolomics data. In particular, we focus on widely used non-linear machine learning classifiers, such as ANN, random forest, and support vector machine (SVM) algorithms. Recently published reviews discussed the application of deep learning and non-linear machine learning algorithms mainly focusing on data processing of metabolomics data and on the identification of molecules including pathway analysis. Corsaro et al. focused their work more on a wide range of statistical approaches to elaborate NMR–metabolomics data from biomedical to food data, while Chen and coauthors discussed various strategies for expanding metabolite coverage, chemical derivatization, sample preparation, clinical disease markers, and machining learning for disease modeling [
16,
17]. However, the objective of the current review is to address the use of ML algorithms to obtain biomarkers and diagnostic models. A discussion on most recent tools for ML, on technical limitations and on future challenges is also reported. All the most recent strategies and approaches used to identify biomarkers and to classify patients based on metabolomic profiles of biofluids are reported and discussed.
1.2. Biomarkers
In biomedical science, there is a constant demand for new biomarkers to enable accurate diagnosis, therapy, and monitoring of the patient’s response. According to the National Institutes of Health Biomarkers Definitions Working Group, a biomarker is defined as “a characteristic that is objectively measured and evaluated as an indicator of normal biological processes, pathogenic processes, or pharmacologic responses to a therapeutic intervention” [
18]. Body fluids such as urine, saliva, sputum, and sweat may include biomarkers that could be detected and investigated for indicators of normal or abnormal conditions. Emerging omics technologies for the quantification of thousands of molecules, together with the sophisticated development of artificial intelligence algorithms, can now accelerate biomarker discovery.
1.3. Metabolomics
Metabolomics is the large-scale study of small molecules such as bile acids, carbohydrates, amino acids, lipids, and organic acids, which are commonly known as metabolites. Metabolomics is particularly suitable for the characterization of biological samples since small molecules reflect the disease phenotype. In addition, the high reproducibility reached using internal standards, normalization procedures, and new instrumentations has allowed for highly accurate simultaneous analyses of hundreds of molecules in large-scale studies [
19,
20]. This has brought new challenges to precision medicine but also new opportunities, especially in the application of algorithms for data analysis. It has already been demonstrated that the use of multiple biomarkers can improve the accuracy of diagnostic tests [
21]. The combination of metabolomics analysis and machine learning techniques could lead to the development of new approaches to perform more accurate and early diagnoses.
Metabolites can be used as biomarkers and to better understand the pathophysiology of many diseases [
22]. Studies have found altered metabolites levels in diseased states [
23,
24]. The integration of metabolomic technology with machine learning can have the potential to greatly enhance diagnosis, identify more effective therapy targets, and permit more precise disease outcome prediction. Significant advances in technology, including techniques such as mass spectrometry, chromatography, and nuclear magnetic resonance (NMR) spectroscopy, have boosted the efficiency and reliability of metabolic profiling to the point that it is now recognized as a critical platform in the medical sector [
25].
However, some limitations are present. Metabolomics data are characterized by intrinsic difficulties due to the nonlinear and linear correlations between metabolites, demanding constant algorithm refinement to obtain biological information. The tremendous complexity of metabolomics data (e.g., peak counts compared to samples), as well as missing values, batch effects during quantification, data noise production, and reproducibility, are all important issues. As a result, the metabolomics community is looking to machine learning approaches to overcome these obstacles [
26,
27].
2. Dimensionality and Features Selection
As previously discussed, metabolomics data include hundreds of features. Consequently, it is critical to reduce the dimensionality of the data to remove redundant and irrelevant information, improve the findings, and save computational time and resources. Three categories of feature selection algorithms are commonly found in the literature: filter, wrapper, and embedded methods [
28].
2.1. Filter Methods
Filter methods are algorithm-independent and operate on statistical methods (e.g., ANOVA or Chi-squared tests). The dataset’s properties, such as the distance between two classes, and its statistical methodologies, such as correlations and coefficients, guide the filter method’s selection of features [
29]. When compared to wrapper and embedded feature selection methods, filter techniques are faster and less computationally expensive. Nonetheless, filter feature selection methods have some disadvantages; for example, they do not take into account the interaction of features between them [
30].
2.2. Wrapper and Embedded Methods
Unlike filter methods, wrapper methods use a predefined algorithm. The wrapper method searches through the feature space and generates an optimal feature subset through a search methodology, which is evaluated by training and testing criteria using a classifier algorithm. This procedure is performed until the selected feature subset satisfies the criteria. Nevertheless, although the wrapper technique has several benefits over the filter method, it also has some drawbacks. It is computationally expensive and difficult to implement with high-dimensional data. Additionally, selecting the best feature based on its predefined algorithm may increase the risk of overfitting [
31]. Embedded feature selection differs from wrapper and filter methods in that the learner algorithm is not used by the filter method to select the best candidate, while it is used by the wrapper method to select the best features. However, unlike the filter and wrapper methods, the embedded system must carry out the process of learning and selecting features simultaneously, and thus selected features cannot be used by other classifiers [
32].
The ideal feature selection method to build diagnostic models and to identify relevant biomarkers should be able to select the most discriminative features while minimizing the number of irrelevant ones. Today, thanks to the great availability of computational power, the use of hybrid or ensemble methods is strongly suggested. The potential of this last approach has been already demonstrated by several studies [
33,
34].
3. Machine Learning Applications for Biomarker Discovery
The process of identifying biomarkers using machine learning is not a simple task, as it entails various difficulties due to the correlation of variables. Numerous studies have shown the potential of feature selection algorithms to unravel the presence of disease biomarkers using metabolomics data. For example, researchers used random forest with a feature importance function to identify the most discriminating features to be used as potential biomarkers [
35,
36]. They calculated the importance score assigned to features according to the Gini index formula, and then they used the top-ranking features to train the classifier model.
Another study investigated the possibility of identifying biomarkers for lung cancer disease from plasma samples analyzed using targeted metabolomics. Fast correlation-based selection algorithms identified five top-performing biomarkers that could discriminate between healthy and lung cancer patients [
37].
Bifarin et al. [
38] performed urine sample analysis using liquid chromatography–mass spectrometry and NMR and designed a biomarker panel of 10 metabolites for predicting renal cell carcinoma status, utilizing recursive feature selection and the PLS regression algorithm. Features were chosen based on how often they appeared in both feature selection algorithms, and finally 10 metabolites were selected for training the classification model.
In another study, the authors evaluated the performance of multivariate methods with unbiased variable selection (MUVR) assessing serum samples analyzed by high-resolution mass spectrometry-based metabolomics. The MUVR approach selected 13 metabolites that produced excellent results using random forest, SVM, and logistic regression methods and established a panel of candidate biomarkers that have the ability to distinguish gout from asymptomatic hyperuricemia [
39].
Furthermore, PLS-DA has been employed to determine the most discriminant lipids and metabolites to distinguish serum metabolomic and lipidomic profiles of patients with rheumatoid arthritis from healthy controls [
35]. The authors proposed 26 molecules as candidate biomarkers for rheumatoid arthritis, and the chosen features were evaluated using three classifier algorithms: logistic regression, random forest, and SVM. In another study, 16 metabolites were obtained using recursive feature elimination combined with SVM (SVM-RFE) to discriminate epithelial ovarian cancer and age-matched control women. Samples were then projected to oPLS-DA containing 16 metabolites, for which classifier achieved 96.8% accuracy [
40].
Table 1 presents recent diagnostic studies performed using metabolomics and machine learning.
In our experience, the selection of candidate biomarkers is the most important task, not only in developing a model for the diagnosis of a diseases, but also in describing the biological features that characterize that specific disorder. Although most of the reported research employed single strategies to select the most important variables, we think that the use of different algorithms to search for important markers might improve the machine learning performances. Another important factor that could affect the results is the number of selected biomarkers. In fact, the number of biomarkers could range from few to several tens. The definition of the optimal number of biomarkers is impossible to give, although we believe that a higher number of variables is always preferable. Indeed, metabolomics is particularly suitable to perform multi-analyte quantifications.
4. Application of Machine Learning for the Diagnosis of Diseases
Since the turn of the century, there has been a marked increase in the number of studies on metabolomics that have made use of machine learning techniques. Many studies have shown that machine learning can discriminate between healthy and disease, groups as well as identify important biomarkers for use in clinical decision making in a variety of settings [
42,
43]. The following sections present the most recent applications of supervised machine learning for the diagnosis of diseases.
4.1. Random Forest
Random forest is one of the most widely used supervised machine learning algorithms for mass spectrometry data due to its ability to cope with missing values, data noise, and reduced overfitting risk [
44]. Random forest is a classification and regression technique that includes ensemble method of decision trees to predict classes. The algorithm establishes the outcome based on the predictions of the decision trees. For classification tasks, the output of the random forest is the class selected by most trees, where each tree can be described as an uncorrelated model.
Decision trees contain nodes which are structured in a hierarchical fashion from the top to the bottom, connected with branches. A logical query is present in each node, and it is sent downward via one of the two branches (binary split): the node is then linked to another node, proceeding in this manner until reaching the final node, which will ultimately determine the classification. Usually two-third of original samples are used for training of trees, while the remaining samples are utilized to evaluate the tree performance, in what are called OOBs (out-of-bag samples). While building the classification model, the rate at which OOB samples are misclassified across several classes, or the OOB error, can be used to quantify the prediction performance of the model. In the regression task, mean-squared error (MSE) metric can be used to calculate the average distance between OOB predictions and the actual continuous response variable.
Random forest was shown to be more efficient at diagnosing colorectal cancer (with 100% accuracy) using metabolomics data as well as choosing putative biomarkers, stability, prediction ability, and overfitting in comparison with other classifier models [
45].
Melo et al. [
35] showed the resilience and superior performance of random forest in contrast to other classifier models to identify Zika virus by employing metabolomics data, demonstrating that random forest outperforms other classifier models. The model was developed using 42 features and evaluated to differentiate between groups. Lima et al. [
46] reported 97% accuracy in diagnosing paracoccidioidomycosis, using a combination of random forest and metabolomics data.
Recent research demonstrated the identification of malignant mesothelioma using random forest and metabolomics data with 92% accuracy in the validation dataset [
47]. Twenty dysregulated features that distinguished the malignant mesothelioma group from others were investigated. Among the 20 features, biliverdin and bilirubin were shown to have diagnostic potential. Additionally, random forest ranked biliverdin as the fourth-most significant variable in terms of overall significance, demonstrating how random forest can be used to select the best potential biomarkers. However, study limitations, like a smaller number of classes and sample numbers, were also reported in order to get an accurate image of the diagnostic model.
In a study focusing on diagnosing irritable bowel syndrome, Fukui et al. [
48] used a combination of logistic regression and random forest to obtain a better score in terms of sensitivity and specificity than if either of the algorithms had been performed individually. Other researchers trained four classifier models—a generalized linear regression model, PLS-DA, PCA linear discriminant analysis, and random forest—on metabolomics data [
49]. The models were trained using two approaches. In the first approach, the models were trained using all the metabolites. In the second approach, the models were trained with only pre-selected metabolites. Random forest with pre-selected variables was the most effective model, with an AUC score of 72%.
Thanks to the availability of several free tools (see chapter 6), today, RF is largely used for the classification of patients based on metabolomic profile.
4.2. Support Vector Machine
Today, SVM classification is the most frequently used machine learning technique in precision medicine. SVM is a model that uses “support vectors” to construct a decision boundary (hyper-plane) in a high-dimensional feature space. Support vectors are data points that are positioned close to the hyperplane, and hence aid to optimize the hyperplane itself [
50].
The objective of hyperplane is to maximize the distance between two classes, while placing as few data points as possible on the incorrect side of the decision boundary [
51,
52].
For a given training samples, a hyperplane is generated to maximize the distance, which can be mathematically defined as:
where
W is the weight matrix,
X represents the dataset and b is constant term.
SVM can also be used to classify non-linear data through process called kernel trick. There are several types of kernel trick used for different problems such as the polynomial kernel, Gaussian kernel, Gaussian radial basis function (RBF), Laplace RBF, sigmoid kernel, hyperbolic tangent kernel, linear splines kernel in one dimension. Nonetheless, radial basis function (RBF) is the first choice among other kernels and it is also widely used for non-linear task in metabolomics.
Regarding the application of SVM, in a recent study, the algorithm was used as a classifier alongside random forest and logistic regression to identify gout from asymptomatic hyperuricemia. The author stated that SVM outperformed the other classifiers in terms of getting a higher area under curve score in the validation set, while random forest achieved higher score in the training set but lower in the test set, indicating overfitting by the classifier model [
39].
Song et al. [
53] used SVM to identify an early biomarker of diabetic cognitive impairments in a mouse model. SVM achieved 91.66% accuracy in identifying two groups of samples based on seven features, and the authors proposed biomarkers that play a role in pathogenesis, such as the metabolism of nicotinamide and glutathione as well as tryptophan and sphingolipids. In another recent study, SVM was used to classify benzylpenicillin and multidrug resistance in
Staphylococcus aureus [
54]. The authors performed matrix-assisted laser desorption/ionization–time of flight mass spectrometry to identify signature profiles of antibiotic resistance in
S. aureus isolates. In terms of accuracy, specificity, and sensitivity, SVM showed better performance than random forest, multilayer neuron perceptron neural network, and naive Bayes classifiers.
Another interesting study used SVM with a radial basis function kernel and three feature selection algorithms for the diagnosis of intrauterine growth restriction [
55]. The authors performed mass spectrometry and NMR analysis on cord blood serum, obtaining an AUC of 91% with correlation-based feature selection (CFS). In terms of sensitivity and specificity, the CFS-selected features achieved lower scores than those of other feature selection algorithms. The final model was built using overlapping features—including creatinine, acetyl carnitine, butyryl carnitine, three lysophosphatidylcholines, and a phosphatidylcholine—of the three feature selection algorithms, obtaining an accuracy of 88%.
Zheng et al. [
56] used the least-squares SVM (LS-SVM) with three kernel functions—linear, polynomial, and radial basis—to diagnose major depression. In the test dataset, LS-SVM with the radial basis function outperformed the other kernel functions and achieved 96% accuracy. The classifier was built with glucose–lipid signaling features such as poly-unsaturated fatty acids, lipids with acetoacetate, very low-density lipids/low density lipids, lipids with N-acetyl, glucose, adipic acid, and sugars with amino acids.
As shown in all the reported research, SVM is a very attractive algorithm to perform precision medicine studies and to identify potential metabolic biomarkers. In addition, SVM is particularly suitable when the number of biological replicates or patients is low.
4.3. Artificial Neural Networks
Like the human brain, ANNs can handle complicated (non-linear) elements inside information and predict future situations. Humans learn by making modest alterations to synaptic interconnected neurons, whereas ANNs learn by adjusting the interconnections between the processing components that make up the network structure.
In 1943, McCulloch and Pitts [
57] defined artificial neurons as a mathematical function developed by mimicking natural biological neuron processes. The number of hidden layers and neurons in each layer is proportional to the situation’s complexity. A vector of predictor variables, each represented by a node, is sent to the input layer by the external system. These data are then multiplied by a set of weights in the first hidden layer (hence modified). To produce an axon-like output, these products are added together and fed through a non-linear transfer function (sigmoid, hyperbolic tangent). Weights are modified in ANN-supervised learning so that they approximately represent each target as a nonlinear function of the inputs. The ability to iterate an approximation without knowing the precise shape of the ideal nonlinear function beforehand is a significant benefit of ANN learning. During the supervised process of learning, a series of case pairings are given to the network, each of which consists of a collection of input values and a target value. The goal is to optimize the weight values in such a way as to create an output for each situation that is as near to the actual class. Predictions are then compared with actual class and inaccuracy assessed to a cost function.
In a metabolomics study performed on plasma samples from Parkinson’s disease patients, ANNs with 13 input layers, seven hidden layer units, and an output layer with a back propagation algorithm were used for the diagnosis [
58]. The neural network algorithm showed 97.14% accuracy in the detection of disease progression. However, one misdiagnosed case was also reported.
Another study profiled the metabolites in sputum from patients with lung cancer and age-matched smokers as a control using flow infusion electrospray ion mass spectrometry [
59]. The metabolomic profiles were then analyzed using ANNs in order to perform the diagnosis of lung cancer, specifically small-cell lung cancer (SCLC) and non-small-cell lung cancer (NSCLC). The authors were able to classify SCLC with 100% specificity and 80% sensitivity. Six metabolites were identified as candidate biomarkers between the NSCLC and SCLC groups: phenylacetic acid, L-fucose, caprylic acid, acetic acid, propionic acid, and glycine.
ANNs were also used to elaborate metabolite abundances obtained from dried blood spots analyzed with direct infusion mass spectrometry [
60]. The authors compared acute cerebral infarction and intracerebral hemorrhage. Using an external validation set, they achieved more than 70% accuracy in diagnosing intracerebral hemorrhage from acute cerebral infarction. They used ANNs with 11 units and 10 hidden layers of neurons, and they identified 11 significant metabolites using stepwise regression, on which the ANN model was trained.
Finally, ANNs were applied to predict a wide range of autoimmune diseases, including rheumatoid arthritis, thyroid disease, multiple sclerosis, vitiligo, psoriasis, and inflammatory bowel disease [
61]. The authors performed targeted metabolomic analysis of serum total fatty acids using gas chromatography mass spectrometry. The metabolomic results were analyzed with an ANN model using two hidden layers of neurons and 11 variables. The ANN model obtained 76.2% accuracy in the classification of the groups. The features that made a major contribution to the development of the classifier model were cis-11-eicosenoic, lauric acid, erucic acid, cis-10-pentadecanoic acid, stearic acid, myristic acid, heptadecanoic acid, and palmitic acid.
Table 2 presents recent studies performed using metabolomics and machine learning for the diagnosis of diseases.
Although today ANNs are widely used for classification purposes, non-linear models may not be appropriate for every type of research and the issue of interpretability of the models and of selected biomarkers remains a major challenge.
4.4. Other Supervised Learning Algorithms
Apart from random forest, SVM, and ANN, numerous other types of supervised algorithms have been applied to metabolomics data for the diagnosis of diseases. For example, Goutman et al. [
62] compared regularized logistic regression (RLR) with elastic net regularization to random forest and SVM for the prediction of amyotrophic lateral sclerosis. The authors performed untargeted plasma metabolomics, and the best classification performances were obtained with RLR, with an AUC score of 98%. Another study used metabolomics data to identify lung cancer using five supervised machine learning algorithms: ada boost, ANN, naive Bayes, random forest, and SVM. In the training set, artificial neural networks and naive Bayes achieved 100% accuracy, however ANN failed to get a comparable result in the validation set. While using naive Bayes, authors were able to distinguish between healthy and lung tumor patients with 100% accuracy [
37].
Huang et al. [
63] proposed an interesting use of pathway-based metabolomic features as robust biomarkers for breast cancer. The authors developed a new computational method that uses personalized pathway dysregulation scores for disease diagnosis and applied the method, in combination with CFS and classification methods, to predict breast cancer occurrence. Three classifiers were compared, and the model was tested using data from plasma samples, serum samples, and age-matched breast cancer RNA-seq. In terms of accuracy, the logistic regression surpassed both random forest and SVM, and it achieved an AUC score of 98%. In the next step, the logistic regression was applied to the three remaining test datasets (external to the model), which included the 20% hold-out plasma testing samples, the complete serum sample collection, and the RNA-seq data from the TCGA, obtaining AUC scores of 0.9230, 0.9950, and 0.9946, respectively. Recently, a study was carried out with utilization of k-nearest neighbors (KNN), random forest and SVM with linear and nonlinear kernel support vector machine to predict the status of renal cell carcinoma. K-nearest neighbors outperformed other classifiers with Mass spectrometry generated metabolomics data with 10 selected metabolites and achieved accuracy of 81% with 96% AUC value [
38].
Tong et al. [
64] evaluated the performances of linear and non-linear models (e.g., logistic regression and SVM) using a variety of parameters for diagnosing interstitial cystitis (IC). In terms of diagnosing IC, the logistic regression model surpassed SVM with an AUC score of 90%. SVM, however, outperformed the logistic regression model with a polynomial kernel degree of 5. This research had several drawbacks, including an imbalanced class dataset (43 IC patients and 16 healthy controls) as well as a limited number of samples.
The k-nearest neighbors machine learning algorithm can be considered as a read-across strategy [
65], as it requires experimental observations of only a few neighbors (similar patients metabolomics profile) of the query patients with unknown classification, in order to compute the endpoint of interest prediction. The KNN methodology is a “lazy” learning technique that classifies an instance based on the majority vote of the k-closest training examples (neighbors). EnaloskNN (developed by NovaMechanics as a new node in KNIME) [
66] predicts the unknown endpoint based on the k (k = 1, 2, 3, …)-nearest neighbor’s characteristics in the training set, in the features space R
n where n is the total number of patients metabolomics profile used for the prediction. Where the endpoint has a numeric class, the prediction is the distance weighted average of the endpoint of the selected neighbors. An optimal k-value is selected based on the calculated Euclidean distance between all instances and as weighting factors the inverse distances are used [
67,
68,
69]. In the case of a categorical endpoint each instance is assigned to the class indicated by the weighted majority vote of the k-closest neighbors. Another important aspect of the analysis—apart from the simple endpoint prediction—is the possibility to observe the groups of k-neighbors of each test patients, and therefore to specify and map the analogous space. This is a prerequisite of the read-across framework, and which can be used to support the justification of the read-across hypothesis. The EnaloskNN node has the benefit of providing not only the predictive results, but also the specific neighbors along with their Euclidian distances, as well allowing the visualization of the entire patient’s predictive space. Thus, this algorithm could be particularly suitable for the analysis of metabolomics data.
5. Factors Influencing Biomarker Selection through Machine Learning
Today, there are several concerns from metabolomic community about using machine learning algorithms, mainly due to the lack of explanation on the selection of biomarkers that a machine learning algorithm can provide. However, by using recently developed methods for interpretation of the ML model, for example LIME (local interpretable model-agnostic explanations) and Shapley additive explanation (SHAP) analysis, this issue can be partially addressed [
70,
71,
72]. In a clinical setting, there are several aspects that must be considered to analyze the performances of a potential biomarker such as its positive or negative prediction value, the ROC (receiver operating characteristic curve) and AUC values [
73]. Biomarker selection can be influenced by a variety of factors, like class imbalance, which can lead to uncorrected results. Fu. et al. proposed an approach based on the embedded feature selection method LASSO (least absolute shrinkage and selection operator), rather than using oversampling method to balance data [
74]. The LASSO method was used also by Fukui et al. [
48] on a class-imbalanced dataset composed of 85 patients with irritable bowels syndrome and 26 healthy subjects. Authors were able to obtain a high AUC score of 90% [
48}. Another very important issue in metabolomics data-based biomarker discovery is the presence of missing values that can occur due to technical reason or biological origin [
75,
76]. The batch effect also influences the selection of biomarkers and can affect the prediction of the classifier model, as addressed by Kehoe et al. [
77]. Indeed, the authors showed that when training and test data are collected within the same batch of analysis, the classification models are more accurate, but they failed to achieve the same level of accuracy with data generated in a different session of analysis. To address this problem, the authors developed a pipeline using an sSVM (sparse support vector machines) approach to sequester batch effects in the selection of biomarkers. Another restraint is the number of samples for training and validation of ML models. The metabolomics community has conducted a substantial number of studies using fewer than 100 samples [
49,
51,
53]. Models built and validated on a small number of cases can raise the possibility of misdiagnosing individuals. This can be reduced by using a nested cross-validation approach [
78].
6. Machine Learning Tools for Metabolomic Analysis
ML is advancing rapidly, and today offers a wide range of algorithms to handle challenging issues in the metabolomics field as well as to discover potential biomarkers. In the fields of NMR and mass spectrometry, ML has already been used to improve data-processing methods [
79]. Many of the ML-based tools such as WEKA, KNIME, Orange data mining [
80,
81,
82] have an intuitive user interface, no programming skills are required, and the tools are open source [
83]. Other popular open-source libraries include Scikit-learn (also known as sklearn) for implementation of machine learning algorithms in Python [
84], and TPOT, which provides an automated pipeline of machine learning algorithms that uses genetic programming stochastic global search approach to sort out top-performing ML models [
85]. Caret library in R provides a plethora of machine learning algorithms and feature selection methods [
86]. In addition, the use of ANN-based data analysis tools like PyTorch, Keras, and TensorFlow is growing in the metabolomics field [
85]. However recently developed automated machine learning and deep learning pipelines such as AutoGluon, AutoPrognosis, H
2O, PennAI have not yet been examined with metabolomics data [
87,
88]. In
Table 3 are reported the most widely used tools and libraries in metabolomics studies.
7. Limitations
Despite advancements in machine learning in the health care sector, several obstacles remain unresolved. The first difficulty in developing a machine learning-aided diagnostic model using metabolomics is determining the minimum necessary data to represent a specific biological problem/disease. It is not easy to generate datasets that properly represent the population’s variance while at the same time including a sufficient number of samples for training and evaluating a robust model on an independent dataset. In addition, the quality of metabolomics data may vary according to experimental procedure biases. Often, machine learning models are trained on a small number of datasets, resulting in model failure when applied to more diverse data. Another problem related to machine learning models is the reproducibility of findings and the capacity of the algorithms to explain the results; as datasets get larger, it becomes more difficult to explain the logic behind algorithmic decisions [
96]. Numerous algorithms are considered “black boxes” owing to the lack of information underpinning the mathematics of prediction. This aspect of machine learning is a major disadvantage when it comes to incorporating it into clinical decision making.
As shown in previous sections, several classifiers have been used for both biomarker discovery and the diagnosis of diseases. Random forest is usually less prone to overfitting, but it requires intensive computational power for huge datasets. On the other hands, SVM is very effective with high-dimensional data, but it can easily result in overfitting. Finally, ANNs are particularly suitable for huge datasets, but they are ineffective with small amounts of data.
8. Challenges in the Implementation of Metabolomics–AI Systems
The introduction of artificial intelligence in the clinic is a challenge that can be overcome only through the strong collaboration between clinicians, computational and laboratory scientists. In fact, artificial intelligence needs the access to large cohorts of patients, but also the biomarkers or the combination of markers should be measurable in a reproducible and easy manner. Lastly, the computational algorithms should be engineered in a user-friendly manner, especially in the setting of a busy practice.
The performances of a metabolomics–AI system strongly depend on the patients used to develop the models. The provenance of source data, such as patients from a different health system or a population different from the one used to develop AI models, can affect the diagnostic performances. To this aim, the use of large-scale multi-center cohorts can reduce the risk of using a poorly described panel of patients for the development of the AI model. In addition, all the clinical data should be considered while building the model. Another important aspect is to make the results clinically meaningful. The selection of appropriate patient-oriented endpoints and metrics to assess the performances of the model should be performed. This phase should be always developed focusing on the outcomes reported by clinicians. Knowing why an algorithm predicts a decision is very important for clinicians but also for patients, especially in case there is disagreement between human and AI prediction.
The challenge of delivering personalized care is also strictly correlated to the employment of adequate and reliable measurement of biomarkers. The analytical reproducibility is one of the most important issues for high-throughput technologies used for metabolomics analysis. This is particularly important when hundreds of samples are analyzed and elaborated using artificial intelligence algorithms. In fact, the quantification of molecules is affected by several factors such as the sample preparation, laboratory operators, the instrumentation used for the analysis, and biological variables. Although the use of spiked standards can reduce the sample preparation and instrumental variability, the reproducibility of untargeted metabolomic approaches is still limited, especially when different instruments are used. On the other hands, targeted metabolomics is characterized by a higher reproducibility, but at the same time the number of molecules that can be quantified is reduced, thus limiting its use in combination with AI algorithms.
Finally, the AI structure should be engineered in a manner that facilitates the integration of the AI models into the clinical decision, avoiding the use of stand-alone decision points. In addition, systems that require manual work to enter data should be avoided.
It is thus clear that the development of metabolomics–AI approaches for precision medicine and diagnostics is still far from the routine clinical use, although every year tens of research works on the development and application of pipelines that use statistical models for the diagnosis of diseases are published.
9. Conclusions
Artificial intelligence is a widely used approach in metabolomics and other high-throughput technologies, especially for performing early diagnosis. Recent studies have established several strategies for disease classification based on metabolomics profiles, demonstrating the potency of machine learning in the medical science field. Nonetheless, there are considerable drawbacks to overcome yet, including the interpretation of machine learning models and the development of robust models to account for disease and population heterogeneity. In fact, to date, with a given, specific dataset there is no gold standard for the selection of the optimal algorithm to be used. In fact, minimum changes in the dataset structure may result in significantly diverse outcomes as a function of the chosen algorithm. Further research should be conducted to better understand how algorithms interact with the characteristics of datasets.
Author Contributions
Conceptualization, M.M.; methodology, M.M., E.B. and S.K.; writing—original draft preparation, E.B., M.M. and S.K.; writing—review and editing, E.B., M.M., S.K., A.G., A.S., F.D., M.F. and A.A. All authors have read and agreed to the published version of the manuscript.
Funding
This study was (partially) funded by the AGING Project–Department of Excellence–DIMET, Università del Piemonte Orientale, MIUR ITALY, by AIRC 5 × 1000 UniCanVax grant n. 22757, by Regione Piemonte FSC Azione 173 INFRA-P2 COVID, MS4CoV cod. 377-1 and TECHNOMED-HUB cod. 378-48, from INTEGRATED/0918/0043 project which was co-funded by the European Regional Development Fund and the Republic of Cyprus through the Research and Innovation Foundation and from H2020-EU.1.3.3. by the NANOGENTOOLS project, contract No. 691095.
Conflicts of Interest
The authors declare no conflict of interest. Antreas Afantitis is owner and employer of NovaMechanics Ltd.
References
- Fan, J.; Han, F.; Liu, H. Challenges of Big Data analysis. Natl. Sci. Rev. 2014, 1, 293–314. [Google Scholar] [CrossRef] [PubMed]
- Schadt, E.E.; Linderman, M.D.; Sorenson, J.; Lee, L.; Nolan, G.P. Computational solutions to large-scale data management and analysis. Nat. Rev. Genet. 2010, 11, 647–657. [Google Scholar] [CrossRef]
- Subramanian, I.; Verma, S.; Kumar, S.; Jere, A.; Anamika, K. Multi-omics Data Integration, Interpretation, and Its Application. Bioinform. Biol. Insights 2020, 14, 1177932219899051. [Google Scholar] [CrossRef]
- Manfredi, M.; Brandi, J.; Di Carlo, C.; Vita Vanella, V.; Barberis, E.; Marengo, E.; Patrone, M.; Cecconi, D. Mining cancer biology through bioinformatic analysis of proteomic data. Expert Rev. Proteom. 2019, 16, 733–747. [Google Scholar] [CrossRef] [PubMed]
- Manfredi, M.; Robotti, E.; Bearman, G.; France, F.; Barberis, E.; Shor, P.; Marengo, E. Direct Analysis in Real Time Mass Spectrometry for the Nondestructive Investigation of Conservation Treatments of Cultural Heritage. J. Anal. Methods Chem. 2016, 2016, 6853591. [Google Scholar] [CrossRef] [PubMed]
- Li, C.; Gao, Z.; Su, B.; Xu, G.; Lin, X. Data analysis methods for defining biomarkers from omics data. Anal. Bioanal. Chem. 2022, 414, 235–250. [Google Scholar] [CrossRef]
- Qiu, M.; Fu, Q.; Jiang, C.; Liu, D. Machine Learning Based Network Analysis Determined Clinically Relevant miRNAs in Breast Cancer. Front. Genet. 2020, 11, 615864. [Google Scholar] [CrossRef]
- Curry, B.; Rumelhart, D.E. Msnet: A Neural Network which Classifies Mass Spectra. Tetrahedron Comput. Methodol. 1990, 3, 213–237. [Google Scholar] [CrossRef]
- Broadhurst, D.I.; Goodacre, R.; Jones, A.; Rowland, J.J.; Kell, D.B. Genetic algorithms as a method for variable selection in multiple linear regression and partial least squares regression, with applications to pyrolysis mass spectrometry. Anal. Chim. Acta 1997, 348, 71–86. [Google Scholar] [CrossRef]
- Ball, G.; Mian, S.; Holding, F.; Allibone, R.; Lowe, J.; Ali, S.; Li, G.; McCardle, S.; Ellis, I.; Creaser, C.; et al. An integrated approach utilizing artificial neural networks and SELDI mass spectrometry for the classification of human tumours and rapid identification of potential biomarkers. Bioinformatics 2002, 18, 395–404. [Google Scholar] [CrossRef]
- Waddington, K.E.; Papadaki, A.; Coelewij, L.; Adriani, M.; Nytrova, P.; Kubala Havrdova, E.; Fogdell-Hahn, A.; Farrell, R.; Dönnes, P.; Pineda-Torra, I. Using serum metabolomics to predict development of anti-drug antibodies in multiple sclerosis patients treated with IFNβ. Front. Immunol. 2020, 11, 1527. [Google Scholar] [CrossRef] [PubMed]
- Tao, W.; Concepcion, A.N.; Vianen, M.; Marijnissen, A.C.; Lafeber, F.P.; Radstake, T.R.; Pandit, A. Multiomics and machine learning accurately predict clinical response to adalimumab and etanercept therapy in patients with rheumatoid arthritis. Arthritis Rheumatol. 2021, 73, 212–222. [Google Scholar] [CrossRef] [PubMed]
- McKinney, E.F.; Lyons, P.A.; Carr, E.J.; Hollis, J.L.; Jayne, D.R.; Willcocks, L.C.; Koukoulaki, M.; Brazma, A.; Jovanovic, V.; Kemeny, D.M. A CD8+ T cell transcription signature predicts prognosis in autoimmune disease. Nat. Med. 2010, 16, 586–591. [Google Scholar] [CrossRef]
- Silver, D.; Huang, A.; Maddison, C.J.; Guez, A.; Sifre, L.; van den Driessche, G.; Schrittwieser, J.; Antonoglou, I.; Panneershelvam, V.; Lanctot, M.; et al. Mastering the game of Go with deep neural networks and tree search. Nature 2016, 529, 484–489. [Google Scholar] [CrossRef] [PubMed]
- Li, W.; Wang, W.; Liu, G.-J.; Chen, L.-D.; Wang, Z.; Huang, Y.; Liu, J.-Y.; Xie, X.-Y.; Lu, M.-D. Differentiation of Atypical Hepatocellular Carcinoma from Focal Nodular Hyperplasia: Diagnostic Performance of Contrast-enhanced US and Microflow Imaging. Radiology 2015, 275, 870–879. [Google Scholar] [CrossRef] [PubMed]
- Chen, C.-J.; Lee, D.-Y.; Yu, J.; Lin, Y.-N.; Lin, T.-M. Recent advances in LC-MS-based metabolomics for clinical biomarker discovery. Mass Spectrom. Rev. 2022, e21785. [Google Scholar] [CrossRef]
- Corsaro, C.; Vasi, S.; Neri, F.; Mezzasalma, A.M.; Neri, G.; Fazio, E. NMR in Metabolomics: From Conventional Statistics to Machine Learning and Neural Network Approaches. Appl. Sci. 2022, 12, 2824. [Google Scholar] [CrossRef]
- Biomarkers Definitions Working Group. Biomarkers and surrogate endpoints: Preferred definitions and conceptual framework. Clin. Pharmacol. Ther. 2001, 69, 89–95. [Google Scholar] [CrossRef]
- Barberis, E.; Timo, S.; Amede, E.; Vanella, V.V.; Puricelli, C.; Cappellano, G.; Raineri, D.; Cittone, M.G.; Rizzi, E.; Pedrinelli, A.R.; et al. Large-Scale Plasma Analysis Revealed New Mechanisms and Molecules Associated with the Host Response to SARS-CoV-2. Int. J. Mol. Sci. 2020, 21, 8623. [Google Scholar] [CrossRef]
- Barberis, E.; Amede, E.; Tavecchia, M.; Marengo, E.; Cittone, M.G.; Rizzi, E.; Pedrinelli, A.R.; Tonello, S.; Minisini, R.; Pirisi, M.; et al. Understanding protection from SARS-CoV-2 using metabolomics. Sci. Rep. 2021, 11, 13796. [Google Scholar] [CrossRef]
- Zethelius, B.; Berglund, L.; Sundström, J.; Ingelsson, E.; Basu, S.; Larsson, A.; Venge, P.; Ärnlöv, J. Use of Multiple Biomarkers to Improve the Prediction of Death from Cardiovascular Causes. N. Engl. J. Med. 2008, 358, 2107–2116. [Google Scholar] [CrossRef]
- Hu, T.; Oksanen, K.; Zhang, W.; Randell, E.; Furey, A.; Sun, G.; Zhai, G. An evolutionary learning and network approach to identifying key metabolites for osteoarthritis. PLoS Comput. Biol. 2018, 14, e1005986. [Google Scholar] [CrossRef]
- Sullivan, L.B.; Gui, D.Y.; Heiden, M.G.V. Altered metabolite levels in cancer: Implications for tumour biology and cancer therapy. Nat. Rev. Cancer 2016, 16, 680–693. [Google Scholar] [CrossRef]
- Sonninen, T.-M.; Hämäläinen, R.H.; Koskuvi, M.; Oksanen, M.; Shakirzyanova, A.; Wojciechowski, S.; Puttonen, K.; Naumenko, N.; Goldsteins, G.; Laham-Karam, N.; et al. Metabolic alterations in Parkinson’s disease astrocytes. Sci. Rep. 2020, 10, 14474. [Google Scholar] [CrossRef]
- Zhang, A.; Sun, H.; Yan, G.; Wang, P.; Han, Y.; Wang, X. Metabolomics in diagnosis and biomarker discovery of colorectal cancer. Cancer Lett. 2014, 345, 17–20. [Google Scholar] [CrossRef]
- Do, K.T.; Wahl, S.; Raffler, J.; Molnos, S.; Laimighofer, M.; Adamski, J.; Suhre, K.; Strauch, K.; Peters, A.; Gieger, C.; et al. Characterization of missing values in untargeted MS-based metabolomics data and evaluation of missing data handling strategies. Metabolomics 2018, 14, 128. [Google Scholar] [CrossRef]
- Han, S.; Huang, J.; Foppiano, F.; Prehn, C.; Adamski, J.; Suhre, K.; Li, Y.; Matullo, G.; Schliess, F.; Gieger, C.; et al. TIGER: Technical variation elimination for metabolomics data using ensemble learning architecture. Brief. Bioinform. 2022, 23, bbab535. [Google Scholar] [CrossRef]
- Guyon, I.; Elisseeff, A. An Introduction to Variable and Feature Selection. J. Mach. Learn. Res. 2003, 3, 1157–1182. [Google Scholar]
- Sánchez-Maroño, N.; Alonso-Betanzos, A.; Tombilla-Sanromán, M. Filter Methods for Feature Selection—A Comparative Study. In Intelligent Data Engineering and Automated Learning—IDEAL 2007; Yin, H., Tino, P., Corchado, E., Byrne, W., Yao, X., Eds.; Springer: Berlin/Heidelberg, Germany, 2007; pp. 178–187. [Google Scholar]
- Biswas, S.; Bordoloi, M.; Purkayastha, B. Review on Feature Selection and Classification using Neuro-Fuzzy Approaches. Int. J. Appl. Evol. Comput. 2016, 7, 28–44. [Google Scholar] [CrossRef]
- Liu, C.; Wang, W.; Zhao, Q.; Shen, X.; Konan, M. A new feature selection method based on a validity index of feature subset. Pattern Recognit. Lett. 2017, 92, 1–8. [Google Scholar] [CrossRef]
- Weston, J.; Mukherjee, S.; Chapelle, O.; Pontil, M.; Poggio, T.; Vapnik, V. Feature selection for svms. In Advances in Neural Information Processing Systems; MIT Press: Cambridge, MA, USA, 2000; Volume 13, pp. 668–674. [Google Scholar]
- Shahrjooihaghighi, A.; Frigui, H.; Zhang, X.; Wei, X.; Shi, B.; Trabelsi, A. An Ensemble Feature Selection Method for Biomarker Discovery. In Proceedings of the 2017 IEEE International Symposium on Signal Processing and Information Technology (ISSPIT), Bilbao, Spain, 18–20 December 2017; pp. 416–421. [Google Scholar]
- Bolón-Canedo, V.; Sánchez-Maroño, N.; Alonso-Betanzos, A. An ensemble of filters and classifiers for microarray data classification. Pattern Recognit. 2012, 45, 531–539. [Google Scholar] [CrossRef]
- Melo, C.F.O.R.; Navarro, L.C.; de Oliveira, D.N.; Guerreiro, T.M.; Lima, E.d.O.; Delafiori, J.; Dabaja, M.Z.; Ribeiro, M.d.S.; de Menezes, M.; Rodrigues, R.G.M.; et al. A Machine Learning Application Based in Random Forest for Integrating Mass Spectrometry-Based Metabolomic Data: A Simple Screening Method for Patients With Zika Virus. Front. Bioeng. Biotechnol. 2018, 6, 31. [Google Scholar] [CrossRef] [PubMed]
- Dias-Audibert, F.L.; Navarro, L.C.; de Oliveira, D.N.; Delafiori, J.; Melo, C.F.O.R.; Guerreiro, T.M.; Rosa, F.T.; Petenuci, D.L.; Watanabe, M.A.E.; Velloso, L.A.; et al. Combining Machine Learning and Metabolomics to Identify Weight Gain Biomarkers. Front. Bioeng. Biotechnol. 2020, 8, 6. [Google Scholar] [CrossRef] [PubMed]
- Xie, Y.; Meng, W.-Y.; Li, R.-Z.; Wang, Y.-W.; Qian, X.; Chan, C.; Yu, Z.-F.; Fan, X.-X.; Pan, H.-D.; Xie, C.; et al. Early lung cancer diagnostic biomarker discovery by machine learning methods. Transl. Oncol. 2021, 14, 100907. [Google Scholar] [CrossRef] [PubMed]
- Bifarin, O.O.; Gaul, D.A.; Sah, S.; Arnold, R.S.; Ogan, K.; Master, V.A.; Roberts, D.L.; Bergquist, S.H.; Petros, J.A.; Fernández, F.M.; et al. Machine Learning-Enabled Renal Cell Carcinoma Status Prediction Using Multiplatform Urine-Based Metabolomics. J. Proteome Res. 2021, 20, 3629–3641. [Google Scholar] [CrossRef]
- Shen, X.; Wang, C.; Liang, N.; Liu, Z.; Li, X.; Zhu, Z.-J.; Merriman, T.R.; Dalbeth, N.; Terkeltaub, R.; Li, C.; et al. Serum Metabolomics Identifies Dysregulated Pathways and Potential Metabolic Biomarkers for Hyperuricemia and Gout. Arthritis Rheumatol. 2021, 73, 1738–1748. [Google Scholar] [CrossRef]
- Luan, H.; Gu, W.; Li, H.; Wang, Z.; Lu, L.; Ke, M.; Lu, J.; Chen, W.; Lan, Z.; Xiao, Y.; et al. Serum metabolomic and lipidomic profiling identifies diagnostic biomarkers for seropositive and seronegative rheumatoid arthritis patients. J. Transl. Med. 2021, 19, 500. [Google Scholar] [CrossRef]
- Gaul, D.A.; Mezencev, R.; Long, T.Q.; Jones, C.M.; Benigno, B.B.; Gray, A.; Fernández, F.M.; McDonald, J.F. Highly-accurate metabolomic detection of early-stage ovarian cancer. Sci. Rep. 2015, 5, 16351. [Google Scholar] [CrossRef]
- Haq, A.U.; Li, J.P.; Memon, M.H.; Nazir, S.; Sun, R. A Hybrid Intelligent System Framework for the Prediction of Heart Disease Using Machine Learning Algorithms. Mob. Inf. Syst. 2018, 2018, 3860146. [Google Scholar] [CrossRef]
- Mishra, V.; Singh, Y.; Rath, S.K. Breast Cancer detection from Thermograms Using Feature Extraction and Machine Learning Techniques. In Proceedings of the 2019 IEEE 5th International Conference for Convergence in Technology (I2CT), Bombay, India, 29–31 March 2019. [Google Scholar]
- Amaratunga, D.; Cabrera, J.; Lee, Y.-S. Enriched random forests. Bioinformatics 2008, 24, 2010–2014. [Google Scholar] [CrossRef]
- Chen, T.; Cao, Y.; Zhang, Y.; Liu, J.; Bao, Y.; Wang, C.; Jia, W.; Zhao, A. Random Forest in Clinical Metabolomics for Phenotypic Discrimination and Biomarker Selection. Evid.-Based Complementary Altern. Med. 2013, 2013, 298183. [Google Scholar] [CrossRef]
- Lima, E.d.O.; Navarro, L.C.; Morishita, K.N.; Kamikawa, C.M.; Rodrigues, R.G.M.; Dabaja, M.Z.; de Oliveira, D.N.; Delafiori, J.; Dias-Audibert, F.L.; Ribeiro, M.d.S.; et al. Metabolomics and Machine Learning Approaches Combined in Pursuit for More Accurate Paracoccidioidomycosis Diagnoses. mSystems 2020, 5, e00258-20. [Google Scholar] [CrossRef] [PubMed]
- Li, N.; Yang, C.; Zhou, S.; Song, S.; Jin, Y.; Wang, D.; Liu, J.; Gao, Y.; Yang, H.; Mao, W.; et al. Combination of Plasma-Based Metabolomics and Machine Learning Algorithm Provides a Novel Diagnostic Strategy for Malignant Mesothelioma. Diagnostics 2021, 11, 1281. [Google Scholar] [CrossRef]
- Fukui, H.; Nishida, A.; Matsuda, S.; Kira, F.; Watanabe, S.; Kuriyama, M.; Kawakami, K.; Aikawa, Y.; Oda, N.; Arai, K.; et al. Usefulness of Machine Learning-Based Gut Microbiome Analysis for Identifying Patients with Irritable Bowels Syndrome. J. Clin. Med. 2020, 9, 2403. [Google Scholar] [CrossRef] [PubMed]
- Kasakin, M.F.; Rogachev, A.D.; Predtechenskaya, E.V.; Zaigraev, V.J.; Koval, V.V.; Pokrovsky, A.G. Targeted metabolomics approach for identification of relapsing–remitting multiple sclerosis markers and evaluation of diagnostic models. MedChemComm 2019, 10, 1803–1809. [Google Scholar] [CrossRef]
- Scölkopf, B.; Smola, A.J. Learning with Kernels: Support Vector Machines, Regularization, Optimization, and Beyond; The MIT Press: Cambridge, MA, USA, 2018. [Google Scholar]
- Huang, X.; Xu, Q.-S.; Yun, Y.-H.; Huang, J.-H.; Liang, Y.-Z. Weighted variable kernel support vector machine classifier for metabolomics data analysis. Chemom. Intell. Lab. Syst. 2015, 146, 365–370. [Google Scholar] [CrossRef]
- Mendez, K.M.; Reinke, S.N.; Broadhurst, D.I. A comparative evaluation of the generalised predictive ability of eight machine learning algorithms across ten clinical metabolomics data sets for binary classification. Metabolomics 2019, 15, 150. [Google Scholar] [CrossRef] [PubMed]
- Song, L.; Zhuang, P.; Lin, M.; Kang, M.; Liu, H.; Zhang, Y.; Yang, Z.; Chen, Y.; Zhang, Y. Urine Metabonomics Reveals Early Biomarkers in Diabetic Cognitive Dysfunction. J. Proteome Res. 2017, 16, 3180–3189. [Google Scholar] [CrossRef] [PubMed]
- Esener, N.; Maciel-Guerra, A.; Giebel, K.; Lea, D.; Green, M.J.; Bradley, A.J.; Dottorini, T. Mass spectrometry and machine learning for the accurate diagnosis of benzylpenicillin and multidrug resistance of Staphylococcus aureus in bovine mastitis. PLoS Comput. Biol. 2021, 17, e1009108. [Google Scholar] [CrossRef] [PubMed]
- Bahado-Singh, R.O.; Yilmaz, A.; Bisgin, H.; Turkoglu, O.; Kumar, P.; Sherman, E.; Mrazik, A.; Odibo, A.; Graham, S.F. Artificial intelligence and the analysis of multi-platform metabolomics data for the detection of intrauterine growth restriction. PLoS ONE 2019, 14, e0214121. [Google Scholar] [CrossRef]
- Zheng, H.; Zheng, P.; Zhao, L.; Jia, J.; Tang, S.; Xu, P.; Xie, P.; Gao, H. Predictive diagnosis of major depression using NMR-based metabolomics and least-squares support vector machine. Clin. Chim. Acta 2017, 464, 223–227. [Google Scholar] [CrossRef] [PubMed]
- McCulloch, W.S.; Pitts, W. A logical calculus of the ideas immanent in nervous activity. 1943. Bull. Math. Biol. 1990, 52, 99–115; discussion 73–97. [Google Scholar] [CrossRef]
- Ahmed, S.S.S.J.; Santosh, W.; Kumar, S.; Christlet, H.T.T. Metabolic profiling of Parkinson’s disease: Evidence of biomarker from gene expression analysis and rapid neural network detection. J. Biomed. Sci. 2009, 16, 63. [Google Scholar] [CrossRef] [PubMed]
- O’Shea, K.; Cameron, S.J.S.; Lewis, K.E.; Lu, C.; Mur, L.A.J. Metabolomic-based biomarker discovery for non-invasive lung cancer screening: A case study. Biochim. Biophys. Acta BBA Lipids Lipid Metab. 2016, 1860, 2682–2687. [Google Scholar] [CrossRef] [PubMed]
- Zhang, X.; Li, Y.; Liang, Y.; Sun, P.; Wu, X.; Song, J.; Sun, X.; Hong, M.; Gao, P.; Deng, D. Distinguishing Intracerebral Hemorrhage from Acute Cerebral Infarction through Metabolomics. Rev. Investig. Clin. Organo Hosp. Enferm. Nutr. 2017, 69, 319–328. [Google Scholar] [CrossRef] [PubMed]
- Tsoukalas, D.; Fragoulakis, V.; Sarandi, E.; Docea, A.O.; Papakonstaninou, E.; Tsilimidos, G.; Anamaterou, C.; Fragkiadaki, P.; Aschner, M.; Tsatsakis, A.; et al. Targeted Metabolomic Analysis of Serum Fatty Acids for the Prediction of Autoimmune Diseases. Front. Mol. Biosci. 2019, 6, 120. [Google Scholar] [CrossRef]
- Goutman, S.A.; Boss, J.; Guo, K.; Alakwaa, F.M.; Patterson, A.; Kim, S.; Savelieff, M.G.; Hur, J.; Feldman, E.L. Untargeted metabolomics yields insight into ALS disease mechanisms. J. Neurol. Neurosurg. Psychiatry 2020, 91, 1329–1338. [Google Scholar] [CrossRef]
- Huang, S.; Chong, N.; Lewis, N.E.; Jia, W.; Xie, G.; Garmire, L.X. Novel personalized pathway-based metabolomics models reveal key metabolic pathways for breast cancer diagnosis. Genome Med. 2016, 8, 34. [Google Scholar] [CrossRef] [PubMed]
- Tong, F.; Shahid, M.; Jin, P.; Jung, S.; Kim, W.H.; Kim, J. Classification of the urinary metabolome using machine learning and potential applications to diagnosing interstitial cystitis. Bladder 2020, 7, e43. [Google Scholar] [CrossRef] [PubMed]
- European Chemicals Agency. How to Use and Report (Q)SARs. Practical Guide 5; European Chemicals Agency: Helsinki, Finland, 2016. [Google Scholar]
- NovaMechanics Ltd. Enalos+ KNIME Nodes. Available online: https://enalosplus.novamechanics.com/ (accessed on 24 January 2018).
- Varsou, D.-D.; Ellis, L.-J.A.; Afantitis, A.; Melagraki, G.; Lynch, I. Ecotoxicological read-across models for predicting acute toxicity of freshly dispersed versus medium-aged NMs to Daphnia magna. Chemosphere 2021, 285, 131452. [Google Scholar] [CrossRef]
- Papadiamantis, A.G.; Afantitis, A.; Tsoumanis, A.; Valsami-Jones, E.; Lynch, I.; Melagraki, G. Computational enrichment of physicochemical data for the development of a ζ-potential read-across predictive model with Isalos Analytics Platform. NanoImpact 2021, 22, 100308. [Google Scholar] [CrossRef]
- Witten, I.H.; Eibe, F.; Mark, A.H. Data Mining: Practical Machine Learning Tools and Techniques; Morgan Kaufmann: Burlington, MA, USA, 2016. [Google Scholar] [CrossRef]
- Ribeiro, M.T.; Singh, S.; Guestrin, C. Why Should I Trust You? Explaining the Predictions of Any Classifier. In Proceedings of the 22nd ACM SIGKDD International Conference on Knowledge Discovery and Data Mining, San Francisco, CA, USA, 13–17 August 2016; pp. 1135–1144. [Google Scholar]
- Lundberg, S.M.; Nair, B.; Vavilala, M.S.; Horibe, M.; Eisses, M.J.; Adams, T.; Liston, D.E.; Low, D.K.-W.; Newman, S.-F.; Kim, J.; et al. Explainable machine-learning predictions for the prevention of hypoxaemia during surgery. Nat. Biomed. Eng. 2018, 2, 749–760. [Google Scholar] [CrossRef] [PubMed]
- Hogan, C.A.; Rajpurkar, P.; Sowrirajan, H.; Phillips, N.A.; Le, A.T.; Wu, M.; Garamani, N.; Sahoo, M.K.; Wood, M.L.; Huang, C.; et al. Nasopharyngeal metabolomics and machine learning approach for the diagnosis of influenza. EBioMedicine 2021, 71, 103546. [Google Scholar] [CrossRef] [PubMed]
- Usher-Smith, J.A.; Sharp, S.J.; Griffin, S.J. The spectrum effect in tests for risk prediction, screening, and diagnosis. BMJ 2016, 353, i3139. [Google Scholar] [CrossRef]
- Fu, G.-H.; Yi, L.-Z.; Pan, J. LASSO-based false-positive selection for class-imbalanced data in metabolomics. J. Chemom. 2019, 33, e3177. [Google Scholar] [CrossRef]
- Bijlsma, S.; Bobeldijk, I.; Verheij, E.R.; Ramaker, R.; Kochhar, S.; Macdonald, I.A.; Van Ommen, B.; Smilde, A.K. Large-scale human metabolomics studies: A strategy for data (pre-) processing and validation. Anal. Chem. 2006, 78, 567–574. [Google Scholar] [CrossRef] [PubMed]
- Hrydziuszko, O.; Viant, M.R. Missing values in mass spectrometry based metabolomics: An undervalued step in the data processing pipeline. Metabolomics 2012, 8, 161–174. [Google Scholar] [CrossRef]
- Kehoe, E.R.; Fitzgerald, B.L.; Graham, B.; Islam, M.N.; Sharma, K.; Wormser, G.P.; Belisle, J.T.; Kirby, M.J. Biomarker selection and a prospective metabolite-based machine learning diagnostic for lyme disease. Sci. Rep. 2022, 12, 1478. [Google Scholar] [CrossRef] [PubMed]
- Vabalas, A.; Gowen, E.; Poliakoff, E.; Casson, A.J. Machine learning algorithm validation with a limited sample size. PLoS ONE 2019, 14, e0224365. [Google Scholar] [CrossRef] [PubMed]
- Wei, Y.; Varanasi, R.S.; Schwarz, T.; Gomell, L.; Zhao, H.; Larson, D.J.; Sun, B.; Liu, G.; Chen, H.; Raabe, D.; et al. Machine-learning-enhanced time-of-flight mass spectrometry analysis. Patterns 2021, 2, 100192. [Google Scholar] [CrossRef]
- Frank, E.; Hall, M.; Holmes, G.; Kirkby, R.; Pfahringer, B.; Witten, I.H.; Trigg, L. Weka—A machine learning workbench for data mining. In Data Mining and Knowledge Discovery Handbook; Springer: Berlin/Heidelberg, Germany, 2009; pp. 1269–1277. [Google Scholar]
- Berthold, M.R.; Cebron, N.; Dill, F.; Gabriel, T.R.; Kötter, T.; Meinl, T.; Ohl, P.; Thiel, K.; Wiswedel, B. KNIME—the Konstanz information miner: Version 2.0 and beyond. SIGKDD Explor. Newsl. 2009, 11, 26–31. [Google Scholar] [CrossRef]
- Demsar, J.; Curk, T.; Erjavec, A.; Gorup, C.; Hocevar, T.; Milutinovic, M.; Mozina, M.; Polajnar, M.; Toplak, M.; Staric, A.; et al. Orange: Data Mining Toolbox in Python. J. Mach. Learn. Res. 2003, 14, 2349–2353. [Google Scholar]
- Heinemann, J. Machine Learning in Untargeted Metabolomics Experiments. Methods Mol. Biol. 2019, 1859, 287–299. [Google Scholar]
- Le, T.T.; Fu, W.; Moore, J.H. Scaling tree-based automated machine learning to biomedical big data with a feature set selector. Bioinformatics 2020, 36, 250–256. [Google Scholar] [CrossRef]
- Kuhn, M. Building predictive models in R using the caret package. J. Stat. Softw. 2008, 28, 1–26. [Google Scholar] [CrossRef]
- Sen, P.; Lamichhane, S.; Mathema, V.B.; McGlinchey, A.; Dickens, A.M.; Khoomrung, S.; Orešič, M. Deep learning meets metabolomics: A methodological perspective. Brief. Bioinform. 2020, 22, 1531–1542. [Google Scholar] [CrossRef]
- Casadei-Gardini, A.; Del Coco, L.; Marisi, G.; Conti, F.; Rovesti, G.; Ulivi, P.; Canale, M.; Frassineti, G.L.; Foschi, F.G.; Longo, S.; et al. 1H-NMR Based Serum Metabolomics Highlights Different Specific Biomarkers between Early and Advanced Hepatocellular Carcinoma Stages. Cancers 2020, 12, 241. [Google Scholar] [CrossRef]
- Manduchi, E.; Romano, J.D.; Moore, J.H. The promise of automated machine learning for the genetic analysis of complex traits. Hum. Genet. 2021, 141, 1529–1544. [Google Scholar] [CrossRef]
- Liggi, S.; Hinz, C.; Hall, Z.; Santoru, M.L.; Poddighe, S.; Fjeldsted, J.; Atzori, L.; Griffin, J.L. KniMet: A pipeline for the processing of chromatography–mass spectrometry metabolomics data. Metabolomics 2018, 14, 52. [Google Scholar] [CrossRef]
- Verhoeven, A.; Giera, M.; Mayboroda, O.A. KIMBLE: A versatile visual NMR metabolomics workbench in KNIME. Anal. Chim. Acta 2018, 1044, 66–76. [Google Scholar] [CrossRef]
- Coelewij, L.; Waddington, K.E.; Robinson, G.A.; Chocano, E.; McDonnell, T.; Farinha, F.; Peng, J.; Dönnes, P.; Smith, E.; Croca, S.; et al. Using serum metabolomics analysis to predict sub-clinical atherosclerosis in patients with SLE. medRxiv 2020. [Google Scholar] [CrossRef]
- Evans, E.D.; Duvallet, C.; Chu, N.D.; Oberst, M.K.; Murphy, M.A.; Rockafellow, I.; Sontag, D.; Alm, E.J. Predicting human health from biofluid-based metabolomics using machine learning. Sci. Rep. 2020, 10, 17635. [Google Scholar] [CrossRef] [PubMed]
- Orlenko, A.; Kofink, D.; Lyytikäinen, L.P.; Nikus, K.; Mishra, P.; Kuukasjärvi, P.; Karhunen, P.J.; Kähönen, M.; Laurikka, J.O.; Lehtimäki, T.; et al. Model selection for metabolomics: Predicting diagnosis of coronary artery disease using automated machine learning. Bioinformatics 2020, 36, 1772–1778. [Google Scholar] [CrossRef] [PubMed]
- Chen, H.; Wang, Z.; Qin, M.; Zhang, B.; Lin, L.; Ma, Q.; Liu, C.; Chen, X.; Li, H.; Lai, W.; et al. Comprehensive Metabolomics Identified the Prominent Role of Glycerophospholipid Metabolism in Coronary Artery Disease Progression. Front. Mol. Biosci. 2021, 8, 110. [Google Scholar] [CrossRef] [PubMed]
- Wang, D.; Greenwood, P.; Klein, M.S. Deep Learning for Rapid Identification of Microbes Using Metabolomics Profiles. Metabolites 2021, 11, 863. [Google Scholar] [CrossRef] [PubMed]
- Holzinger, A.; Biemann, C.; Pattichis, C.S.; Kell, D.B. What do we need to build explainable AI systems for the medical domain? arXiv 2017, arXiv:1712.09923. [Google Scholar]
| Publisher’s Note: MDPI stays neutral with regard to jurisdictional claims in published maps and institutional affiliations. |
© 2022 by the authors. Licensee MDPI, Basel, Switzerland. This article is an open access article distributed under the terms and conditions of the Creative Commons Attribution (CC BY) license (https://creativecommons.org/licenses/by/4.0/).


 ,
, 


