Article

Validation of Appropriate Reference Genes for qRT–PCR Normalization in Oat (Avena sativa L.) under UV-B and High-Light Stresses

1
Department of Grassland Science, College of Animal Science and Technology, Northeast Agricultural University, Harbin 150030, China
2
Institute of Grass Research, Heilongjiang Academy of Agricultural Sciences, Harbin 150080, China
*
Authors to whom correspondence should be addressed.
These authors contributed equally to this work.
Int. J. Mol. Sci. 2022, 23(19), 11187; https://doi.org/10.3390/ijms231911187
Submission received: 18 August 2022 / Revised: 13 September 2022 / Accepted: 19 September 2022 / Published: 23 September 2022
(This article belongs to the Special Issue Environmental Stress and Plants 2.0)

Abstract

:
Oat is a food and forage crop species widely cultivated worldwide, and it is also an important forage grass in plateau regions of China, where there is a high level of ultraviolet radiation and sunlight. Screening suitable reference genes for oat under UV-B and high-light stresses is a prerequisite for ensuring the accuracy of real-time quantitative PCR (qRT–PCR) data used in plant adaptation research. In this study, eight candidate reference genes (sulfite oxidase, SUOX; victorin binding protein, VBP; actin-encoding, Actin1; protein PSK SIMULATOR 1-like, PSKS1; TATA-binding protein 2-like, TBP2; ubiquitin-conjugating enzyme E2, UBC2; elongation factor 1-alpha, EF1-α; glyceraldehyde-3-phosphate dehydrogenase 1, GAPDH1;) were selected based on previous studies and our oat transcriptome data. The expression stability of these reference genes in oat roots, stems, and leaves under UV-B and high-light stresses was first calculated using three frequently used statistical software (geNorm, NormFinder, and BestKeeper), and then the comprehensive stability of these genes was evaluated using RefFinder. The results showed that the most stably expressed reference genes in the roots, stems, and leaves of oat under UV-B stress were EF1-α, TBP2, and PSKS1, respectively; the most stably expressed reference genes in the roots, stems, and leaves under high-light stress were PSKS1, UBC2, and PSKS1, respectively. PSKS1 was the most stably expressed reference gene in all the samples. The reliability of the selected reference genes was further validated by analysis of the expression of the phenylalanine ammonia-lyase (PAL) gene. This study highlights reference genes for accurate quantitative analysis of gene expression in different tissues of oat under UV-B and high-light stresses.

1. Introduction

Oat (Avena sativa L.) is a dual-purpose food and forage crop species of the family Poaceae in the genus Avena, and is the sixth most grown crop species worldwide, behind that rice, sorghum (Sorghum bicolor L.), maize, wheat, and barley (Hordeum vulgare L.). Oat is nutritious, the seeds are rich in dietary fiber and β-glucan [1], and the bran is rich in triterpenoid saponins, vitamins B, protein, fats, and minerals [2,3]. In addition, the stems and leaves can also be used as feed for herbivores because of their high forage value [4]. Owing to its cold tolerance, drought tolerance, resistance to soil infertility, and high adaptability, the oat has become a dominant cultivated forage grass species in the Tibetan Plateau region. Due to the high altitude, low air density and high atmospheric transparency associated with plateaus, the direct radiant energy reaching the ground is high, so plants growing on plateaus must tolerate strong UV-B and high-light for long periods of time [5,6]. Understanding gene function and expression in oat in adaption to UV-B and high-light irradiance in alpine areas can lay a theoretical foundation for breeding highly resistant varieties.
Real-time quantitative PCR (qRT–PCR) is a method for real-time monitoring of the fluorescence signal of each cycle of amplification and for quantitatively analyzing the template by amplification during the exponential phase [7]. Owing to its high sensitivity, high specificity, reliable results, and ease of performance, qRT–PCR has been extensively applied for gene expression analysis in the field of molecular biology [8]. However, during actual experimental operation, the quantitative results can be impacted by factors including extraction of RNA, reverse transcription, and qRT–PCR amplification efficiency [9,10]. Therefore, in order to ensure the accuracy of the experimental results, suitable reference genes need to be used as standards to measure the expression level of the target gene. In botany, most of the reference genes encode proteins that function as an essential component of the organism’s cytoskeleton structure (e.g., ACT, TUB, etc.) and are partially associated with the biochemical metabolic pathways of cells (e.g., EF1-α, GAPDH, UBQ, etc.); these gene products are essential for cellular biological activity, and they can theoretically be expressed stably under any conditions. The idea reference gene must be expressed at a relatively stable level in different tissues and be unaffected by environmental or biological stresses. However, there is not yet a reference gene that is stably expressed across all tissues and organs or under all stress conditions [11,12]. If reference genes are not selected properly, the results of an experiment may be affected, or even the opposite conclusions may be obtained. Thus, it is important to select the optimal reference genes for different plant materials and tissues, according to the specific experimental requirements to ensure accurate and reliable results.
GeNorm, NormFinder, and BestKeeper are three frequently used statistical software in assessing the stable expression of candidate reference genes and selecting suitable reference genes, which are then analyzed from different perspectives. Meanwhile, RefFinder is a comprehensive analysis tool that is integrated with geNorm, BestKeeper, NormFinder, and the ΔCt methods. By comparing the analysis results of statistical software, researchers can select optimal reference genes. In recent years, these statistical software have been used to successfully identify the optimal reference genes for many species, such as wheat (Triticum aestivum L.) [13], Arabidopsis (Arabidopsis thaliana L.) [14], rice (Oryza sativa L.) [15] maize (Zea mays L.) [16] and Aegilops tauschii [17]. Although, gene function analysis has been conducted in oat and the verification of optimal reference genes under several abiotic stresses has been reported [18,19]. There are still no detailed studies on the stability of oat candidate reference genes under UV-B and high-light stresses. In the present study, eight candidate reference genes (SUOX, VBP, Actin1, PSKS1, TBP2, UBC2, EF1-α, and GAPDH1) were chosen based on previous studies and our oat transcriptome data, and their expression stability in the roots, stems, and leaves of oat under UV-B and high-light stresses were assessed by geNorm, NormFinder and BestKeeper, and the comprehensive stability was ranked by RefFinder. Moreover, we measured the expression level of phenylalanine ammonia-lyase (PAL) using two most stable and least stable reference genes to validate the reliability of the results. Our findings provide a basis for further study on the expression of genes in plants under UV-B and high-light stresses.

2. Results

2.1. Analysis of Primer Specificity and Amplification Efficiency

In this study, eight candidate reference genes were selected from our oat transcriptome data, and corresponding PCR primers were designed. Details of these candidate reference genes were shown in Table 1. The primer specificity of the candidate reference genes was verified by PCR and qRT–PCR. cDNA from oat seedling leaves was used as a template for PCR. The results suggested that the size of the amplification products for each reference gene ranged from 104 bp for the UBC2 primer to 147 bp for the EF1-α primer, with only one specific band for each primer, and the fluorescence quantitative melting curve also showed a single amplification peak (Table 1, Figures S1 and S2). The amplification efficiencies of the eight candidate gene primers ranged from 92.61% for PSKS1 to 109.42% for UBC2, and the coefficient of determination (R2) varied from 0.9629 (UBC2) to 0.9998 (PSKS1) (Table 1).

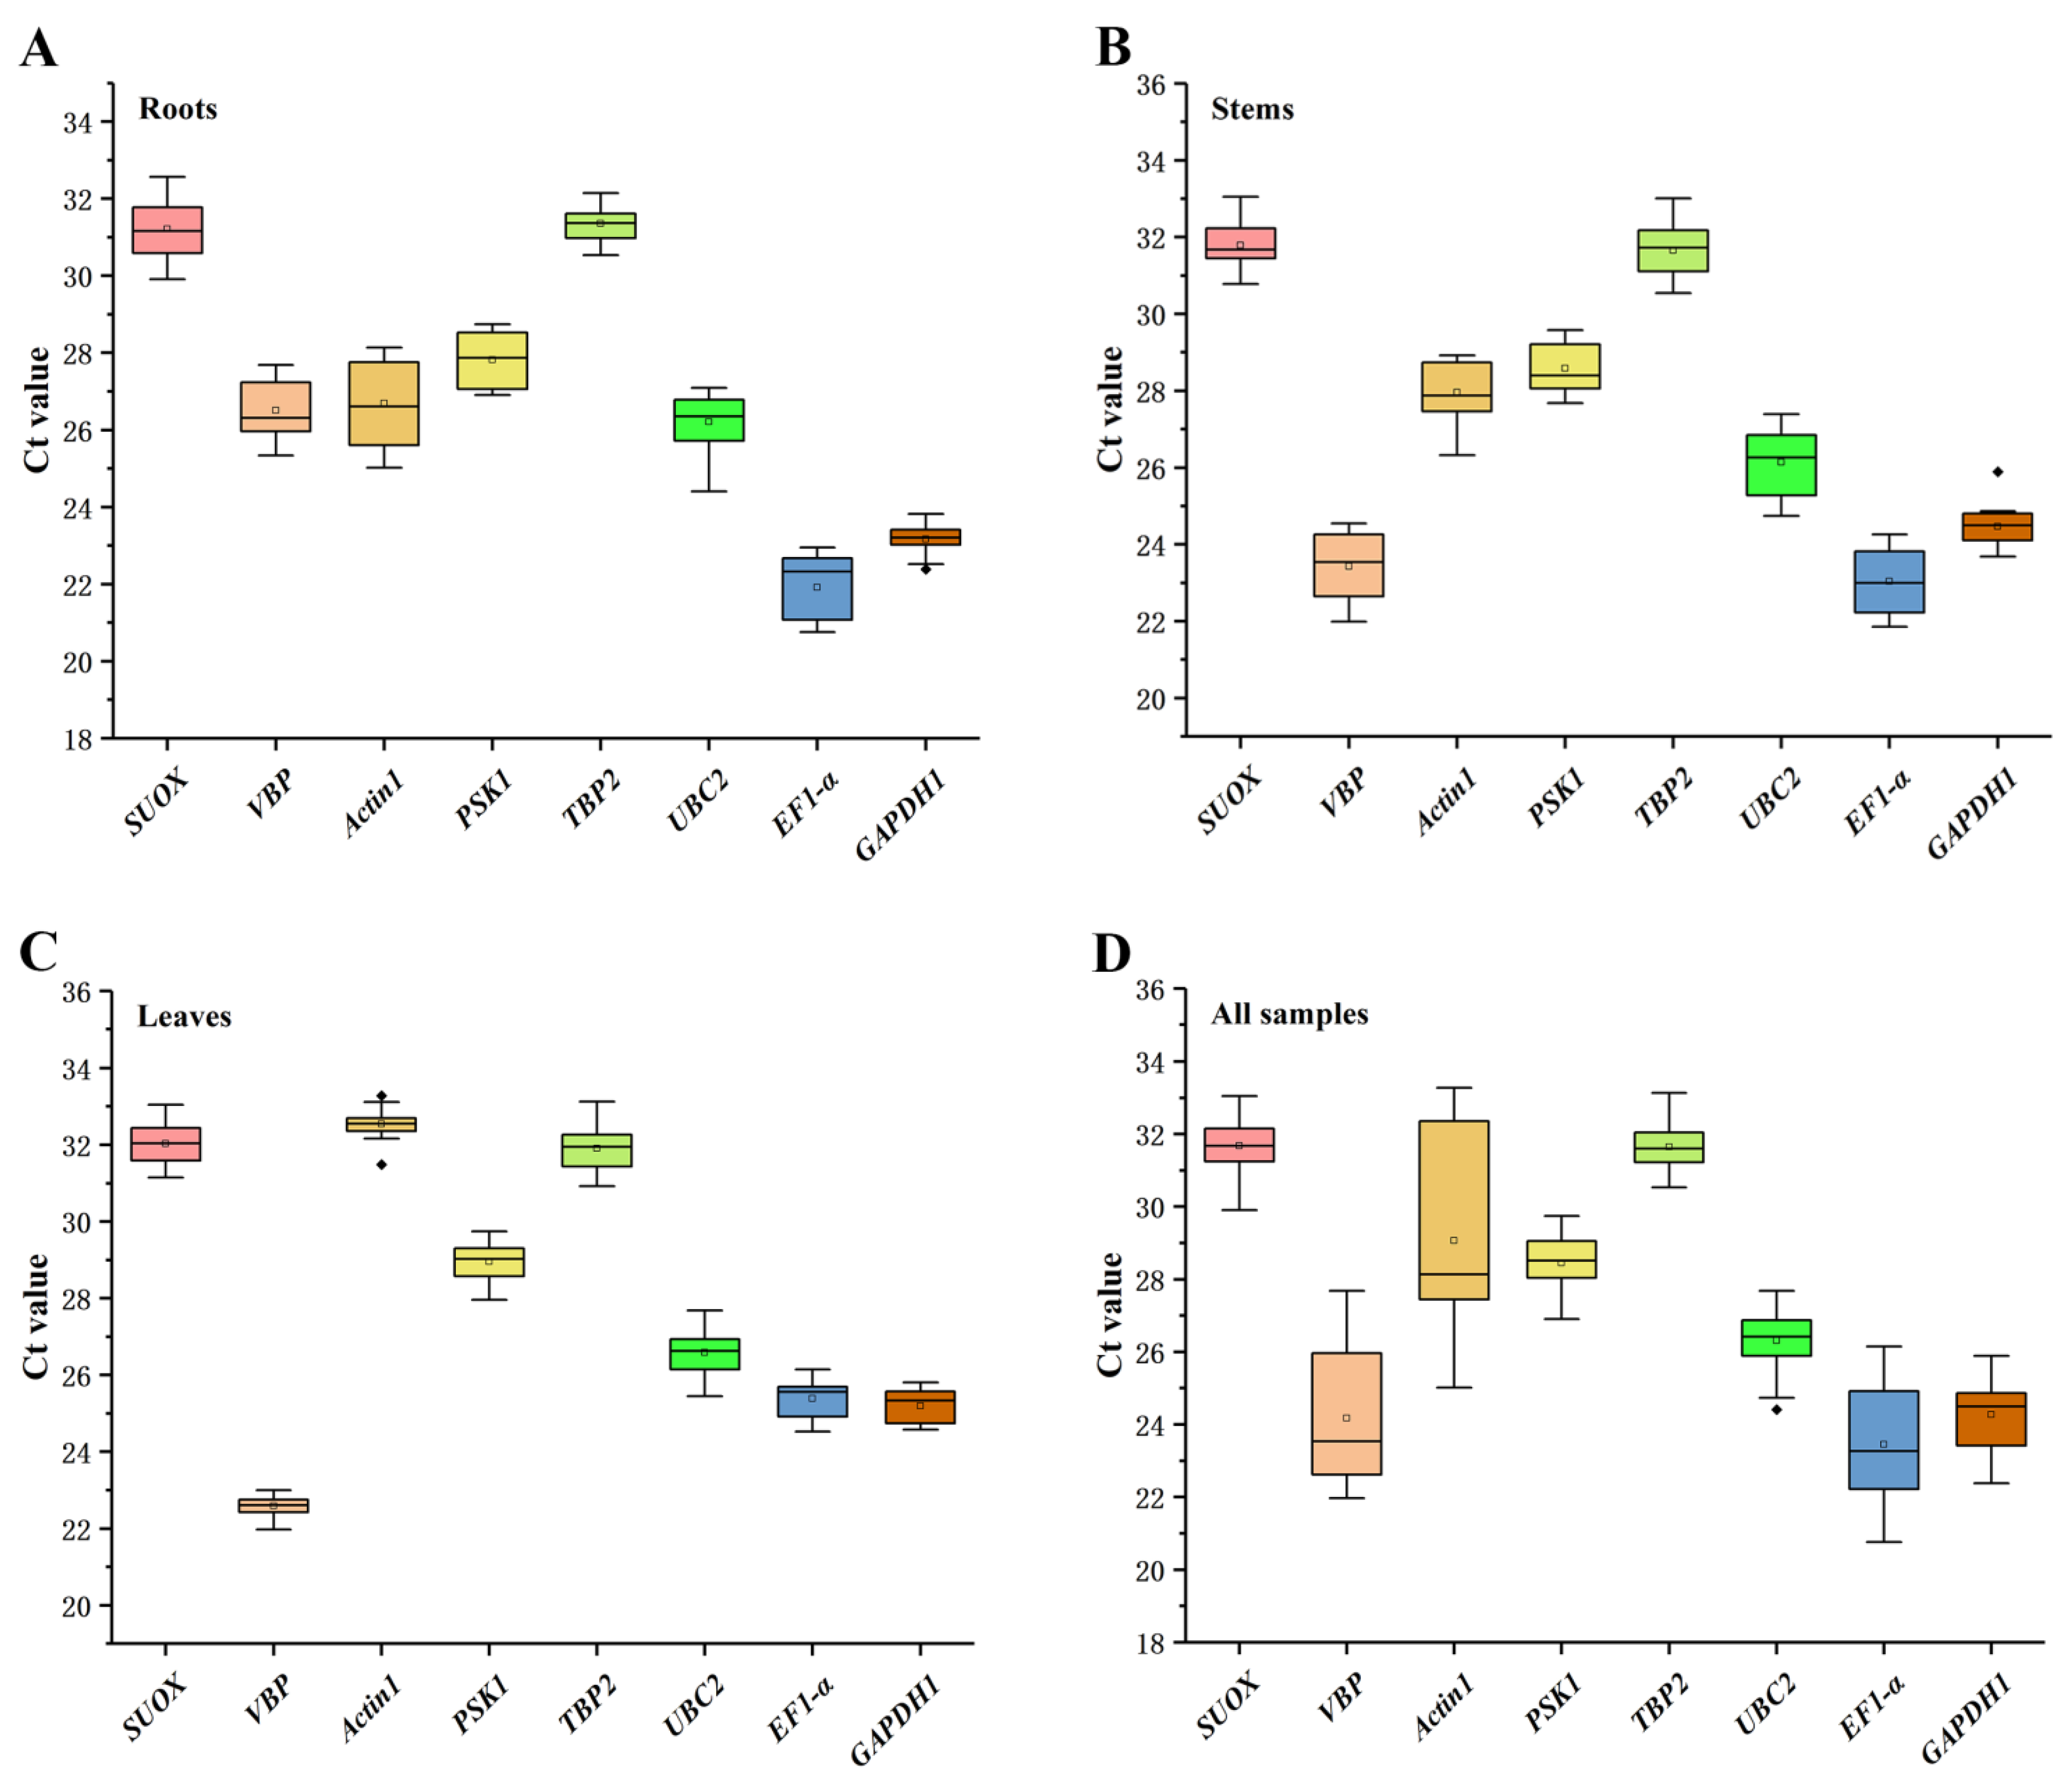
2.2. Expression Profiles and Stability of Candidate Reference Genes

As shown in Figure 1, the expression levels of the eight candidate reference genes were presented according to cycle threshold (Ct) values, and the lower Ct values indicated higher gene expression levels. EF1-α has the highest expression in roots and stems, and the highest expression gene in leaves is VBP. The order of gene expression levels in all samples from high to low is EF1-α > VBP > GAPDH1 > UBC2 > PSKS1 > Actin1 > TBP2 > SUOX. The Ct values in the roots, stems, leaves, and all samples ranged from 21.91 to 32.54. GAPDH1 showed the least variation in the roots and stems (Figure 1A,B), whereas VBP showed the least variation in the leaves, suggesting that the most stably expressed gene varied according to the tissues (Figure 1C). In addition, the top two stably expressed candidate reference genes in all the samples were TBP2 and PSKS1, and the least stably expressed gene was Actin1 (Figure 1D).

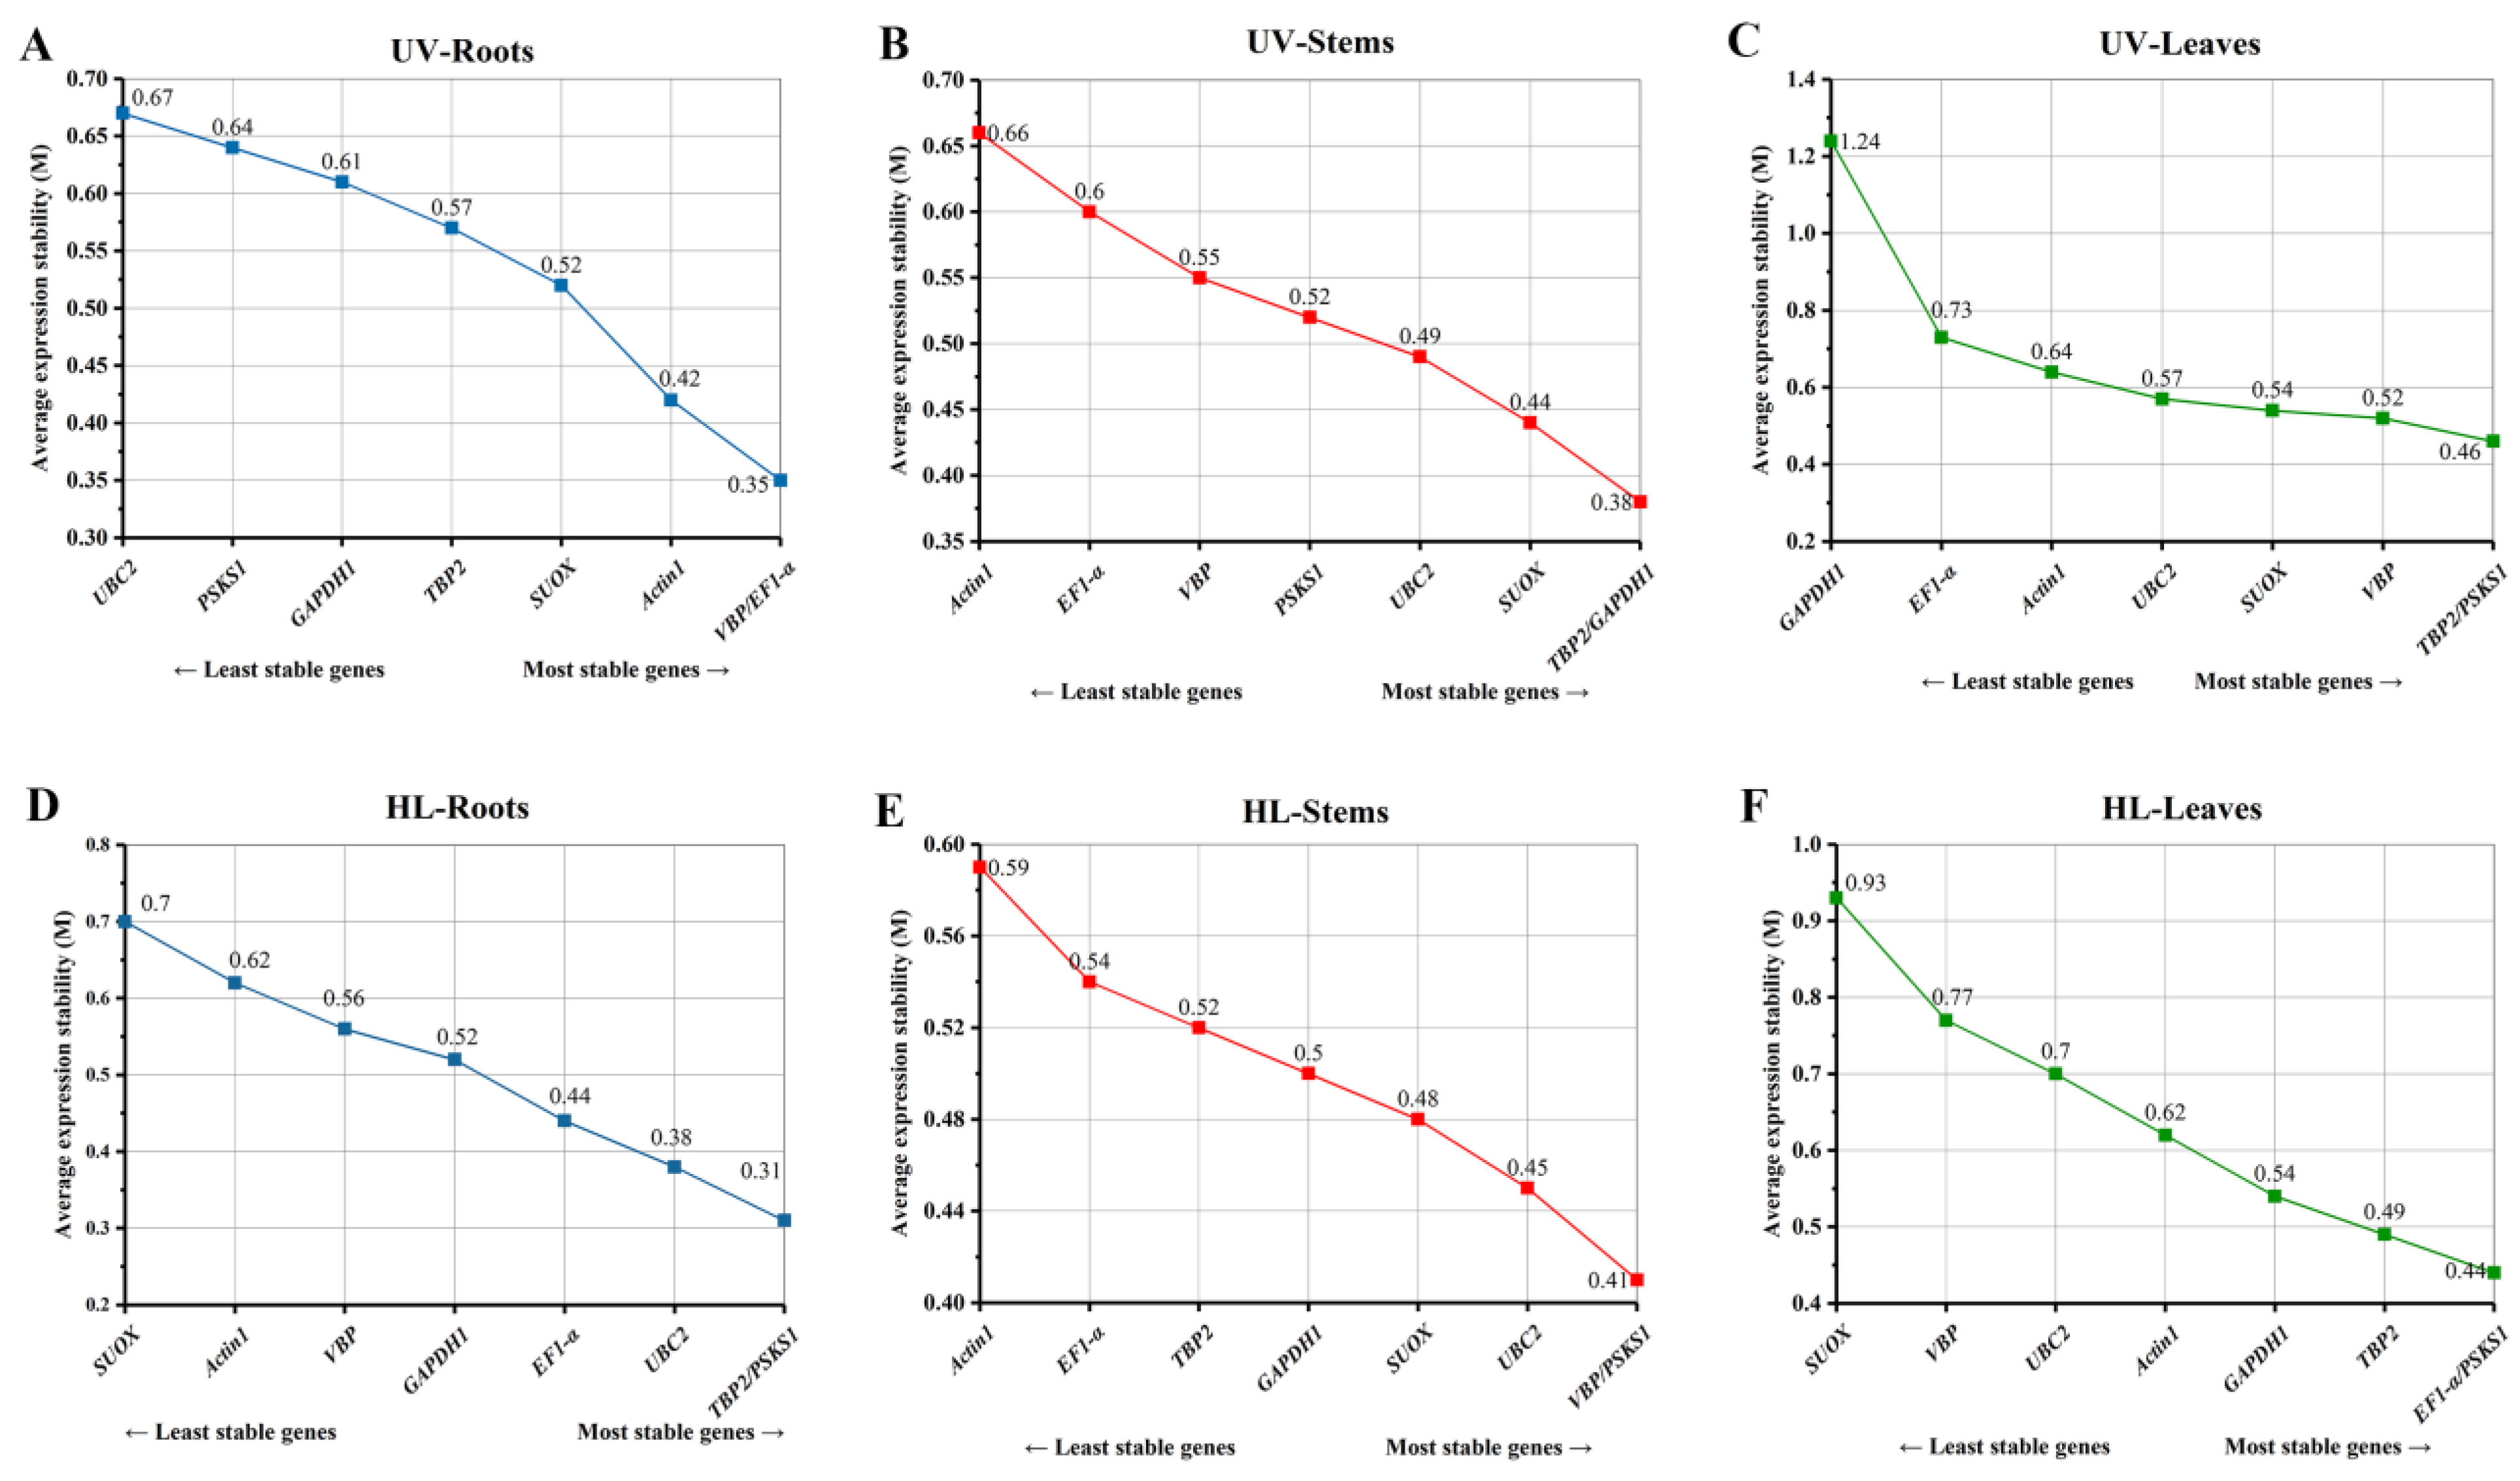
2.3. GeNorm Analysis

The average expression stability (M) was calculated by geNorm to determine the average expression level of the eight reference genes across different oat tissues under various stresses (Figure 2). Usually, Reference genes with M values below a threshold of 1.5 are considered to be stable, and all the candidate reference genes in this study were stably expressed (M < 1.5). For UV-B stress, the expression of VBP and EF1-α (M = 0.35), TBP2 and GAPDH1 (M = 0.38), and PSKS1 and TBP2 (M = 0.46) was the most stable, while UBC2 (M = 0.67), Actin1 (M = 0.66) and GAPDH1 (M = 1.24) was the least stable in the roots, stems and leaves, respectively (Figure 2A–C). In addition, PSKS1 expression was highly stable in most tissue types under UV-B stresses, while Actin1 and SUOX were usually the least stably expressed genes. Under high-light stress, PSKS1 and TBP2 (M = 0.31), PSKS1 and VBP (M = 0.41), and PSKS1 and EF1-α (M = 0.44) were the most stably expressed gene in the roots, stems and leaves, respectively (Figure 2D–F), while SUOX and Actin1 were the least stably expressed genes.
In geNorm analysis, the pairwise variant analysis provides criteria for selecting the optimal combination of the number of candidate reference genes, and if the Vn/Vn + 1 is less than 0.15, the best solution is the top n reference genes ranked together as the reference genes. As shown in Figure 3, V3/V4 was less than 0.15 in the leaves under UV-B and high-light stresses, indicating that three reference genes should be used for the normalization of target gene expression data. V2/V3 was less than 0.15 in the roots and stems under UV-B and high-light stresses, indicating that two candidate reference genes are needed for normalizing gene expression data.

2.4. BestKeeper Analysis

The stability of the expression levels calculated by BestKeeper is based on the coefficient of variation (CV) and standard deviation (SD), and the smaller values represent a more stable expression. The rankings showed that the most stable genes were SUOX (roots and leaves) and UBC2 (stems) under UV-B stress, while the least stable gene was Actin1 (roots and stems) and GAPDH1 (leaves). Under high-light stress, the most stable expressed gene in the roots, stems, and leaves were PSKS1, UBC2, and EF1-α, respectively. Inversely, SUOX was the least stable gene in roots and leaves, and Actin1 was the least stable in stems. UBC2 and PSKS1 were the top two reference genes stably expressed in all samples, while Actin1 was the least stable expressed gene (Table 2).

2.5. NormFinder Analysis

In NormFinder analysis, a lower stability value (SV) indicates greater stability. As shown in Table 3, the most stably expressed candidate reference genes in the roots, stems, and leaves under UV-B stress were EF1-α, TBP2, and VBP, and the least stably expressed genes were UBC2, Actin1, and GAPDH1. Under high-light stress, the most stably expressed gene in the stems was UBC2, and the least stably expressed gene was Actin1. PSKS1 was the most stably expressed gene in both the roots and the leaves, and SUOX was the most instability expressed gene. Meanwhile, PSKS1 was the most stably expressed reference gene in all the samples, and VBP was the least stably expressed gene.

2.6. RefFinder Analysis

Due to the different calculation methods of geNorm, Bestkeeper, and NormFinder, the rankings obtained showed great differences. RefFinder is a comprehensive analysis tool that could provide an overall ranking by assigning an appropriate weight to an individual reference gene and calculating the geometric mean of their weights based on the rankings from geNorm, BestKeeper, NormFinder, and the ΔCt methods. In recent years, it has been widely used for evaluating gene expression stability when the results of geNorm, NormFinder, and BestKeeper were inconsistent. Thus, we finally adopted the RefFinder algorithm to comprehensively rank the expression stability of all the candidate reference genes in different tissues under various stresses. The comprehensive analysis showed that EF1-α, TBP2, and PSKS1 were the most stably expressed genes in the roots, stems, and leaves, respectively under UV-B stress. Meanwhile, PSKS1, UBC2, and PSKS1 were the most stably expressed genes in the roots, stems, and leaves, respectively under high-light stress (Table 4). PSKS1 was the most stably expressed candidate reference gene in all samples, and VBP was the least stably expressed candidate reference gene.

2.7. Reference Gene Validation

To validate the accuracy of the results of the analysis of expression stability of the reference genes, we analyzed the relative expression of PAL genes in randomly selected tissues under UV-B and high-light stresses with two most stably expressed and one unstably expressed candidate reference gene according to the RefFinder results. The expression of PAL exhibited similar trends when the most stably expressed reference gene was used alone or in combination either in different tissues or under abiotic stresses; whereas the obtained expression patterns of the most unstably expressed reference genes obviously differed from the optimal reference genes used alone or in combination (Figure 4).
It was evident that the expression patterns of PAL were similar in the stems under UV-B stress when TBP2, GAPDH1, and TBP2 + GAPDH1 were used as reference genes, respectively. When the data was normalized using TBP2, GAPDH1, and TBP2 + GAPDH1, the expression level of PAL showed more than doubles at 3 h and 6 h compared with 0 h. However, almost no difference was shown in the expression trend of Actin1 normalization results at 3 h to 6 h. In addition, the expression level of PAL was 3.39 times than that of the 0 h when the unstably expressed gene Actin1 was used as reference gene, which was much higher than that of the stable reference gene and its combination as the reference gene (Figure 4A). The expression patterns of PAL normalized by PSKS1, VBP, and their combination showed a similar tendency over time in the leaves under UV-B stress, but there was no obvious change when GAPDH1 was used as the reference gene (Figure 4B). Similar differences were also found under high-light stress (Figure 4C, D). In roots, when unstably expressed reference gene SUOX was used as the normalizing gene, the expression of the PAL gene showed an opposite decreasing or increasing trend compared with PSKS1, TBP2, and PSKS1 + TBP2 at 6 h and 48 h, respectively (Figure 4C). In leaves, the expression level of PAL varied much more when normalized by SUOX compared with that of the most stably expressed reference genes (Figure 4D). Inappropriate reference genes may overestimate or underestimate the expression of target genes. These results indicated that the selection of optimal reference genes is extremely important in the study of gene expression.

3. Discussion

Gene expression analysis is an important tool to understand biological regulatory mechanisms, and the use of stably expressed reference genes is a precondition to ensure reliable qRT–PCR results because it is highly affected by species, tissues, RNA quality, and other environmental factors [20,21]. Currently, the effect of select reference genes on the accuracy of fluorescence quantitative data has been studied in many plant species, and optimal reference genes have been identified in each of those species [22,23,24,25]. Some genes (e.g., actin, β-actin, EF1-α, GAPDH, CYP, and 18S) have been identified as optimal reference genes and they have been widely used in molecular biology research in many species. Studies involving reference gene screening have also been carried out in oat. For example, EF1-α, TATA-binding protein, GAPDH, and PGD can be served as reference genes under salt stress, ADPR, and GAPDH can be used in the leaves and the roots, respectively, under drought stress, and ADPR is also considered to be a suitable reference gene under cold or heats stress [18,19]. However, optimal reference genes may be varied depending on tissues, organs, and stresses, and there is still a lack of studies on the optimal reference genes under UV-B and high-light stresses.
In this study, eight selected reference genes are all highly specific (Figures S1 and S2), and the expression analysis was conducted in three tissues, namely the roots, stems, and leaves. The results of geNorm and NormFinder were generally consistent but were slightly inconsistent with those of BestKeeper, which is related to the computational differences between BestKeeper and the other two methods [26,27,28]. RefFinder is a comprehensive analysis tool that is integrated with geNorm, BestKeeper, NormFinder, and the ΔCt methods. The combined results of RefFinder indicated that EF1-α was the most stably expressed gene in the roots of UV-B stressed plants; EF1-α is ubiquitous and has a number of important functions. It not only is involved in many important biological activities and disease processes, including translational control, apoptosis, cytoskeleton composition, and signaling, but also is a stably expressed reference gene in Chicory (Cichorium intybus L.) and Parsley (Petroselinum crispum L.) [29,30]. TBP2 has a crucial role in transcriptional processes in the nucleus of eukaryotic cells [31,32] and has been shown to serve as a reference gene in papaya (Carica papaya L.) under ethylene and as a reference gene in Siberian wild rye (Elymus sibiricus L.) adapted to salt stress [33,34]. Our results also showed that TBP2 can be used as a reference gene in the stems of oat under UV-B stress, and confirmed. UBC2 was the most stably expressed gene in the stems under high-light stress; The UBC2 gene is an important component of the ubiquitin/proteasome pathway and has an important role in the ubiquitination of proteins. Due to its highly conservative character, UBC2 serves as a stably expressed reference gene for different tissues in red clover (Trifolium pratense L.) [35], and licorice (Glycyrrhiza glabra L.) and for phytohormone and NaCl stress responses [36] in licorice and under drought stress [37]. Furthermore, PSKS1 was the most stably expressed candidate reference gene in the leaves under UV-B stress and in the roots and leaves under high-light stress. PSK is a novel plant peptide growth regulator discovered in recent years that has a very wide range of biological activities and effects. It has been reported that PSK genes promote cell division, cell differentiation, and somatic cell formation, coordinate the metabolism and utilization of glucose, help resist oxidative stress, increase chlorophyll contents, improve salt tolerance and high-temperature tolerance of Arabidopsis, and promote the development of pear pollen tubes, and these genes are considered chemical caretakers of plant cell development processes [38,39,40]. A combined analysis of all the samples in the current study indicated that PSKS1 was the most stably expressed candidate reference gene and that VBP was the least stably expressed candidate reference gene.
To verify the reliability of the selected candidate reference genes, we used the top two most stably expressed reference genes, their combinations and the least stably expressed reference genes to normalize the relative expression levels of PAL in three tissues of oat. PAL is known as the rate-limiting enzyme in the phenylpropanoid pathway [41]. The intermediates produced in the phenylpropanoid pathway can directly or indirectly synthesize a variety of plant secondary metabolites, including flavonoids, lignin, phenol, plant antitoxin, and capsaicin [42,43,44,45]. Phenylpropanoids are widely distributed throughout the plant kingdom, and they constitute a class of secondary metabolites and play essential roles in plant development by acting as essential components of cell walls and protective agents against abiotic stresses [42]. Several studies have demonstrated that UV-B and high-light stress both can change PAL expression, thereby affecting plant growth [46,47,48,49]. In this study, the expression patterns of PAL were mainly congruent when the top two most stably expressed genes were used as reference genes for normalizing the expression of target gene. Although the expression trend of each individual stably expressed reference gene was consistent with that of the combination of stably expressed reference genes, there were still subtle differences in expression levels. However, the expression of unstable reference genes showed the opposite result, demonstrating that the relative expression of target genes varied with the difference and number of selected reference genes.

4. Materials and Methods

4.1. Plant and Stress Treatments

The oat (Avena sativa L.) variety Qingyin No. 1, provided by the Qinghai Academy of Animal Science and Veterinary Medicine, China. Oat seeds were germinated on filter paper, and then seedlings with a uniform appearance were transferred to seedling trays (soil: vermiculite [1:1], room temperature, 16/8 h light/darkness photoperiod with a light intensity of 300 μmol/m2/s) and watered every 2 days with Hoagland nutrient solution. When the seedlings reached the three-leaf stage, they were subjected to abiotic stress by way of UV-B (500 μW/cm2) and high-light (1800 μmol/m2/s1) stresses, and the roots, stems, and leaves were harvested at 0 h, 3 h, 6 h, 12 h, 24 h, and 48 h, respectively. The seedlings of oat were immediately frozen in liquid nitrogen and stored in −80 °C refrigerators. Each experimental treatment was biologically replicated three times.

4.2. Total RNA Extraction and cDNA Synthesis

The total RNA of samples was extracted with an Ultrapure RNA Kit (CWBIO, Taizhou, China), a plant RNA extraction kit, following the manufacturer’s instructions. After subjecting the RNA quality to 1% agarose gel electrophoresis (WD-9413B, Liu Yi Biological Technology Co., Ltd., Beijing, China) and ultramicroscopic spectrophotometry (NanoPhotometer N50, IMPLEN, Munich, Germany), the reverse transcription of RNA was carried out with 0.1 μg of total RNA, and a 20 μL reaction mixture using HiScript III 1st Strand cDNA Synthesis Kit (+gDNA wiper) (Vazyme, Nanjing, China).

4.3. Selection and Primer Design of Candidate Reference Genes

We selected the five widely used reference genes including EF1-a, TBP2, GAPDH1, UBC2, and Actin1 as candidate reference genes by searching the Internal Control Genes (ICG, http://icg.big.ac.cn/index.php/Species:Plant, accessed on 12 November 2021), a reference gene database, and the relevant literature in sequenced Graminae species [18,50] and obtained their sequences from the NCBI database (https://www.ncbi.nlm.nih.gov, accessed on 16 November 2021). Using TBtools software (https://github.com/CJ-Chen/TBtools, accessed on 18 November 2021), the sequences were used as query files to obtain the sequences of the candidate reference genes by comparison with the transcriptome data sequenced by our research group. Meanwhile, three stably expressed genes (SUOX, VBP and PSK) under different treatments were chosen from our previous transcriptomic dataset. Gene-specific primers of these genes for use in qRT–PCR were designed using Primer Premier 5.0 software (Premier, Inc., Toronto, ON, Canada) (Table 1). The primers were 20–24 bp in length with an annealing temperature of 55–65 °C, a GC content of 45–60%, and product size of 100–150 bp. The primers were synthesized by Rui Bo Xing Ke Biotechnology Co., Ltd. (Beijing, China).

4.4. qRT–PCR Analysis of Candidate Reference Genes

cDNA from the roots, stems, and leaves were diluted to 0.1, 0.01, 0.001, and 0.0001 times the initial concentration, and it was used for calculations of the amplification efficiency (E) and the coefficient of determination (R2) of the primers and to construct standard curves: E (%) = (10−1/slope−1) × 100. The cDNA of samples was diluted to approximately 200 ng/μL and used for comparing the stability of different primers in different oat tissues. Three technical replicates were performed for each biological replicate.
In this case, qRT–PCR was performed on the Quantagene q225 system (Kubo, Beijing, China). Each 10 μL reaction mixture contained 5 μL of 2 × ChamQ SYBR Color qPCR Master Mix (High ROX Premixed, Vazyme, Nanjing, China), 0.5 μL of cDNA, 0.4 μL of forward and reverse primer, and 3.7 μL of ddH2O. The procedure of the instrument was as follows: 40 cycles of 180 s at 95 °C; 10 s at 95 °C, and 30 s at 58 °C, followed by 72 °C. The melting curve was automatically generated at the end of each run.

4.5. Algorithms for Evaluating the Stability of Candidate Reference Genes

A total of four algorithms were adopted in this study to assess the stability of the oat reference genes: those of the geNorm [51], NormFinder [52], BestKeeper [9], and RefFinder [53] software programs. geNorm used the cycle threshold (Ct) values generated from qRT–PCR to calculate 2−ΔΔCt as the treatment, and NormFinder and BestKeeper used the Ct values generated by the candidate reference genes from qRT–PCR as the treatment. In the geNorm analysis, the variation (Vn/Vn + 1) in the ratio of expression levels of n and n + 1 (n ≥ 2) reference genes were analyzed to calculate their standard deviation (SD), and the mean of SD was recorded as the average expression stability (M), which was used to indicate the stability of candidate reference genes. The smaller the M value is, the higher the stability of the reference genes. The NormFinder model is based on the ANOVA algorithm; the stability value (SV) is obtained by calculating the range of variation of the inner and outer clusters, and the smaller the SV is, the higher the stability of candidate reference genes. In BestKeeper analysis, the stability of the expression levels of reference genes is evaluated using both the coefficient of variation (CV) and SD; the smaller the CV value is, the greater the stability. Finally, RefFinder (http://blooge.cn/RefFinder/, accessed on 15 March 2022) was used for the comprehensive evaluation of suitable reference genes, which is a comprehensive analysis tool for evaluating gene expression stability when the results of geNorm, NormFinder and BestKeeper were inconsistent [54,55].

4.6. Validation of Selected Candidate Reference Genes

In order to verified the reliability of the results, the most stably and least stably expressed reference genes from the stability assessment results, and their combination were selected to normalize the expression levels of PAL [18] in the roots, stems, and leaves of oat under UV-B and highlight stresses with qRT–PCR analysis as described above, and the results were calculated using the 2−ΔΔCt method. The experiment was conducted in three biological repetitions, and each individual run was repeated in technical triplicate.

5. Conclusions

In this study, eight candidate reference genes for qRT–PCR normalization under UV-B and high-light stresses in oat roots, stems, and leaves were systematically validated by the use of three algorithms, and the final comprehensive ranking was conducted by RefFinder. Based on the results of the present work, we recommend PSKS1 as a suitable reference gene for all samples used for qRT–PCR assays, and the other genes can also be selected according to tissue and treatment specificity. The results of this study will help ensure the accuracy of normalization for qRT–PCR analysis in further molecular studies of oat under UV-B and high-light stresses.

Supplementary Materials

The supporting information can be downloaded at: https://www.mdpi.com/article/10.3390/ijms231911187/s1.

Author Contributions

Conceptualization, B.L. and G.C.; methodology, H.Y., D.Y., M.Z., Z.G., M.T., X.L. and J.L.; formal analysis, H.Y. and M.Z.; writing—original draft preparation, H.Y. and D.Y.; writing-reviewing and editing, B.L. and G.C. All authors have read and agreed to the published version of the manuscript.

Funding

This research was funded by the National Natural Science Foundation of China (32101425) and the China Postdoctoral Science Foundation (2019M651251).

Data Availability Statement

Not applicable.

Conflicts of Interest

The authors declare no conflict of interest.

References

  1. Butt, M.S.; Tahir-Nadeem, M.; Khan, M.K.I.; Shabir, R.; Butt, M.S. Oat: Unique among the cereals. Eur. J. Nutr. 2008, 47, 68–79. [Google Scholar] [CrossRef] [PubMed]
  2. Grundy, M.M.L.; Fardet, A.; Tosh, S.M.; Rich, G.T.; Wilde, P.J. Processing of oat: The impact on oat’s cholesterol lowering effect. Food Funct. 2018, 9, 1328–1343. [Google Scholar] [CrossRef]
  3. Hu, C.; Sang, S. Triterpenoid Saponins in Oat Bran and Their Levels in Commercial Oat Products. J. Agric. Food Chem. 2020, 68, 6381–6389. [Google Scholar] [CrossRef] [PubMed]
  4. Winkler, L.R.; Murphy, K.M.; Hermes, J.C. Three hulless oat varieties show economic potential as organic layer feed grain. Renew. Agric. Food Syst. 2018, 33, 418–431. [Google Scholar] [CrossRef]
  5. Dai, J. Qinghai-Tibet Plateau Climate; China Meteorological Press: Beijing, China, 1990; pp. 22–37. [Google Scholar]
  6. Zhang, Z.H.; Chang, X.; Su, D.Y.; Yao, R.; Liu, X.D.; Zhu, H.; Liu, G.X.; Zhong, B.J. Comprehensive transcriptome analyses of two Oocystis algae provide insights into the adaptation to Qinghai-Tibet Plateau. J. Syst. Evol. 2021, 59, 1209–1219. [Google Scholar] [CrossRef]
  7. Huggett, J.; Dheda, K.; Bustin, S.; Zumla, A. Real-time RT-PCR normalisation; strategies and considerations. Genes Immun. 2005, 6, 279–284. [Google Scholar] [CrossRef]
  8. Bustin, S.A.; Benes, V.; Nolan, T.; Pfaffl, M.W. Quantitative real-time RT-PCR—A perspective. J. Mol. Endocrinol. 2005, 34, 597–601. [Google Scholar] [CrossRef] [PubMed]
  9. Pfaffl, M.W.; Tichopad, A.; Prgomet, C.; Neuvians, T.P. Determination of stable housekeeping genes, differentially regulated target genes and sample integrity: BestKeeper—Excel-based tool using pair-wise correlations. Biotechnol. Lett. 2004, 26, 509–515. [Google Scholar] [CrossRef]
  10. Udvardi, M.K.; Czechowski, T.; Scheible, W.-R. Eleven golden rules of quantitative RT-PCR. Plant Cell 2008, 20, 1736–1737. [Google Scholar] [CrossRef] [PubMed]
  11. Czechowski, T.; Stitt, M.; Altmann, T.; Udvardi, M.K.; Scheible, W.R. Genome-wide identification and testing of superior reference genes for transcript normalization in Arabidopsis. Plant Physiol. 2005, 139, 5–17. [Google Scholar] [CrossRef] [Green Version]
  12. Remans, T.; Smeets, K.; Opdenakker, K.; Mathijsen, D.; Vangronsveld, J.; Cuypers, A. Normalisation of real-time RT-PCR gene expression measurements in Arabidopsis thaliana exposed to increased metal concentrations. Planta 2008, 227, 1343–1349. [Google Scholar] [CrossRef] [PubMed]
  13. Dudziak, K.; Sozoniuk, M.; Szczerba, H.; Kuzdralinski, A.; Kowalczyk, K.; Boerner, A.; Nowak, M. Identification of stable reference genes for qPCR studies in common wheat (Triticum aestivum L.) seedlings under short-term drought stress. Plant Methods 2020, 16, 58. [Google Scholar] [CrossRef]
  14. Skiljaica, A.; Jagic, M.; Vuk, T.; Levanic, D.L.; Bauer, N.; Markulin, L. Evaluation of reference genes for RT-qPCR gene expression analysis in Arabidopsis thaliana exposed to elevated temperatures. Plant Biol. 2022, 24, 367–379. [Google Scholar] [CrossRef]
  15. Verstraeten, B.; De Smet, L.; Kyndt, T.; De Meyer, T. Selection of miRNA reference genes for plant defence studies in rice (Oryza sativa). Planta 2019, 250, 2101–2110. [Google Scholar] [CrossRef]
  16. Chen, K.; Fessehaie, A.; Arora, R. Selection of Reference Genes for Normalizing Gene Expression During Seed Priming and Germination Using qPCR in Zea mays and Spinacia oleracea. Plant Mol. Biol. Report. 2012, 30, 478–487. [Google Scholar] [CrossRef]
  17. Abbas, A.; Yu, H.; Li, X.; Cui, H.; Chen, J.; Huang, P. Selection and Validation of Reference Genes for RT-qPCR Analysis in Aegilops tauschii (Coss.) under Different Abiotic Stresses. Int. J. Mol. Sci. 2021, 22, 11017. [Google Scholar] [CrossRef]
  18. Tajti, J.; Pal, M.; Janda, T. Validation of Reference Genes for Studying Different Abiotic Stresses in Oat (Avena sativa L.) by RT-qPCR. Plants 2021, 10, 1272. [Google Scholar] [CrossRef]
  19. Duan, Z.L.; Han, W.H.; Yan, L.; Wu, B. Reference gene selections for real time quantitative PCR analysis of gene expression in different oat tissues and under salt stress. Biol. Plant. 2020, 64, 838–844. [Google Scholar] [CrossRef]
  20. Chen, Y.; Tan, Z.; Hu, B.; Yang, Z.; Xu, B.; Zhuang, L.; Huang, B. Selection and validation of reference genes for target gene analysis with quantitative RT-PCR in leaves and roots of bermudagrass under four different abiotic stresses. Physiol. Plant. 2015, 155, 138–148. [Google Scholar] [CrossRef]
  21. Shen, J.; Wu, Y.; Jiang, Z.; Xu, Y.; Zheng, T.; Wang, J.; Cheng, T.; Zhang, Q.; Pan, H. Selection and validation of appropriate reference genes for gene expression studies in Forsythia. Physiol. Mol. Biol. Plants 2020, 26, 173–188. [Google Scholar] [CrossRef]
  22. Xu, M.; Zhang, B.; Su, X.; Zhang, S.; Huang, M. Reference gene selection for quantitative real-time polymerase chain reaction in Populus. Anal. Biochem. 2011, 408, 337–339. [Google Scholar] [CrossRef] [PubMed]
  23. Costa-Silva, J.; Domingues, D.; Lopes, F.M. RNA-Seq differential expression analysis: An extended review and a software tool. PLoS ONE 2017, 12, e0190152. [Google Scholar] [CrossRef] [PubMed]
  24. Wang, Z.; Gu, C.; Xuan, L.; Hua, J.; Shi, Q.; Fan, W.; Yin, Y.; Yu, F. Identification of suitable reference genes in Taxodium ’Zhongshanshan’ under abiotic stresses. Trees-Struct. Funct. 2017, 31, 1519–1530. [Google Scholar] [CrossRef]
  25. Li, X.; Tang, D.; Shi, Y. Selection of reference genes for quantitative real-time PCR normalization in Narcissus pseudonarcissu in different cultivars and different organs. Heliyon 2018, 4, e00686. [Google Scholar] [CrossRef]
  26. Rapacz, M.; Stepien, A.; Skorupa, K. Internal standards for quantitative RT-PCR studies of gene expression under drought treatment in barley (Hordeum vulgare L.): The effects of developmental stage and leaf age. Acta Physiol. Plant. 2012, 34, 1723–1733. [Google Scholar] [CrossRef]
  27. Wang, W.T.; Hu, S.Y.; Cao, Y.; Chen, R.; Wang, Z.Z.; Cao, X.Y. Selection and evaluation of reference genes for qRT-PCR of Scutellaria baicalensis Georgi under different experimental conditions. Mol. Biol. Rep. 2021, 48, 1115–1126. [Google Scholar] [CrossRef]
  28. Zhu, X.L.; Wang, B.Q.; Wang, X.; Wei, X.H. Screening of stable internal reference gene of Quinoa under hormone treatment and abiotic stress. Physiol. Mol. Biol. Plants 2021, 27, 2459–2470. [Google Scholar] [CrossRef]
  29. Maroufi, A.; Van Bockstaele, E.; De Loose, M. Validation of reference genes for gene expression analysis in chicory (Cichorium intybus) using quantitative real-time PCR. Bmc Mol. Biol. 2010, 11, 15. [Google Scholar] [CrossRef]
  30. Li, M.-Y.; Song, X.; Wang, F.; Xiong, A.-S. Suitable Reference Genes for Accurate Gene Expression Analysis in Parsley (Petroselinum crispum) for Abiotic Stresses and Hormone Stimuli. Front. Plant Sci. 2016, 7, 1481. [Google Scholar] [CrossRef]
  31. Rowlands, T.; Baumann, P.; Jackson, S.P. The TATA-binding protein: A general transcription factor in eukaryotes and archaebacteria. Science 1994, 264, 1326–1329. [Google Scholar] [CrossRef]
  32. Bendjennat, M.; Weil, P.A. The transcriptional repressor activator protein Rap1p is a direct regulator of TATA-binding protein. J. Biol. Chem. 2008, 283, 8699–8710. [Google Scholar] [CrossRef] [PubMed]
  33. Zhu, X.; Li, X.; Chen, W.; Chen, J.; Lu, W.; Chen, L.; Fu, D. Evaluation of New Reference Genes in Papaya for Accurate Transcript Normalization under Different Experimental Conditions. PLoS ONE 2012, 7, e44405. [Google Scholar] [CrossRef] [PubMed]
  34. Zhang, J.; Xie, W.; Yu, X.; Zhang, Z.; Zhao, Y.; Wang, N.; Wang, Y. Selection of Suitable Reference Genes for RT-qPCR Gene Expression Analysis in Siberian Wild Rye (Elymus sibiricus) under Different Experimental Conditions. Genes 2019, 10, 451. [Google Scholar] [CrossRef] [PubMed]
  35. Khanlou, K.M.; Van Bockstaele, E. A critique of widely used normalization software tools and an alternative method to identify reliable reference genes in red clover (Trifolium pratense L.). Planta 2012, 236, 1381–1393. [Google Scholar] [CrossRef] [PubMed]
  36. Li, Y.; Liang, X.; Zhou, X.; Wu, Z.; Yuan, L.; Wang, Y.; Li, Y. Selection of Reference Genes for qRT-PCR Analysis in Medicinal Plant Glycyrrhiza under Abiotic Stresses and Hormonal Treatments. Plants 2020, 9, 1441. [Google Scholar] [CrossRef]
  37. Maroufi, A. Selection of reference genes for real-time quantitative PCR analysis of gene expression in Glycyrrhiza glabra under drought stress. Biol. Plant. 2016, 60, 645–654. [Google Scholar] [CrossRef]
  38. Huang, M.X.; Xu, Q.H.; Mitsui, K.; Xu, Z.J. PSK1 regulates expression of SOD1 involved in oxidative stress tolerance in yeast. Fems Microbiol. Lett. 2014, 350, 154–160. [Google Scholar] [CrossRef]
  39. Hao, Q.; Ren, H.X.; Zhu, J.; Wang, L.S.; Huang, S.C.; Liu, Z.A.; Gao, Z.M.; Shu, Q.Y. Overexpression of PSK1, a SKP1-like gene homologue, from Paeonia suffruticosa, confers salinity tolerance in Arabidopsis. Plant Cell Rep. 2017, 36, 151–162. [Google Scholar] [CrossRef]
  40. Xu, X.Y.; Huang, M.X.; Ouyang, Y.H.; Iha, H.; Xu, Z.J. PSK1 coordinates glucose metabolism and utilization and regulates energy-metabolism oscillation in Saccharomyces cerevisiae. Yeast 2020, 37, 261–268. [Google Scholar] [CrossRef]
  41. Sreelakshmi, Y.; Sharma, R. Differential regulation of phenylalanine ammonia lyase activity and protein level by light in tomato seedlings. Plant Physiol. Biochem. 2008, 46, 444–451. [Google Scholar] [CrossRef]
  42. Weisshaar, B.; Jenkins, G.I. Phenylpropanoid biosynthesis and its regulation. Curr. Opin. Plant Biol. 1998, 1, 251–257. [Google Scholar] [CrossRef]
  43. Olsen, K.M.; Lea, U.S.; Slimestad, R.; Verheul, M.; Lillo, C. Differential expression of four Arabidopsis PAL genes; PAL1 and PAL2 have functional specialization in abiotic environmental-triggered flavonoid synthesis. J. Plant Physiol. 2008, 165, 1491–1499. [Google Scholar] [CrossRef] [PubMed]
  44. Shi, R.; Shuford, C.M.; Wang, J.P.; Sun, Y.-H.; Yang, Z.; Chen, H.-C.; Tunlaya-Anukit, S.; Li, Q.; Liu, J.; Muddiman, D.C.; et al. Regulation of phenylalanine ammonia-lyase (PAL) gene family in wood forming tissue of Populus trichocarpa. Planta 2013, 238, 487–497. [Google Scholar] [CrossRef]
  45. Nag, S.; Kumaria, S. In silico characterization and transcriptional modulation of phenylalanine ammonia lyase (PAL) by abiotic stresses in the medicinal orchid Vanda coerulea Gruff. ex Lindl. Phytochemistry 2018, 156, 176–183. [Google Scholar] [CrossRef]
  46. Uarrota, V.G.; Maraschin, M.; de Bairros, A.d.F.M.; Pedreschi, R. Factors affecting the capsaicinoid profile of hot peppers and biological activity of their non-pungent analogs (Capsinoids) present in sweet peppers. Crit. Rev. Food Sci. Nutr. 2021, 61, 649–665. [Google Scholar] [CrossRef] [PubMed]
  47. Li, Y.M.; Zhang, K.M.; Jin, H.H.; Zhu, L.; Li, Y.H. Isolation and expression analysis of four putative structural genes involved in anthocyanin biosynthesis in Begonia semperflorens. J. Hortic. Sci. Biotechnol. 2015, 90, 444–450. [Google Scholar] [CrossRef]
  48. Li, P.; Ma, F.; Cheng, L. Primary and secondary metabolism in the sun-exposed peel and the shaded peel of apple fruit. Physiol. Plant. 2013, 148, 9–24. [Google Scholar] [CrossRef]
  49. Levee, V.; Seguin, A. Inducible expression of the heterologous PAL2 promoter from bean in white pine (Pinus strobus) transgenic cells. Tree Physiol. 2001, 21, 665–672. [Google Scholar] [CrossRef]
  50. Rudus, I.; Kepczynski, J. Reference gene selection for molecular studies of dormancy in wild oat (Avena fatua L.) caryopses by RT-qPCR method. PLoS ONE 2018, 13, e0192343. [Google Scholar] [CrossRef]
  51. Vandesompele, J.; De Preter, K.; Pattyn, F.; Poppe, B.; Van Roy, N.; De Paepe, A.; Speleman, F. Accurate normalization of real-time quantitative RT-PCR data by geometric averaging of multiple internal control genes. Genome Biol. 2002, 3, research0034.0031. [Google Scholar] [CrossRef] [Green Version]
  52. Andersen, C.L.; Jensen, J.L.; Orntoft, T.F. Normalization of real-time quantitative reverse transcription-PCR data: A model-based variance estimation approach to identify genes suited for normalization, applied to bladder and colon cancer data sets. Cancer Res. 2004, 64, 5245–5250. [Google Scholar] [CrossRef] [PubMed]
  53. Xie, F.; Xiao, P.; Chen, D.; Xu, L.; Zhang, B. miRDeepFinder: A miRNA analysis tool for deep sequencing of plant small RNAs. Plant Mol. Biol. 2012, 80, 75–84. [Google Scholar] [CrossRef]
  54. Yang, J.; Han, F.; Yang, L.; Wang, J.; Jin, F.; Luo, A.; Zhao, F. Identification of Reference Genes for RT-qPCR Analysis in Gleditsia microphylla under Abiotic Stress and Hormone Treatment. Genes 2022, 13, 1227. [Google Scholar] [CrossRef]
  55. Tu, C.; Xu, P.; Han, R.; Luo, J.; Xu, L. Defining Suitable Reference Genes for qRT-PCR in Plagiodera versicolora (Coleoptera: Chrysomelidae) under Different Biotic or Abiotic Conditions. Agronomy 2022, 12, 1192. [Google Scholar] [CrossRef]
Figure 1. Distribution of Ct values among eight candidate reference genes in the roots (A), stems (B), leaves (C), and all analyzed samples (D). Boxes indicate the 25th and 75th percentiles, with the line across the boxes representing the medians. The whiskers and asterisks represent the 95% confidence intervals and outliers, respectively.
Ijms 23 11187 g001
Figure 2. Expression stability of eight reference genes in different oat tissues under UV-B (AC) and high-light (DF) stresses based on geNorm analysis.
Ijms 23 11187 g002
Figure 3. geNorm analysis of the pairwise variation (V) values for eight candidate reference genes under UV-B (A) and high-light (B) stresses.
Ijms 23 11187 g003
Figure 4. Relative expression level of PAL in the stems and leaves under UV-B stress (A,B) and the roots and leaves under high-light stress (C,D) when the most and least stably expressed reference genes were used for normalization.
Ijms 23 11187 g004
Table 1. Details of the primer sequences of candidate reference genes used in qRT–PCR analysis.
Gene SymbolGene NamePrimers
(Forward/Reverse, 5′-3′)
Tm
(°C)
Amplicon Length (bp)qRT–PCR
Efficiency (%)
SUOXsulfite oxidaseGAGCCTCATCGATCTGCGTT80.08132103.420.9935
ATTCACGAGGCCACTGATGG
VBPvictorin binding proteinCCGTTACCTGCACAAGTTGC81.80117109.030.9971
GGATCGGTGACAGGCATCAT
Actin1actin-encodingGGTATGGTCAAGGCCGGATT87.07111101.530.9993
ATCCTTCTGTCCCATCCCGA
PSKS1protein PSK SIMULATOR 1-likeTGGAGAGTGGGCAAATACAGG81.0613692.610.9998
AAGCCACACAACAAGCTCAAG
TBP2TATA-binding protein 2-likeGTGGATCTGTTGAGGCACCC82.8812394.260.9930
ATACTCTGCATTGCGCGCTT
UBC2ubiquitin-conjugating enzyme E2ACAGCGTTCCGAGAGTTGTT82.51104109.420.9629
AAGAGTCAGCCCGAATGCAG
EF1-αelongation factor 1-alphaAGCCTGGTATGGTTGTGACC84.73147109.210.9947
GCTTGAGATCCTTCACGGCA
GAPDH1glyceraldehyde-3-phosphate dehydrogenase 1TTCTTCCTGAGTTGAACGGC82.1710298.140.9970
ATGCAGCCTTCTCGATTCTG
Table 2. Expression stability of eight candidate reference genes under UV-B and high-light stresses according to the BestKeeper analysis results.
RankUV-BHigh-LightAll Samples
RootsStemsLeavesRootsStemsLeaves
1SUOX (0.33)UBC2 (0.31)SUOX (0.39)PSKS1 (0.37)UBC2 (0.37)EF1-α (0.47)UBC2 (0.67)
2TBP2 (0.36)PSKS1 (0.58)UBC2 (0.51)UBC2 (0.41)SUOX (0.38)PSKS1 (0.49)PSKS1 (0.67)
3PSKS1 (0.36)SUOX (0.61)TBP2 (0.58)EF1-α (0.46)TBP2 (0.52)TBP2 (0.54)TBP2 (0.74)
4GAPDH1 (0.43)GAPDH1 (0.63)VBP (0.58)Actin1 (0.50)EF1-α (0.55)Actin1 (0.58)SUOX (0.96)
5VBP (0.49)TBP2 (0.67)PSKS1 (0.59)TBP2 (0.53)GAPDH1 (0.58)GAPDH1 (0.66)EF1-α (1.09)
6UBC2 (0.49)VBP (0.86)Actin1 (0.83)GAPDH1 (0.60)PSKS1 (0.62)UBC2 (0.84)GAPDH1 (1.16)
7EF1-α (0.50)EF1-α (0.93)EF1-α (1.09)VBP (0.74)VBP (0.65)VBP (0.94)VBP (1.69)
8Actin1 (0.64)Actin1 (1.03)GAPDH1 (2.02)SUOX (0.81)Actin1 (0.78)SUOX (0.98)Actin1 (2.28)
Table 3. Expression stability of eight reference genes under UV-B and high-light stresses according to the NormFinder analysis results.
RankUV-BHigh-LightAll Samples
RootsStemsLeavesRootsStemsLeaves
1EF1-α (0.26)TBP2 (0.23)VBP (0.09)PSKS1 (0.25)UBC2 (0.28)PSKS1 (0.17)PSKS1 (0.31)
2VBP (0.29)GAPDH1 (0.27)UBC2 (0.35)TBP2 (0.27)GAPDH1 (0.38)EF1-α (0.38)EF1-α (0.47)
3SUOX (0.41)SUOX (0.34)PSKS1 (0.4)EF1-α (0.32)TBP2 (0.38)TBP2 (0.39)TBP2 (0.71)
4TBP2 (0.45)PSKS1 (0.48)TBP2 (0.44)UBC2 (0.42)EF1-α (0.39)GAPDH1 (0.43)UBC2 (0.83)
5GAPDH1 (0.55)VBP (0.49)SUOX (0.46)GAPDH1 (0.49)SUOX (0.40)UBC2 (0.66)SUOX (1.31)
6Actin1 (0.58)UBC2 (0.56)Actin1 (0.78)VBP (0.52)VBP (0.42)Actin1 (0.80)GAPDH1 (1.35)
7PSKS1 (0.61)EF1-α (0.56)EF1-α (0.81)Actin1 (0.72)PSKS1 (0.42)VBP (0.81)Actin1 (2.27)
8UBC2 (0.62)Actin1 (0.71)GAPDH1 (2.73)SUOX (0.85)Actin1 (0.65)SUOX (1.30)VBP (2.40)
Table 4. Comprehensive stability rankings of eight candidate reference genes.
RankUV-BHigh-LightAll Samples
RootsStemsLeavesRootsStemsLeaves
1EF1-α (1.63)TBP2 (1.5)PSKS1 (1.97)PSKS1 (1)UBC2 (1.32)PSKS1 (1.19)PSKS1 (1.19)
2VBP (2.11)GAPDH1 (2)VBP (2.21)TBP2 (2.11)GAPDH1 (3.16)EF1-α (1.41)UBC2 (2)
3SUOX (2.45)SUOX (3)TBP2 (2.45)UBC2 (3.13)SUOX (3.56)TBP2 (3)EF1-α (2.99)
4TBP2 (3.56)UBC2 (3.46)UBC2 (2.99)EF1-α (3.22)TBP2 (3.57)GAPDH1 (4.23)TBP2 (3)
5Actin1 (5.18)PSKS1 (3.56)SUOX (3.16)GAPDH1 (5.23)VBP (3.98)Actin1 (5.18)SUOX (4.73)
6GAPDH1 (5.18)VBP (5.48)Actin1 (6)Actin1 (6.09)PSKS1 (4.14)UBC2 (5.48)GAPDH1 (6)
7PSKS1 (5.66)EF1-α (7)EF1-α (7)VBP (6.24)EF1-α (4.87)VBP (7)Actin1 (7.24)
8UBC2 (7.44)Actin1 (8)GAPDH1 (8)SUOX (8)Actin1 (8)SUOX (8)VBP (7.74)
Publisher’s Note: MDPI stays neutral with regard to jurisdictional claims in published maps and institutional affiliations.

