
Consequences of Autophagy Deletion on the Age-Related Changes in the Epidermal Lipidome of Mice

 , , and
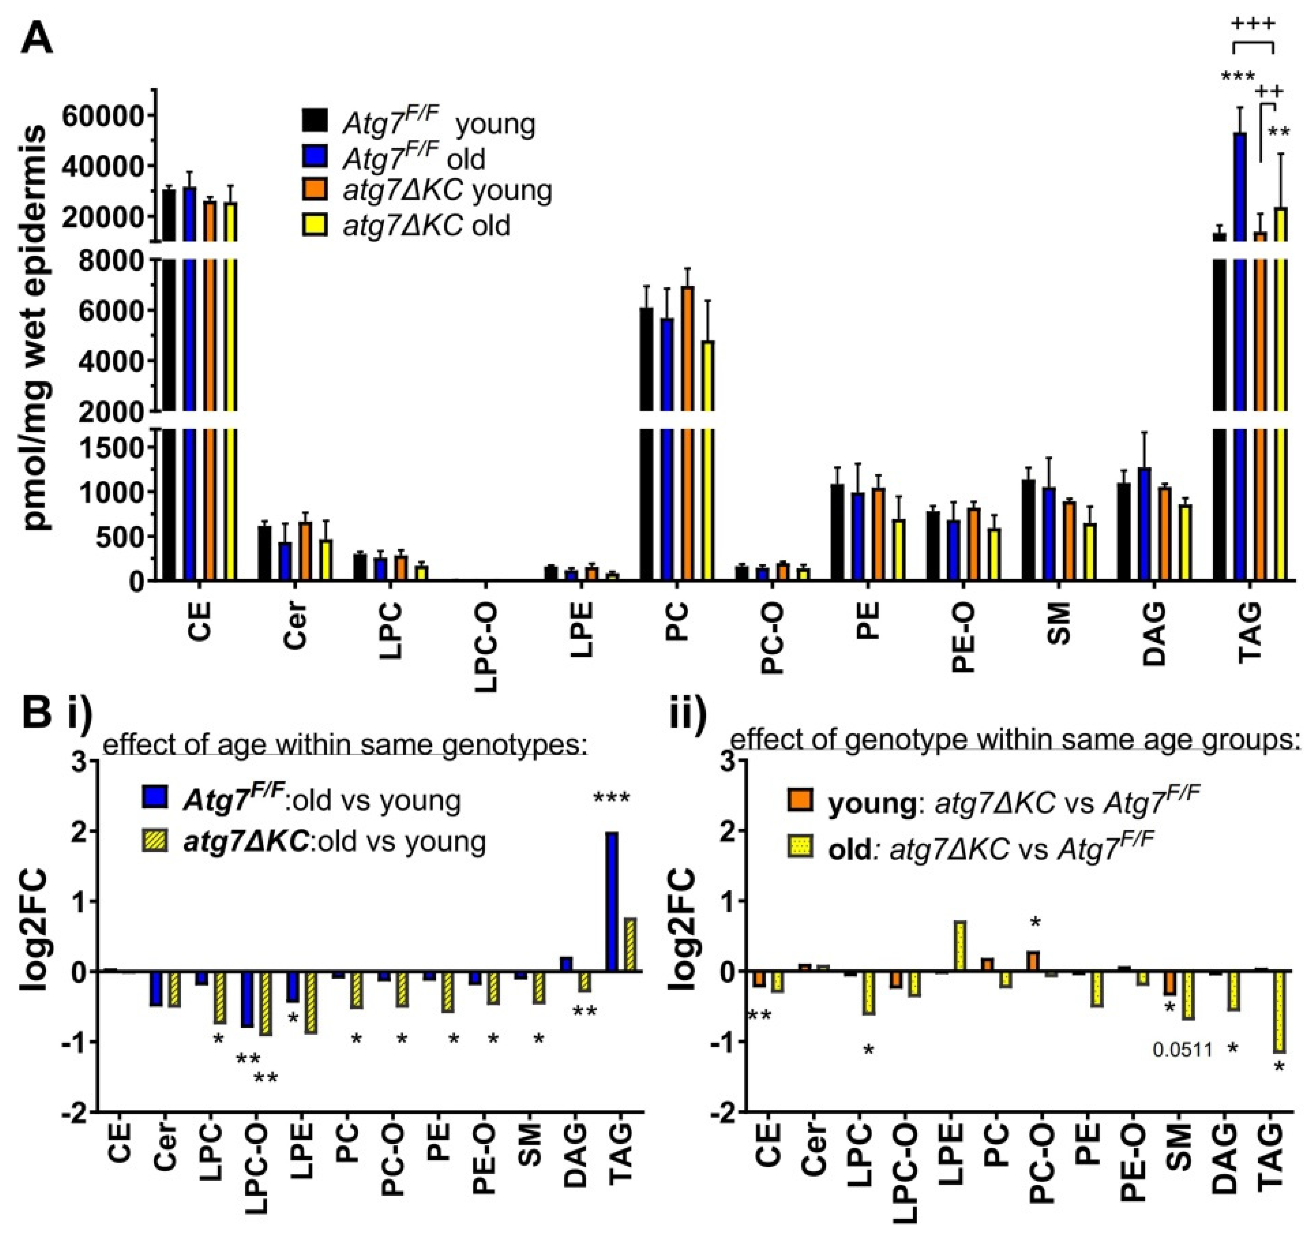
Abstract
1. Introduction
2. Results
2.1. Aged Autophagy Deficient Epidermis Accumulates Less TAG than Aged Autophagy Competent Epidermis and Shows Dysregulation of Other Lipid Classes
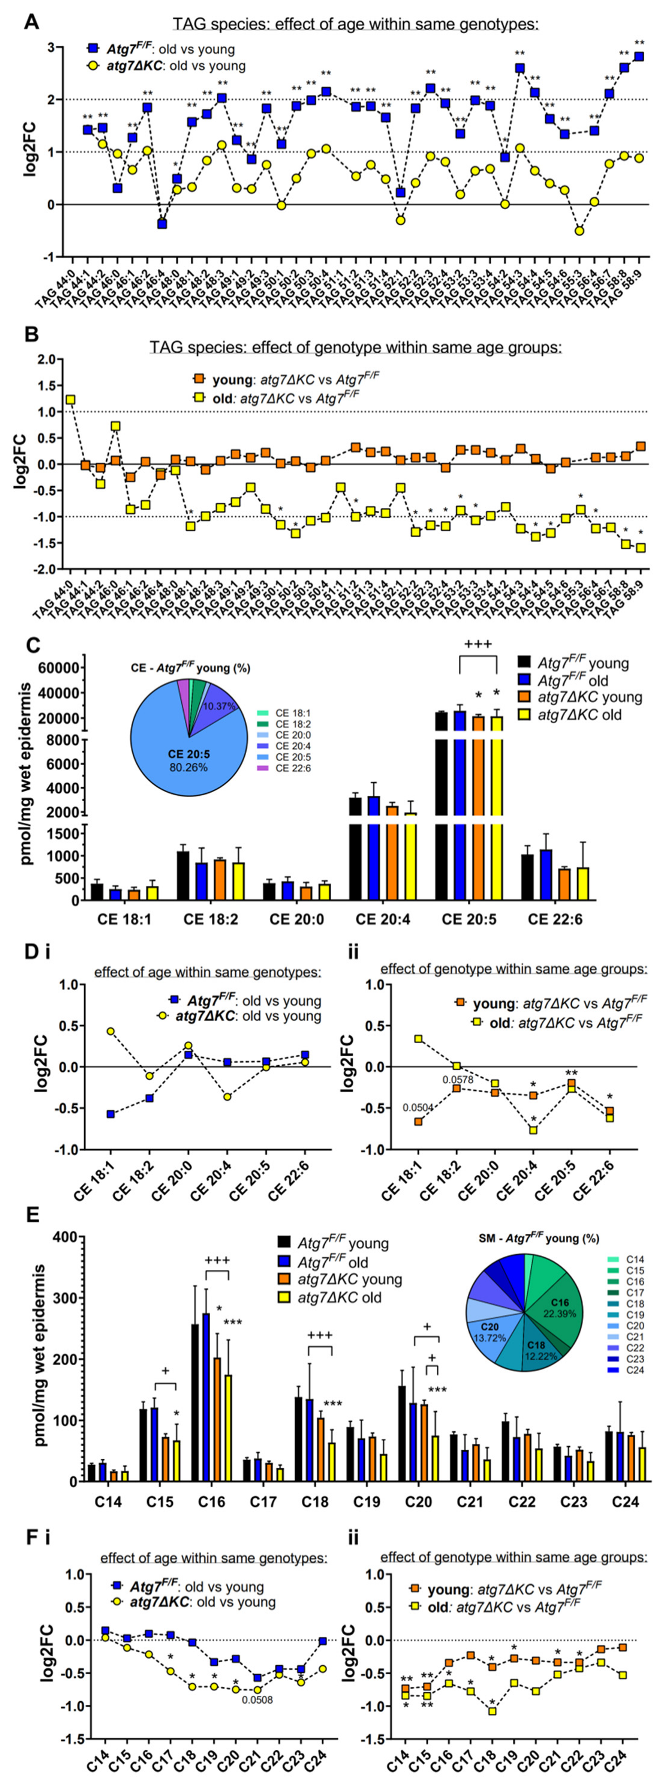
2.2. Autophagy Deficiency Decreases TAG Unselectively but Leads to Selective Reduction of Epidermal CE-Esterified with Long Chain PUFA and to Reduced Abundance of SM Species
2.3. Autophagy Deficiency Affects Transcription of Lipid/Fatty Acid Transporters and Inflammatory Genes in Cultured Keratinocytes
2.4. Fatty Acid Binding Protein 5 (FABP5) Expression Is Strongly Reduced in the Epidermis of Old atg7ΔKC
3. Discussion
3.1. Autophagy in Ageing
3.2. Autophagy and Lipid Homeostasis—Triglycerides
3.3. Autophagy and Lipid Homeostasis—Cholesterol Esters and Sphingomyelins
4. Materials and Methods
4.1. Atg7F/F and atg7ΔKC Mice
4.2. Lipid Extraction
4.3. Lipidomics Analysis
4.4. Primary Keratinocyte Culture from Mouse Tail
4.5. RNA Isolation, RNA Sequencing (RNA seq) and Heat Map Generation
4.6. Immunofluorescent Staining and Microscopy
Supplementary Materials
Author Contributions
Funding
Institutional Review Board Statement
Informed Consent Statement
Data Availability Statement
Acknowledgments
Conflicts of Interest
References
- Yu, L.; Chen, Y.; Tooze, S.A. Autophagy pathway: Cellular and molecular mechanisms. Autophagy 2018, 14, 207–215. [Google Scholar] [CrossRef] [PubMed]
- Lahiri, V.; Hawkins, W.D.; Klionsky, D.J. Autophagic Mechanisms that Modulate Metabolism. Cell Metab. 2019, 29, 803–826. [Google Scholar] [CrossRef] [PubMed]
- Klionsky, D.J.; Petroni, G.; Amaravadi, R.K.; Baehrecke, E.H.; Ballabio, A.; Boya, P.; Bravo-San Pedro, J.M.; Cadwell, K.; Cecconi, F.; Choi, A.M.K.; et al. Autophagy in major human diseases. EMBO J. 2021, 40, e108863. [Google Scholar] [CrossRef] [PubMed]
- Levine, B.; Kroemer, G. Biological Functions of Autophagy Genes: A Disease Perspective. Cell 2019, 176, 11–42. [Google Scholar] [CrossRef] [PubMed]
- Kroemer, G.J. Autophagy: A druggable process that is deregulated in aging and human disease. Clin. Investig. 2015, 125, 1–4. [Google Scholar] [CrossRef]
- Eckhart, L.; Tschachler, E.; Gruber, F. Autophagic Control of Skin Aging. Front. Cell Dev. Biol. 2019, 7, 143. [Google Scholar] [CrossRef]
- McGrath, J.A.; Uitto, J. Rook’s Textbook of Dermatology, 9th ed.; John Wiley & Sons, Ltd.: Hoboken, NJ, USA, 2016; pp. 1–52. ISBN 9781118441213. [Google Scholar]
- Haruna, K.; Suga, Y.; Muramatsu, S.; Taneda, K.; Mizuno, Y.; Ikeda, S.; Ueno, T.; Kominami, E.; Tanida, I.; Tanida, I.; et al. Differentiation-specific expression and localization of an autophagosomal marker protein (LC3) in human epidermal keratinocytes. Dermatol. Sci. 2008, 52, 213–215. [Google Scholar] [CrossRef]
- Rossiter, H.; Konig, U.; Barresi, C.; Buchberger, M.; Ghannadan, M.; Zhang, C.F.; Mlitz, V.; Gmeiner, R.; Sukseree, S.; Fodinger, D.; et al. Epidermal keratinocytes form a functional skin barrier in the absence of Atg7 dependent autophagy. J. Dermatol. Sci. 2013, 71, 67–75. [Google Scholar] [CrossRef]
- Akinduro, O.; Sully, K.; Patel, A.; Robinson, D.J.; Chikh, A.; McPhail, G.; Braun, K.M.; Philpott, M.P.; Harwood, C.A.; Byrne, C.; et al. Constitutive Autophagy and Nucleophagy during Epidermal Differentiation. J. Investig. Dermatol. 2016, 136, 1460–1470. [Google Scholar] [CrossRef]
- Rossiter, H.; Stubiger, G.; Groger, M.; Konig, U.; Gruber, F.; Sukseree, S.; Mlitz, V.; Buchberger, M.; Oskolkova, O.; Bochkov, V.; et al. Autophagy protects murine preputial glands against premature aging, and controls their sebum phospholipid and pheromone profile. Exp. Dermatol. 2018, 27, 1142–1151. [Google Scholar] [CrossRef]
- Singh, R.; Kaushik, S.; Wang, Y.; Xiang, Y.; Novak, I.; Komatsu, M.; Tanaka, K.; Cuervo, A.M.; Czaja, M.J. Autophagy regulates lipid metabolism. Nature 2009, 458, 1131–1135. [Google Scholar] [CrossRef] [PubMed]
- Lettieri, B.D.; Tatulli, G.; Aquilano, K.; Ciriolo, M.R. FoxO1 controls lysosomal acid lipase in adipocytes: Implication of lipophagy during nutrient restriction and metformin treatment. Cell Death Dis. 2013, 4, e861. [Google Scholar] [CrossRef] [PubMed]
- Ouimet, M.; Marcel, Y.L. Regulation of lipid droplet cholesterol efflux from macrophage foam cells. Arterioscler. Thromb. Vasc. Biol. 2012, 32, 575–581. [Google Scholar] [CrossRef] [PubMed]
- Zhang, X.; Evans, T.D.; Jeong, S.J.; Razani, B. Classical and alternative roles for autophagy in lipid metabolism. Curr. Opin. Lipidol. 2018, 29, 203–211. [Google Scholar] [CrossRef]
- Zhao, Y.; Zhang, C.F.; Rossiter, H.; Eckhart, L.; Konig, U.; Karner, S.; Mildner, M.; Bochkov, V.N.; Tschachler, E.; Gruber, F.J. Autophagy Is Induced by UVA and Promotes Removal of Oxidized Phospholipids and Protein Aggregates in Epidermal Keratinocytes. IJ. Investig. Dermatol. 2013, 133, 1629–1637. [Google Scholar] [CrossRef]
- Song, X.; Narzt, M.S.; Nagelreiter, I.M.; Hohensinner, P.; Terlecki-Zaniewicz, L.; Tschachler, E.; Grillari, J.; Gruber, F. Autophagy deficient keratinocytes display increased DNA damage, senescence and aberrant lipid composition after oxidative stress in vitro and in vivo. Redox. Biol. 2017, 11, 219–230. [Google Scholar] [CrossRef]
- Sukseree, S.; László, L.; Gruber, F.; Bergmann, S.; Narzt, M.S.; Nagelreiter, I.M.; Höftberger, R.; Molnár, K.; Rauter, G.; Birngruber, T.; et al. Filamentous Aggregation of Sequestosome-1/p62 in Brain Neurons and Neuroepithelial Cells upon Tyr-Cre-Mediated Deletion of the Autophagy Gene Atg7. Mol. Neurobiol. 2018, 55, 8425–8437. [Google Scholar] [CrossRef]
- Uchida, Y.; Hara, M.; Nishio, H.; Sidransky, E.; Inoue, S.; Otsuka, F.; Suzuki, A.; Elias, P.M.; Holleran, W.M.; Hamanaka, S.J. Epidermal sphingomyelins are precursors for selected stratum corneum ceramides. Lipid. Res. 2000, 41, 2071–2082. [Google Scholar] [CrossRef]
- Zhao, Y.; Li, M.C.; Konate, M.M.; Chen, L.; Das, B.; Karlovich, C.; Williams, P.M.; Evrard, Y.A.; Doroshow, J.H.; McShane, L.M. TPM, FPKM, or Normalized Counts? A Comparative Study of Quantification Measures for the Analysis of RNA-seq Data from the NCI Patient-Derived Models Repository. J. Transl. Med. 2021, 19, 269. [Google Scholar] [CrossRef]
- Xu, B.; Chen, L.; Zhan, Y.; Marquez, K.N.S.; Zhuo, L.; Qi, S.; Zhu, J.; He, Y.; Chen, X.; Zhang, H.; et al. The Biological Functions and Regulatory Mechanisms of Fatty Acid Binding Protein 5 in Various Diseases. Front. Cell Dev. Biol. 2022, 10, 857919. [Google Scholar] [CrossRef]
- Grehan, S.; Allan, C.; Tse, E.; Walker, D.; Taylor, J.M. Expression of the apolipoprotein E gene in the skin is controlled by a unique downstream enhancer. J. Investig. Dermatol. 2001, 116, 77–84. [Google Scholar] [CrossRef] [PubMed]
- Petri, B.; Sanz, M.J. Neutrophil chemotaxis. Cell Tissue Res. 2018, 371, 425–436. [Google Scholar] [CrossRef] [PubMed]
- Van Belle, A.B.; Cochez, P.M.; de Heusch, M.; Pointner, L.; Opsomer, R.; Raynaud, P.; Achouri, Y.; Hendrickx, E.; Cheou, P.; Warnier, G.; et al. IL-24 contributes to skin inflammation in Para-Phenylenediamine-induced contact hypersensitivity. Sci. Rep. 2019, 9, 1852. [Google Scholar] [CrossRef] [PubMed]
- Ren, K.; Xia, Y.J. Lipocalin 2 Participates in the Epidermal Differentiation and Inflammatory Processes of Psoriasis. Inflamm. Res. 2022, 15, 2157–2166. [Google Scholar] [CrossRef] [PubMed]
- Murase, D.; Kusaka-Kikushima, A.; Hachiya, A.; Fullenkamp, R.; Stepp, A.; Imai, A.; Ueno, M.; Kawabata, K.; Takahashi, Y.; Hase, T.; et al. Autophagy Declines with Premature Skin Aging resulting in Dynamic Alterations in Skin Pigmentation and Epidermal Differentiation. Int. J. Mol. Sci. 2020, 21, 5708. [Google Scholar] [CrossRef] [PubMed]
- Deruy, E.; Gosselin, K.; Vercamer, C.; Martien, S.; Bouali, F.; Slomianny, C.; Bertout, J.; Bernard, D.; Pourtier, A.; Abbadie, C. MnSOD Upregulation Induces Autophagic Programmed Cell Death in Senescent Keratinocytes. PLoS ONE 2010, 5, e12712. [Google Scholar] [CrossRef]
- Wang, A.S.; Dreesen, O. Biomarkers of Cellular Senescence and Skin Aging. Front. Genet. 2018, 9, 247. [Google Scholar] [CrossRef]
- Dumit, V.I.; Kuttner, V.; Kappler, J.; Piera-Velazquez, S.; Jimenez, S.A.; Bruckner-Tuderman, L.; Uitto, J.; Dengjel, J. Altered MCM protein levels and autophagic flux in aged and systemic sclerosis dermal fibroblasts. J. Investig. Dermatol. 2014, 134, 2321–2330. [Google Scholar] [CrossRef]
- Kim, H.S.; Park, S.Y.; Moon, S.H.; Lee, J.D.; Kim, S. Autophagy in Human Skin Fibroblasts: Impact of Age. Int. J. Mol. Sci. 2018, 19, 2254. [Google Scholar] [CrossRef]
- Rambold, A.S.; Cohen, S.; Lippincott-Schwartz, J. Fatty acid trafficking in starved cells: Regulation by lipid droplet lipolysis, autophagy, and mitochondrial fusion dynamics. Dev. Cell 2015, 32, 678–692. [Google Scholar] [CrossRef]
- Nguyen, T.B.; Louie, S.M.; Daniele, J.R.; Tran, Q.; Dillin, A.; Zoncu, R.; Nomura, D.K.; Olzmann, J.A. DGAT1-Dependent Lipid Droplet Biogenesis Protects Mitochondrial Function during Starvation-Induced Autophagy. Dev. Cell 2017, 42, 9–21. [Google Scholar] [CrossRef] [PubMed]
- Martinez, J.; Malireddi, R.K.; Lu, Q.; Cunha, L.D.; Pelletier, S.; Gingras, S.; Orchard, R.; Guan, J.L.; Tan, H.; Peng, J.; et al. Molecular characterization of LC3-associated phagocytosis reveals distinct roles for Rubicon, NOX2 and autophagy proteins. Nat. Cell Biol. 2015, 17, 893–906. [Google Scholar] [CrossRef] [PubMed]
- Altamimi, T.R.; Chowdhury, B.; Singh, K.K.; Zhang, L.; Mahmood, M.U.; Pan, Y.; Quan, A.; Teoh, H.; Verma, S.; Lopaschuk, G.D. A novel role of endothelial autophagy as a regulator of myocardial fatty acid oxidation. J. Thorac. Cardiovasc. Surg. 2019, 157, 185–193. [Google Scholar] [CrossRef] [PubMed]
- Huang, Y.; Mahley, R.W. Apolipoprotein E: Structure and function in lipid metabolism, neurobiology, and Alzheimer’s diseases. Neurobiol. Dis. 2014, 72 Pt A, 3–12. [Google Scholar] [CrossRef]
- Elshourbagy, N.A.; Liao, W.S.; Mahley, R.W.; Taylor, J.M. Apolipoprotein E mRNA is abundant in the brain and adrenals, as well as in the liver, and is present in other peripheral tissues of rats and marmosets. Proc. Natl. Acad. Sci. USA 1985, 82, 203–207. [Google Scholar] [CrossRef]
- Harvald, E.B.; Olsen, A.S.; Faergeman, N.J. Autophagy in the light of sphingolipid metabolism. Apoptosis. 2015, 20, 658–670. [Google Scholar] [CrossRef]
- Grosch, S.; Schiffmann, S.; Geisslinger, G. Chain length-specific properties of ceramides. Prog. Lipid Res. 2012, 51, 50–62. [Google Scholar] [CrossRef]
- Separovic, D.; Kelekar, A.; Nayak, A.K.; Tarca, A.L.; Hanada, K.; Pierce, J.S.; Bielawski, J. Increased ceramide accumulation correlates with downregulation of the autophagy protein ATG-7 in MCF-7 cells sensitized to photodamage. Arch. Biochem. Biophys. 2010, 494, 101–105. [Google Scholar] [CrossRef]
- Borodzicz, S.; Rudnicka, L.; Mirowska-Guzel, D.; Cudnoch-Jedrzejewska, A. The role of epidermal sphingolipids in dermatologic diseases. Lipids Health Dis. 2016, 15, 13. [Google Scholar] [CrossRef]
- Leidal, A.M.; Huang, H.H.; Marsh, T.; Solvik, T.; Zhang, D.; Ye, J.; Kai, F.; Goldsmith, J.; Liu, J.Y.; Huang, Y.H.; et al. The LC3-conjugation machinery specifies the loading of RNA-binding proteins into extracellular vesicles. Nat. Cell Biol. 2020, 22, 187–199. [Google Scholar] [CrossRef]
- Armstrong, E.H.; Goswami, D.; Griffin, P.R.; Noy, N.; Ortlund, E.A. Structural Basis for Ligand Regulation of the Fatty Acid-binding Protein 5, Peroxisome Proliferator-activated Receptor β/δ (FABP5-PPARβ/δ) Signaling Pathway. J. Biol. Chem. 2014, 289, 14941–14954. [Google Scholar] [CrossRef] [PubMed]
- Zhang, Y.; Li, Q.; Rao, E.; Sun, Y.; Grossmann, M.E.; Morris, R.J.; Cleary, M.P.; Li, B. Epidermal Fatty Acid binding protein promotes skin inflammation induced by high-fat diet. Immunity 2015, 42, 953–964. [Google Scholar] [CrossRef] [PubMed]
- Ni, C.; Narzt, M.S.; Nagelreiter, I.M.; Zhang, C.F.; Larue, L.; Rossiter, H.; Grillari, J.; Tschachler, E.; Gruber, F. Autophagy deficient melanocytes display a senescence associated secretory phenotype that includes oxidized lipid mediators. Int. J. Biochem. Cell Biol. 2016, 81, 375–382. [Google Scholar] [CrossRef]
- Hohoff, C.; Borchers, T.; Rustow, B.; Spener, F.; van Tilbeurgh, H. Expression, Purification, and Crystal Structure Determination of Recombinant Human Epidermal-Type Fatty Acid Binding Protein. Biochemistry 1999, 38, 12229–12239. [Google Scholar] [CrossRef]
- Martin, M. Cutadapt removes adapter sequences from high-throughput sequencing reads. EMBnet J. 2011, 17, 10. [Google Scholar] [CrossRef]
- Dobin, A.; Davis, C.A.; Schlesinger, F.; Drenkow, J.; Zaleski, C.; Jha, S.; Batut, P.; Chaisson, M.; Gingeras, T.R. STAR: Ultrafast universal RNA-seq aligner. Bioinformatics 2013, 29, 15–21. [Google Scholar] [CrossRef]
- Love, M.I.; Huber, W.; Anders, S. Moderated estimation of fold change and dispersion for RNA-seq data with DESeq2. Genome Biol. 2014, 15, 550. [Google Scholar] [CrossRef] [PubMed]


Publisher’s Note: MDPI stays neutral with regard to jurisdictional claims in published maps and institutional affiliations. |
© 2022 by the authors. Licensee MDPI, Basel, Switzerland. This article is an open access article distributed under the terms and conditions of the Creative Commons Attribution (CC BY) license (https://creativecommons.org/licenses/by/4.0/).
Share and Cite
Yang, Y.; Kremslehner, C.; Derdak, S.; Bauer, C.; Jelleschitz, S.; Nagelreiter, I.-M.; Rossiter, H.; Narzt, M.S.; Gruber, F.; Sochorová, M. Consequences of Autophagy Deletion on the Age-Related Changes in the Epidermal Lipidome of Mice. Int. J. Mol. Sci. 2022, 23, 11110. https://doi.org/10.3390/ijms231911110
Yang Y, Kremslehner C, Derdak S, Bauer C, Jelleschitz S, Nagelreiter I-M, Rossiter H, Narzt MS, Gruber F, Sochorová M. Consequences of Autophagy Deletion on the Age-Related Changes in the Epidermal Lipidome of Mice. International Journal of Molecular Sciences. 2022; 23(19):11110. https://doi.org/10.3390/ijms231911110
Chicago/Turabian StyleYang, Yiwen, Christopher Kremslehner, Sophia Derdak, Christina Bauer, Sarah Jelleschitz, Ionela-Mariana Nagelreiter, Heidemarie Rossiter, Marie Sophie Narzt, Florian Gruber, and Michaela Sochorová. 2022. "Consequences of Autophagy Deletion on the Age-Related Changes in the Epidermal Lipidome of Mice" International Journal of Molecular Sciences 23, no. 19: 11110. https://doi.org/10.3390/ijms231911110
APA StyleYang, Y., Kremslehner, C., Derdak, S., Bauer, C., Jelleschitz, S., Nagelreiter, I.-M., Rossiter, H., Narzt, M. S., Gruber, F., & Sochorová, M. (2022). Consequences of Autophagy Deletion on the Age-Related Changes in the Epidermal Lipidome of Mice. International Journal of Molecular Sciences, 23(19), 11110. https://doi.org/10.3390/ijms231911110