
Immune State Conversion of the Mesenteric Lymph Node in a Mouse Breast Cancer Model
 , , , and
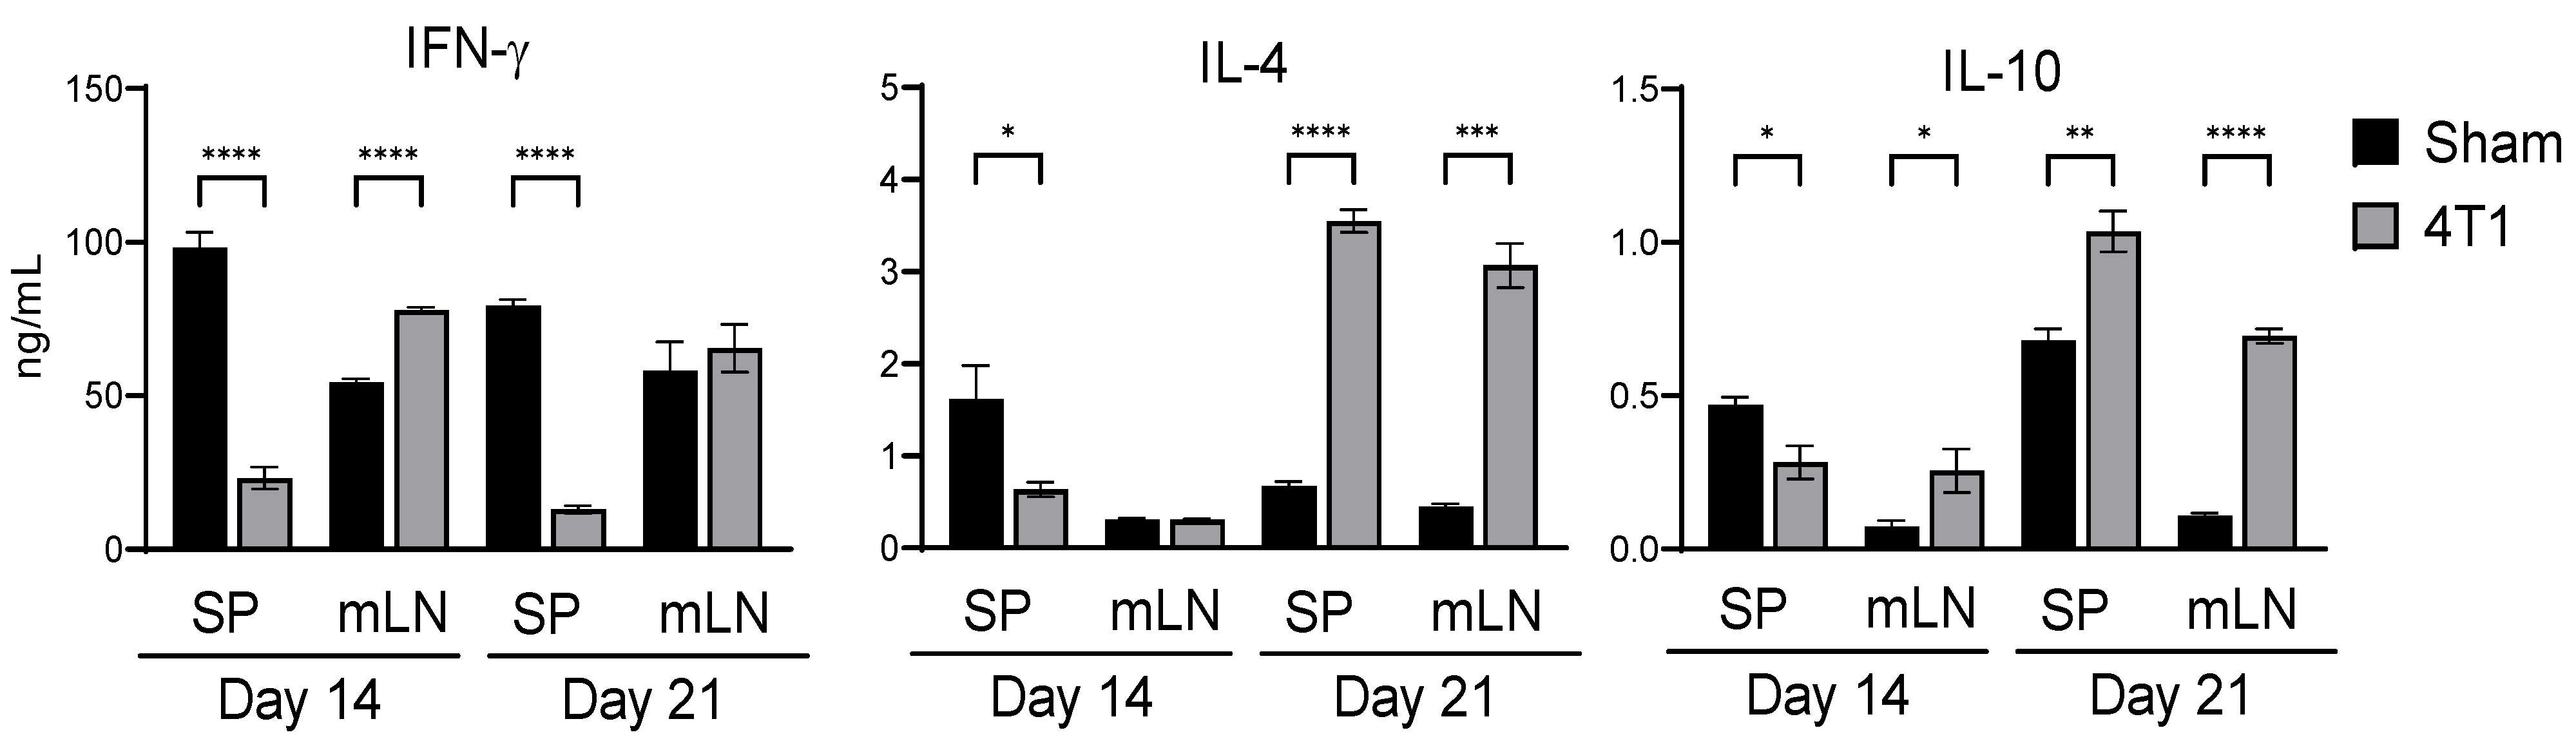
Abstract
1. Introduction
2. Materials and Methods
2.1. Reagents and Monoclonal Antibodies (mAbs)
2.2. Animals
2.3. Tumor Cell Cultures
2.4. Tumor Cell Implantations
2.5. Splenocyte and mLN Cultures and the Assays for Cytokine Levels
2.6. Flow Cytometry
2.7. Gut Permeability Test
2.8. Statistical Analyses
3. Results
3.1. Intestinal Immunity Is Affected by Subcutaneous Inoculation in 4T1 Tumor
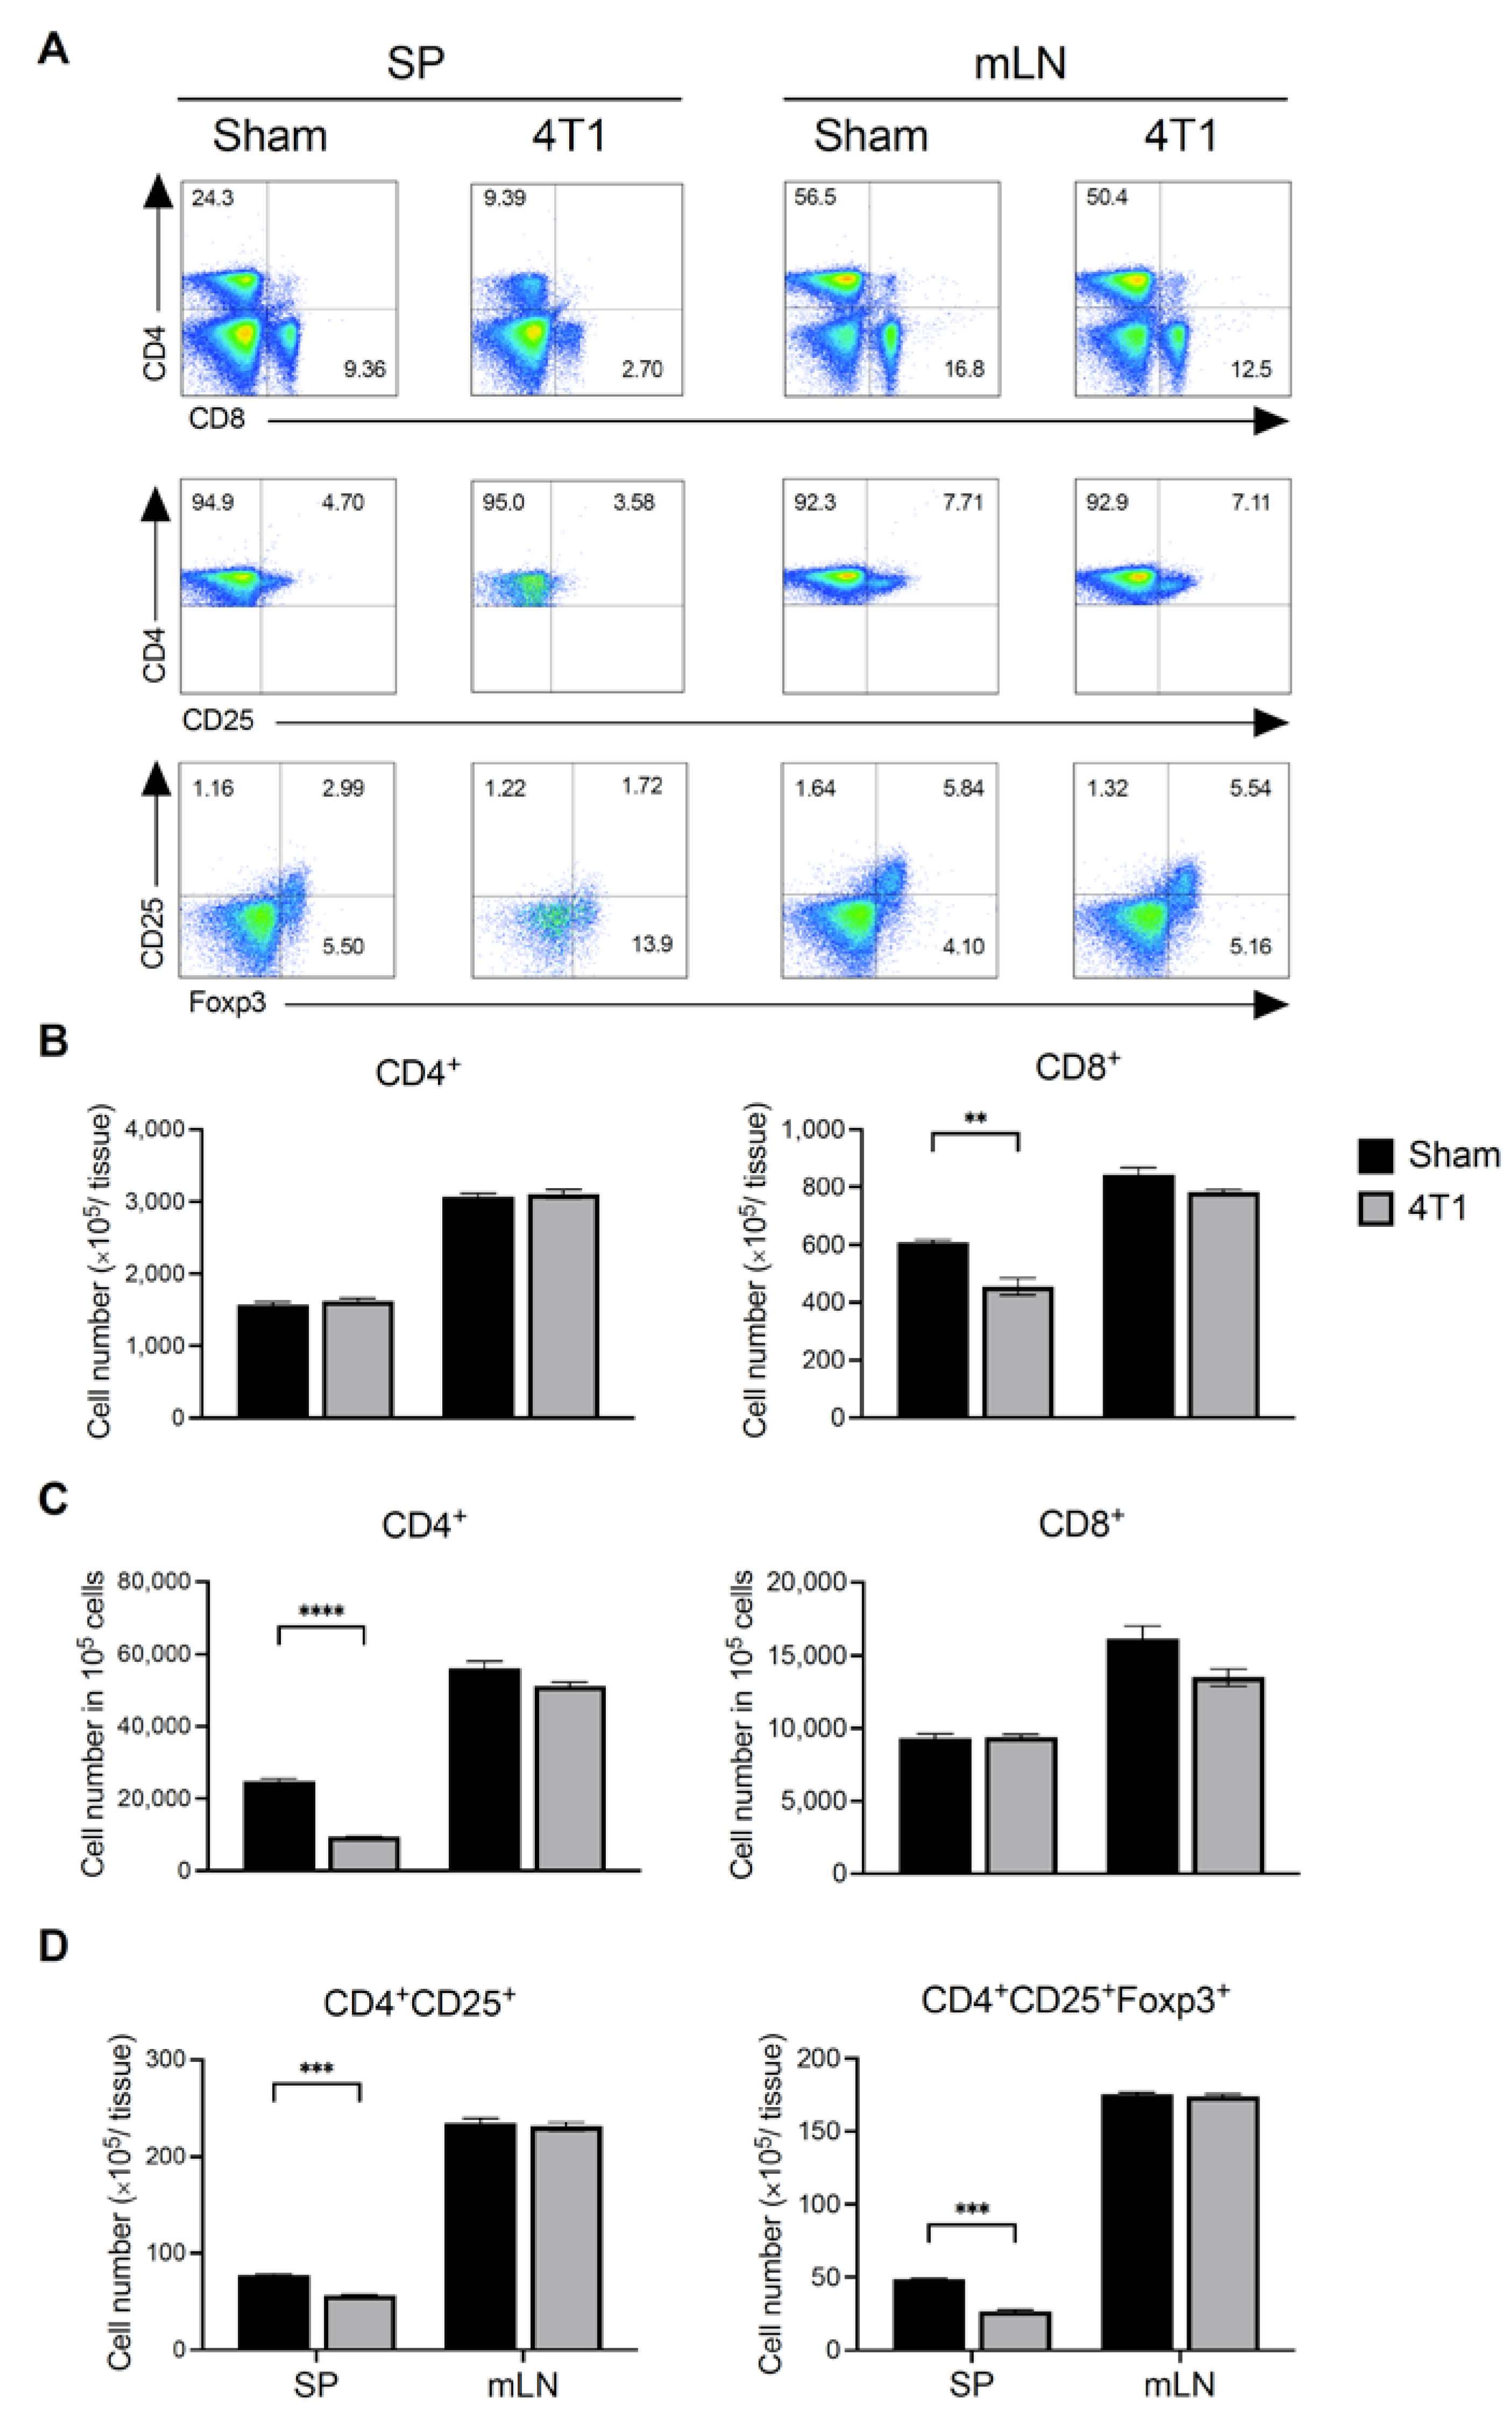
3.2. Breast Cancer Formation Does Not Affect T Cell Number in mLN
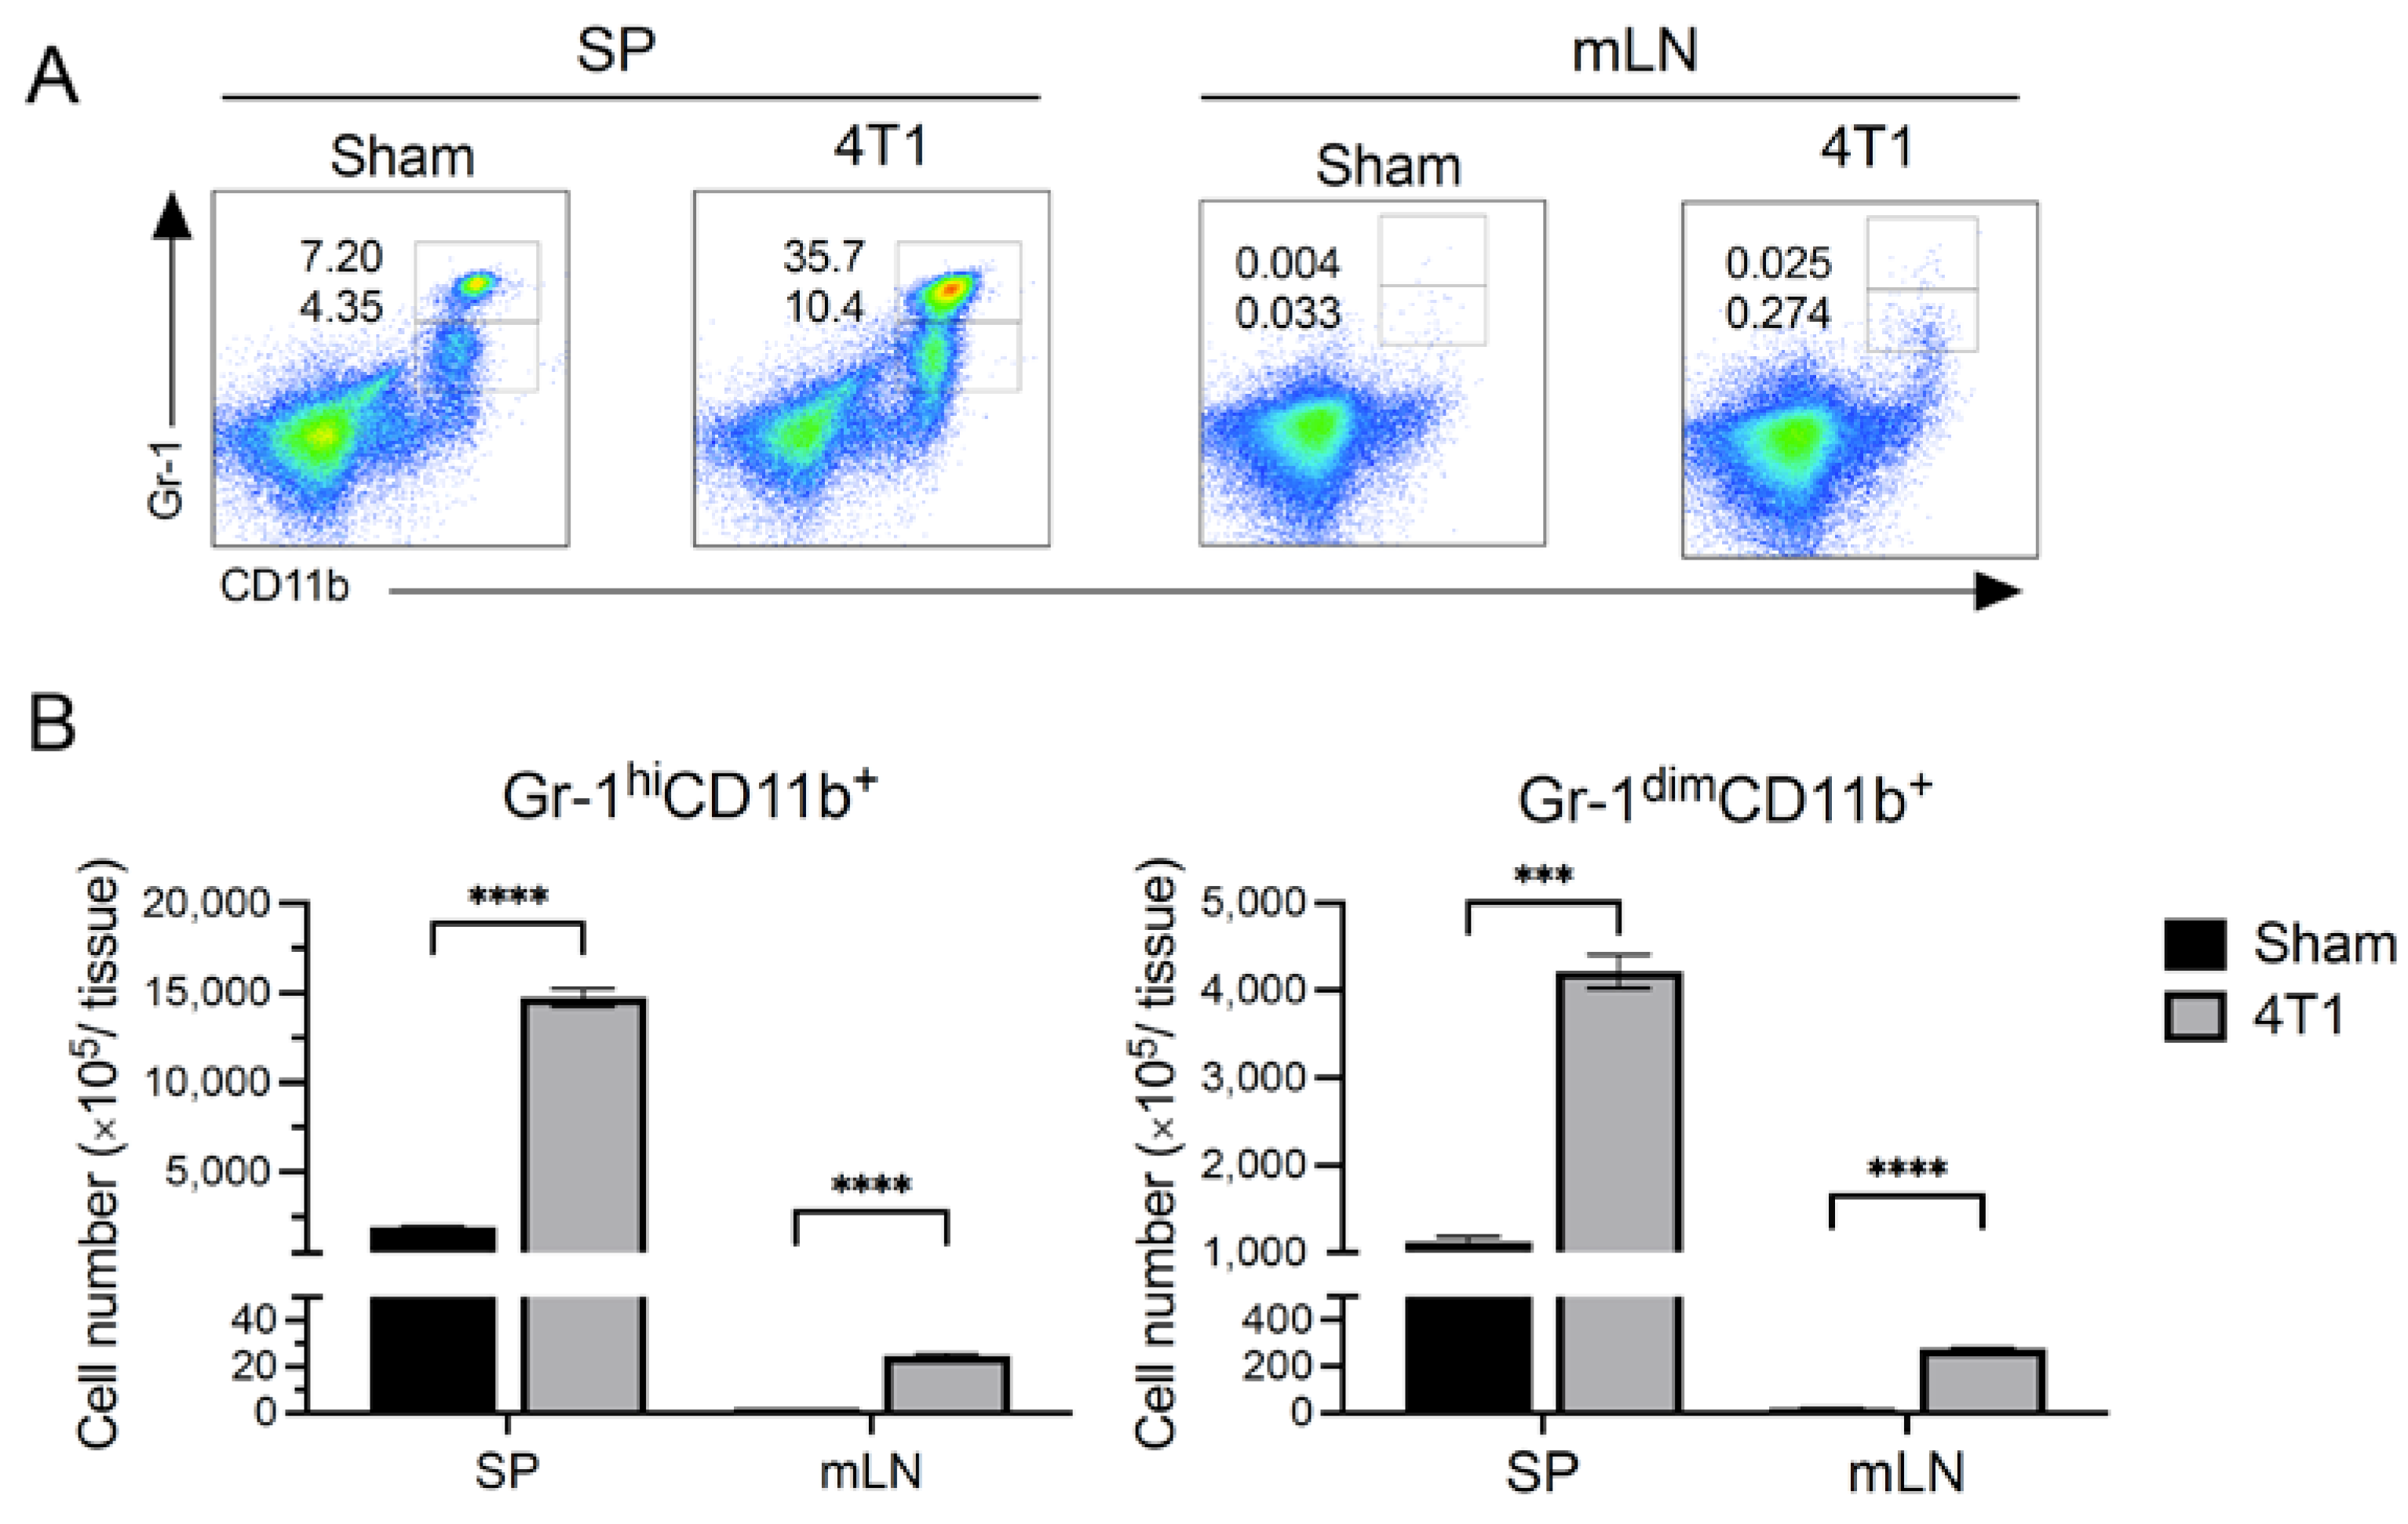
3.3. MDSCs Increased in Spleen but Not in mLN after Tumor Inoculation
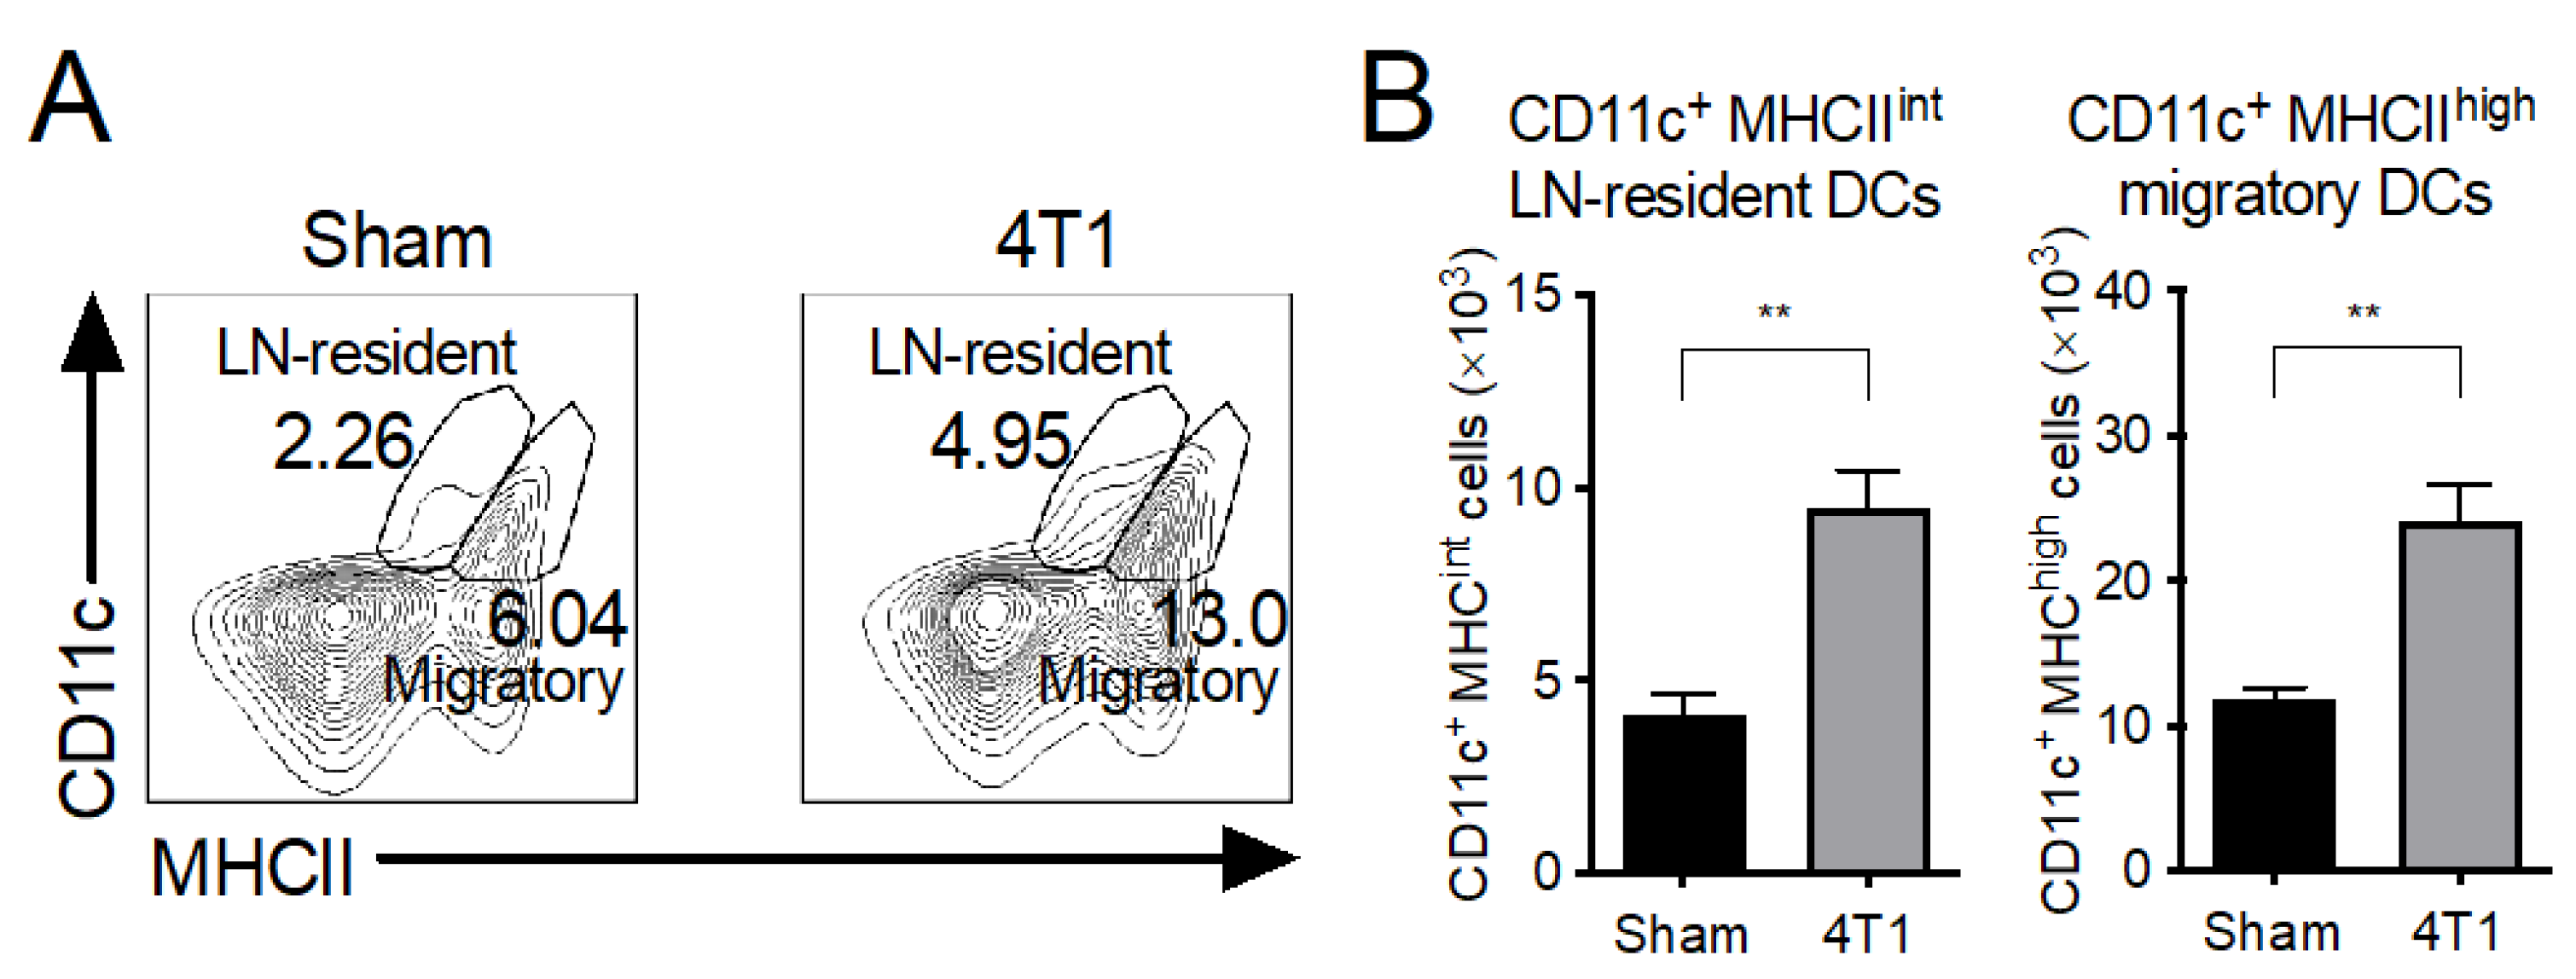
3.4. Both LN-Resident and Migratory DC Subsets Increase in mLNs of 4T1 Tumor-Inoculated Mice
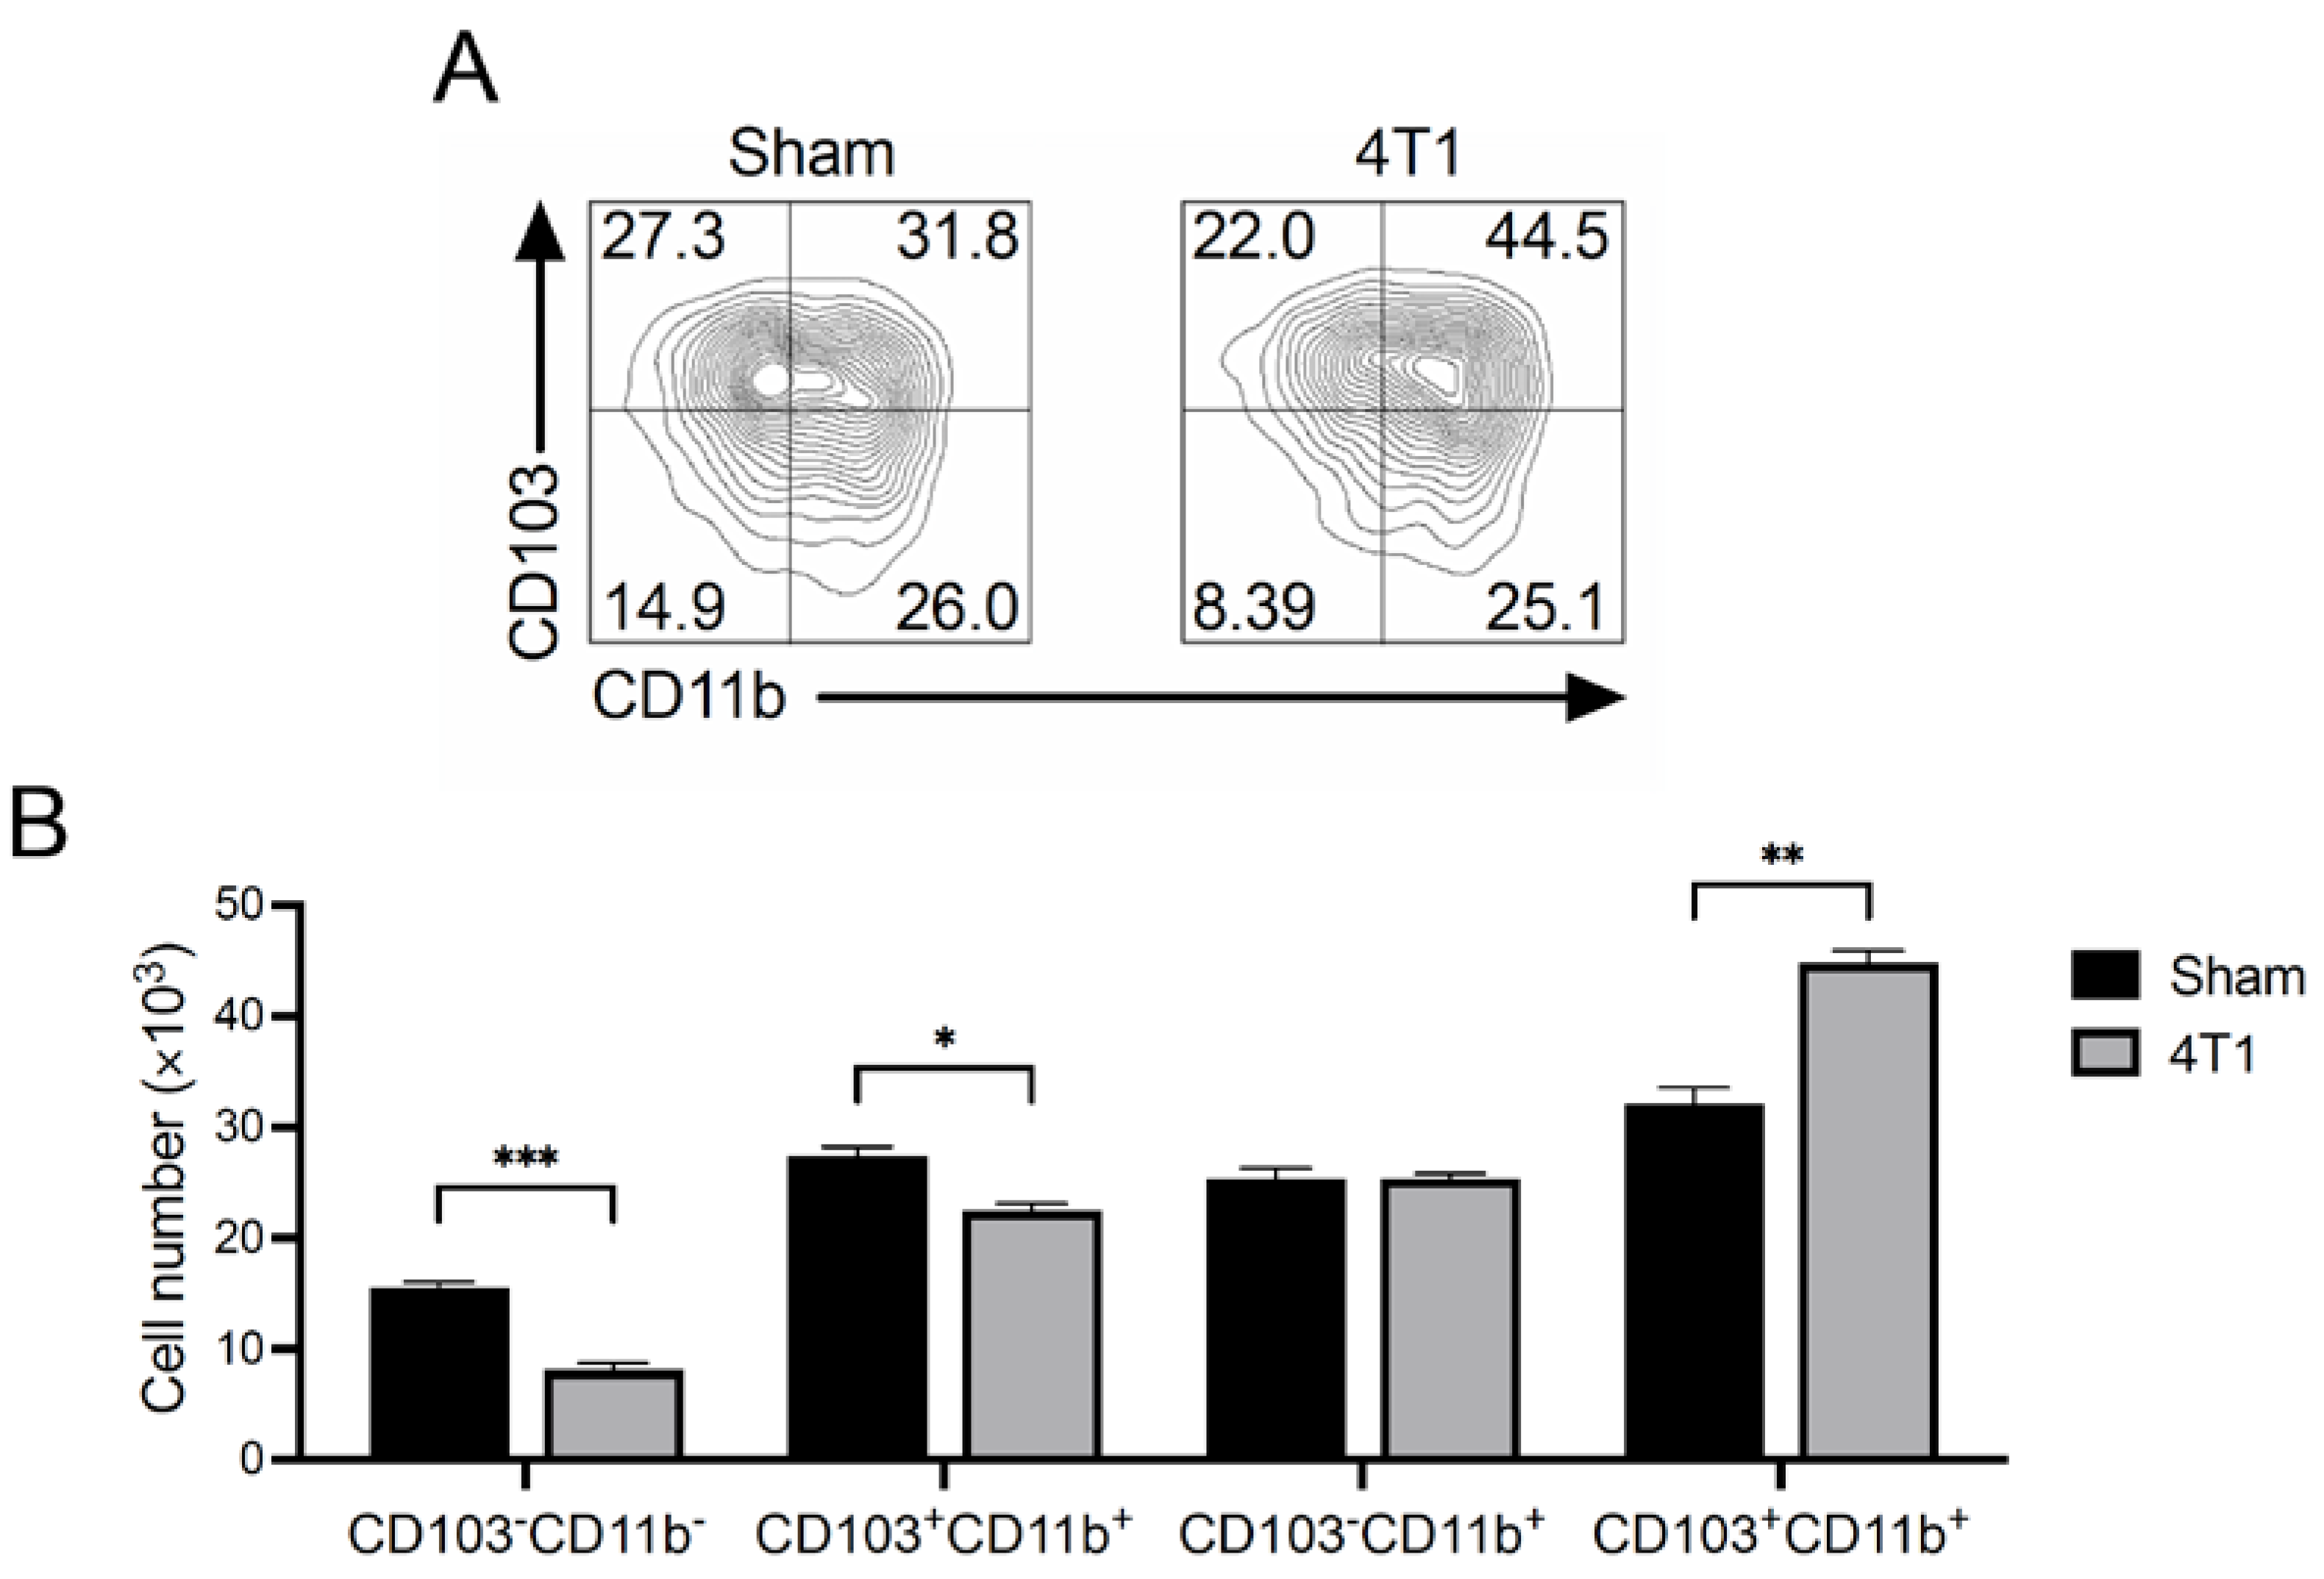
3.5. CD103+CD11b+ Migratory DCs Increase in mLNs of 4T1 Tumor-Inoculated Mice
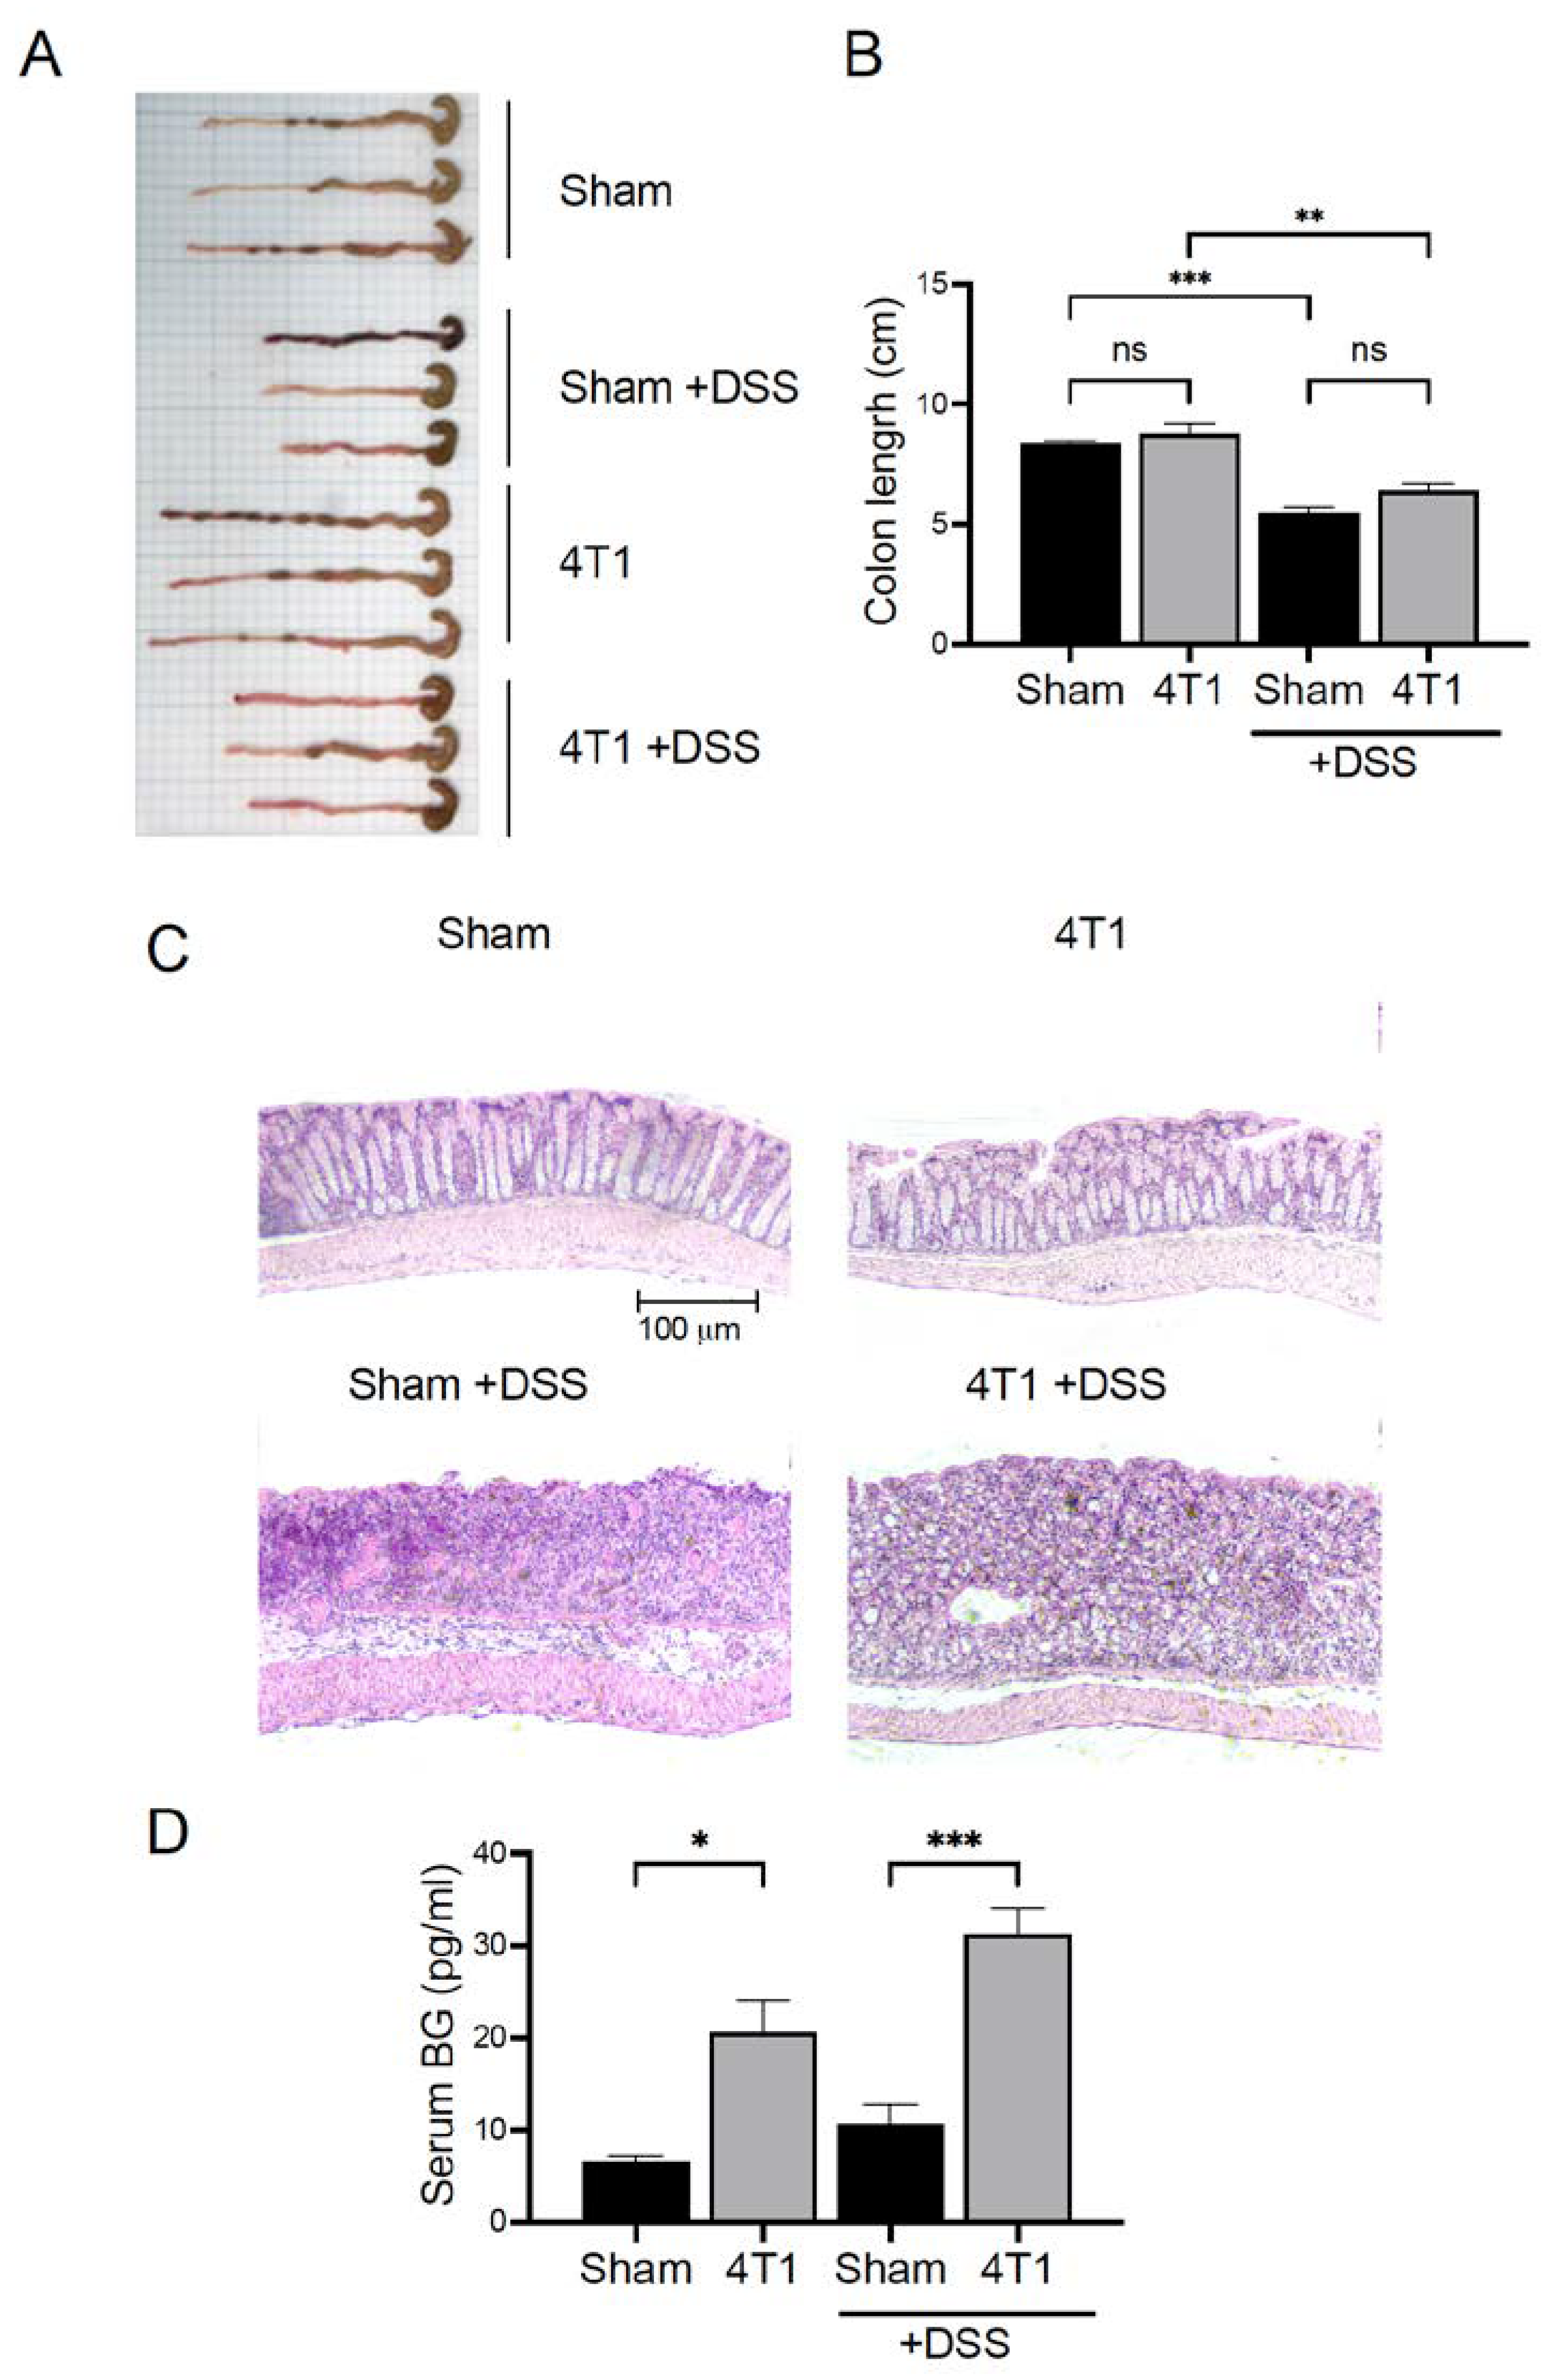
3.6. Gastrointestinal (GI) Permeability Barrier Defect Increase in 4T1 Tumor-Inoculated Mice
4. Discussion
5. Conclusions
Supplementary Materials
Author Contributions
Funding
Institutional Review Board Statement
Informed Consent Statement
Data Availability Statement
Acknowledgments
Conflicts of Interest
References
- Quail, D.F.; Joyce, J.A. Microenvironmental regulation of tumor progression and metastasis. Nat. Med. 2013, 19, 1423–1437. [Google Scholar] [CrossRef]
- Orimo, A.; Gupta, P.B.; Sgroi, D.C.; Arenzana-Seisdedos, F.; Delaunay, T.; Naeem, R.; Carey, V.J.; Richardson, A.L.; Weinberg, R.A. Stromal fibroblasts present in invasive human breast carcinomas promote tumor growth and angiogenesis through elevated SDF-1/CXCL12 secretion. Cell 2005, 121, 335–348. [Google Scholar] [CrossRef] [PubMed]
- Kerkar, S.P.; Restifo, N.P. Cellular constituents of immune escape within the tumor microenvironment. Cancer Res. 2012, 72, 3125–3130. [Google Scholar] [CrossRef] [PubMed]
- Junttila, M.R.; de Sauvage, F.J. Influence of tumour micro-environment heterogeneity on therapeutic response. Nature 2013, 501, 346–354. [Google Scholar] [CrossRef] [PubMed]
- Masuda, J.; Umemura, C.; Yokozawa, M.; Yamauchi, K.; Seko, T.; Yamashita, M.; Yamashita, Y. Dietary supplementation of Selenoneine-containing tuna dark muscle extract effectively reduces pathology of experimental colorectal cancers in mice. Nutrients 2018, 10, 1380. [Google Scholar] [CrossRef] [PubMed]
- Masuda, J.; Takayama, E.; Strober, W.; Satoh, A.; Morimoto, Y.; Honjo, Y.; Ichinohe, T.; Tokuno, S.I.; Ishizuka, T.; Nakata, T.; et al. Tumor growth limited to subcutaneous site vs tumor growth in pulmonary site exhibit differential effects on systemic immunities. Oncol. Rep. 2017, 38, 449–455. [Google Scholar] [CrossRef]
- Masuda, J.; Shigehiro, T.; Matsumoto, T.; Satoh, A.; Mizutani, A.; Umemura, C.; Saito, S.; Kijihira, M.; Takayama, E.; Seno, A.; et al. Cytokine expression and macrophage localization in xenograft and allograft tumor models stimulated with lipopolysaccharide. Int. J. Mol. Sci. 2018, 19, 1261. [Google Scholar] [CrossRef]
- Hanson, E.M.; Clements, V.K.; Sinha, P.; Ilkovitch, D.; Ostrand-Rosenberg, S. Myeloid-derived suppressor cells down-regulate L-selectin expression on CD4+ and CD8+ T cells. J. Immunol. 2009, 183, 937–944. [Google Scholar] [CrossRef] [PubMed]
- Mougiakakos, D.; Choudhury, A.; Lladser, A.; Kiessling, R.; Johansson, C.C. Regulatory T cells in cancer. Adv. Cancer Res. 2010, 107, 57–117. [Google Scholar]
- Fichtner-Feigl, S.; Terabe, M.; Kitani, A.; Young, C.A.; Fuss, I.; Geissler, E.K.; Schlitt, H.J.; Berzofsky, J.A.; Strober, W. Restoration of tumor immunosurveillance via targeting of interleukin-13 receptor-α2. Cancer Res. 2008, 68, 3467–3475. [Google Scholar] [CrossRef]
- Sagiv, J.Y.; Michaeli, J.; Assi, S.; Mishalian, I.; Kisos, H.; Levy, L.; Damti, P.; Lumbroso, D.; Polyansky, L.; Sionov, R.V.; et al. Phenotypic diversity and plasticity in circulating neutrophil subpopulations in cancer. Cell Rep. 2015, 10, 562–573. [Google Scholar] [CrossRef] [PubMed]
- Eikawa, S.; Nishida, M.; Mizukami, S.; Yamazaki, C.; Nakayama, E.; Udono, H. Immune-mediated antitumor effect by type 2 diabetes drug, metformin. Proc. Natl. Acad. Sci. USA 2015, 112, 1809–1814. [Google Scholar] [CrossRef] [PubMed]
- Agace, W.W.; McCoy, K.D. Regionalized development and maintenance of the intestinal adaptive immune landscape. Immunity 2017, 46, 532–548. [Google Scholar] [CrossRef]
- MacDonald, T.T.; Monteleone, G. Immunity, inflammation, and allergy in the gut. Science 2005, 307, 1920–1925. [Google Scholar] [CrossRef] [PubMed]
- Hart, A.L.; Ng, S.C.; Mann, E.; Al-Hassi, H.O.; Bernardo, D.; Knight, S.C. Homing of immune cells: Role in homeostasis and intestinal inflammation. Inflamm. Bowel Dis. 2010, 16, 1969–1977. [Google Scholar] [CrossRef] [PubMed]
- Wang, J.; Li, F.; Wei, H.; Lian, Z.X.; Sun, R.; Tian, Z. Respiratory influenza virus infection induces intestinal immune injury via microbiota-mediated Th17 cell-dependent inflammation. J. Exp. Med. 2014, 211, 2397–2410. [Google Scholar] [CrossRef]
- Rutkowski, M.R.; Stephen, T.L.; Svoronos, N.; Allegrezza, M.J.; Tesone, A.J.; Perales-Puchalt, A.; Brencicova, E.; Escovar-Fadul, X.; Nguyen, J.M.; Cadungog, M.G.; et al. Microbially driven TLR5-dependent signaling governs distal malignant progression through tumor-promoting inflammation. Cancer Cell 2015, 27, 27–40. [Google Scholar] [CrossRef]
- Weigelt, B.; Peterse, J.L.; van’t Veer, L.J. Breast cancer metastasis: Markers and models. Nat. Rev. Cancer 2005, 5, 591–602. [Google Scholar] [CrossRef]
- Tao, K.; Fang, M.; Alroy, J.; Sahagian, G.G. Imagable 4T1 model for the study of late stage breast cancer. BMC Cancer 2008, 8, 228. [Google Scholar] [CrossRef]
- Gao, Z.G.; Tian, L.; Hu, J.; Park, I.S.; Bae, Y.H. Prevention of metastasis in a 4T1 murine breast cancer model by doxorubicin carried by folate conjugated pH sensitive polymeric micelles. J. Control. Release 2011, 152, 84–89. [Google Scholar] [CrossRef]
- Youn, J.I.; Nagaraj, S.; Collazo, M.; Gabrilovich, D.I. Subsets of myeloid-derived suppressor cells in tumor-bearing mice. J. Immunol. 2008, 181, 5791–5802. [Google Scholar] [CrossRef] [PubMed]
- Xu, L.; Kitani, A.; Stuelten, C.; McGrady, G.; Fuss, I.; Strober, W. Positive and negative transcriptional regulation of the Foxp3 gene is mediated by access and binding of the Smad3 protein to enhancer I. Immunity 2010, 33, 313–325. [Google Scholar] [CrossRef] [PubMed]
- Nakamura, K.; Kitani, A.; Fuss, I.; Pedersen, A.; Harada, N.; Nawata, H.; Strober, W. TGF-β1 plays an important role in the mechanism of CD4+ CD25+ regulatory T cell activity in both humans and mice. J. Immunol. 2004, 172, 834–842. [Google Scholar] [CrossRef]
- Panpetch, W.; Chancharoenthana, W.; Bootdee, K.; Nilgate, S.; Finkelman, M.; Tumwasorn, S.; Leelahavanichkul, A. Lactobacillus rhamnosus L34 attenuates gut translocation-induced bacterial sepsis in murine models of leaky gut. Infect. Immun. 2018, 86, e00700-17. [Google Scholar] [CrossRef] [PubMed]
- Masuda, J.; Usui, R.; Maru, Y. Fibronectin type I repeat is a nonactivating ligand for EphA1 and inhibits ATF3-dependent angiogenesis. J. Biol. Chem. 2008, 283, 13148–13155. [Google Scholar] [CrossRef]
- Obayashi, T.; Sugimoto, A.; Takigawa, C.; Sekiya, N.; Nagasawa, J.; Ozaki, Y. Validation of a new (1→ 3)-β-D-Glucan Test Kit, Fungitec G Test MK II “Nissui”. Med. Mycol. J. 2015, 56, J73–J79. [Google Scholar] [CrossRef]
- Abe, H.; Wada, H.; Baghdadi, M.; Nakanishi, S.; Usui, Y.; Tsuchikawa, T.; Shichinohe, T.; Hirano, S.; Seino, K.I. Identification of a highly immunogenic mouse breast cancer sub cell line, 4t1-s. Hum. Cell 2016, 29, 58–66. [Google Scholar] [CrossRef]
- Apodaca, M.C.; Wright, A.E.; Riggins, A.M.; Harris, W.P.; Yeung, R.S.; Yu, L.; Morishima, C. Characterization of a whole blood assay for quantifying myeloid-derived suppressor cells. J. Immunother. Cancer 2019, 7, 230. [Google Scholar] [CrossRef]
- Ostrand-Rosenberg, S.; Sinha, P. Myeloid-derived suppressor cells: Linking inflammation and cancer. J. Immunol. 2009, 182, 4499–4506. [Google Scholar] [CrossRef]
- Gabrilovich, D.I.; Nagaraj, S. Myeloid-derived suppressor cells as regulators of the immune system. Nat. Rev. Immunol. 2009, 9, 162–174. [Google Scholar] [CrossRef]
- Cerovic, V.; Bain, C.C.; Mowat, A.M.; Milling, S.W.F. Intestinal macrophages and dendritic cells: What’s the difference? Trends Immunol. 2014, 35, 270–277. [Google Scholar] [CrossRef]
- Shiokawa, A.; Kotaki, R.; Takano, T.; Nakajima-Adachi, H.; Hachimura, S. Mesenteric lymph node CD11b− CD103+ PD-L1High dendritic cells highly induce regulatory T cells. Immunology 2017, 152, 52–64. [Google Scholar] [CrossRef] [PubMed]
- Vitali, C.; Mingozzi, F.; Broggi, A.; Barresi, S.; Zolezzi, F.; Bayry, J.; Raimondi, G.; Zanoni, I.; Granucci, F. Migratory, and not lymphoid-resident, dendritic cells maintain peripheral self-tolerance and prevent autoimmunity via induction of iTreg cells. Blood 2012, 120, 1237–1245. [Google Scholar] [CrossRef] [PubMed]
- Becker, M.; Güttler, S.; Bachem, A.; Hartung, E.; Mora, A.; Jäkel, A.; Hutloff, A.; Henn, V.; Mages, H.W.; Gurka, S.; et al. Ontogenic, phenotypic, and functional characterization of XCR1+ dendritic cells leads to a consistent classification of intestinal dendritic cells based on the expression of XCR1 and SIRPα. Front. Immunol. 2014, 5, 326. [Google Scholar] [CrossRef] [PubMed]
- Persson, E.K.; Scott, C.L.; Mowat, A.M.; Agace, W.W. Dendritic cell subsets in the intestinal lamina propria: Ontogeny and function. Eur. J. Immunol. 2013, 43, 3098–3107. [Google Scholar] [CrossRef] [PubMed]
- Persson, E.K.; Uronen-Hansson, H.; Semmrich, M.; Rivollier, A.; Hägerbrand, K.; Marsal, J.; Gudjonsson, S.; Håkansson, U.; Reizis, B.; Kotarsky, K.; et al. IRF4 transcription-factor-dependent CD103+ CD11b+ dendritic cells drive mucosal T Helper 17 cell differentiation. Immunity 2013, 38, 958–969. [Google Scholar] [CrossRef]
- Bekiaris, V.; Persson, E.K.; Agace, W.W. Intestinal dendritic cells in the regulation of mucosal immunity. Immunol. Rev. 2014, 260, 86–101. [Google Scholar] [CrossRef] [PubMed]
- Leelahavanichkul, A.; Worasilchai, N.; Wannalerdsakun, S.; Jutivorakool, K.; Somparn, P.; Issara-Amphorn, J.; Tachaboon, S.; Srisawat, N.; Finkelman, M.; Chindamporn, A. Gastrointestinal leakage detected by serum (1→3)-β-D-glucan in mouse models and a pilot study in patients with sepsis. Shock 2016, 46, 506–518. [Google Scholar] [CrossRef] [PubMed]
- Zhao, S.; Wu, D.; Wu, P.; Wang, Z.; Huang, J. Serum IL-10 predicts worse outcome in cancer patients: A meta-analysis. PLoS ONE 2015, 10, e0139598. [Google Scholar] [CrossRef]
- Al-Ghurabi, B.H. IL-2 and IL-4 serum levels in breast cancer. J. Fac. Med. Baghdad 2009, 51, 300–303. [Google Scholar]
- Kozłowski, L.; Zakrzewska, I.; Tokajuk, P.; Wojtukiewicz, M.Z. Concentration of interleukin-6 (IL-6), interleukin-8 (IL-8) and interleukin-10 (IL-10) in blood serum of breast cancer patients. Rocz. Akad. Med. Bialymst. 2003, 48, 82–84. [Google Scholar] [PubMed]
- Umemura, N.; Saio, M.; Suwa, T.; Kitoh, Y.; Bai, J.; Nonaka, K.; Ouyang, G.F.; Okada, M.; Balazs, M.; Adany, R.; et al. Tumor-infiltrating myeloid-derived suppressor cells are pleiotropic-inflamed monocytes/macrophages that bear M1- and M2-type characteristics. J. Leukoc. Biol. 2008, 83, 1136–1144. [Google Scholar] [CrossRef] [PubMed]
- Mueller, S.N. Spreading the load: Antigen transfer between migratory and lymph node-resident dendritic cells promotes T-cell priming. Eur. J. Immunol. 2017, 47, 1798–1801. [Google Scholar] [CrossRef]
- Chan, G.C.F.; Chan, W.K.; Sze, D.M.Y. The effects of beta-glucan on human immune and cancer cells. J. Hematol. Oncol. 2009, 2, 25. [Google Scholar] [CrossRef] [PubMed]
- Qi, C.; Cai, Y.; Gunn, L.; Ding, C.; Li, B.; Kloecker, G.; Qian, K.; Vasilakos, J.; Saijo, S.; Iwakura, Y.; et al. Differential pathways regulating innate and adaptive antitumor immune responses by particulate and soluble yeast-derived β-glucans. Blood 2011, 117, 6825–6836. [Google Scholar] [CrossRef]
- Lipinski, T.; Fitieh, A.; Pierre, J.S.; Ostergaard, H.L.; Bundle, D.R.; Touret, N. Enhanced Immunogenicity of a Tricomponent Mannan Tetanus Toxoid Conjugate Vaccine Targeted to Dendritic Cells via Dectin-1 by Incorporating β-Glucan. J. Immunol. 2013, 190, 4116–4128. [Google Scholar] [CrossRef]
- Li, B.; Cai, Y.; Qi, C.; Hansen, R.; Ding, C.; Mitchell, T.C.; Yan, J. Orally administered particulate β-glucan modulates tumor-capturing dendritic cells and improves antitumor T-cell responses in cancer. Clin. Cancer Res. 2010, 16, 5153–5164. [Google Scholar] [CrossRef]
- Velicer, C.M.; Heckbert, S.R.; Lampe, J.W.; Potter, J.D.; Robertson, C.A.; Taplin, S.H. Antibiotic use in relation to the risk of breast cancer. J. Am. Med. Assoc. 2004, 291, 827–835. [Google Scholar] [CrossRef]
- Elkrief, A.; Derosa, L.; Kroemer, G.; Zitvogel, L.; Routy, B. The negative impact of antibiotics on outcomes in cancer patients treated with immunotherapy: A new independent prognostic factor? Ann. Oncol. 2019, 30, 1572–1579. [Google Scholar] [CrossRef]


Publisher’s Note: MDPI stays neutral with regard to jurisdictional claims in published maps and institutional affiliations. |
© 2022 by the authors. Licensee MDPI, Basel, Switzerland. This article is an open access article distributed under the terms and conditions of the Creative Commons Attribution (CC BY) license (https://creativecommons.org/licenses/by/4.0/).
Share and Cite
Shigehiro, T.; Ueno, M.; Kijihira, M.; Takahashi, R.; Umemura, C.; Taha, E.A.; Kurosaka, C.; Asayama, M.; Murakami, H.; Satoh, A.; et al. Immune State Conversion of the Mesenteric Lymph Node in a Mouse Breast Cancer Model. Int. J. Mol. Sci. 2022, 23, 11035. https://doi.org/10.3390/ijms231911035
Shigehiro T, Ueno M, Kijihira M, Takahashi R, Umemura C, Taha EA, Kurosaka C, Asayama M, Murakami H, Satoh A, et al. Immune State Conversion of the Mesenteric Lymph Node in a Mouse Breast Cancer Model. International Journal of Molecular Sciences. 2022; 23(19):11035. https://doi.org/10.3390/ijms231911035
Chicago/Turabian StyleShigehiro, Tsukasa, Maho Ueno, Mayumi Kijihira, Ryotaro Takahashi, Chiho Umemura, Eman A. Taha, Chisaki Kurosaka, Megumi Asayama, Hiroshi Murakami, Ayano Satoh, and et al. 2022. "Immune State Conversion of the Mesenteric Lymph Node in a Mouse Breast Cancer Model" International Journal of Molecular Sciences 23, no. 19: 11035. https://doi.org/10.3390/ijms231911035
APA StyleShigehiro, T., Ueno, M., Kijihira, M., Takahashi, R., Umemura, C., Taha, E. A., Kurosaka, C., Asayama, M., Murakami, H., Satoh, A., Nakamura, Y., Futami, J., & Masuda, J. (2022). Immune State Conversion of the Mesenteric Lymph Node in a Mouse Breast Cancer Model. International Journal of Molecular Sciences, 23(19), 11035. https://doi.org/10.3390/ijms231911035