


MicroRNA and Hemostasis Profile of Carotid Atherosclerosis


Abstract
:1. Introduction
2. Results
3. Discussion
4. Materials and Methods
4.1. Study Population and Clinical Data
4.2. Laboratory Analyses
4.3. MicroRNA Extraction
- Validated 20X primers for has-miR: miR-126-5p, miR-126-3p, miR-29-5p, miR-29-3p, miR-33a-5p, miR-33a-3p, miR-21-5p, miR-21-3p (ThermoFischerScientific, Waltham, MA, USA)
- Leukocyte RNA Purification Plus Kit (NORGEN Biotec Corp., Thorold, ON, Canada)
- TaqMan™ Advanced miRNA cDNA Synthesis Kit (Applied Biosystems™, Thermo Fisher Scientific, Waltham, MA, USA)
- Real-time CFX96 Touch amplifier (BioRaD, Hercules, CA, USA)
4.4. Statistics
5. Conclusions
6. Limitations
Author Contributions
Funding
Institutional Review Board Statement
Informed Consent Statement
Data Availability Statement
Conflicts of Interest
References
- Volný, O.; Kašičková, L.; Coufalová, D.; Cimflová, P.; Novák, J. MicroRNAs in Cerebrovascular Disease. Adv. Exp. Med. Biol. 2015, 888, 155–195. [Google Scholar] [CrossRef] [PubMed]
- Rockman, C.B.; Hoang, H.; Guo, Y.; Maldonado, T.S.; Jacobowitz, G.R.; Talishinskiy, T.; Relis, T.S.; Berger, J.S. The prevalence of carotid artery stenosis varies significantly by race. J. Vasc. Surg. 2013, 57, 327–337. [Google Scholar] [CrossRef] [PubMed]
- Inaba, Y.; Chen, J.A.; Bergmann, S.R. Carotid plaque, compared with carotid intima-media thickness, more accurately predicts coronary artery disease events: A meta-analysis. Atheroscler 2012, 220, 128–133. [Google Scholar] [CrossRef] [PubMed]
- Del Brutto, V.J.; Gornik, H.L.; Rundek, T. Why are We Still Debating Criteria for Carotid Artery Stenosis? Ann. Transl. Med. 2020, 8, 1270. [Google Scholar] [CrossRef]
- Inzitari, D.; Eliasziw, M.; Gates, P.; Sharpe, B.L.; Chan, R.K.; Meldrum, H.E.; Barnett, H.J. The causes and risk of stroke in patients with asymptomatic internal-carotid-artery stenosis. North American Symptomatic Carotid Endarterectomy Trial Collaborators. N. Engl. J. Med. 2000, 342, 1693–1700. [Google Scholar] [CrossRef]
- Tajbakhsh, A.; Bianconi, V.; Pirro, M.; Gheibi Hayat, S.M.; Johnston, T.P.; Sahebkar, A. Efferocytosis and Atherosclerosis: Regulation of Phagocyte Function by MicroRNAs. Trends Endocrinol. Metab. 2019, 30, 672–683. [Google Scholar] [CrossRef]
- Raskurazhev, A.A.; Tanashyan, M.M.; Shabalina, A.A.; Kuznetsova, P.I.; Kornilova, A.A.; Burmak, A.G. Micro-RNA in Patients with Carotid Atherosclerosis. Hum. Physiol. 2020, 46, 880–885. [Google Scholar] [CrossRef]
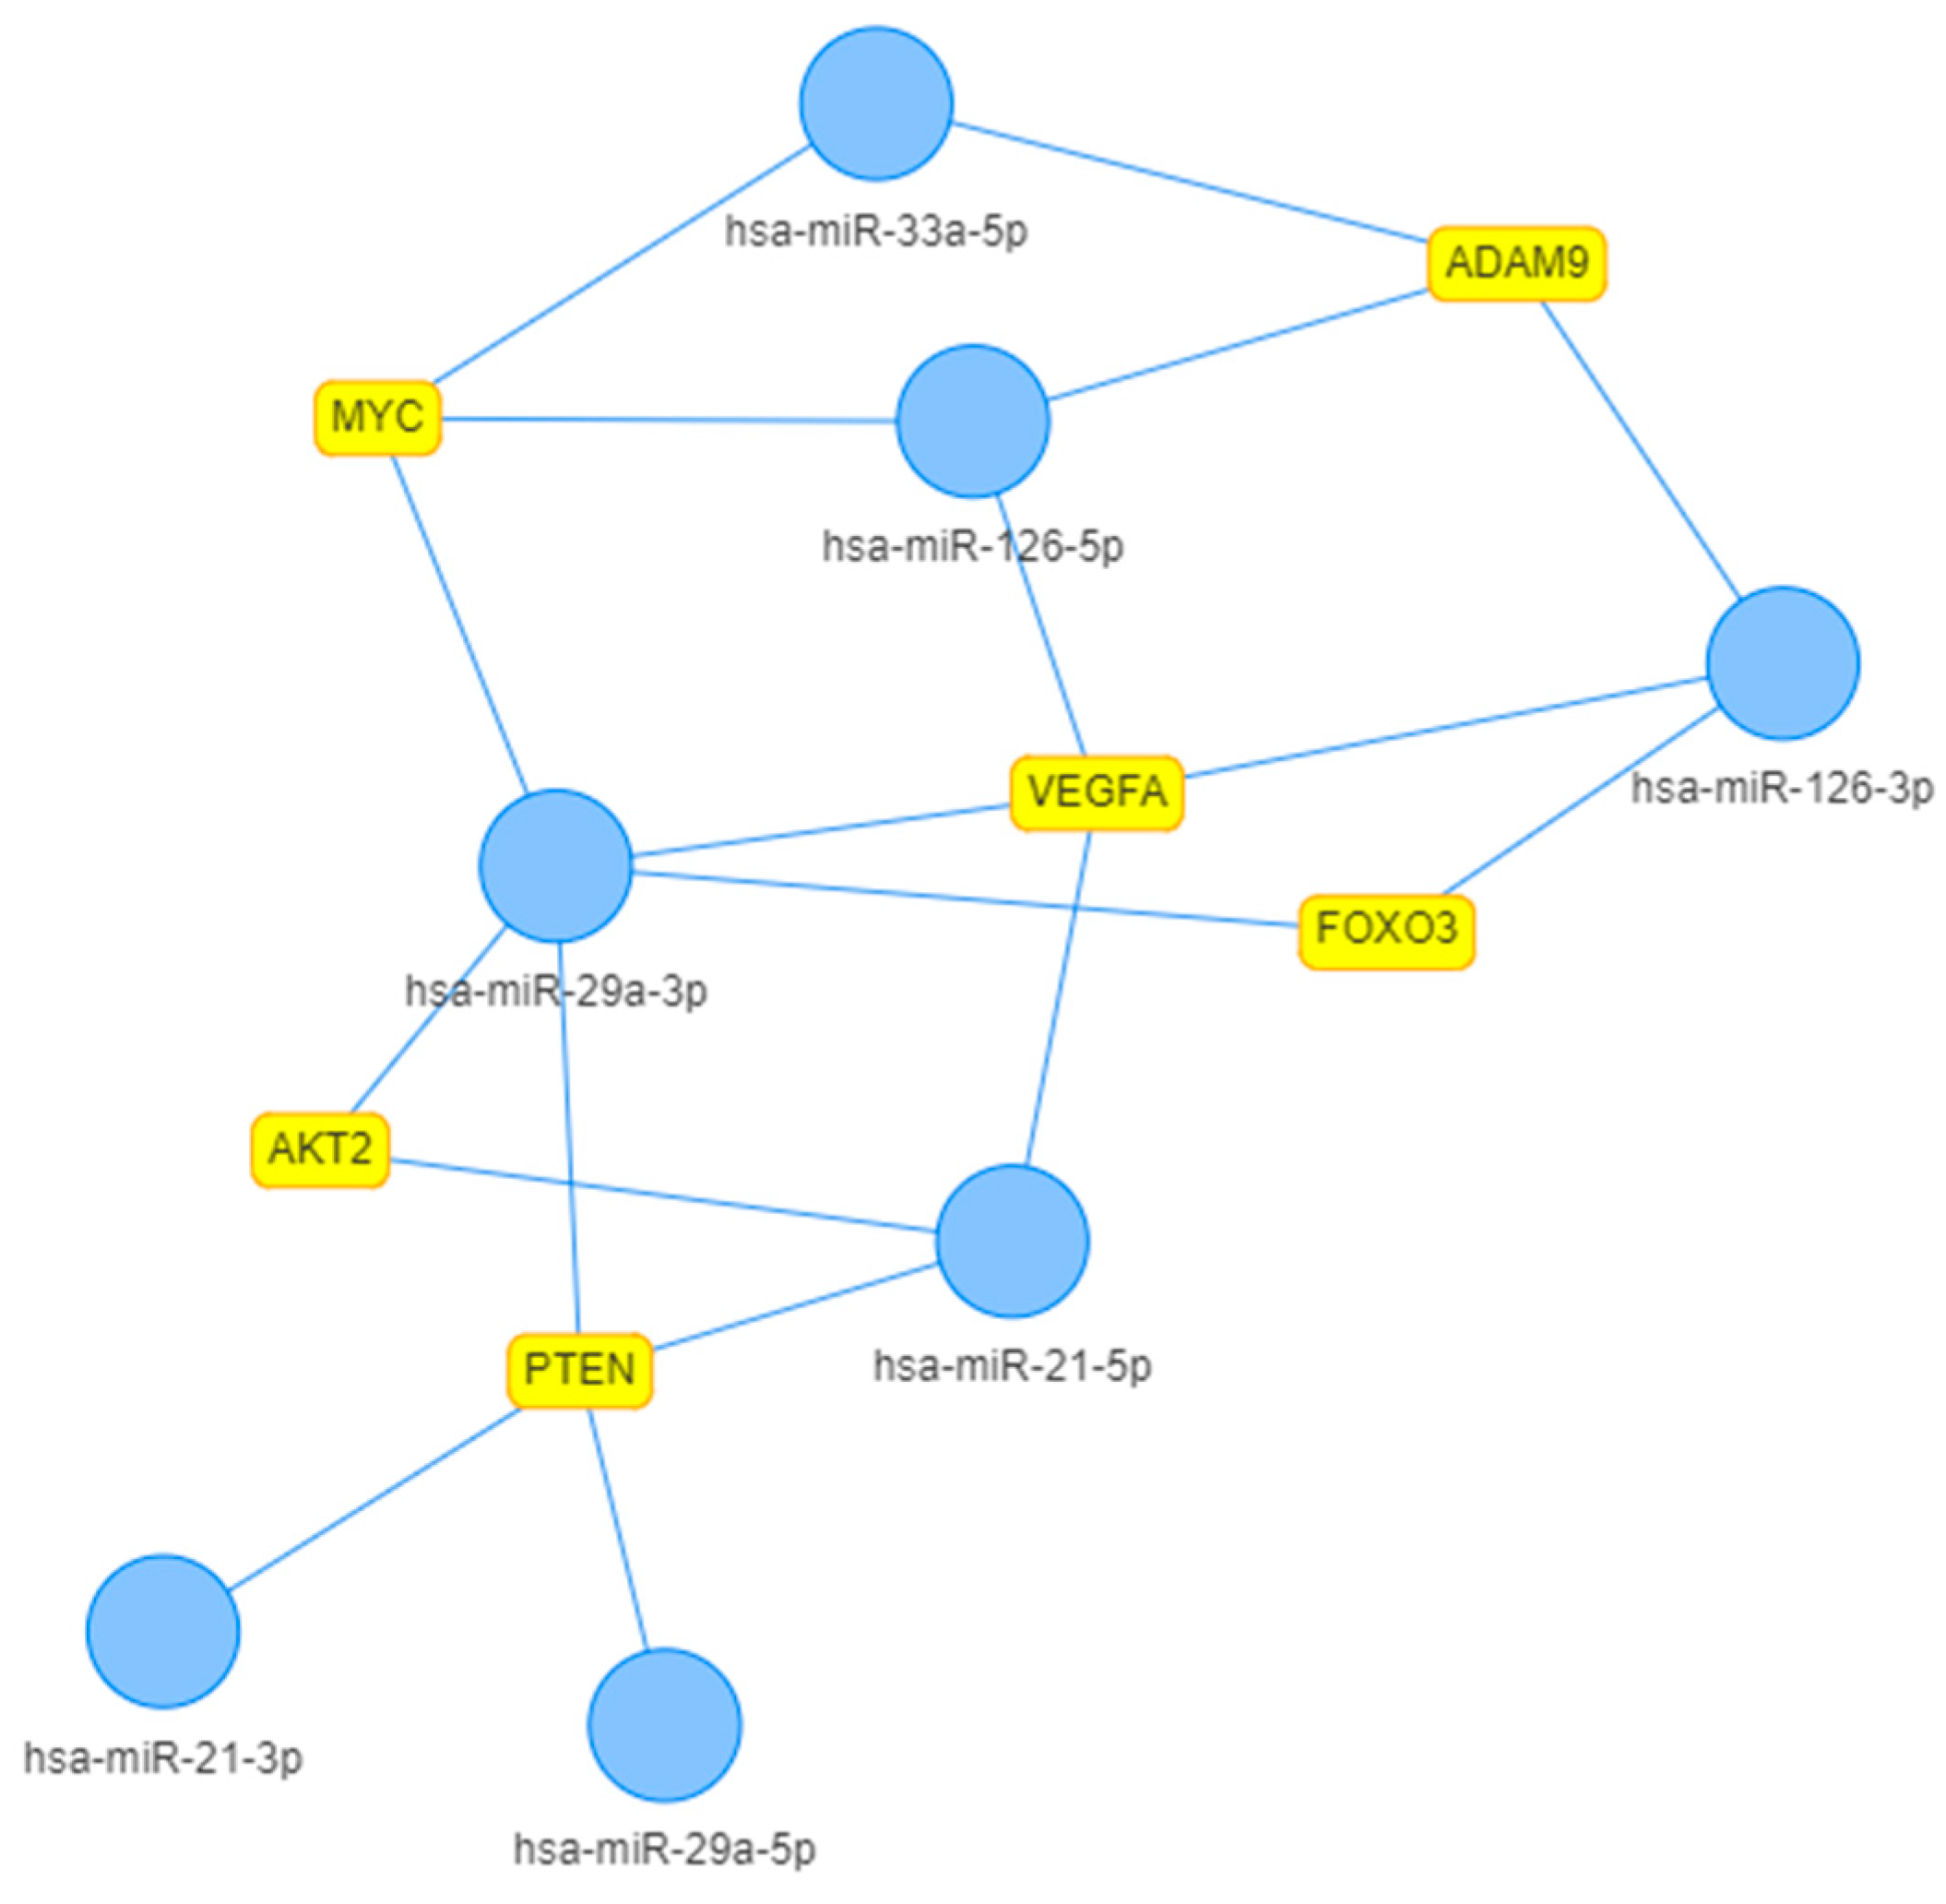
- Licursi, V.; Federica, C.; Giulia, F.; Paola, P. MIENTURNET: An interactive web tool for microRNA-target enrichment and network-based analysis. BMC Bioinform. 2019, 20, 54. [Google Scholar] [CrossRef]
- Oksala, N.; Levula, M.; Airla, N.; Pelto-Huikko, M.; Ortiz, R.M.; Järvinen, O.; Salenius, J.P.; Ozsait, B.; Komurcu-Bayrak, E.; Erginel-Unaltuna, N.; et al. ADAM-9, ADAM-15, and ADAM-17 are Upregulated in Macrophages in Advanced Human Atherosclerotic Plaques in Aorta and Carotid and Femoral Arteries-Tampere Vascular Study. Ann. Med. 2009, 41, 279–290. [Google Scholar] [CrossRef]
- Zhao, Y.; Liu, Y.-S. Longevity Factor FOXO3: A Key Regulator in Aging-Related Vascular Diseases. Front. Cardiovasc. Med. 2020, 8, 778674. [Google Scholar] [CrossRef]
- Linna-Kuosmanen, S.; Tomas Bosch, V.; Moreau, P.R.; Bouvy-Liivrand, M.; Niskanen, H.; Kansanen, E.; Kivelä, A.; Hartikainen, J.; Hippeläinen, M.; Kokki, H.; et al. NRF2 is A Key Regulator of Endothelial MicroRNA Expression Under Proatherogenic Stimuli. Cardiovasc. Res. 2021, 117, 1339–1357. [Google Scholar] [CrossRef] [PubMed]
- Zhu, J.; Liu, B.; Wang, Z.; Wang, D.; Ni, H.; Zhang, L.; Wang, Y. Exosomes from Nicotine-Stimulated Macrophages Accelerate Atherosclerosis through miR-21-3p/PTEN-Mediated VSMC Migration and Proliferation. Theranostics 2019, 9, 6901–6919. [Google Scholar] [CrossRef] [PubMed]
- Babaev, V.R.; Hebron, K.E.; Wiese, C.B.; Toth, C.L.; Ding, L.; Zhang, Y.; May, J.M.; Fazio, S.; Vickers, K.C.; Linton, M.F. Macrophage deficiency of Akt2 reduces atherosclerosis in Ldlr null mice. J. Lipid Res. 2014, 55, 2296–2308. [Google Scholar] [CrossRef]
- Csongrádi, É.; Nagy, B., Jr.; Fulop, T.; Varga, Z.; Karányi, Z.; Magyar, M.T.; Oláh, L.; Papp, M.; Facskó, A.; Kappelmayer, J.; et al. Increased Levels of Platelet Activation Markers are Positively Associated with Carotid Wall Thickness and Other atherosclerotic Risk Factors in Obese Patients. Thromb. Haemost. 2011, 106, 683–692. [Google Scholar] [CrossRef] [PubMed]
- Bicakcigil, M.; Tasan, D.; Tasdelen, N.; Mutlu, N.; Yavuz, S. Role of Fibrinolytic Parameters and Plasminogen Activator Inhibitor 1 (PAI-1) Promoter Polymorphism on Premature Atherosclerosis in SLE Patients. Lupus 2011, 20, 1063–1071. [Google Scholar] [CrossRef] [PubMed]
- de Franciscis, S.; Metzinger, L.; Serra, R. The Discovery of Novel Genomic, Transcriptomic, and Proteomic Biomarkers in Cardiovascular and Peripheral Vascular Disease: The State of the Art. Biomed Res. Int. 2016, 2016, 7829174. [Google Scholar] [CrossRef] [PubMed]
- Santovito, D.; Egea, V.; Bidzhekov, K.; Natarelli, L.; Mourão, A.; Blanchet, X.; Weber, C. Noncanonical Inhibition of Caspase-3 by a Nuclear MicroRNA Confers Endothelial Protection by Autophagy in Atherosclerosis. Sci. Transl. Med. 2020, 12, eaaz2294. [Google Scholar] [CrossRef] [PubMed]
- Schober, A.; Nazari-Jahantigh, M.; Wei, Y.; Bidzhekov, K.; Gremse, F.; Grommes, J.; Megens, R.T.A.; Heyll, K.; Noels, H.; Hristov, M.; et al. MicroRNA-126-5p promotes endothelial proliferation and limits atherosclerosis by suppressing Dlk1. Nat. Med. 2014, 20, 368–376. [Google Scholar] [CrossRef]
- Zhang, T.; Yang, Z.; Kusumanchi, P.; Han, S.; Liangpunsakul, S. Critical Role of MicroRNA-21 in the Pathogenesis of Liver Diseases. Front. Med. 2020, 7, 7. [Google Scholar] [CrossRef]
- Chang, W.T.; Lin, Y.W.; Huang, P.S.; Lin, Y.C.; Tseng, S.Y.; Chao, T.H.; Chen, Z.C.; Shih, J.Y.; Hong, C.S. Deletion of MicroRNA-21 Impairs Neovascularization Following Limb Ischemia: From Bedside to Bench. Front. Cardiovasc. Med. 2022, 9, 826478. [Google Scholar] [CrossRef]
- Weber, M.; Baker, M.B.; Moore, J.P.; Searles, C.D. MiR-21 is Induced in Endothelial Cells by Shear Stress and Modulates Apoptosis and eNOS Activity. Biochem. Biophys. Res. Commun. 2010, 393, 643–648. [Google Scholar] [CrossRef] [PubMed]
- Wang, S.; Jiang, S.; Feng, R.; Liu, J.; Liu, L.; Cui, J.; Shi, Y.; Ning, J.; Jia, B.; Hu, Z.; et al. MicroRNA Profile of Circulating CD4+ T Cells in Aged Patients with Atherosclerosis Obliterans. BMC Cardiovasc. Disord. 2022, 22, 172. [Google Scholar] [CrossRef] [PubMed]
- Schober, A.; Maleki, S.S.; Nazari-Jahantigh, M. Regulatory Non-coding RNAs in Atherosclerosis. Handb. Exp. Pharmacol. 2022, 270, 463–492. [Google Scholar] [CrossRef] [PubMed]
- Atiq, F.; van de Wouw, J.; Sorop, O.; Heinonen, I.; de Maat, M.P.M.; Merkus, D.; Duncker, D.J.; Leebeek, F.W.G. Endothelial Dysfunction, Atherosclerosis, and Increase of von Willebrand Factor and Factor VIII: A Randomized Controlled Trial in Swine. Thromb. Haemost. 2021, 121, 676–686. [Google Scholar] [CrossRef] [PubMed]
- Popa, M.; Hecker, M.; Wagner, A.H. Inverse Regulation of Confluence-Dependent ADAMTS13 and von Willebrand Factor Expression in Human Endothelial Cells. Thromb. Haemost. 2022, 122, 611–622. [Google Scholar] [CrossRef] [PubMed]
- Raskurazhev, A.; Tanashyan, M.; Shabalina, A.; Kornilova, A.; Kuznetsova, P. MicroRNA expression in patients with advanced carotid atherosclerosis. Int. J. Med. Res. Health Sci. 2021, 10, 70–77. [Google Scholar]


| mCA (n = 31) | adCA (n = 30) | Study Population (n = 61) | p * | |
|---|---|---|---|---|
| Male, n (%) | 17 (54.8) | 17 (56.7) | 34 (55.7) | 0.99 |
| Age, years (median [Q1;Q3]) | 65.0 [61.5;70.0] | 68.5 [61.3;71.8] | 66.0 [61.0;71.0] | 0.19 |
| BMI, kg/m2 (median [Q1;Q3]) | 27.1 [25.0;29.5] | 27.2 [26.3;29.2] | 27.2 [25.5;29.4] | 0.60 |
| Smokers, n (%) | 8 (25.8) | 13 (43.3) | 21 (34.4) | 0.24 |
| Stroke, n (%) | 8 (25.8) | 12 (40.0) | 20 (32.8) | 0.36 |
| AH, n (%) | 27 (87.1) | 29 (96.7) | 56 (91.8) | 0.37 |
| CHD, n (%) | 6 (19.4) | 18 (60.0) | 24 (39.3) | 0.003 |
| MI, n (%) | 3 (9.7) | 7 (23.3) | 10 (16.4) | 0.27 |
| DM, n (%) | 11 (35.5) | 15 (50.0) | 26 (42.6) | 0.38 |
| Carotid surgery, n (%) | 2 (6.5) | 24 (80.0) | 26 (42.6) | <0.001 |
| Atherosclerosis of other locations, n (%) | 10 (32.3) | 26 (86.7) | 36 (59.0) | <0.001 |
| AF, n (%) | 3 (9.7) | 4 (13.3) | 7 (11.5) | 0.96 |
| ASA, n (%) | 26 (83.9) | 29 (96.7) | 55 (90.2) | 0.21 |
| Anticoagulants, n (%) | 5 (16.1) | 8 (26.7) | 13 (21.3) | 0.49 |
| Statins, n (%) | 22 (71.0) | 28 (93.3) | 50 (82.0) | 0.05 |
| mCA (n = 31) | adCA (n = 30) | Study Population (n = 61) | p * | |
|---|---|---|---|---|
| TC, mmol/L | 4.9 [4.4;6.5] | 4.6 [4.2;5.4] | 4.8 [4.2;6.0] | 0.25 |
| LDL, mmol/L | 2.0 [1.0;2.7] | 2.0 [1.5;2.7] | 2.0 [1.4;2.7] | 0.36 |
| HDL, mmol/L | 1.7 [1.3;2.1] | 1.7 [1.4;2.1] | 1.7 [1.3;2.1] | 0.78 |
| TG, mmol/L | 1.8 [1.1;2.0] | 1.3 [0.9;2.0] | 1.4 [1.0;2.0] | 0.30 |
| Hb, g/L | 122 [113;130] | 116 [110;128] | 119 [110;130] | 0.28 |
| RBC, * 1012/L | 4.1 [4.0;4.4] | 4.4 [4.0;4.8] | 4.2 [4.0;4.8] | 0.13 |
| WBC, * 109/L | 6.7 [6.2;7.5] | 7.2 [6.4;8.3] | 6.8 [6.4;7.5] | 0.15 |
| Platelets, * 109/L | 215 [172;280] | 215 [150;253] | 215 [165;260] | 0.45 |
| ESR, mm/h | 20 [16;23] | 21 [14;26] | 20 [16;26] | 0.59 |
| mCA (n = 31) | adCA (n = 30) | p | |
|---|---|---|---|
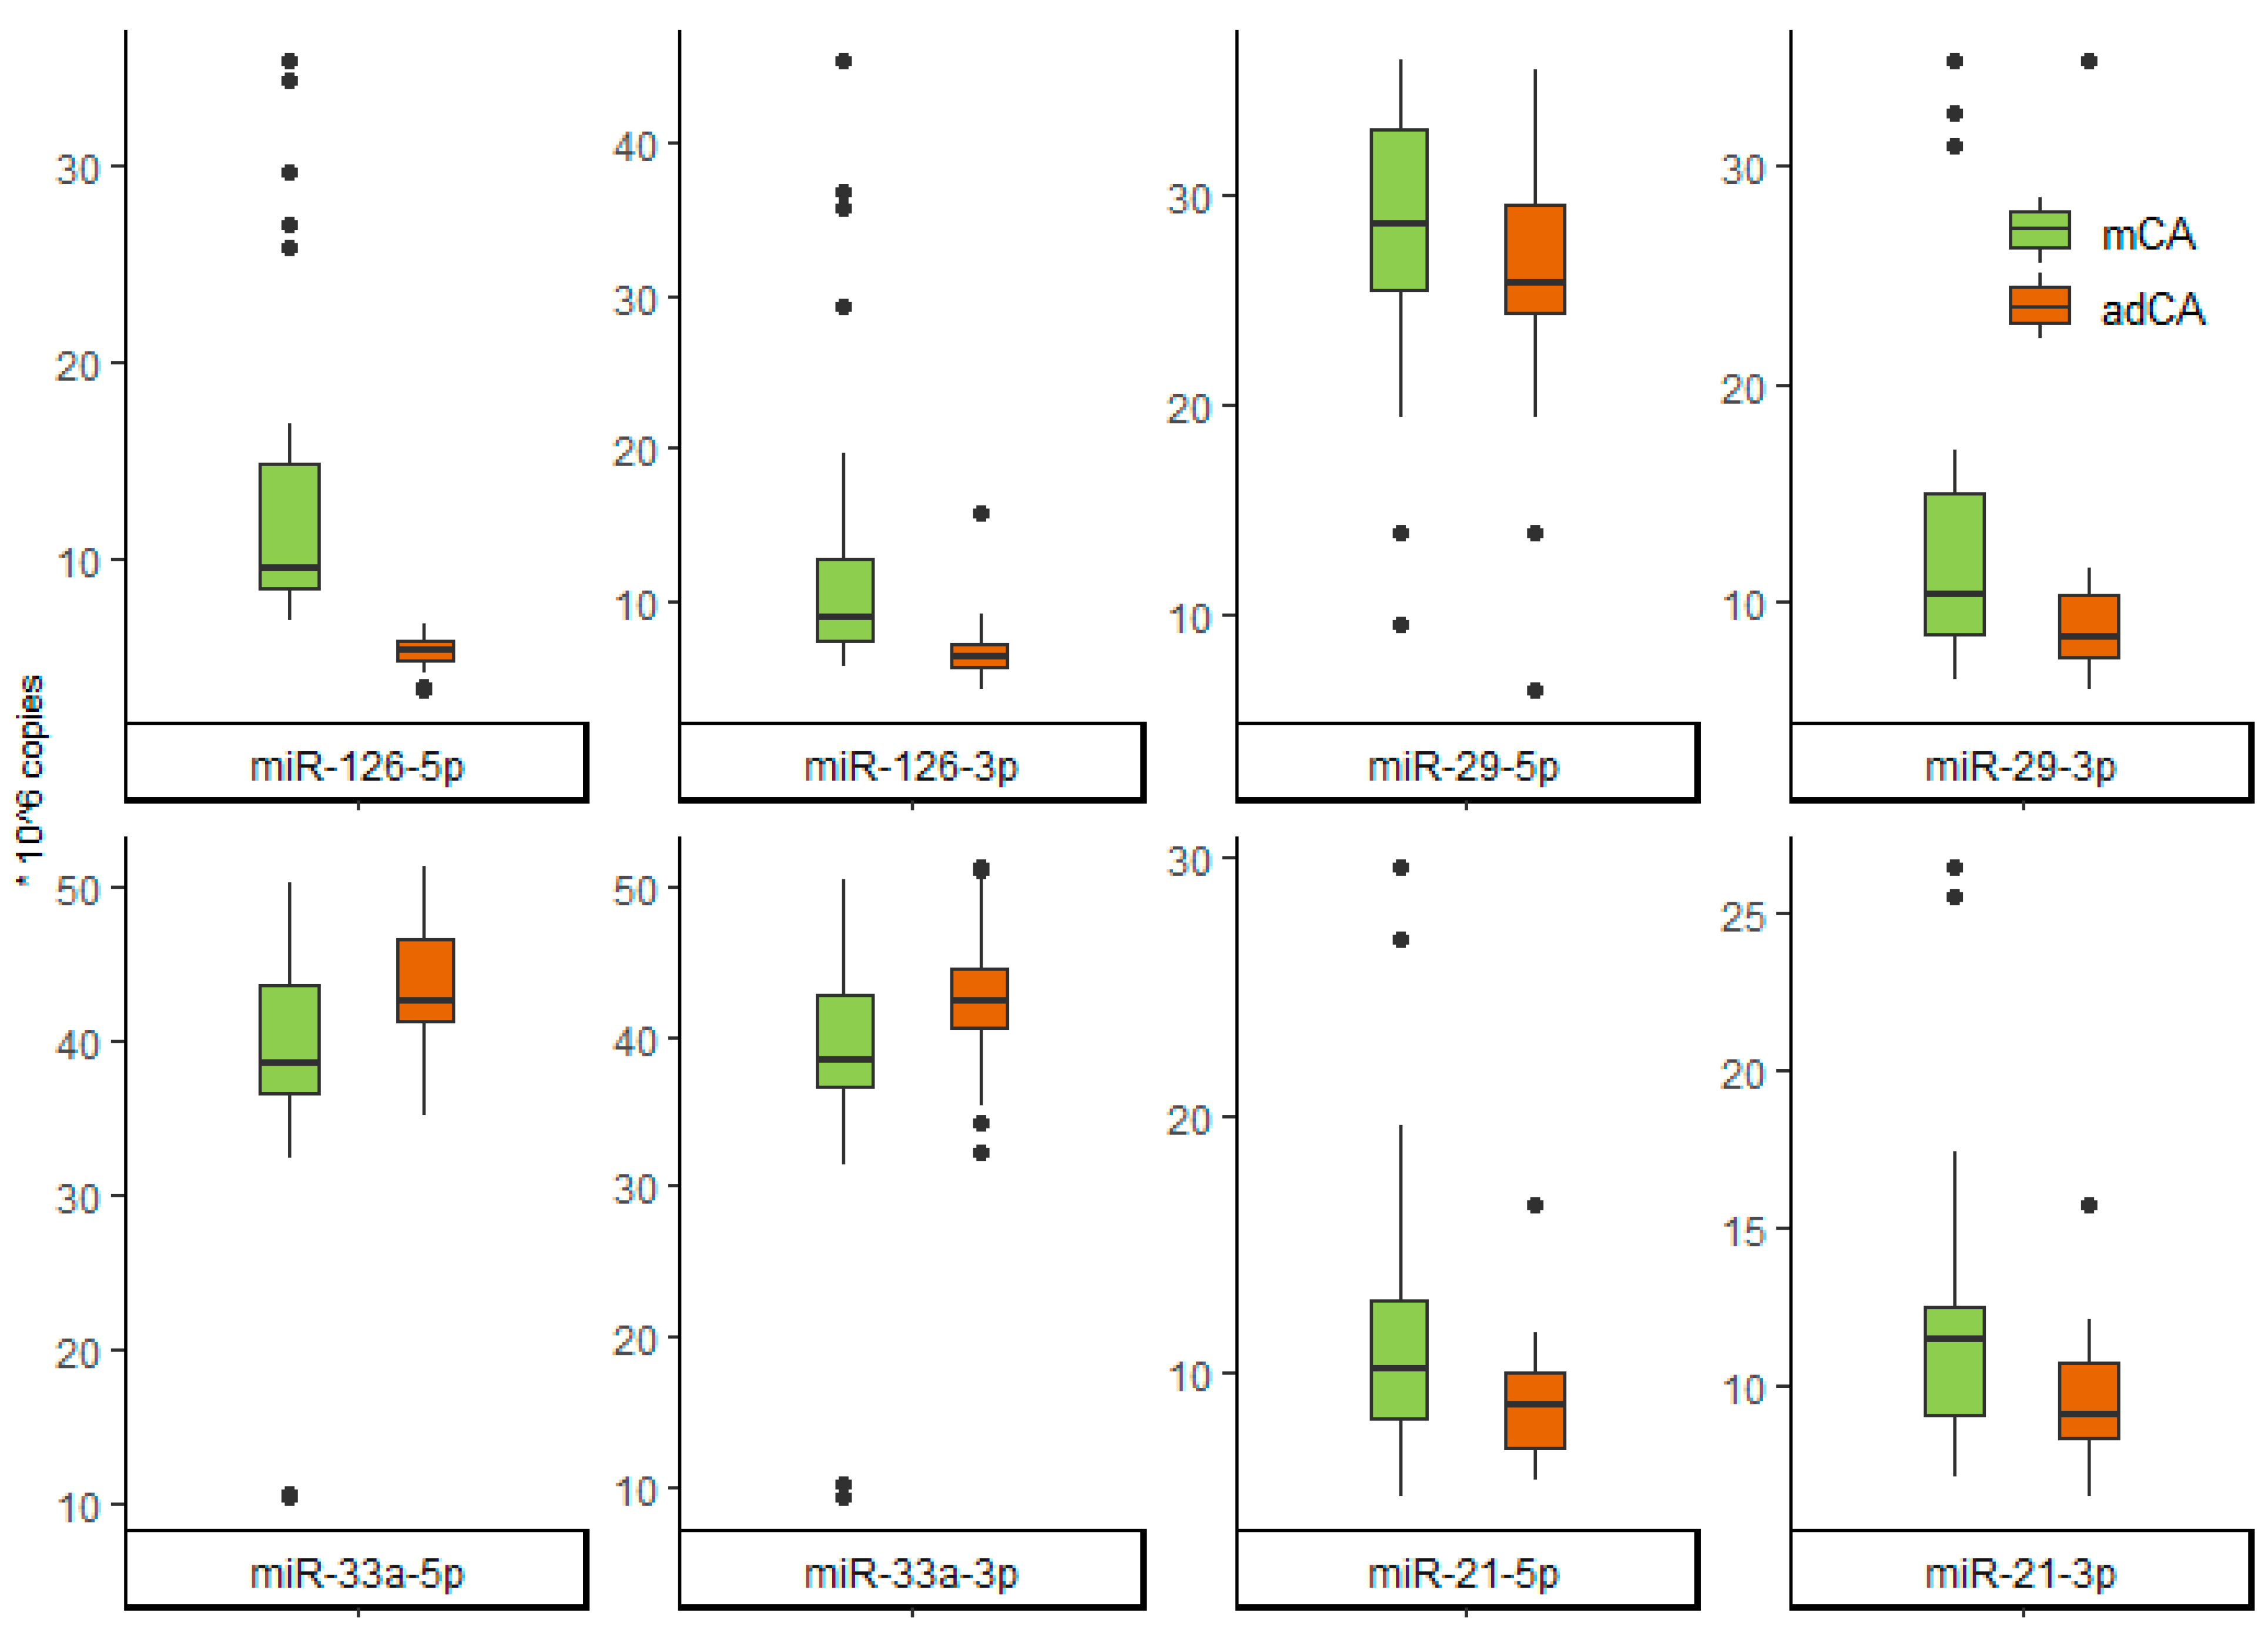
| miR-126-5p | 9.50 [8.42;14.80] | 5.25 [4.76;5.68] | <0.001 |
| miR-126-3p | 8.95 [7.35;12.70] | 6.36 [5.59;7.24] | <0.001 |
| miR-21-5p | 10.20 [8.26;12.90] | 8.73 [7.15;10.05] | 0.048 |
| miR-21-3p | 11.45 [9.15;12.57] | 9.14 [8.37;10.73] | 0.003 |
| miR-29-5p | 28.60 [25.50;33.05] | 25.75 [24.38;29.50] | 0.086 |
| miR-29-3p | 10.36 [8.60;14.99] | 8.46 [7.47;10.3] | 0.001 |
| miR-33a-5p | 38.50 [36.55;43.70] | 42.70 [41.30;46.60] | 0.015 |
| miR-33a-3p | 38.50 [36.60;42.70] | 42.45 [40.55;44.60] | 0.018 |
| mCA (n = 31) | adCA (n = 30) | p | |
|---|---|---|---|
| D-dimer, ng/mL | 360 [185;510] | 350 [260;480] | 0.42 |
| Fibrinogen, g/L | 3.71 [3.27;4.19] | 3.63 [3.16;4.07] | 0.53 |
| AT III, % | 91.5 [84.0;101.0] | 87.7 [84.0;96.0] | 0.29 |
| Protein C, % | 72.3 [63.3;78.0] | 66.5 [62.0;70.4] | 0.06 |
| Protein S, % | 70.0 [60.5;82.2] | 71.0 [60.5;72.4] | 0.85 |
| Plasminogen, % | 69.0 [64.2;88.3] | 82.0 [68.5;98.0] | 0.04 |
| Alpha 2-antiplasmin, % | 95.0 [92.4;104.0] | 100.0 [94.3;107.0] | 0.17 |
| FV, % | 76 [68;89] | 76 [68;97] | 0.76 |
| FVII, % | 67 [64;98] | 85 [71;112] | 0.10 |
| FVIII, % | 110 [89;142] | 160 [141;185] | <0.001 |
| FXII, % | 84 [68;106] | 86 [68;101] | 0.78 |
| ADAMTS13, ug/ml | 0.88 [0.76;1.08] | 0.82 [0.67;0.99] | 0.08 |
| t-PA, ng/mL | 2.9 [2.5;3.6] | 2.77 [2.28;3.58] | 0.69 |
| PAI-1, ng/mL | 47.4 [31.35;49.9] | 44.5 [19.4;55.2] | 0.55 |
Publisher’s Note: MDPI stays neutral with regard to jurisdictional claims in published maps and institutional affiliations. |
© 2022 by the authors. Licensee MDPI, Basel, Switzerland. This article is an open access article distributed under the terms and conditions of the Creative Commons Attribution (CC BY) license (https://creativecommons.org/licenses/by/4.0/).
Share and Cite
Raskurazhev, A.A.; Kuznetsova, P.I.; Shabalina, A.A.; Tanashyan, M.M. MicroRNA and Hemostasis Profile of Carotid Atherosclerosis. Int. J. Mol. Sci. 2022, 23, 10974. https://doi.org/10.3390/ijms231810974
Raskurazhev AA, Kuznetsova PI, Shabalina AA, Tanashyan MM. MicroRNA and Hemostasis Profile of Carotid Atherosclerosis. International Journal of Molecular Sciences. 2022; 23(18):10974. https://doi.org/10.3390/ijms231810974
Chicago/Turabian StyleRaskurazhev, Anton A., Polina I. Kuznetsova, Alla A. Shabalina, and Marine M. Tanashyan. 2022. "MicroRNA and Hemostasis Profile of Carotid Atherosclerosis" International Journal of Molecular Sciences 23, no. 18: 10974. https://doi.org/10.3390/ijms231810974
APA StyleRaskurazhev, A. A., Kuznetsova, P. I., Shabalina, A. A., & Tanashyan, M. M. (2022). MicroRNA and Hemostasis Profile of Carotid Atherosclerosis. International Journal of Molecular Sciences, 23(18), 10974. https://doi.org/10.3390/ijms231810974