
CD73-Adenosinergic Axis Mediates the Protective Effect of Extracellular Vesicles Derived from Mesenchymal Stromal Cells on Ischemic Renal Damage in a Rat Model of Donation after Circulatory Death

 , , , , , , , , , ,
  ,
,  and
and
Abstract
1. Introduction
2. Results
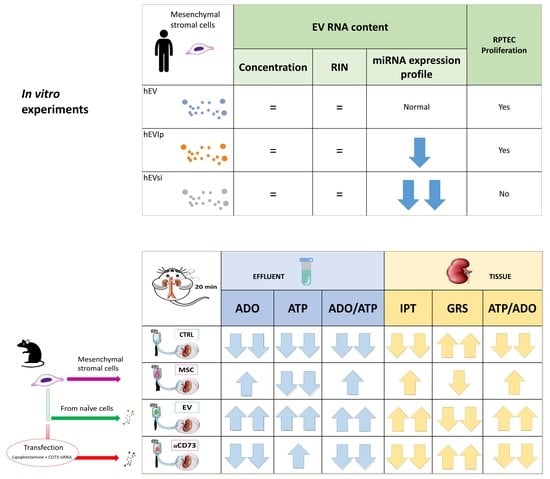
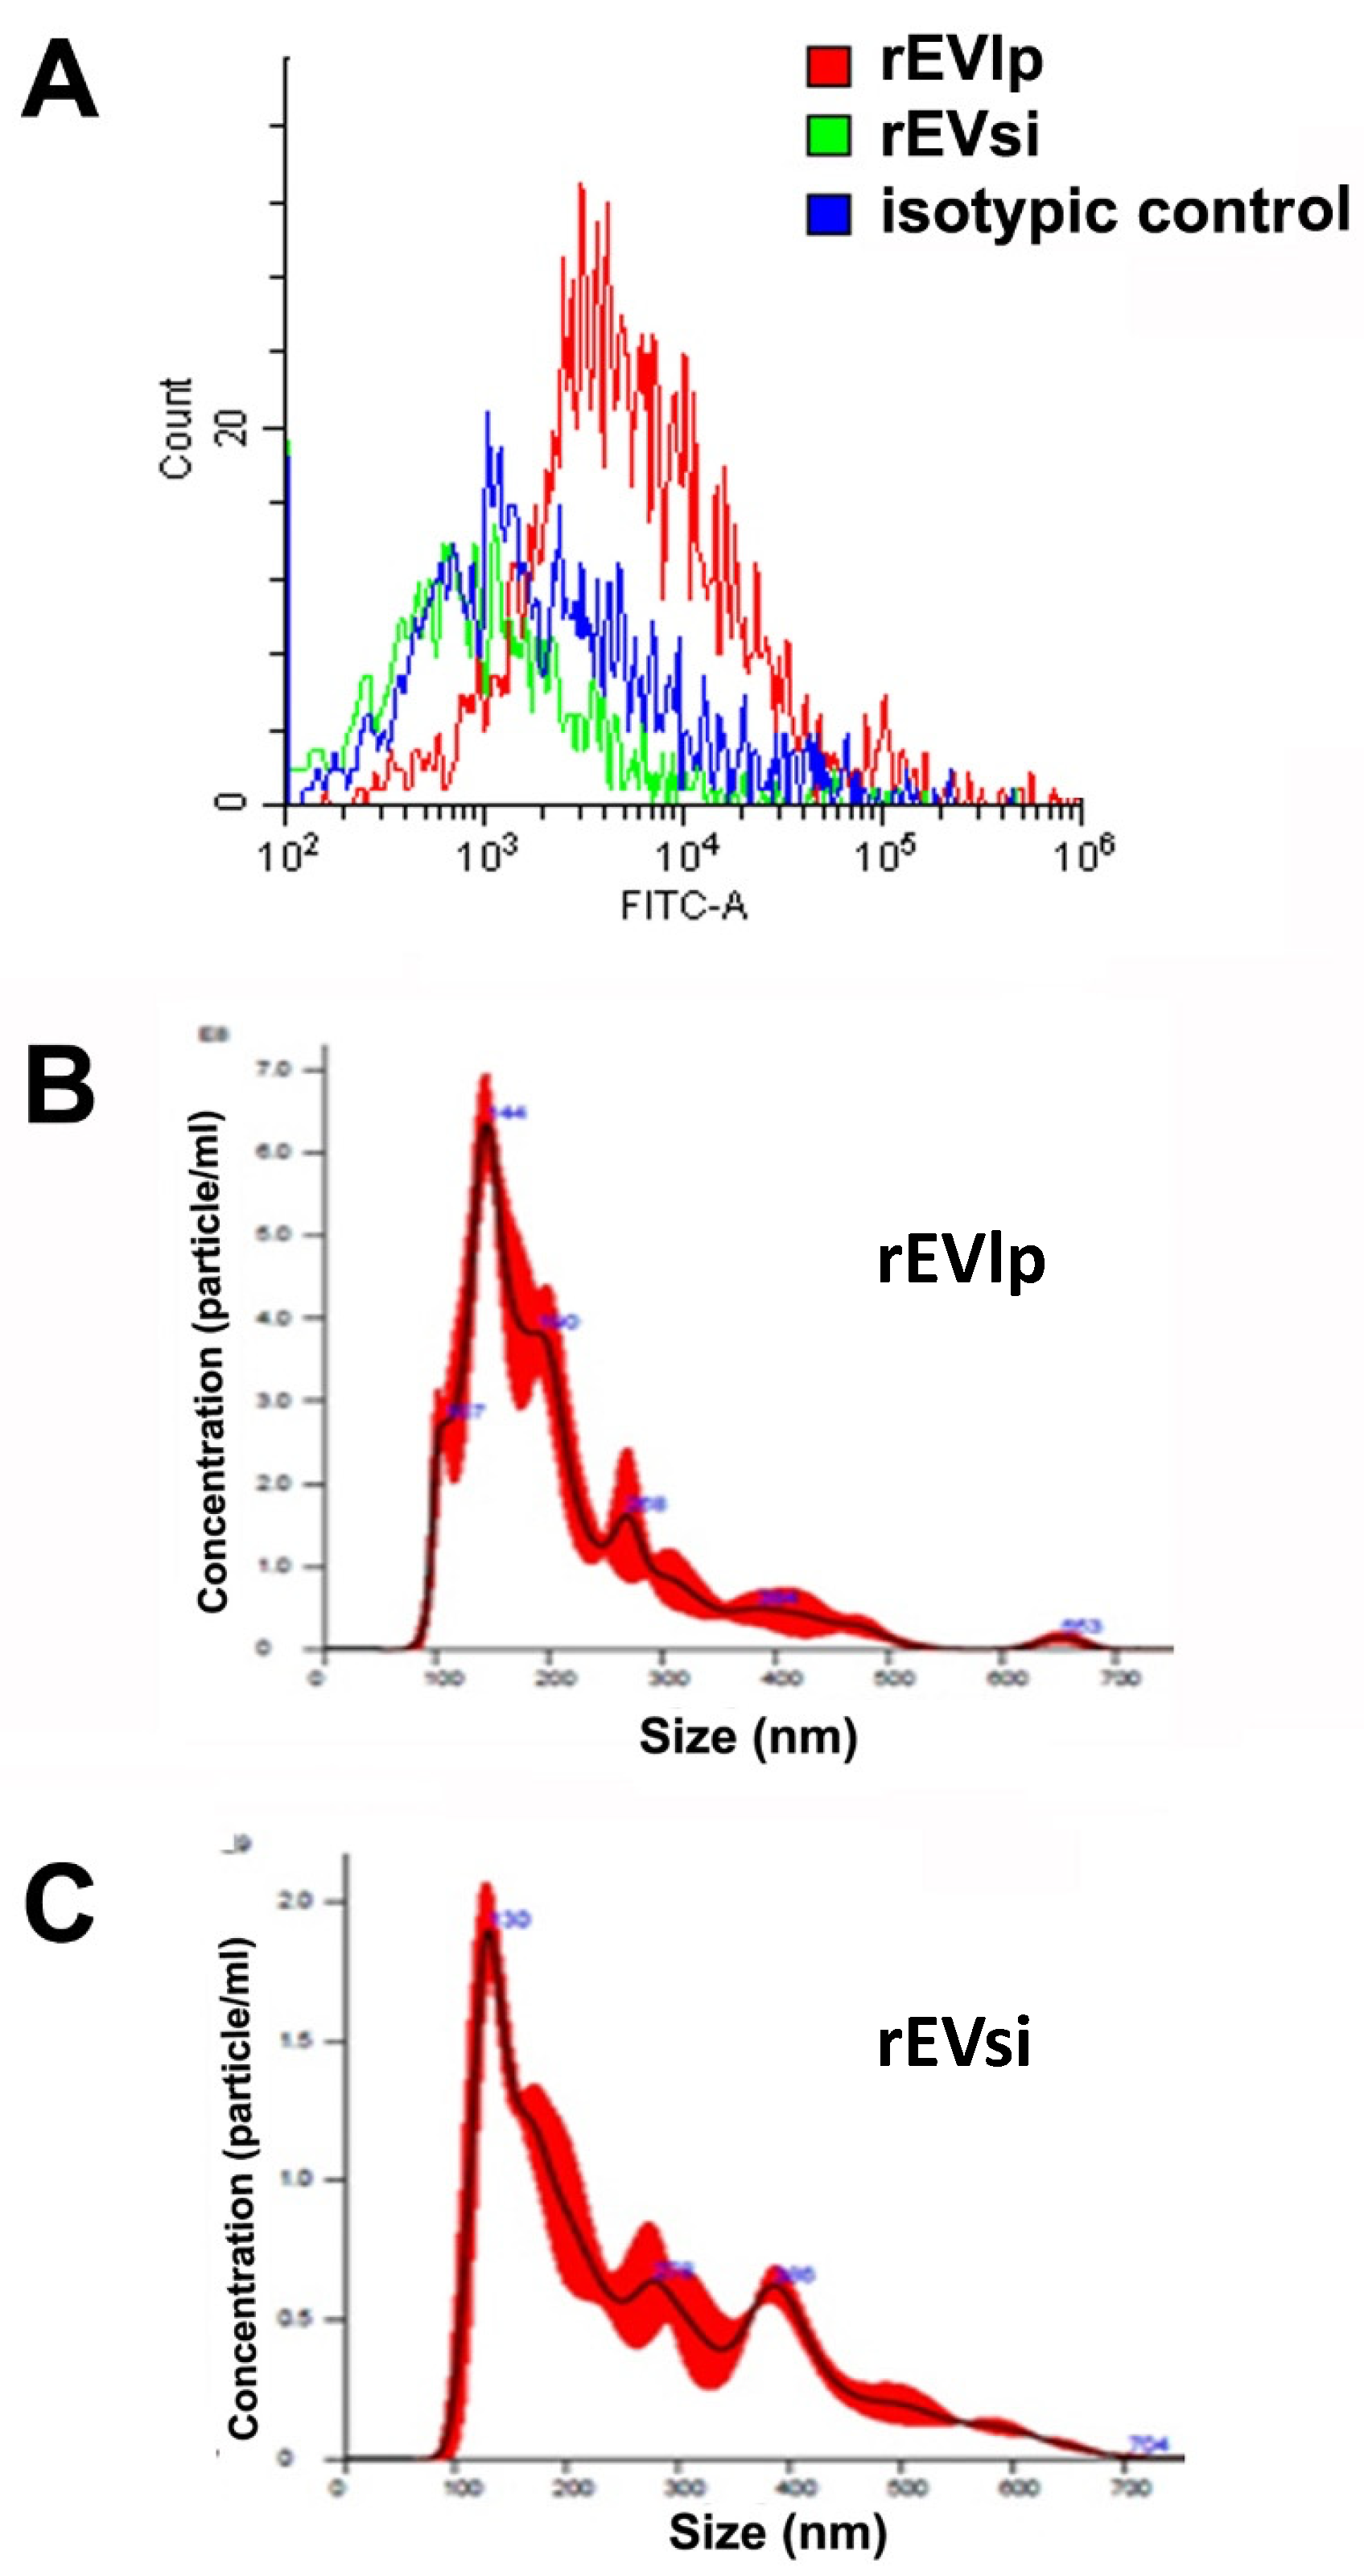
2.1. MSCs and EVs
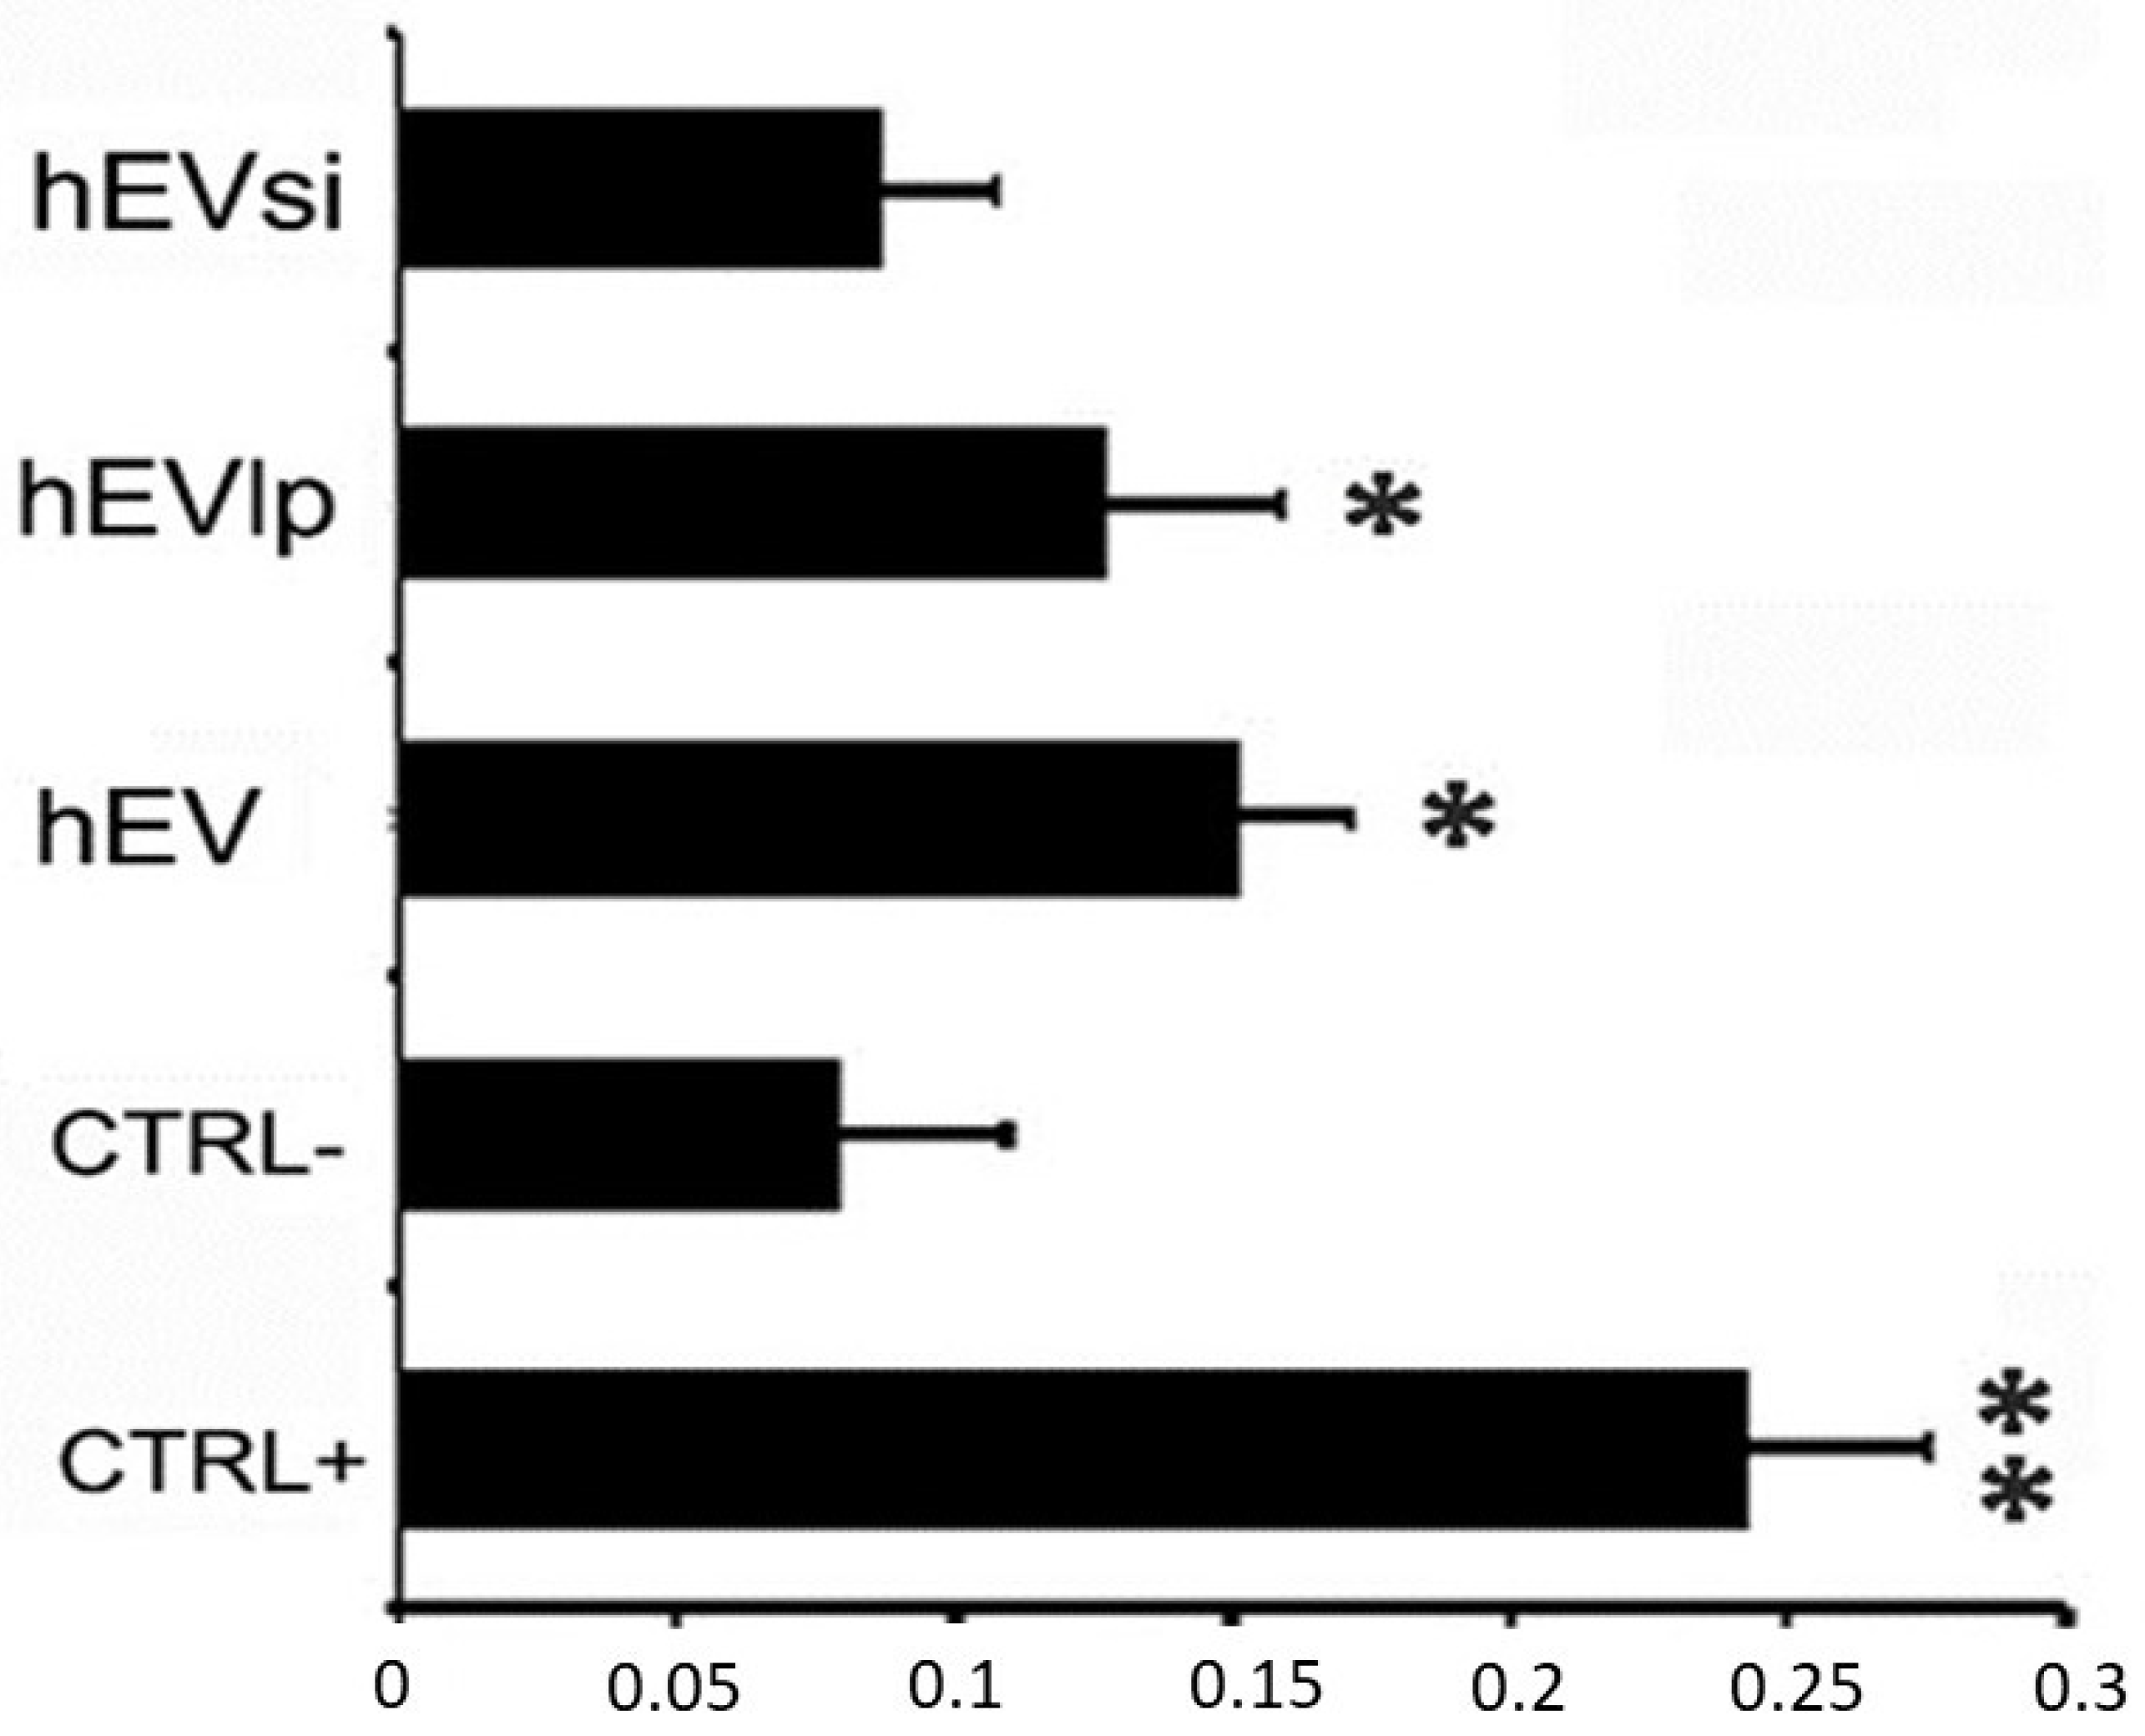
2.2. Cell Proliferation Assay
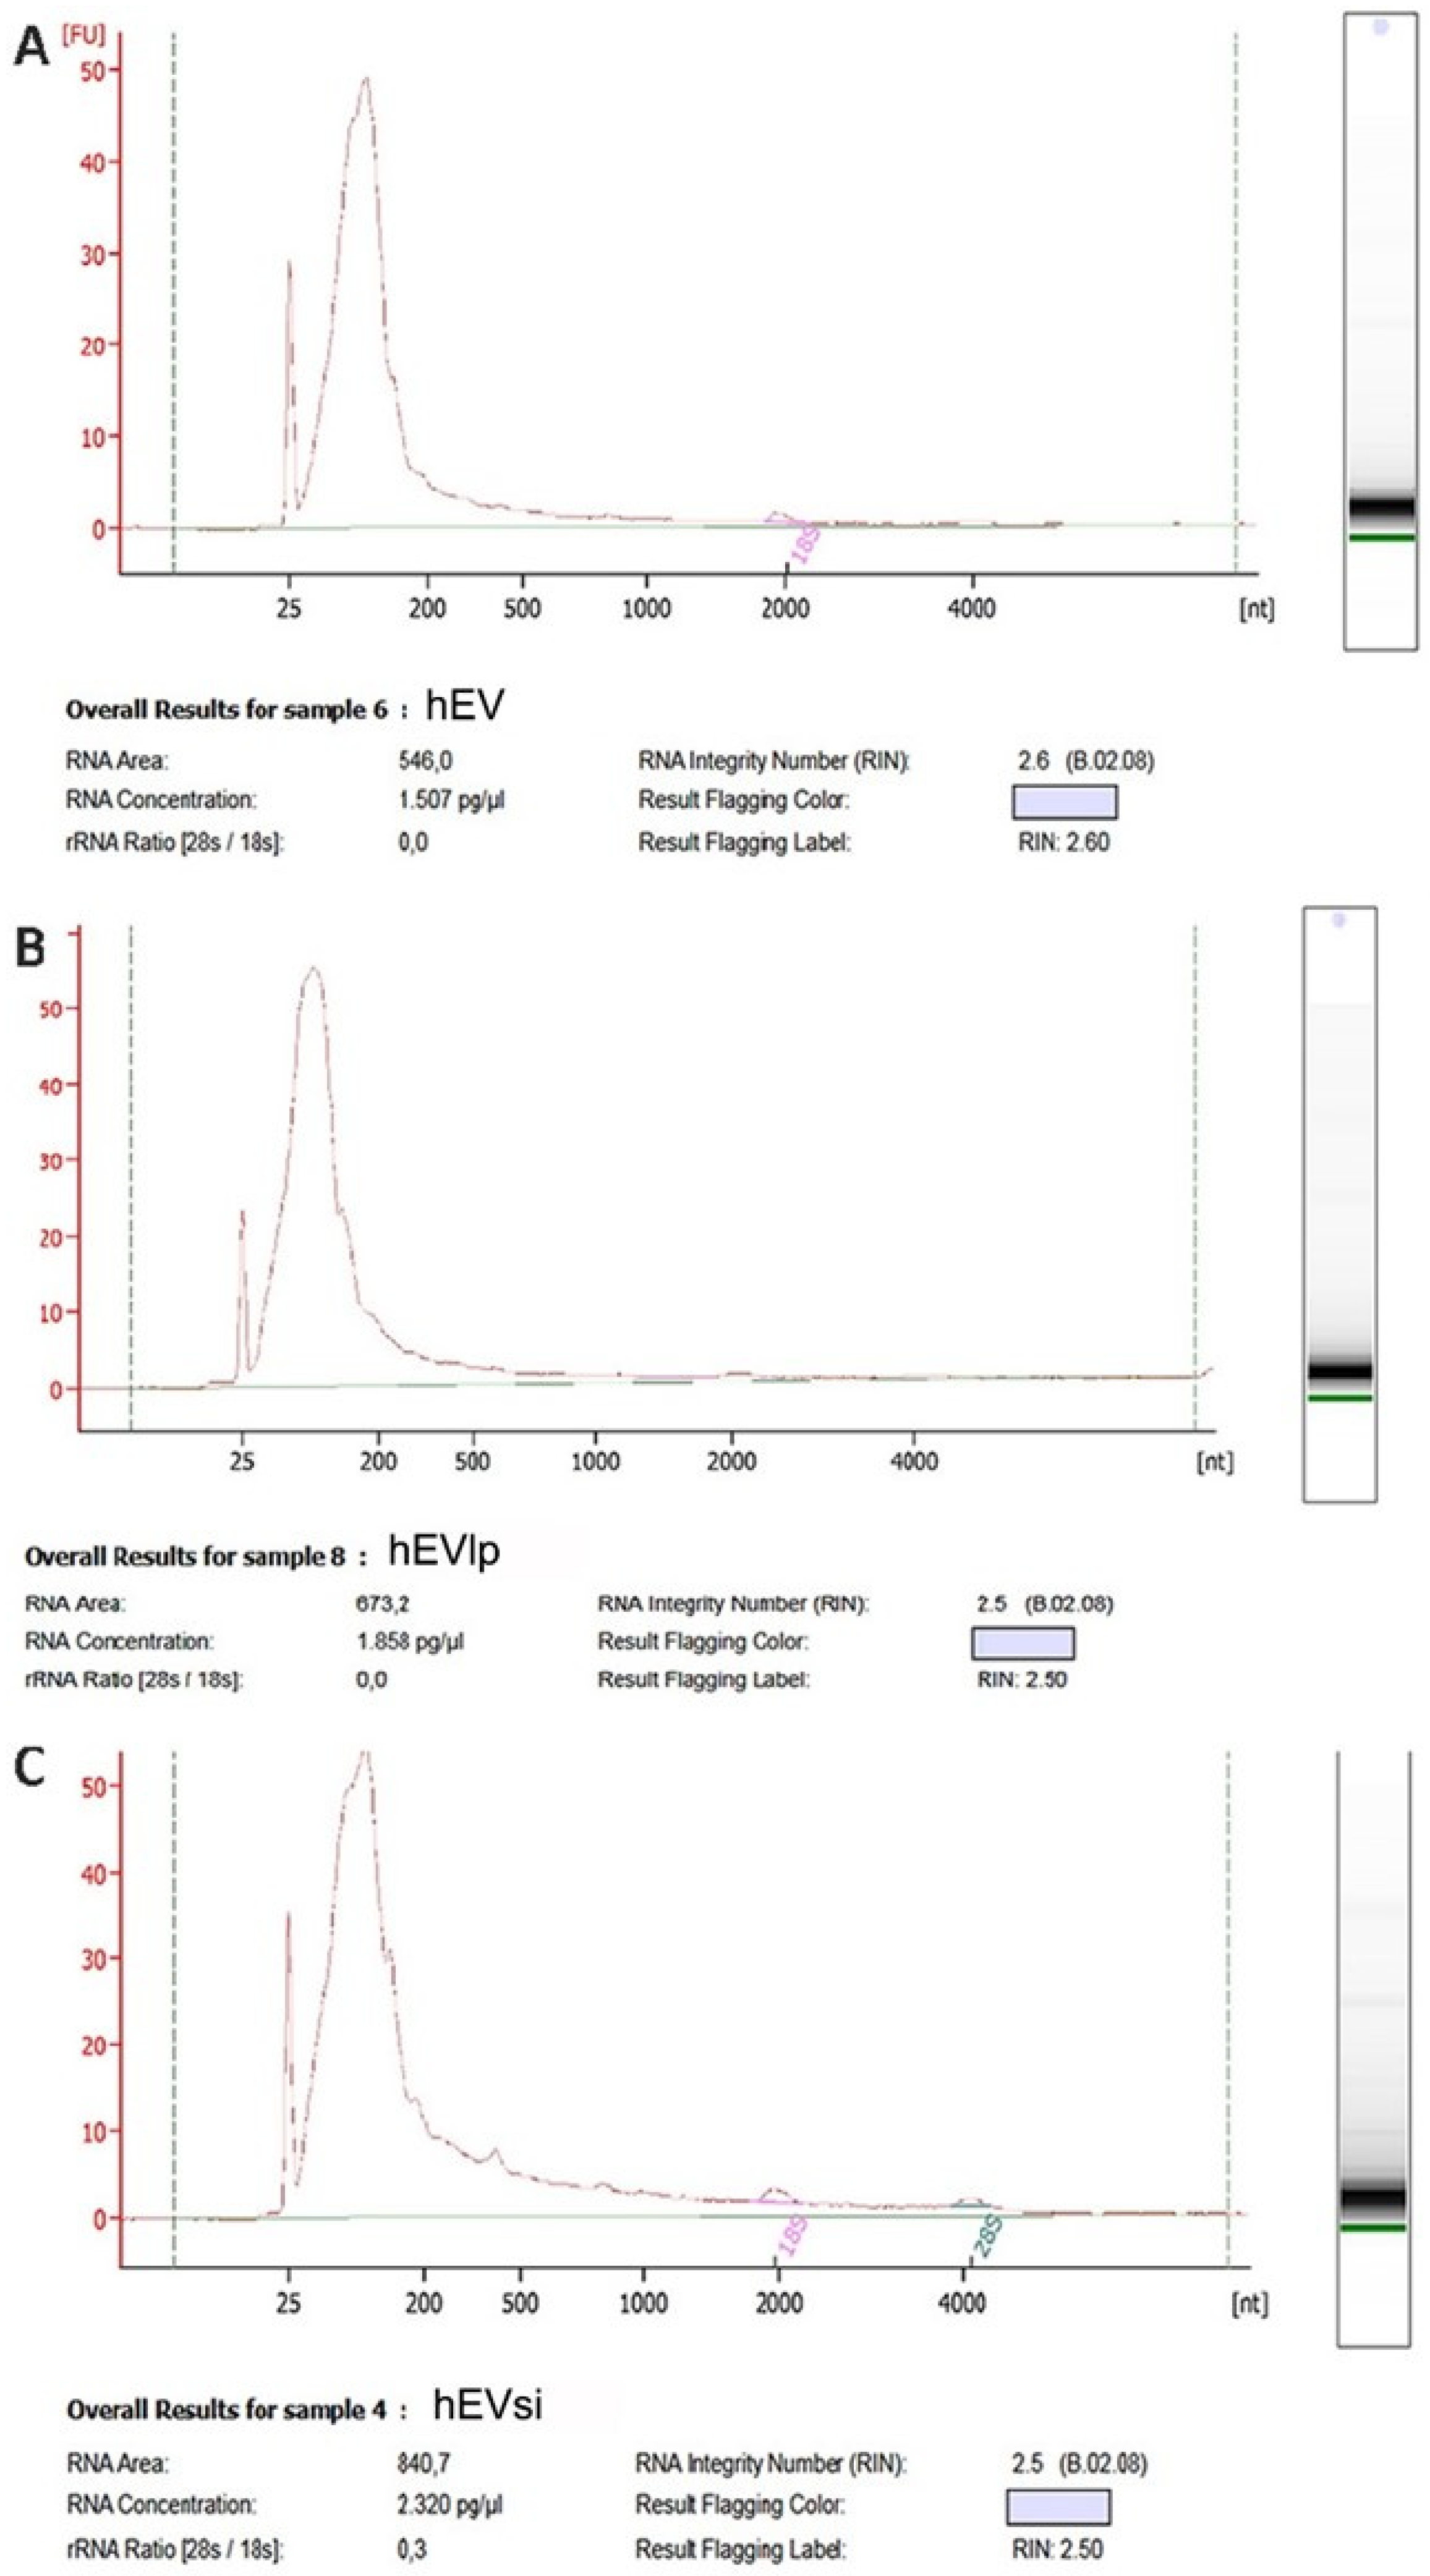
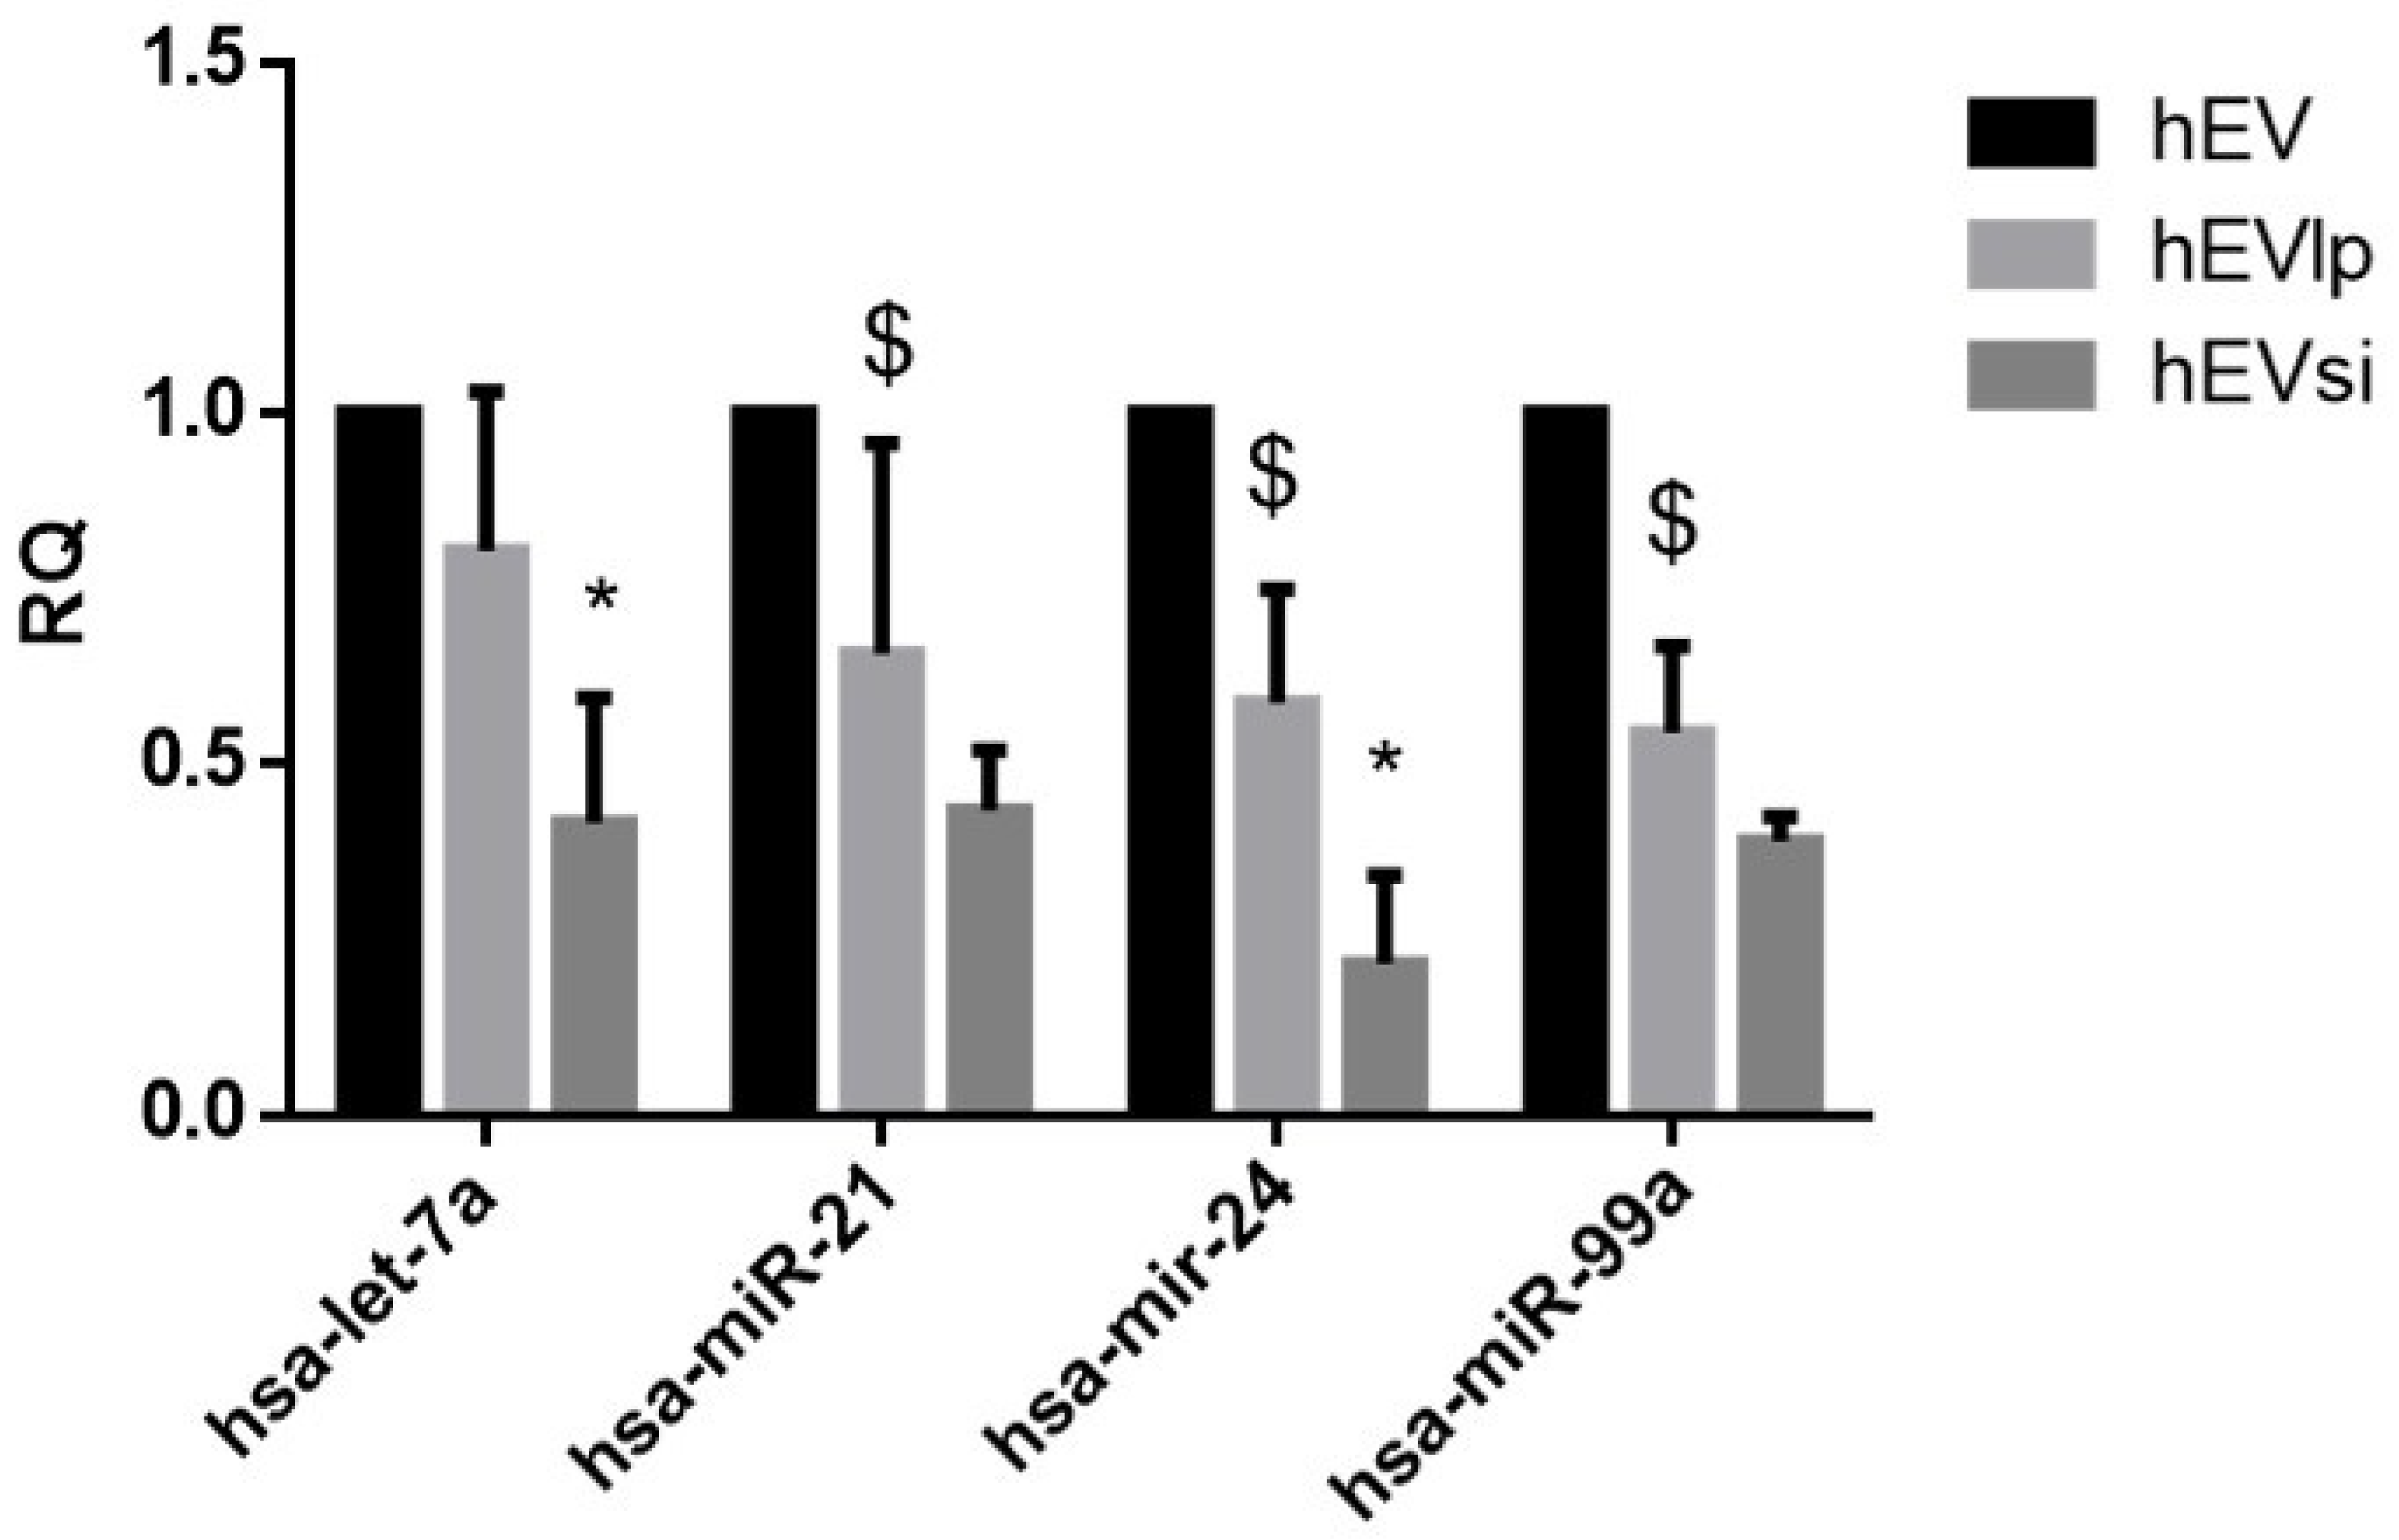
2.3. EV RNA Profiling
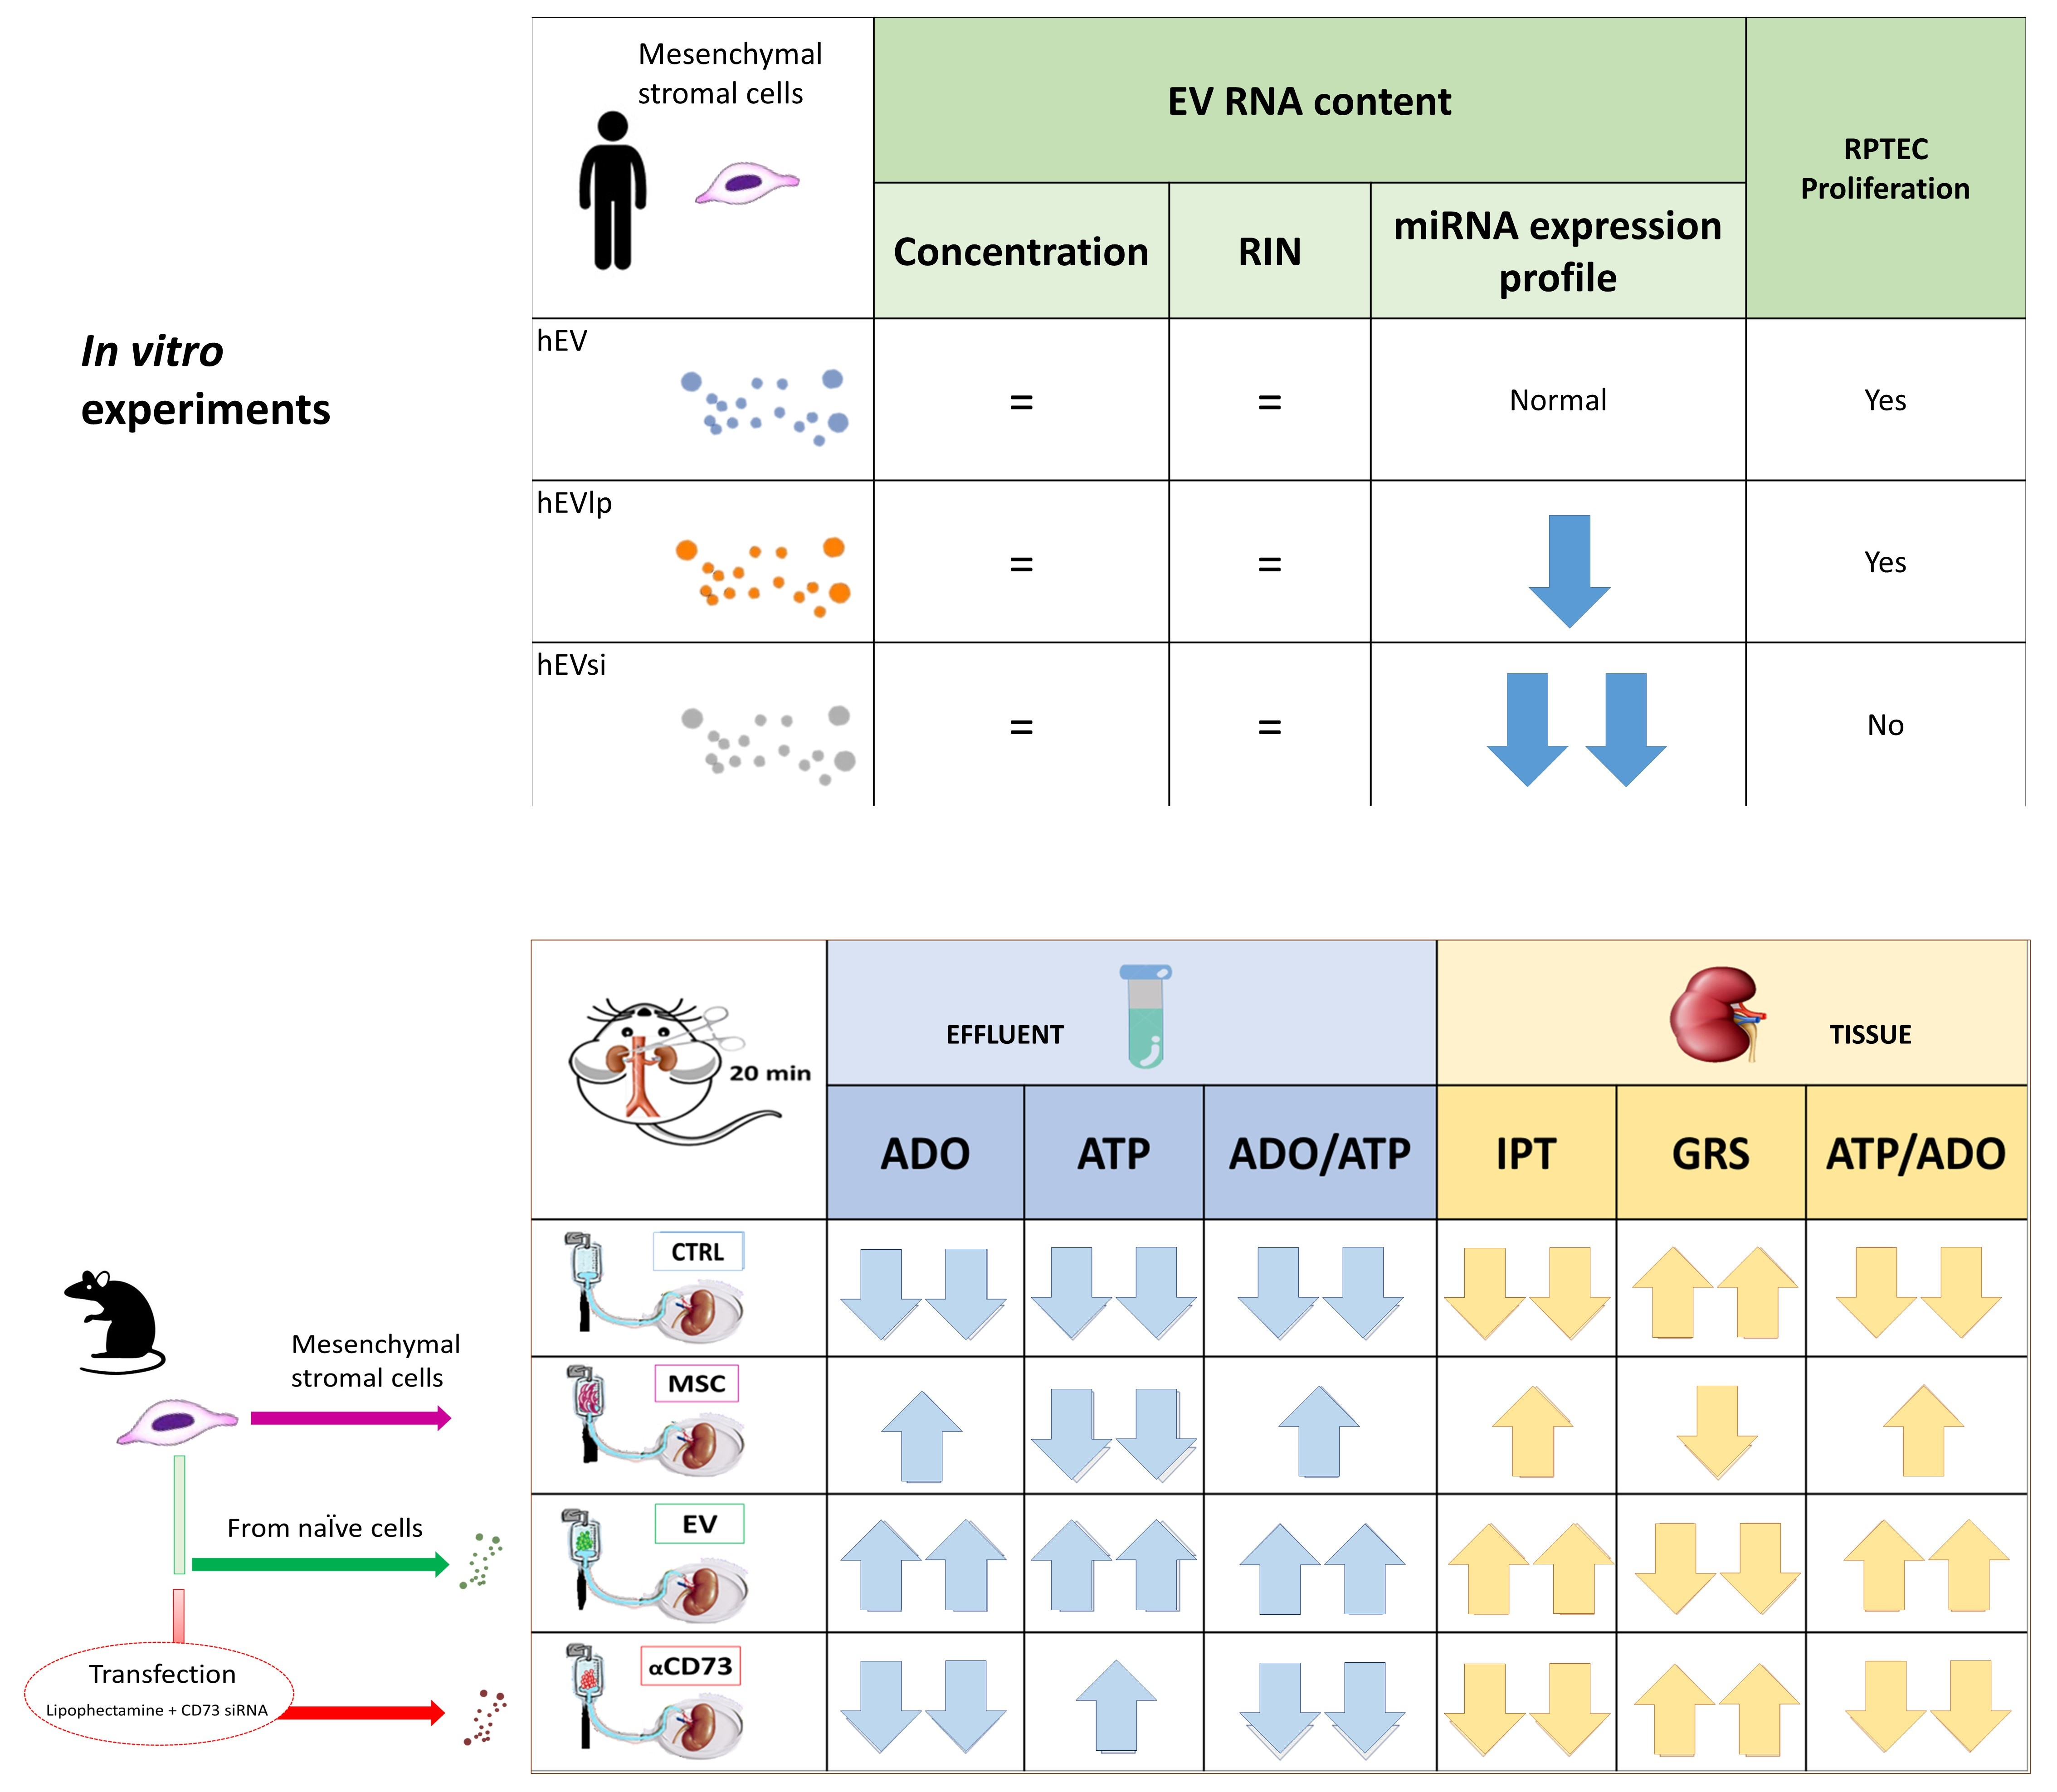
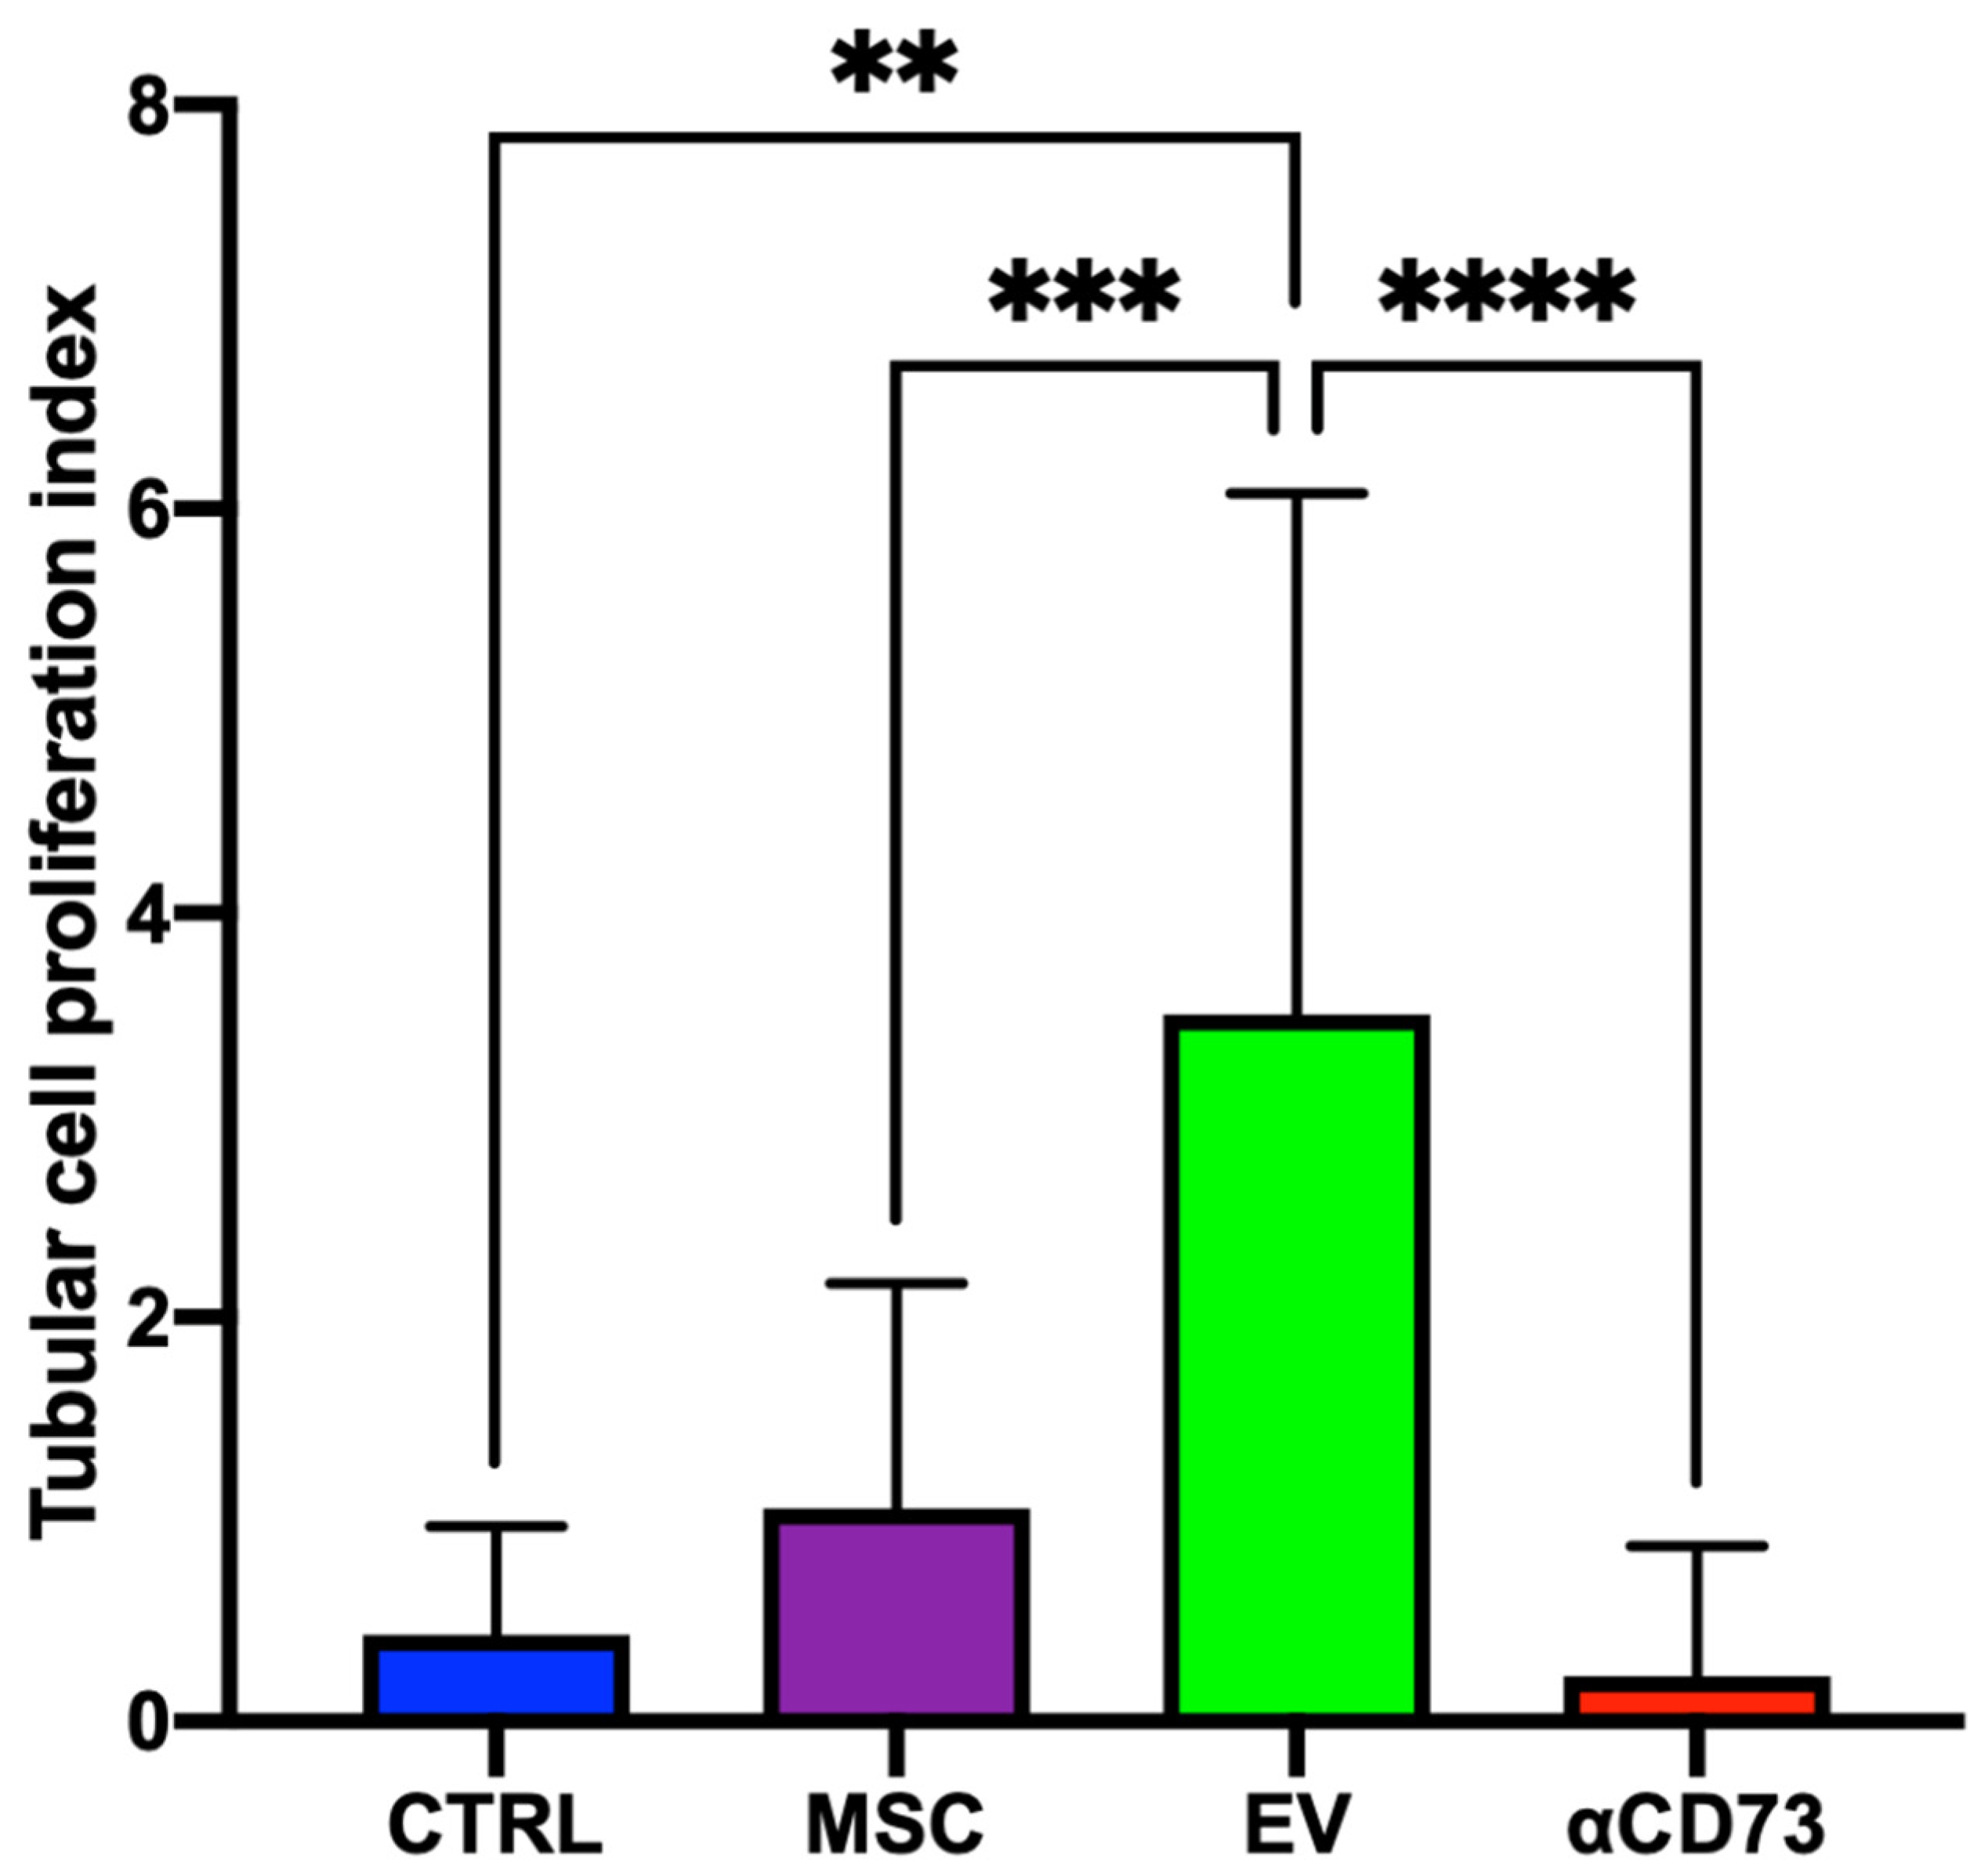
2.4. Tubular Cell Proliferation Index
2.5. Global Renal Ischemic Damage Score
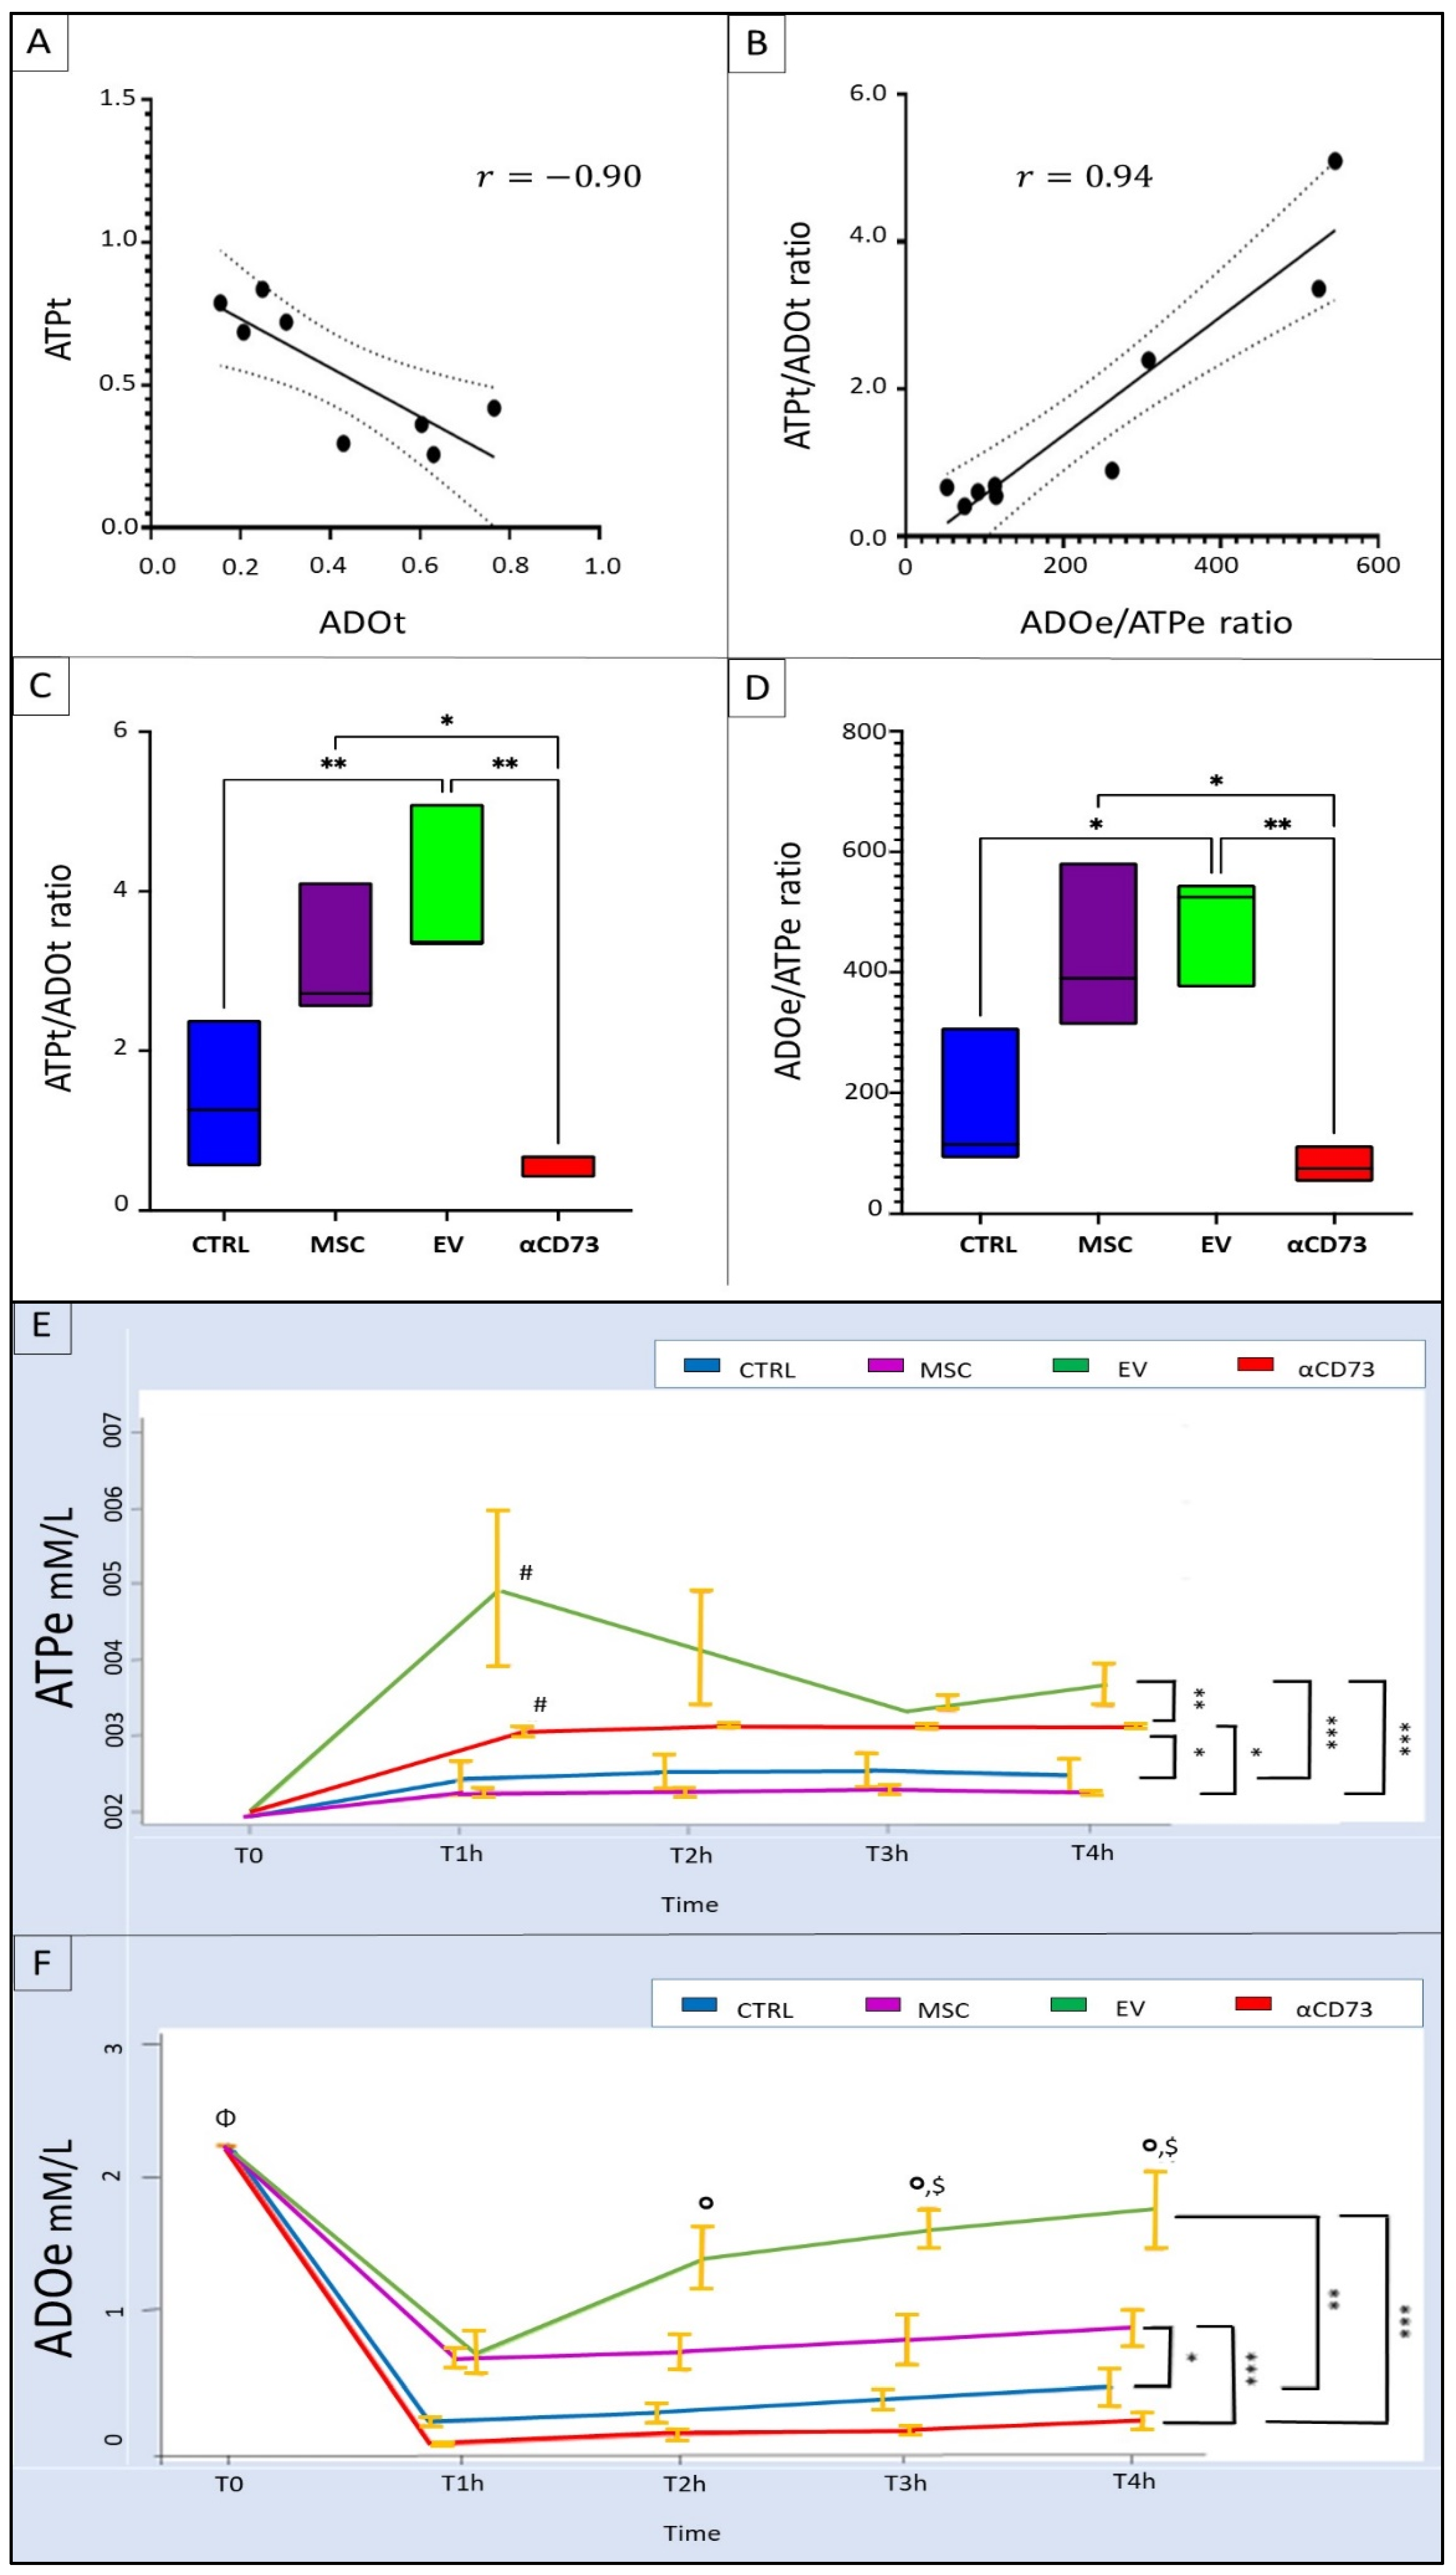
2.6. Interrelationship between Tissue and Effluent Purines
2.7. Effluent and Tissue Purine Ratios
2.8. Time Course of Effluent Purine Levels
2.9. rMSC Intake of ADO
3. Discussion
4. Materials and Methods
4.1. Cell Cultures, Expansion, Silencing, and Characterization
4.1.1. rMSCs
4.1.2. Human Cells
4.1.3. Transient Transfection of rMSCs and hMSCs to Downregulate CD73 Expression
4.2. EV Isolation and Characterization
4.3. Cell-Proliferation Assay
4.4. EV RNA Profiling
- -
- hsa-miR-21-5p (TAGCTTATCAGACTGATGTTGA);
- -
- hsa-miR-24-3p (TGGCTCAGTTCAGCAGGAA);
- -
- hsa-let-7a-5p (TGAGGTAGTAGGTTGTATAGTT); and
- -
- hsa-miR-99a-5p (AACCCGTAGATCCGATCTTGTG).
4.5. rMSC Intake of ADO
4.6. Experimental Design: DCD Kidney Model
- CTRL group: n = 4 DCD rat kidneys perfused with BS
- MSC group: n = 4 DCD rat kidneys perfused with BS supplemented with rMSCs
- EV group: n = 4 DCD rat kidneys perfused with BS supplemented with rEVs
- αCD73 group: n = 3 DCD rat kidneys perfused with BS supplemented with rEVsi
4.6.1. Samples
4.6.2. Histological Studies
Tubular Cell Proliferation Index
Renal Morphology
4.6.3. Biochemical Assays
Tissue Homogenization
Separation of ADO
ATP Measurement
4.7. Statistical Analysis
Supplementary Materials
Author Contributions
Funding
Institutional Review Board Statement
Informed Consent Statement
Data Availability Statement
Acknowledgments
Conflicts of Interest
References
- Gregorini, M.; Corradetti, V.; Rocca, C.; Pattonieri, E.F.; Valsania, T.; Milanesi, S.; Serpieri, N.; Bedino, G.; Esposito, P.; Libetta, C.; et al. Mesenchymal Stromal Cells Prevent Renal Fibrosis in a Rat Model of Unilateral Ureteral Obstruction by Suppressing the Renin-Angiotensin System via HuR. PLoS ONE 2016, 11, e0148542. [Google Scholar] [CrossRef]
- Gregorini, M.; Bosio, F.; Rocca, C.; Corradetti, V.; Valsania, T.; Pattonieri, E.F.; Esposito, P.; Bedino, G.; Collesi, C.; Libetta, C.; et al. Mesenchymal Stromal Cells Reset the Scatter Factor System and Cytokine Network in Experimental Kidney Transplantation. BMC Immunol. 2014, 15, 44. [Google Scholar] [CrossRef] [PubMed]
- Rampino, T.; Gregorini, M.; Bedino, G.; Piotti, G.; Gabanti, E.; Ibatici, A.; Sessarego, N.; Piacenza, C.; Balenzano, C.T.; Esposito, P.; et al. Mesenchymal Stromal Cells Improve Renal Injury in Anti-Thy 1 Nephritis by Modulating Inflammatory Cytokines and Scatter Factors. Clin. Sci. Lond. Engl. 1979 2011, 120, 25–36. [Google Scholar] [CrossRef]
- Müller, L.; Tunger, A.; Wobus, M.; von Bonin, M.; Towers, R.; Bornhäuser, M.; Dazzi, F.; Wehner, R.; Schmitz, M. Immunomodulatory Properties of Mesenchymal Stromal Cells: An Update. Front. Cell Dev. Biol. 2021, 9, 637725. [Google Scholar] [CrossRef]
- Doorn, J.; Moll, G.; Le Blanc, K.; van Blitterswijk, C.; de Boer, J. Therapeutic Applications of Mesenchymal Stromal Cells: Paracrine Effects and Potential Improvements. Tissue Eng. Part B Rev. 2012, 18, 101–115. [Google Scholar] [CrossRef]
- Gregorini, M.; Maccario, R.; Avanzini, M.A.; Corradetti, V.; Moretta, A.; Libetta, C.; Esposito, P.; Bosio, F.; Dal Canton, A.; Rampino, T. Antineutrophil Cytoplasmic Antibody-Associated Renal Vasculitis Treated with Autologous Mesenchymal Stromal Cells: Evaluation of the Contribution of Immune-Mediated Mechanisms. Mayo Clin. Proc. 2013, 88, 1174–1179. [Google Scholar] [CrossRef]
- Bruno, S.; Grange, C.; Deregibus, M.C.; Calogero, R.A.; Saviozzi, S.; Collino, F.; Morando, L.; Busca, A.; Falda, M.; Bussolati, B.; et al. Mesenchymal Stem Cell-Derived Microvesicles Protect against Acute Tubular Injury. J. Am. Soc. Nephrol. JASN 2009, 20, 1053–1067. [Google Scholar] [CrossRef]
- Bruno, S.; Tapparo, M.; Collino, F.; Chiabotto, G.; Deregibus, M.C.; Soares Lindoso, R.; Neri, F.; Kholia, S.; Giunti, S.; Wen, S.; et al. Renal Regenerative Potential of Different Extracellular Vesicle Populations Derived from Bone Marrow Mesenchymal Stromal Cells. Tissue Eng. Part A 2017, 23, 1262–1273. [Google Scholar] [CrossRef] [PubMed]
- Bruno, S.; Grange, C.; Collino, F.; Deregibus, M.C.; Cantaluppi, V.; Biancone, L.; Tetta, C.; Camussi, G. Microvesicles Derived from Mesenchymal Stem Cells Enhance Survival in a Lethal Model of Acute Kidney Injury. PLoS ONE 2012, 7, e33115. [Google Scholar] [CrossRef]
- Baglio, S.R.; Pegtel, D.M.; Baldini, N. Mesenchymal Stem Cell Secreted Vesicles Provide Novel Opportunities in (Stem) Cell-Free Therapy. Front. Physiol. 2012, 3, 359. [Google Scholar] [CrossRef] [PubMed]
- Rampino, T.; Gregorini, M.; Guidetti, C.; Broggini, M.; Marchini, S.; Bonomi, R.; Maggio, M.; Roscini, E.; Soccio, G.; Tiboldo, R.; et al. KCNA1 and TRPC6 Ion Channels and NHE1 Exchanger Operate the Biological Outcome of HGF/Scatter Factor in Renal Tubular Cells. Growth Factors Chur Switz. 2007, 25, 382–391. [Google Scholar] [CrossRef]
- Gregorini, M.; Corradetti, V.; Pattonieri, E.F.; Rocca, C.; Milanesi, S.; Peloso, A.; Canevari, S.; De Cecco, L.; Dugo, M.; Avanzini, M.A.; et al. Perfusion of Isolated Rat Kidney with Mesenchymal Stromal Cells/Extracellular Vesicles Prevents Ischaemic Injury. J. Cell. Mol. Med. 2017, 21, 3381–3393. [Google Scholar] [CrossRef]
- Al-Nbaheen, M.; Vishnubalaji, R.; Ali, D.; Bouslimi, A.; Al-Jassir, F.; Megges, M.; Prigione, A.; Adjaye, J.; Kassem, M.; Aldahmash, A. Human Stromal (Mesenchymal) Stem Cells from Bone Marrow, Adipose Tissue and Skin Exhibit Differences in Molecular Phenotype and Differentiation Potential. Stem Cell Rev. Rep. 2013, 9, 32–43. [Google Scholar] [CrossRef]
- Lindoso, R.S.; Collino, F.; Bruno, S.; Araujo, D.S.; Sant’Anna, J.F.; Tetta, C.; Provero, P.; Quesenberry, P.J.; Vieyra, A.; Einicker-Lamas, M.; et al. Extracellular Vesicles Released from Mesenchymal Stromal Cells Modulate MiRNA in Renal Tubular Cells and Inhibit ATP Depletion Injury. Stem Cells Dev. 2014, 23, 1809–1819. [Google Scholar] [CrossRef]
- Lonati, C.; Bassani, G.A.; Brambilla, D.; Leonardi, P.; Carlin, A.; Maggioni, M.; Zanella, A.; Dondossola, D.; Fonsato, V.; Grange, C.; et al. Mesenchymal Stem Cell-Derived Extracellular Vesicles Improve the Molecular Phenotype of Isolated Rat Lungs during Ischemia/Reperfusion Injury. J. Heart Lung Transplant. Off. Publ. Int. Soc. Heart Transplant. 2019, 38, 1306–1316. [Google Scholar] [CrossRef] [PubMed]
- Williams, M.; Jarvis, M.F. Purinergic and Pyrimidinergic Receptors as Potential Drug Targets. Biochem. Pharmacol. 2000, 59, 1173–1185. [Google Scholar] [CrossRef]
- Jarvis, M.F. Therapeutic Potential of Adenosine Kinase Inhibition-Revisited. Pharmacol. Res. Perspect. 2019, 7, e00506. [Google Scholar] [CrossRef]
- Kishore, B.K.; Robson, S.C.; Dwyer, K.M. CD39-Adenosinergic Axis in Renal Pathophysiology and Therapeutics. Purinergic Signal. 2018, 14, 109–120. [Google Scholar] [CrossRef] [PubMed]
- Minor, M.; Alcedo, K.P.; Battaglia, R.A.; Snider, N.T. Cell Type- and Tissue-Specific Functions of Ecto-5′-Nucleotidase (CD73). Am. J. Physiol.-Cell Physiol. 2019, 317, C1079–C1092. [Google Scholar] [CrossRef] [PubMed]
- Eltzschig, H.K.; Köhler, D.; Eckle, T.; Kong, T.; Robson, S.C.; Colgan, S.P. Central Role of Sp1-Regulated CD39 in Hypoxia/Ischemia Protection. Blood 2009, 113, 224–232. [Google Scholar] [CrossRef]
- Semenza, G.L. Hypoxia-Inducible Factor 1: Regulator of Mitochondrial Metabolism and Mediator of Ischemic Preconditioning. Biochim. Biophys. Acta 2011, 1813, 1263–1268. [Google Scholar] [CrossRef] [PubMed]
- Rabadi, M.M.; Lee, H.T. Adenosine Receptors and Renal Ischaemia Reperfusion Injury. Acta Physiol. 2015, 213, 222–231. [Google Scholar] [CrossRef] [PubMed]
- Wang, B.; Wan, J.; Gong, X.; Kuang, G.; Cheng, X.; Min, S. Mangiferin Attenuates Renal Ischemia-Reperfusion Injury by Inhibiting Inflammation and Inducing Adenosine Production. Int. Immunopharmacol. 2015, 25, 148–154. [Google Scholar] [CrossRef] [PubMed]
- Fredholm, B.B. Adenosine, an Endogenous Distress Signal, Modulates Tissue Damage and Repair. Cell Death Differ. 2007, 14, 1315–1323. [Google Scholar] [CrossRef]
- Módis, K.; Gero, D.; Nagy, N.; Szoleczky, P.; Tóth, Z.D.; Szabó, C. Cytoprotective Effects of Adenosine and Inosine in an in Vitro Model of Acute Tubular Necrosis. Br. J. Pharmacol. 2009, 158, 1565–1578. [Google Scholar] [CrossRef] [PubMed]
- Chiarella, A.M.; Ryu, Y.K.; Manji, G.A.; Rustgi, A.K. Extracellular ATP and Adenosine in Cancer Pathogenesis and Treatment. Trends Cancer 2021, 7, 731–750. [Google Scholar] [CrossRef]
- Dwyer, K.M.; Kishore, B.K.; Robson, S.C. Conversion of Extracellular ATP into Adenosine: A Master Switch in Renal Health and Disease. Nat. Rev. Nephrol. 2020, 16, 509–524. [Google Scholar] [CrossRef]
- Sung, S.-S.J.; Li, L.; Huang, L.; Lawler, J.; Ye, H.; Rosin, D.L.; Vincent, I.S.; Le, T.H.; Yu, J.; Görldt, N.; et al. Proximal Tubule CD73 Is Critical in Renal Ischemia-Reperfusion Injury Protection. J. Am. Soc. Nephrol. JASN 2017, 28, 888–902. [Google Scholar] [CrossRef]
- Jian, R.; Sun, Y.; Wang, Y.; Yu, J.; Zhong, L.; Zhou, P. CD73 Protects Kidney from Ischemia-Reperfusion Injury through Reduction of Free Radicals. APMIS Acta Pathol. Microbiol. Immunol. Scand. 2012, 120, 130–138. [Google Scholar] [CrossRef]
- Roberts, V.; Lu, B.; Rajakumar, S.; Cowan, P.J.; Dwyer, K.M. The CD39-Adenosinergic Axis in the Pathogenesis of Renal Ischemia-Reperfusion Injury. Purinergic Signal. 2013, 9, 135–143. [Google Scholar] [CrossRef]
- Zhou, Q.; Gong, X.; Kuang, G.; Jiang, R.; Xie, T.; Tie, H.; Chen, X.; Li, K.; Wan, J.; Wang, B. Ferulic Acid Protected from Kidney Ischemia Reperfusion Injury in Mice: Possible Mechanism Through Increasing Adenosine Generation via HIF-1α. Inflammation 2018, 41, 2068–2078. [Google Scholar] [CrossRef] [PubMed]
- Kim, M.; Ham, A.; Kim, J.Y.; Brown, K.M.; D’Agati, V.D.; Lee, H.T. The Volatile Anesthetic Isoflurane Induces Ecto-5′-Nucleotidase (CD73) to Protect against Renal Ischemia and Reperfusion Injury. Kidney Int. 2013, 84, 90–103. [Google Scholar] [CrossRef] [PubMed]
- Roberts, V.; Stagg, J.; Dwyer, K.M. The Role of Ectonucleotidases CD39 and CD73 and Adenosine Signaling in Solid Organ Transplantation. Front. Immunol. 2014, 5, 64. [Google Scholar] [CrossRef] [PubMed]
- Kinsey, G.R.; Huang, L.; Jaworska, K.; Khutsishvili, K.; Becker, D.A.; Ye, H.; Lobo, P.I.; Okusa, M.D. Autocrine Adenosine Signaling Promotes Regulatory T Cell-Mediated Renal Protection. J. Am. Soc. Nephrol. JASN 2012, 23, 1528–1537. [Google Scholar] [CrossRef] [PubMed]
- Lu, B.; Rajakumar, S.V.; Robson, S.C.; Lee, E.K.F.; Crikis, S.; d’Apice, A.J.F.; Cowan, P.J.; Dwyer, K.M. The Impact of Purinergic Signaling on Renal Ischemia-Reperfusion Injury. Transplantation 2008, 86, 1707–1712. [Google Scholar] [CrossRef]
- Rampino, T.; Gregorini, M.; Germinario, G.; Pattonieri, E.F.; Erasmi, F.; Grignano, M.A.; Bruno, S.; Alomari, E.; Bettati, S.; Asti, A.; et al. Extracellular Vesicles Derived from Mesenchymal Stromal Cells Delivered during Hypothermic Oxygenated Machine Perfusion Repair Ischemic/Reperfusion Damage of Kidneys from Extended Criteria Donors. Biology 2022, 11, 350. [Google Scholar] [CrossRef] [PubMed]
- Koliha, N.; Wiencek, Y.; Heider, U.; Jüngst, C.; Kladt, N.; Krauthäuser, S.; Johnston, I.C.D.; Bosio, A.; Schauss, A.; Wild, S. A Novel Multiplex Bead-Based Platform Highlights the Diversity of Extracellular Vesicles. J. Extracell. Vesicles 2016, 5, 29975. [Google Scholar] [CrossRef]
- Wiklander, O.P.B.; Brennan, M.Á.; Lötvall, J.; Breakefield, X.O.; El Andaloussi, S. Advances in Therapeutic Applications of Extracellular Vesicles. Sci. Transl. Med. 2019, 11, eaav8521. [Google Scholar] [CrossRef]
- Collino, F.; Deregibus, M.C.; Bruno, S.; Sterpone, L.; Aghemo, G.; Viltono, L.; Tetta, C.; Camussi, G. Microvesicles Derived from Adult Human Bone Marrow and Tissue Specific Mesenchymal Stem Cells Shuttle Selected Pattern of MiRNAs. PLoS ONE 2010, 5, e11803. [Google Scholar] [CrossRef]
- Collino, F.; Bruno, S.; Incarnato, D.; Dettori, D.; Neri, F.; Provero, P.; Pomatto, M.; Oliviero, S.; Tetta, C.; Quesenberry, P.J.; et al. AKI Recovery Induced by Mesenchymal Stromal Cell-Derived Extracellular Vesicles Carrying MicroRNAs. J. Am. Soc. Nephrol. JASN 2015, 26, 2349–2360. [Google Scholar] [CrossRef]
- Ravaioli, M.; De Pace, V.; Comai, G.; Capelli, I.; Baraldi, O.; D’Errico, A.; Bertuzzo, V.R.; Del Gaudio, M.; Zanfi, C.; D’Arcangelo, G.L.; et al. Preliminary Experience of Sequential Use of Normothermic and Hypothermic Oxygenated Perfusion for Donation after Circulatory Death Kidney with Warm Ischemia Time over the Conventional Criteria—A Retrospective and Observational Study. Transpl. Int. Off. J. Eur. Soc. Organ Transplant. 2018, 31, 1233–1244. [Google Scholar] [CrossRef] [PubMed]
- Hosgood, S.A.; Barlow, A.D.; Dormer, J.; Nicholson, M.L. The Use of Ex-Vivo Normothermic Perfusion for the Resuscitation and Assessment of Human Kidneys Discarded Because of Inadequate in Situ Perfusion. J. Transl. Med. 2015, 13, 329. [Google Scholar] [CrossRef] [PubMed]
- Hosgood, S.A.; Saeb-Parsy, K.; Hamed, M.O.; Nicholson, M.L. Successful Transplantation of Human Kidneys Deemed Untransplantable but Resuscitated by Ex Vivo Normothermic Machine Perfusion. Am. J. Transplant. Off. J. Am. Soc. Transplant. Am. Soc. Transpl. Surg. 2016, 16, 3282–3285. [Google Scholar] [CrossRef]
- Ravaioli, M.; Maroni, L.; Angeletti, A.; Fallani, G.; De Pace, V.; Germinario, G.; Odaldi, F.; Corradetti, V.; Caraceni, P.; Baldassarre, M.; et al. Hypothermic Oxygenated Perfusion Versus Static Cold Storage for Expanded Criteria Donors in Liver and Kidney Transplantation: Protocol for a Single-Center Randomized Controlled Trial. JMIR Res. Protoc. 2020, 9, e13922. [Google Scholar] [CrossRef] [PubMed]
- Zulpaite, R.; Miknevicius, P.; Leber, B.; Strupas, K.; Stiegler, P.; Schemmer, P. Ex-Vivo Kidney Machine Perfusion: Therapeutic Potential. Front. Med. 2021, 8, 808719. [Google Scholar] [CrossRef] [PubMed]
- Tan, K.; Zhu, H.; Zhang, J.; Ouyang, W.; Tang, J.; Zhang, Y.; Qiu, L.; Liu, X.; Ding, Z.; Deng, X. CD73 Expression on Mesenchymal Stem Cells Dictates the Reparative Properties via Its Anti-Inflammatory Activity. Stem Cells Int. 2019, 2019, 8717694. [Google Scholar] [CrossRef]
- Tang, J.; Wang, X.; Tan, K.; Zhu, H.; Zhang, Y.; Ouyang, W.; Liu, X.; Ding, Z. Injury-Induced Fetal Reprogramming Imparts Multipotency and Reparative Properties to Pericardial Adipose Stem Cells. Stem Cell Res. Ther. 2018, 9, 218. [Google Scholar] [CrossRef]
- Sousa, B.R.; Parreira, R.C.; Fonseca, E.A.; Amaya, M.J.; Tonelli, F.M.P.; Lacerda, S.M.S.N.; Lalwani, P.; Santos, A.K.; Gomes, K.N.; Ulrich, H.; et al. Human Adult Stem Cells from Diverse Origins: An Overview from Multiparametric Immunophenotyping to Clinical Applications. Cytometry A 2014, 85, 43–77. [Google Scholar] [CrossRef]
- Jeske, S.S.; Theodoraki, M.N.; Boelke, E.; Laban, S.; Brunner, C.; Rotter, N.; Jackson, E.K.; Hoffmann, T.K.; Schuler, P.J. Adenosine Production in Mesenchymal Stromal Cells in Relation to Their Developmental Status. HNO 2020, 68, 87–93. [Google Scholar] [CrossRef]
- Grange, C.; Skovronova, R.; Marabese, F.; Bussolati, B. Stem Cell-Derived Extracellular Vesicles and Kidney Regeneration. Cells 2019, 8, E1240. [Google Scholar] [CrossRef]
- Zhao, M.; Liu, S.; Wang, C.; Wang, Y.; Wan, M.; Liu, F.; Gong, M.; Yuan, Y.; Chen, Y.; Cheng, J.; et al. Mesenchymal Stem Cell-Derived Extracellular Vesicles Attenuate Mitochondrial Damage and Inflammation by Stabilizing Mitochondrial DNA. ACS Nano 2021, 15, 1519–1538. [Google Scholar] [CrossRef] [PubMed]
- Tsuji, K.; Kitamura, S.; Wada, J. Immunomodulatory and Regenerative Effects of Mesenchymal Stem Cell-Derived Extracellular Vesicles in Renal Diseases. Int. J. Mol. Sci. 2020, 21, E756. [Google Scholar] [CrossRef]
- De Martino, M.; Zonta, S.; Rampino, T.; Gregorini, M.; Frassoni, F.; Piotti, G.; Bedino, G.; Cobianchi, L.; Dal Canton, A.; Dionigi, P.; et al. Mesenchymal Stem Cells Infusion Prevents Acute Cellular Rejection in Rat Kidney Transplantation. Transplant. Proc. 2010, 42, 1331–1335. [Google Scholar] [CrossRef]
- Yun, C.W.; Lee, S.H. Potential and Therapeutic Efficacy of Cell-Based Therapy Using Mesenchymal Stem Cells for Acute/Chronic Kidney Disease. Int. J. Mol. Sci. 2019, 20, E1619. [Google Scholar] [CrossRef] [PubMed]
- Ju, G.; Cheng, J.; Zhong, L.; Wu, S.; Zou, X.; Zhang, G.; Gu, D.; Miao, S.; Zhu, Y.; Sun, J.; et al. Microvesicles Derived from Human Umbilical Cord Mesenchymal Stem Cells Facilitate Tubular Epithelial Cell Dedifferentiation and Growth via Hepatocyte Growth Factor Induction. PLoS ONE 2015, 10, e0121534. [Google Scholar] [CrossRef]
- Ragni, E.; Banfi, F.; Barilani, M.; Cherubini, A.; Parazzi, V.; Larghi, P.; Dolo, V.; Bollati, V.; Lazzari, L. Extracellular Vesicle-Shuttled MRNA in Mesenchymal Stem Cell Communication. Stem Cells Dayt. Ohio 2017, 35, 1093–1105. [Google Scholar] [CrossRef] [PubMed]
- Malek, M.; Nematbakhsh, M. Renal Ischemia/Reperfusion Injury; from Pathophysiology to Treatment. J. Ren. Inj. Prev. 2015, 4, 20–27. [Google Scholar] [CrossRef]
- Berendsen, T.A.; Izamis, M.L.; Xu, H.; Liu, Q.; Hertl, M.; Berthiaume, F.; Yarmush, M.L.; Uygun, K. Hepatocyte Viability and Adenosine Triphosphate Content Decrease Linearly over Time during Conventional Cold Storage of Rat Liver Grafts. Transplant. Proc. 2011, 43, 1484–1488. [Google Scholar] [CrossRef]
- Longchamp, A.; Klauser, A.; Songeon, J.; Agius, T.; Nastasi, A.; Ruttiman, R.; Moll, S.; Meier, R.P.H.; Buhler, L.; Corpataux, J.-M.; et al. Ex Vivo Analysis of Kidney Graft Viability Using 31P Magnetic Resonance Imaging Spectroscopy. Transplantation 2020, 104, 1825–1831. [Google Scholar] [CrossRef]
- Hamamoto, I.; Takaya, S.; Todo, S.; Bronsther, O.; Fujita, S.; Van Gulik, T.M.; Nakamura, K.; Irish, W.; Starzl, T.E. Can Adenine Nucleotides Predict Primary Nonfunction of the Human Liver Homograft? Transpl. Int. Off. J. Eur. Soc. Organ Transplant. 1994, 7, 89–95. [Google Scholar] [CrossRef][Green Version]
- Cowled, P.; Fitridge, R. Pathophysiology of Reperfusion Injury. In Mechanisms of Vascular Disease: A Reference Book for Vascular Specialists; Fitridge, R., Thompson, M., Eds.; University of Adelaide Press: Adelaide, Australia, 2011; ISBN 978-0-9871718-2-5. [Google Scholar]
- Rajakumar, S.V.; Lu, B.; Crikis, S.; Robson, S.C.; d’Apice, A.J.F.; Cowan, P.J.; Dwyer, K.M. Deficiency or Inhibition of CD73 Protects in Mild Kidney Ischemia-Reperfusion Injury. Transplantation 2010, 90, 1260–1264. [Google Scholar] [CrossRef] [PubMed]
- Synnestvedt, K.; Furuta, G.T.; Comerford, K.M.; Louis, N.; Karhausen, J.; Eltzschig, H.K.; Hansen, K.R.; Thompson, L.F.; Colgan, S.P. Ecto-5′-Nucleotidase (CD73) Regulation by Hypoxia-Inducible Factor-1 Mediates Permeability Changes in Intestinal Epithelia. J. Clin. Investig. 2002, 110, 993–1002. [Google Scholar] [CrossRef] [PubMed]
- Arslan, F.; Lai, R.C.; Smeets, M.B.; Akeroyd, L.; Choo, A.; Aguor, E.N.E.; Timmers, L.; van Rijen, H.V.; Doevendans, P.A.; Pasterkamp, G.; et al. Mesenchymal Stem Cell-Derived Exosomes Increase ATP Levels, Decrease Oxidative Stress and Activate PI3K/Akt Pathway to Enhance Myocardial Viability and Prevent Adverse Remodeling after Myocardial Ischemia/Reperfusion Injury. Stem Cell Res. 2013, 10, 301–312. [Google Scholar] [CrossRef]
- Angioni, R.; Liboni, C.; Herkenne, S.; Sánchez-Rodríguez, R.; Borile, G.; Marcuzzi, E.; Calì, B.; Muraca, M.; Viola, A. CD73+ Extracellular Vesicles Inhibit Angiogenesis through Adenosine A2B Receptor Signalling. J. Extracell. Vesicles 2020, 9, 1757900. [Google Scholar] [CrossRef] [PubMed]
- Lia, G.; Di Vito, C.; Bruno, S.; Tapparo, M.; Brunello, L.; Santoro, A.; Mariotti, J.; Bramanti, S.; Zaghi, E.; Calvi, M.; et al. Extracellular Vesicles as Biomarkers of Acute Graft-vs.-Host Disease After Haploidentical Stem Cell Transplantation and Post-Transplant Cyclophosphamide. Front. Immunol. 2021, 12, 816231. [Google Scholar] [CrossRef]
- Tapparo, M.; Bruno, S.; Collino, F.; Togliatto, G.; Deregibus, M.C.; Provero, P.; Wen, S.; Quesenberry, P.J.; Camussi, G. Renal Regenerative Potential of Extracellular Vesicles Derived from MiRNA-Engineered Mesenchymal Stromal Cells. Int. J. Mol. Sci. 2019, 20, E2381. [Google Scholar] [CrossRef]
- Paller, M.S.; Hoidal, J.R.; Ferris, T.F. Oxygen Free Radicals in Ischemic Acute Renal Failure in the Rat. J. Clin. Investig. 1984, 74, 1156–1164. [Google Scholar] [CrossRef]


Publisher’s Note: MDPI stays neutral with regard to jurisdictional claims in published maps and institutional affiliations. |
© 2022 by the authors. Licensee MDPI, Basel, Switzerland. This article is an open access article distributed under the terms and conditions of the Creative Commons Attribution (CC BY) license (https://creativecommons.org/licenses/by/4.0/).
Share and Cite
Grignano, M.A.; Bruno, S.; Viglio, S.; Avanzini, M.A.; Tapparo, M.; Ramus, M.; Croce, S.; Valsecchi, C.; Pattonieri, E.F.; Ceccarelli, G.; et al. CD73-Adenosinergic Axis Mediates the Protective Effect of Extracellular Vesicles Derived from Mesenchymal Stromal Cells on Ischemic Renal Damage in a Rat Model of Donation after Circulatory Death. Int. J. Mol. Sci. 2022, 23, 10681. https://doi.org/10.3390/ijms231810681
Grignano MA, Bruno S, Viglio S, Avanzini MA, Tapparo M, Ramus M, Croce S, Valsecchi C, Pattonieri EF, Ceccarelli G, et al. CD73-Adenosinergic Axis Mediates the Protective Effect of Extracellular Vesicles Derived from Mesenchymal Stromal Cells on Ischemic Renal Damage in a Rat Model of Donation after Circulatory Death. International Journal of Molecular Sciences. 2022; 23(18):10681. https://doi.org/10.3390/ijms231810681
Chicago/Turabian StyleGrignano, Maria Antonietta, Stefania Bruno, Simona Viglio, Maria Antonietta Avanzini, Marta Tapparo, Marina Ramus, Stefania Croce, Chiara Valsecchi, Eleonora Francesca Pattonieri, Gabriele Ceccarelli, and et al. 2022. "CD73-Adenosinergic Axis Mediates the Protective Effect of Extracellular Vesicles Derived from Mesenchymal Stromal Cells on Ischemic Renal Damage in a Rat Model of Donation after Circulatory Death" International Journal of Molecular Sciences 23, no. 18: 10681. https://doi.org/10.3390/ijms231810681
APA StyleGrignano, M. A., Bruno, S., Viglio, S., Avanzini, M. A., Tapparo, M., Ramus, M., Croce, S., Valsecchi, C., Pattonieri, E. F., Ceccarelli, G., Manzoni, F., Asti, A., Libetta, C., Sepe, V., Iadarola, P., Gregorini, M., & Rampino, T. (2022). CD73-Adenosinergic Axis Mediates the Protective Effect of Extracellular Vesicles Derived from Mesenchymal Stromal Cells on Ischemic Renal Damage in a Rat Model of Donation after Circulatory Death. International Journal of Molecular Sciences, 23(18), 10681. https://doi.org/10.3390/ijms231810681