Article

Transcriptome-Wide m6A Methylome Profiling in Sorghum following GA3 Treatment under Salt Stress

1
Joint International Research Laboratory of Agriculture and Agri-Product Safety, The Ministry of Education of China, Institutes of Agricultural Science and Technology Development, Yangzhou University, Yangzhou 225009, China
2
Jiangsu Provincial Key Laboratory of Crop Genetics and Physiology, Yangzhou University, Yangzhou 225009, China
*
Author to whom correspondence should be addressed.
These authors contributed equally to this work.
Int. J. Mol. Sci. 2022, 23(18), 10674; https://doi.org/10.3390/ijms231810674
Submission received: 14 August 2022 / Revised: 6 September 2022 / Accepted: 12 September 2022 / Published: 14 September 2022
(This article belongs to the Section Molecular Plant Sciences)

Abstract

:
Sorghum (“Jitian 3”) is a salt-tolerant seed cultivar used regularly in marginal lands, such as those with saline soils. Herein, we examined the potential of employing gibberellic acid (GA3) as an inducer of sorghum development during salt stress. Thus far, there have been no reports on the signaling network involved in the GA3-mediated regulation of sorghum development. In this study, we demonstrated that the stimulating properties of 50 mg/L GA3 on sorghum development was far superior to other GA3 concentrations under a 150 mM NaCl salinity condition. Furthermore, using methylated RNA immunoprecipitation sequencing (MeRIP-seq), we established an m6A methylation (m6A-M) profile in sorghum following exposure to 50 mg/L GA3. Overall, 23,363 m6A peaks and 16,200 m6A genes were screened among the GA3-treated and control leaves. These identified peaks were shown to be primarily enriched in the coding, as were the 3′- and 5′-untranslated regions. In addition, we employed m6A and transcript expression cross-analysis to identify 70 genes with differential transcript expression and simultaneous m6A-M. Intriguingly, the principal gene, LOC8066282, which is associated with LOC8084853, was shown to be intricately linked to the phosphatidylinositol signaling, which in turn regulates sorghum development and response to salt stress. This investigation presents a novel RNA m6A-M profile in sorghum, which may facilitate new insights into the underlying signaling behind salt stress resistance. This work will also benefit future investigations on foreign GA3 administration of sorghum.

1. Introduction

Salinity is a major disruptor of plant development, and it has contributed to a major decline in global crop production [1,2,3]. Elevated salt ion concentrations impair photosynthesis, cellular metabolism, and nutritional balance [4]. Moreover, emerging evidence has suggested that salt stress induces modifications in the lipid bilayer and membrane permeability [5,6,7]. Exogenous plant growth phytohormones administration is considered an efficient approach to alleviating negative salinity outcomes. Among the known phytohormones, gibberellin is a known inducer of plant development under salinity conditions [8,9]. Prior investigations revealed that exogenous gibberellic acid (GA3) usage accelerates seed germination, enhances seed salt tolerance, and alleviates the salt-mediated suppression of seedling development [10]. It has also been concluded that GA3 usage diminishes harmful salinity outcomes while enhancing salinity resistance in the mustard plant [11]. Sorghum (“Jitian 3”) is a salt-tolerant seed cultivar that has frequently been used in China over a minimum of 40–50 centuries in arid, semiarid, and water-logged locations. Despite some reports on the outcomes of foreign GA3 application in plants under salt stress, there are limited investigations on sorghum. Hence, the underlying signaling behind the GA3-mediated regulation of plant development under salt stress remains poorly understood.
Post- or co-transcriptional RNA modifications are ubiquitous among most eukaryotic cells, and they regulate numerous aspects of RNA metabolism. m6A is the leading modification in numerous eukaryotic transcripts, namely in yeast [12], plants [13,14,15], insects [16], and mammals [17]. m6A modification (m6A-M) is established via dynamic associations between its methyltransferases (the “writers”) (METTL3/14, WTAP, RBM15, and so on), demethylases (the “erasers”) (FTO, ALKBH5), and interacting proteins (the “readers”) (YTHDF1/2/3, YTHDC1, IGF2BP, and so on) [18]. Recently, m6A RNA methylation has received attention from scientists all over the world. In plants, m6A modulates multiple aspects of mRNA metabolism, including alternative polyadenylation and secondary structure, translation, and decay. These processes are critically involved in various plant growth and stress responses [19]. However, plant viruses disrupt m6A-M via interaction with key m6A pathway proteins, which, in turn, prevents modification [20]. To date, there have been no extensive reports on the m6A-M profile in sorghum. This information is crucial for building a complete understanding of the mechanisms behind plant growth and stress response.
Herein, we elucidated the outcome of salinity stress on sorghum during seedling development. We also identified the optimal GA3 concentration for alleviating most salt stress. In this aim, we conducted a greenhouse evaluation to examine the outcome of various GA3 concentrations on plant height, stem diameter, leaf area, dry matter, and the activities of superoxide dismutase (SOD), peroxidase (POD), and catalase (CAT), etc. Moreover, we performed a high-throughput Illumina sequencing analysis to elucidate the m6A-M profile in sorghum exposed to GA3 treatment under salt stress. Our findings will enhance our understanding of the role of GA3 in regulating salt tolerance in sorghum.

2. Results

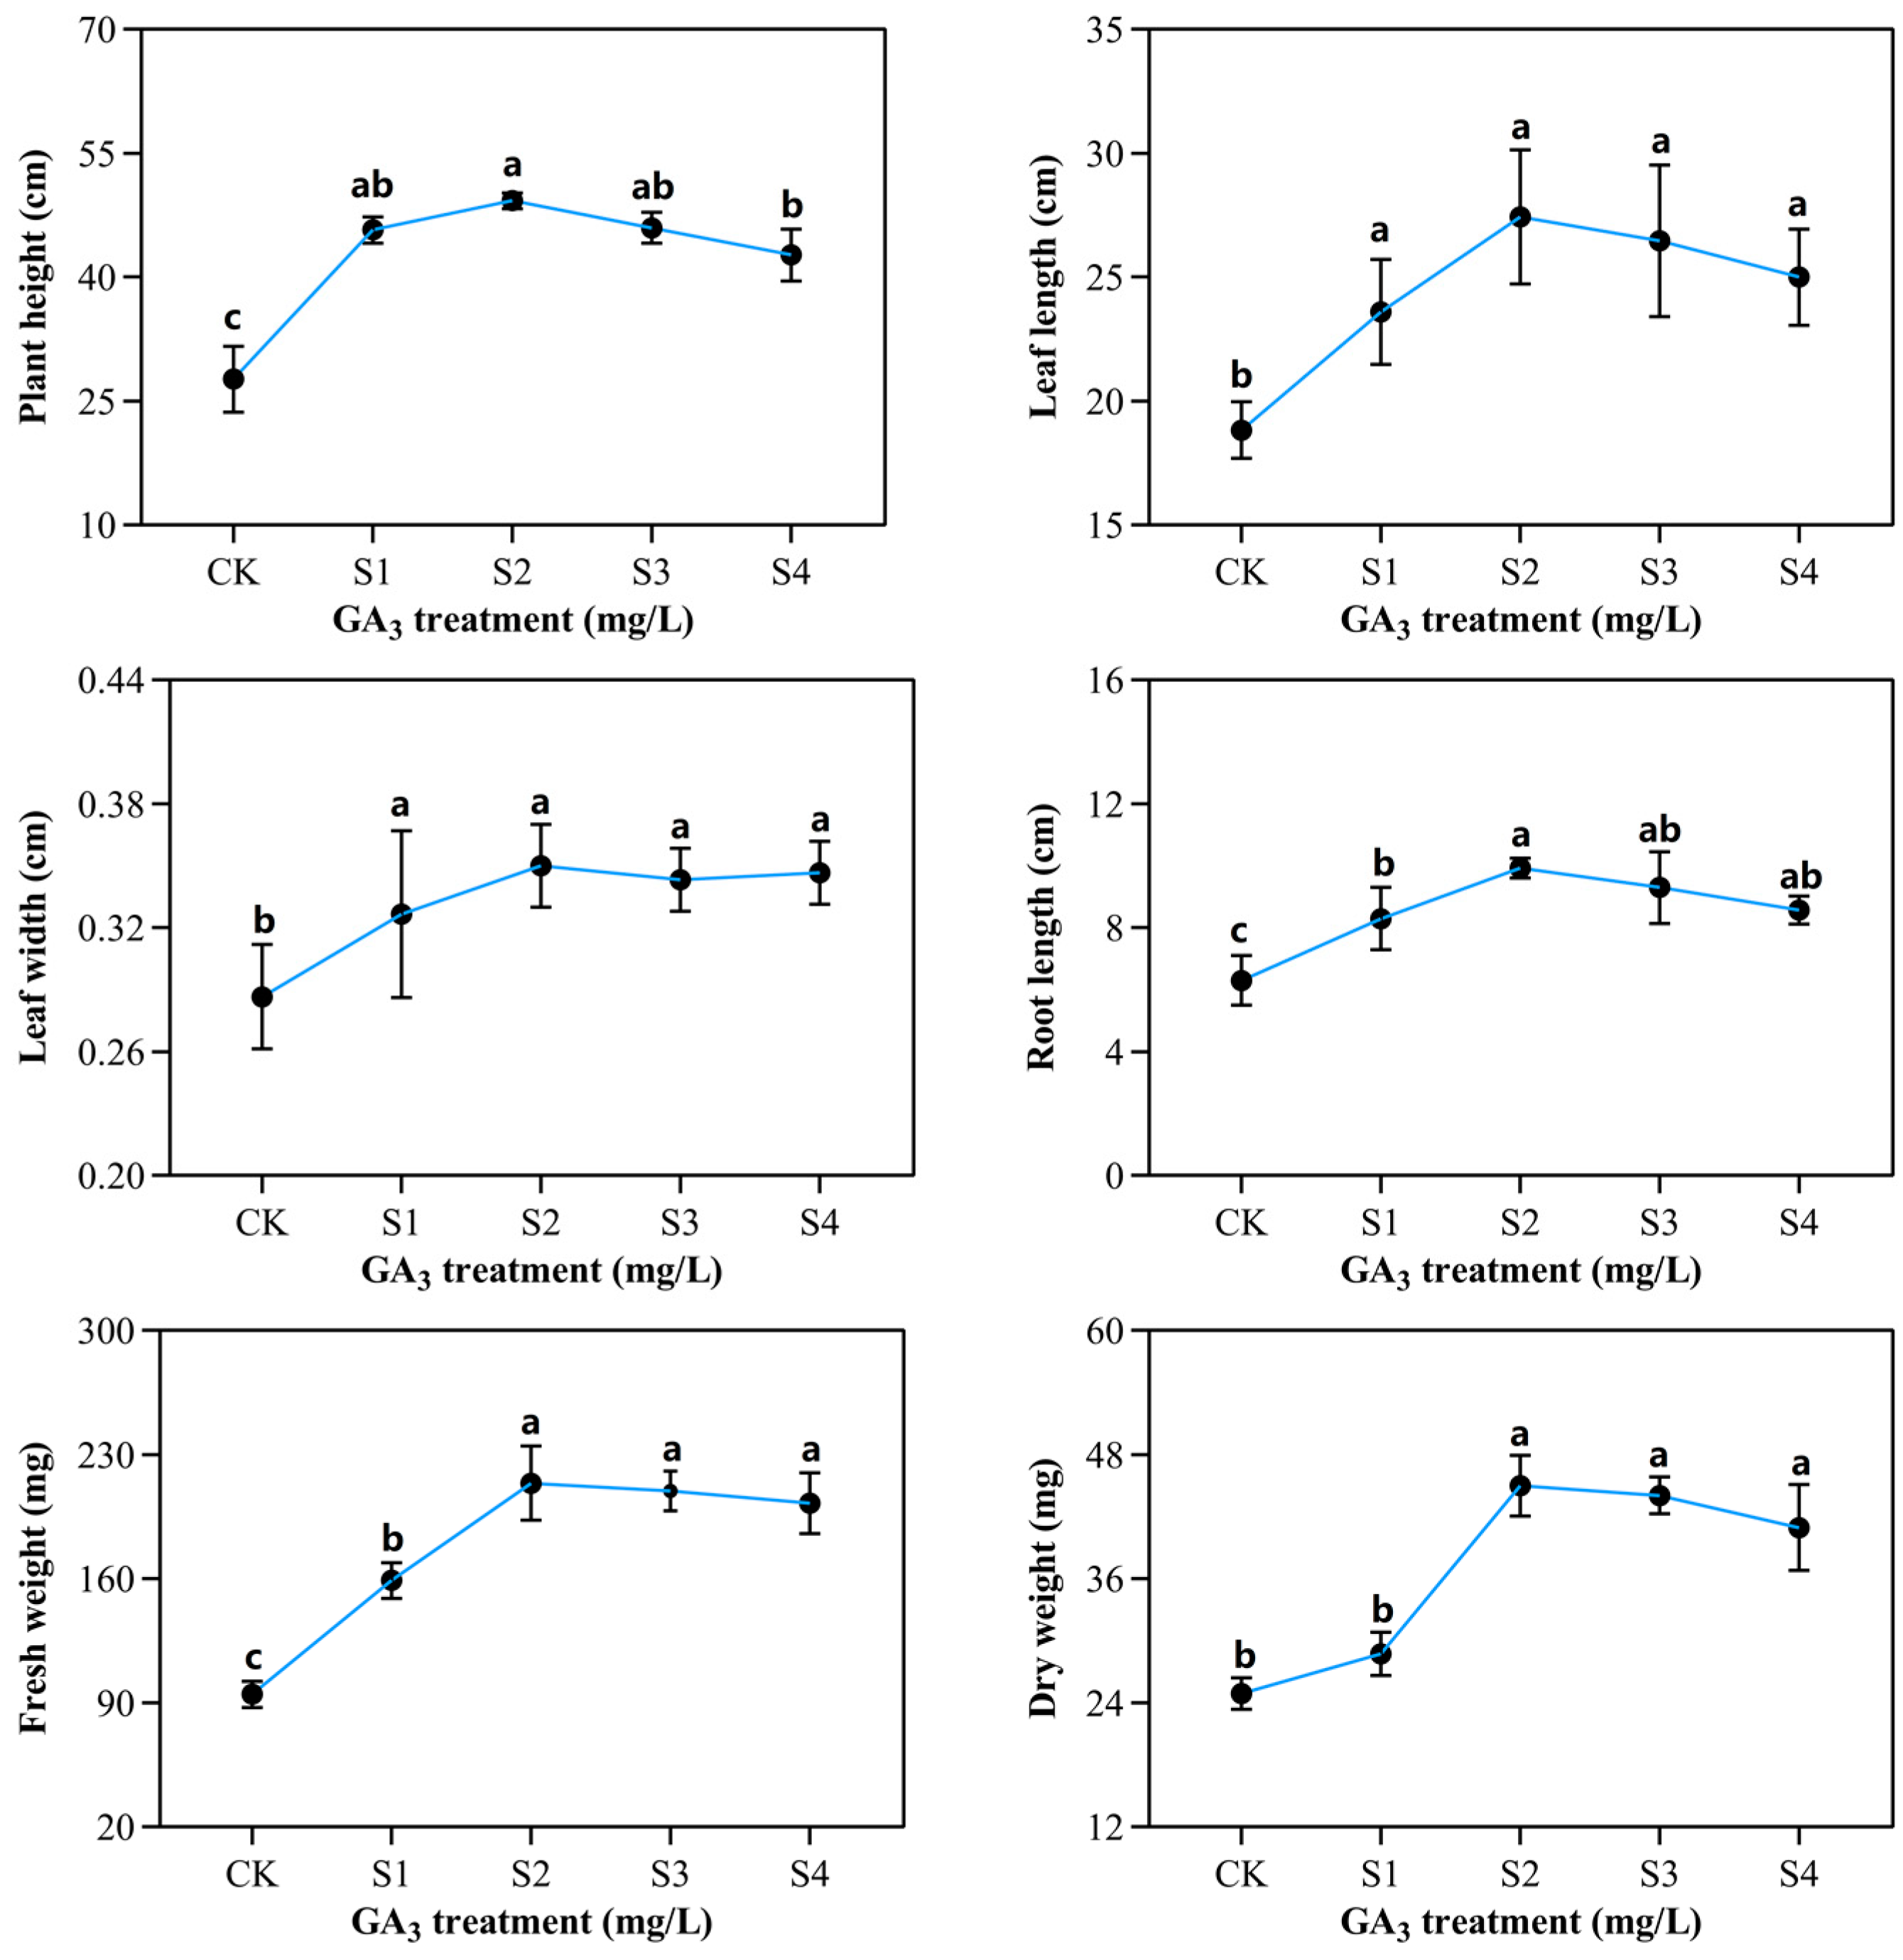
2.1. Phenotypic and Morphological Variations of Sorghum (“Jitian 3”) with GA3 Treatment under Salt Stress

To elucidate the outcome of exogenous GA3 on the phenotypic variations of sorghum (“Jitian 3”) under salt stress, we observed the phenotypic alteration of sorghum in the presence of varying GA3 concentrations. Sorghum growth was induced significantly on exposure to 50 mg/L GA3 (S2) (Figure 1), and further improvements in the values of other characteristics, such as plant height, leaf width, fresh weight, leaf length, root length, and dry weight were observed (Figure 2). GA3-treated plants exhibited remarkably higher height compared with controls. The largest plant height, 49.2 cm, was obtained with 50 mg/L GA3, and the lowest height, 27.6 cm, was obtained with 0 mg/L GA3. NaCl treatment significantly decreased both leaf length and width. The largest leaf length (27.4 cm) and width (0.35 cm) of the sorghum seedling were achieved with a GA3 concentration of 50 mg/L. The leaf length (8.8 cm) and width (0.28 cm) were the smallest when treated with 0 mg/L GA3. The root length was augmented at 25 mg/L GA3, and was diminished with 50 mg/L GA3 concentration. Sorghum seedlings treated with 150 mM NaCl and 50 mg/L GA3 demonstrated the largest root length (9.9 cm) compared with all other GA3 concentrations. With a rise in GA3 concentration, the fresh and dry weights of leaves, stems, and the entire plant were also gradually enhanced. We observed no discernible differences between the 50 and 100 mg/L GA3-treated outcomes, however, these results were markedly elevated compared with 0 mg/L GA3 treatment. The dry and fresh weights of sorghum seedlings’ leaves and whole plant rose initially, then diminished. The fresh and dry weights of the leaves, stems, roots, and the entire plant following 50 mg/L GA3 treatment was the highest, whereas seedlings treated with 0 mg/L GA3 showed the lowest fresh and dry weights. These data suggest that 50 mg/L GA3 had a positive effect on sorghum (“Jitian 3”) development compared to other GA3 concentrations under 150 mM NaCl salinity conditions.

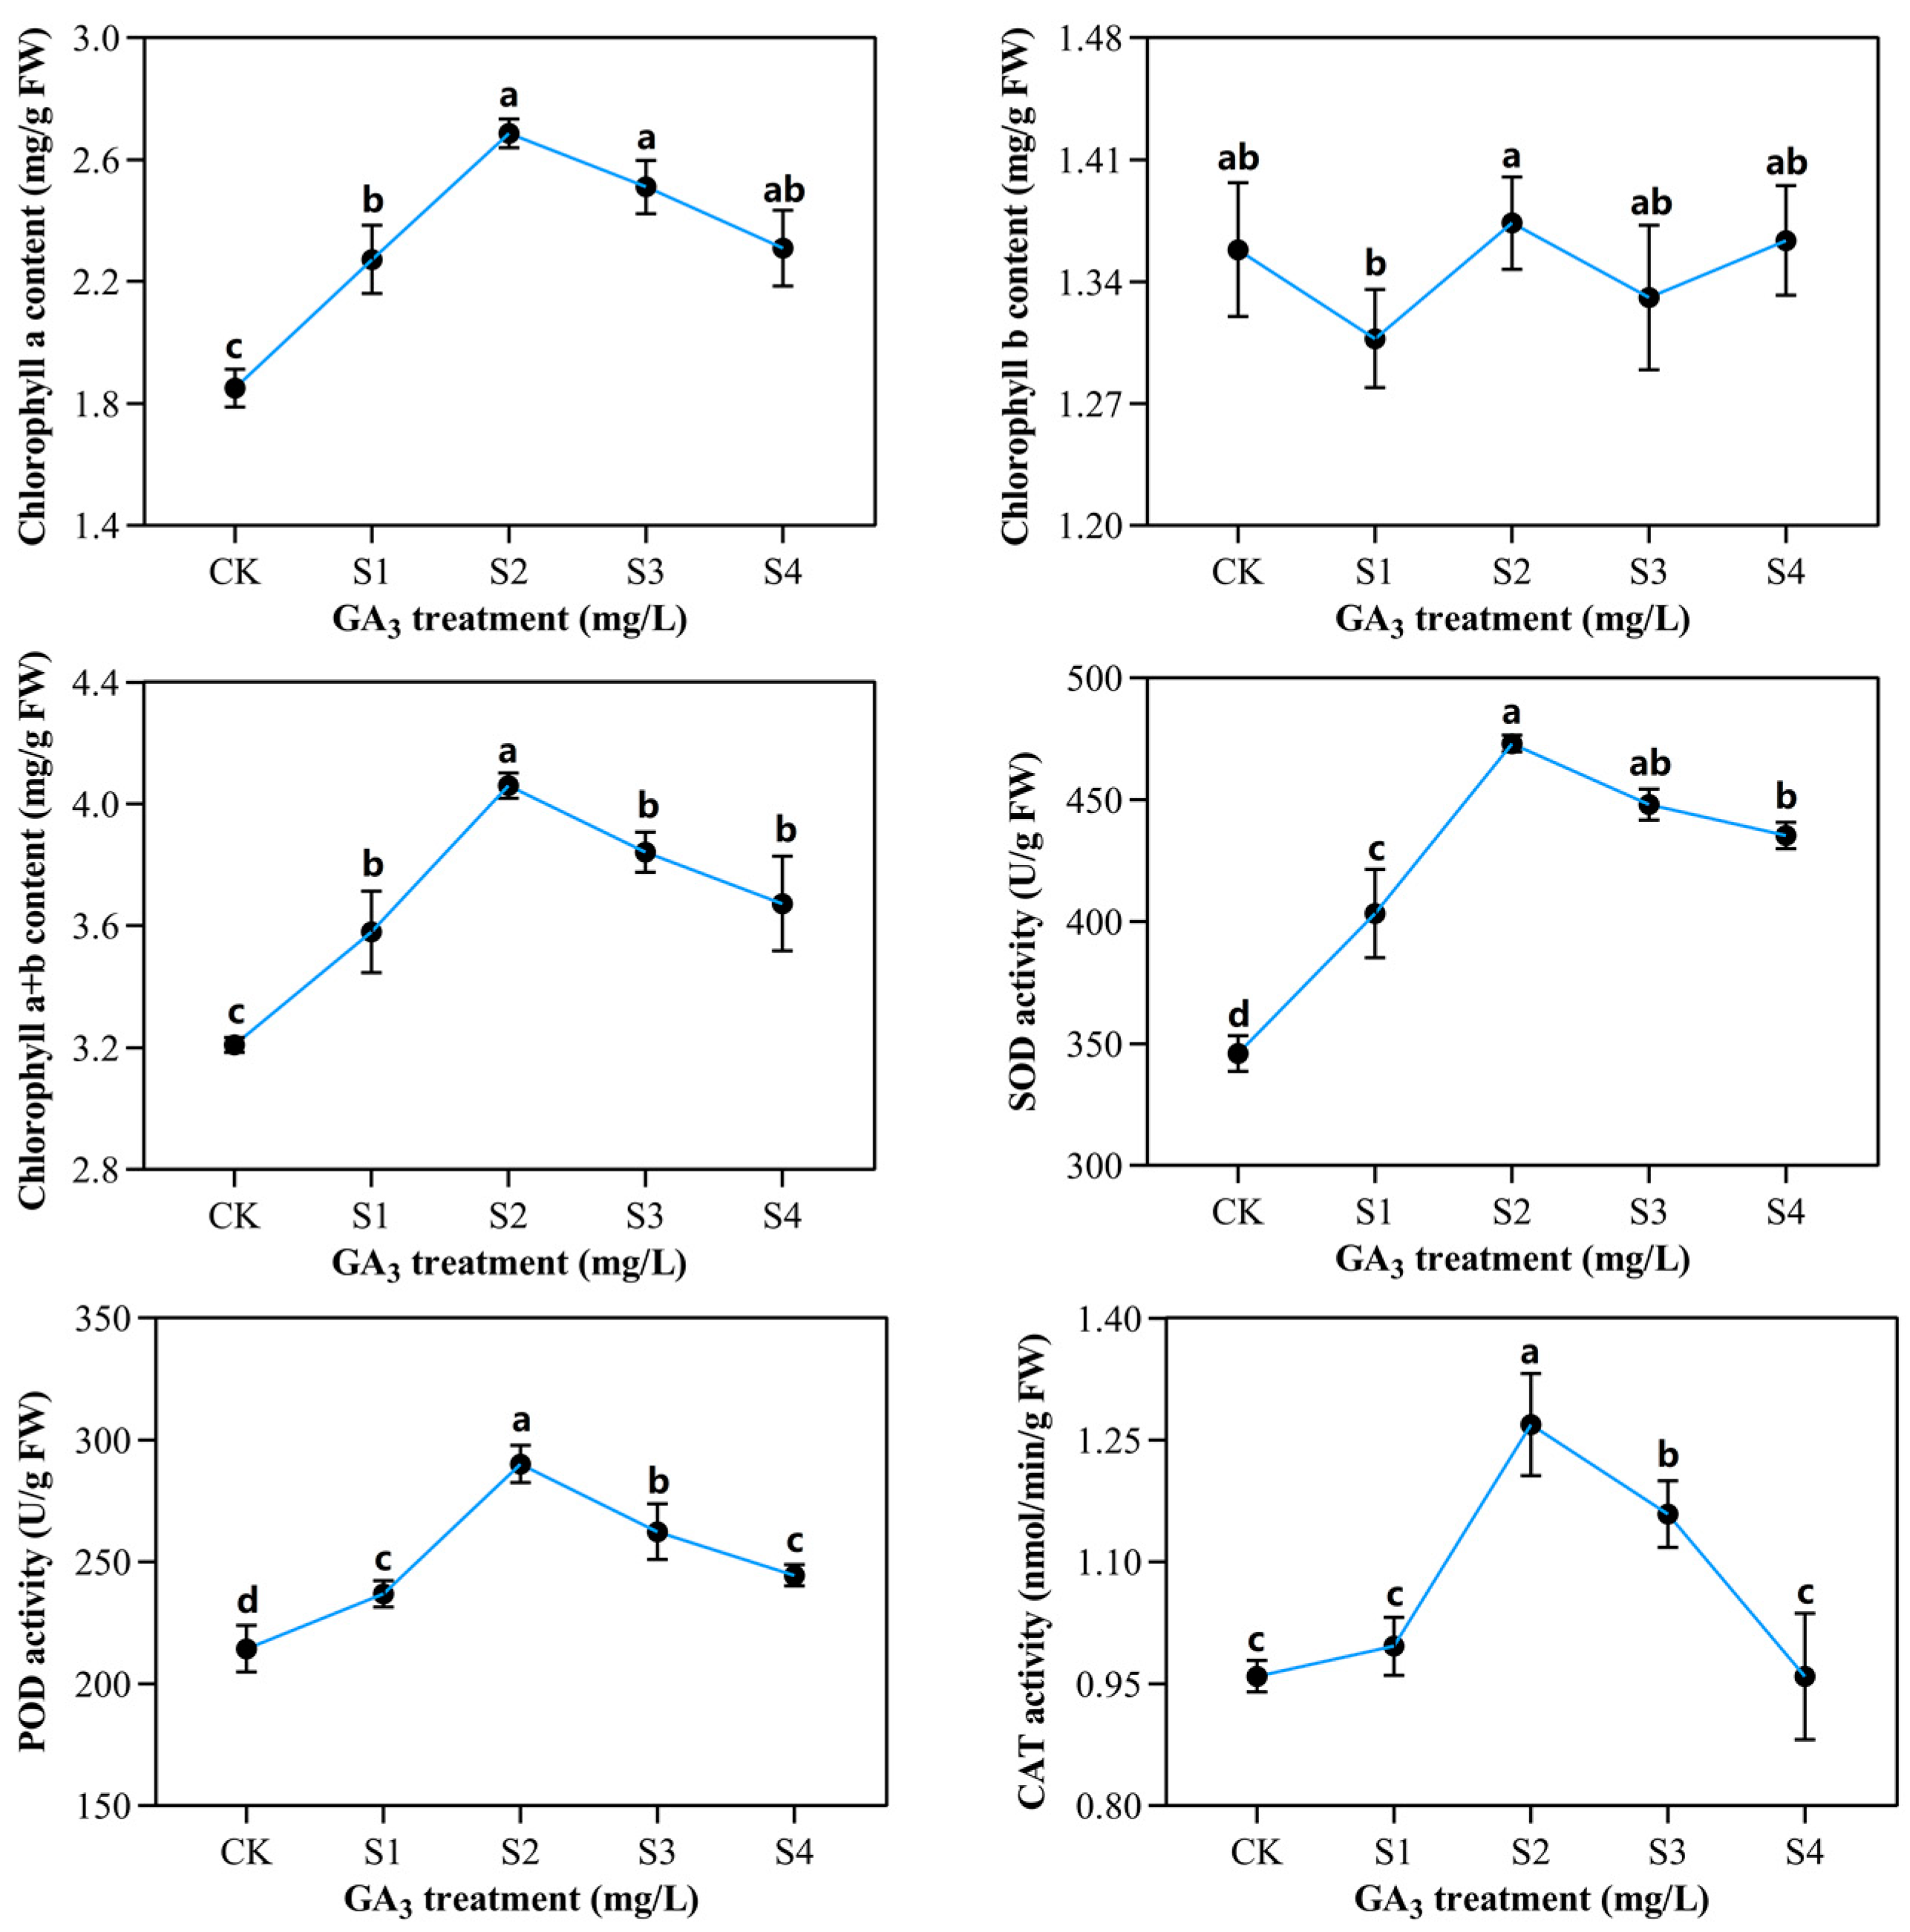
2.2. Determination of Chlorophyll Contents and Enzymatic Activities in Sorghum (“Jitian 3”) with GA3 Treatment under Salt Stress

Different GA3 concentrations affect chlorophyll content differentially under salt stress. As shown in Figure 3, chlorophyll content a was significantly affected by various NaCl and GA3 concentrations; however, there was no significant response to chlorophyll content b. In contrast, chlorophyll a+b content increased to 4.7 mg/g when treated with 50 mg/L GA3. In contrast, chlorophyll content decreased by 3.5 mg/g when treated with 100 mg/L GA3. We observed marked alteration in SOD, POD, CAT, SP, and proline levels after NaCl and GA3 treatments on all the sampling days. A measure of 50 mg/L GA3 markedly enhanced SOD, POD, and CAT activities compared to the controls. GA3 exposure also markedly enhanced POD activity relative to controls. With 150 mM NaCl and 50 mg/L GA3 co-treatment, POD activity rose to a maximum of 290 U/(g·min), and then decreased slightly (244 U/g·min). The CAT activity was markedly different among the five GA3 treatments. The maximum CAT activity was obtained after 50 mg/L GA3 exposure, and the lowest was obtained with 100 mg/L GA3. With increasing GA3 concentration, SOD activity was also augmented, reaching the highest level at 50 mg/L GA3, prior to a reduction at 75 mg/L and 100 mg/L. The maximal SOD activity (473 U/g FW) was achieved with 150 mM NaCl and 50 mg/L GA3 co-treatment, and the minimal activity (345 U/g FW) was obtained with 150 mM NaCl and 0 mg/L GA3.

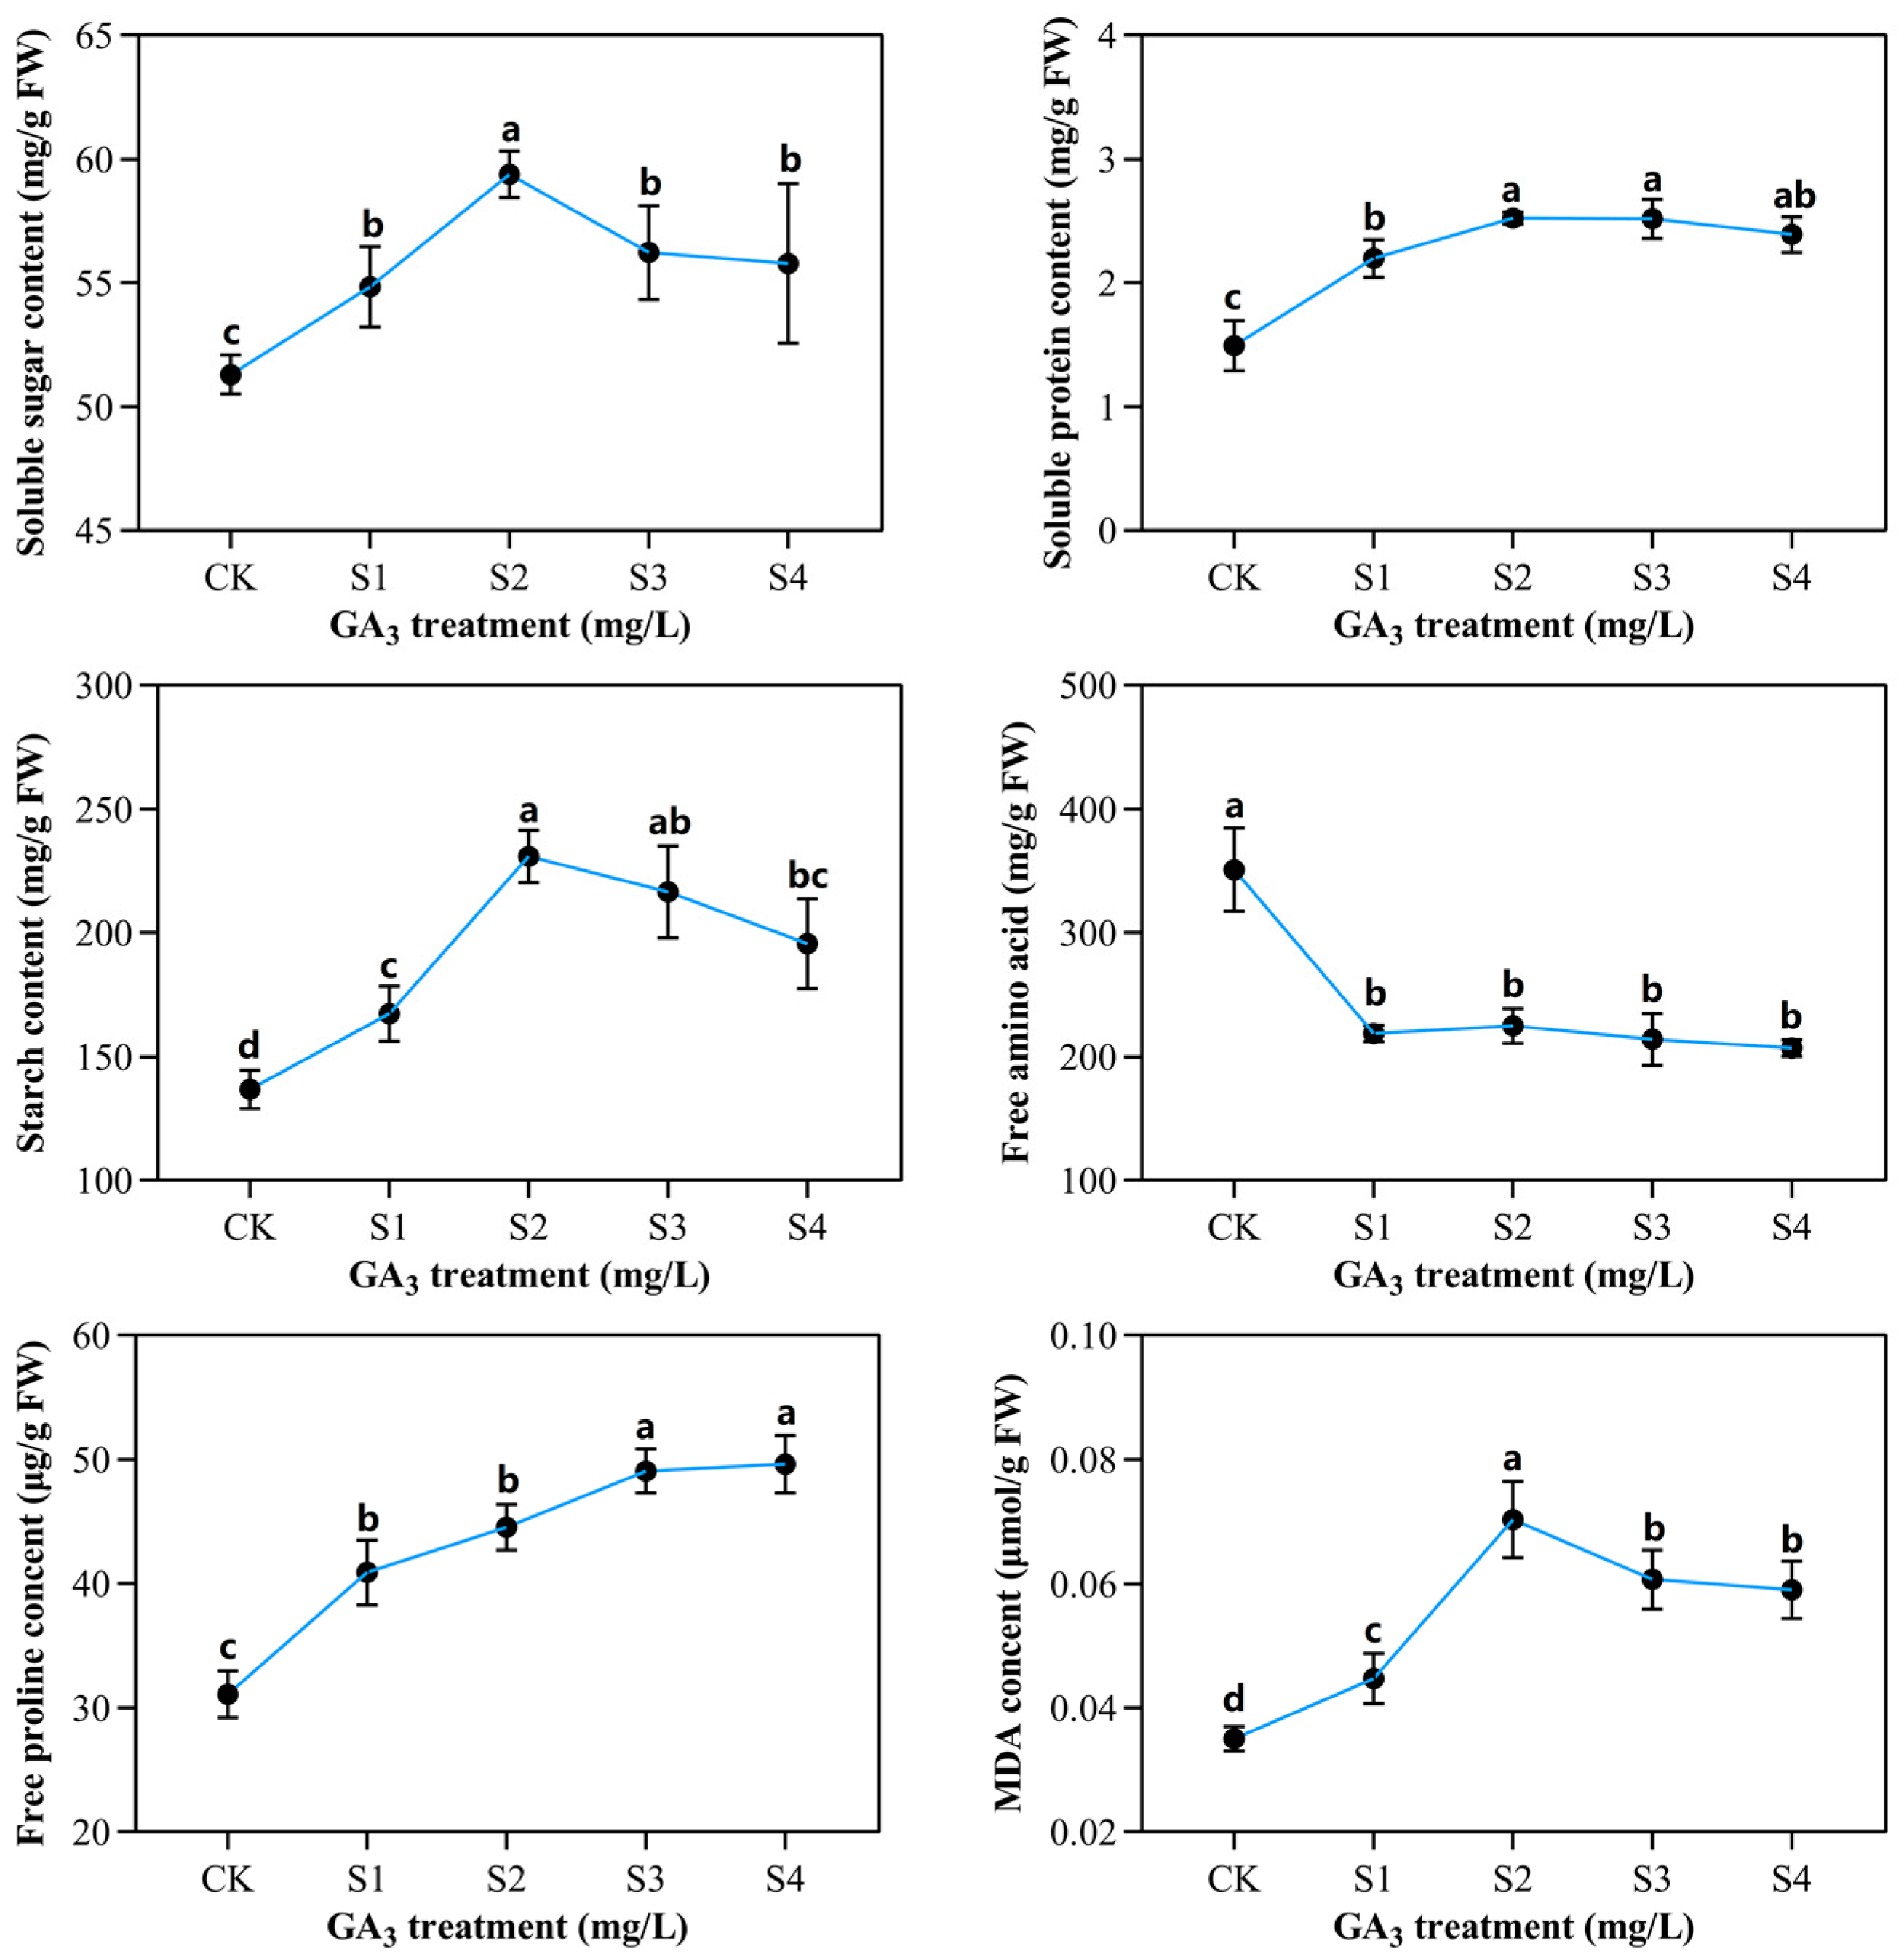
2.3. Determination of Partial Organic Content in Sorghum (“Jitian 3”) with GA3 Treatment under Salt Stress

To explore the outcome of exogenous GA3 on organic sorghum (“Jitian 3”) content under salt stress, we determined the levels of soluble sugar, soluble protein, free amino acid and starch content, MDA content, and free proline content (Figure 4). The soluble sugar and starch contents were markedly influenced by GA3 concentration and salinity. The GA3 and salinity stress promote soluble sugar aggregation. Relative to controls, the soluble sugar levels within leaves rose by 6%, 15%, 9%, and 8% at S1, S2, S3, and S4 concentrations, respectively. The starch levels within fresh Sorghum leaves were vastly different in the control versus the GA3-treated leaves. In fact, the starch concentration initially rose before diminishing with elevated GA3 concentrations. The maximum concentration (230.9 mg/L) was reached at S2, indicating that the GA3 environment strongly suppressed salt stress.
With a rise in salt content, the free proline and soluble protein concentrations rose considerably in sorghum seedlings on subsequent sampling days. The maximal soluble protein content (2.526 mg/g FW) was achieved at 50 mg/L GA3, and the minimal content occurred at 0 mg/L GA3. The free proline levels were considerably high (49.6 mg/g FW) following co-treatment with 100 mg/L GA3 and 150 mM NaCl.
At 150 mM NaCl, the highest free amino acid content was reported at 0 mg/L GA3. All GA3 concentrations failed to improve the sorghum seedlings’ free-amino-acid index when compared with untreated seeds. With increasing GA3 concentration, the MDA content was initially augmented, but then diminished, with 50 mg/L GA3 producing the largest MDA concentration under the reported NaCl concentration.

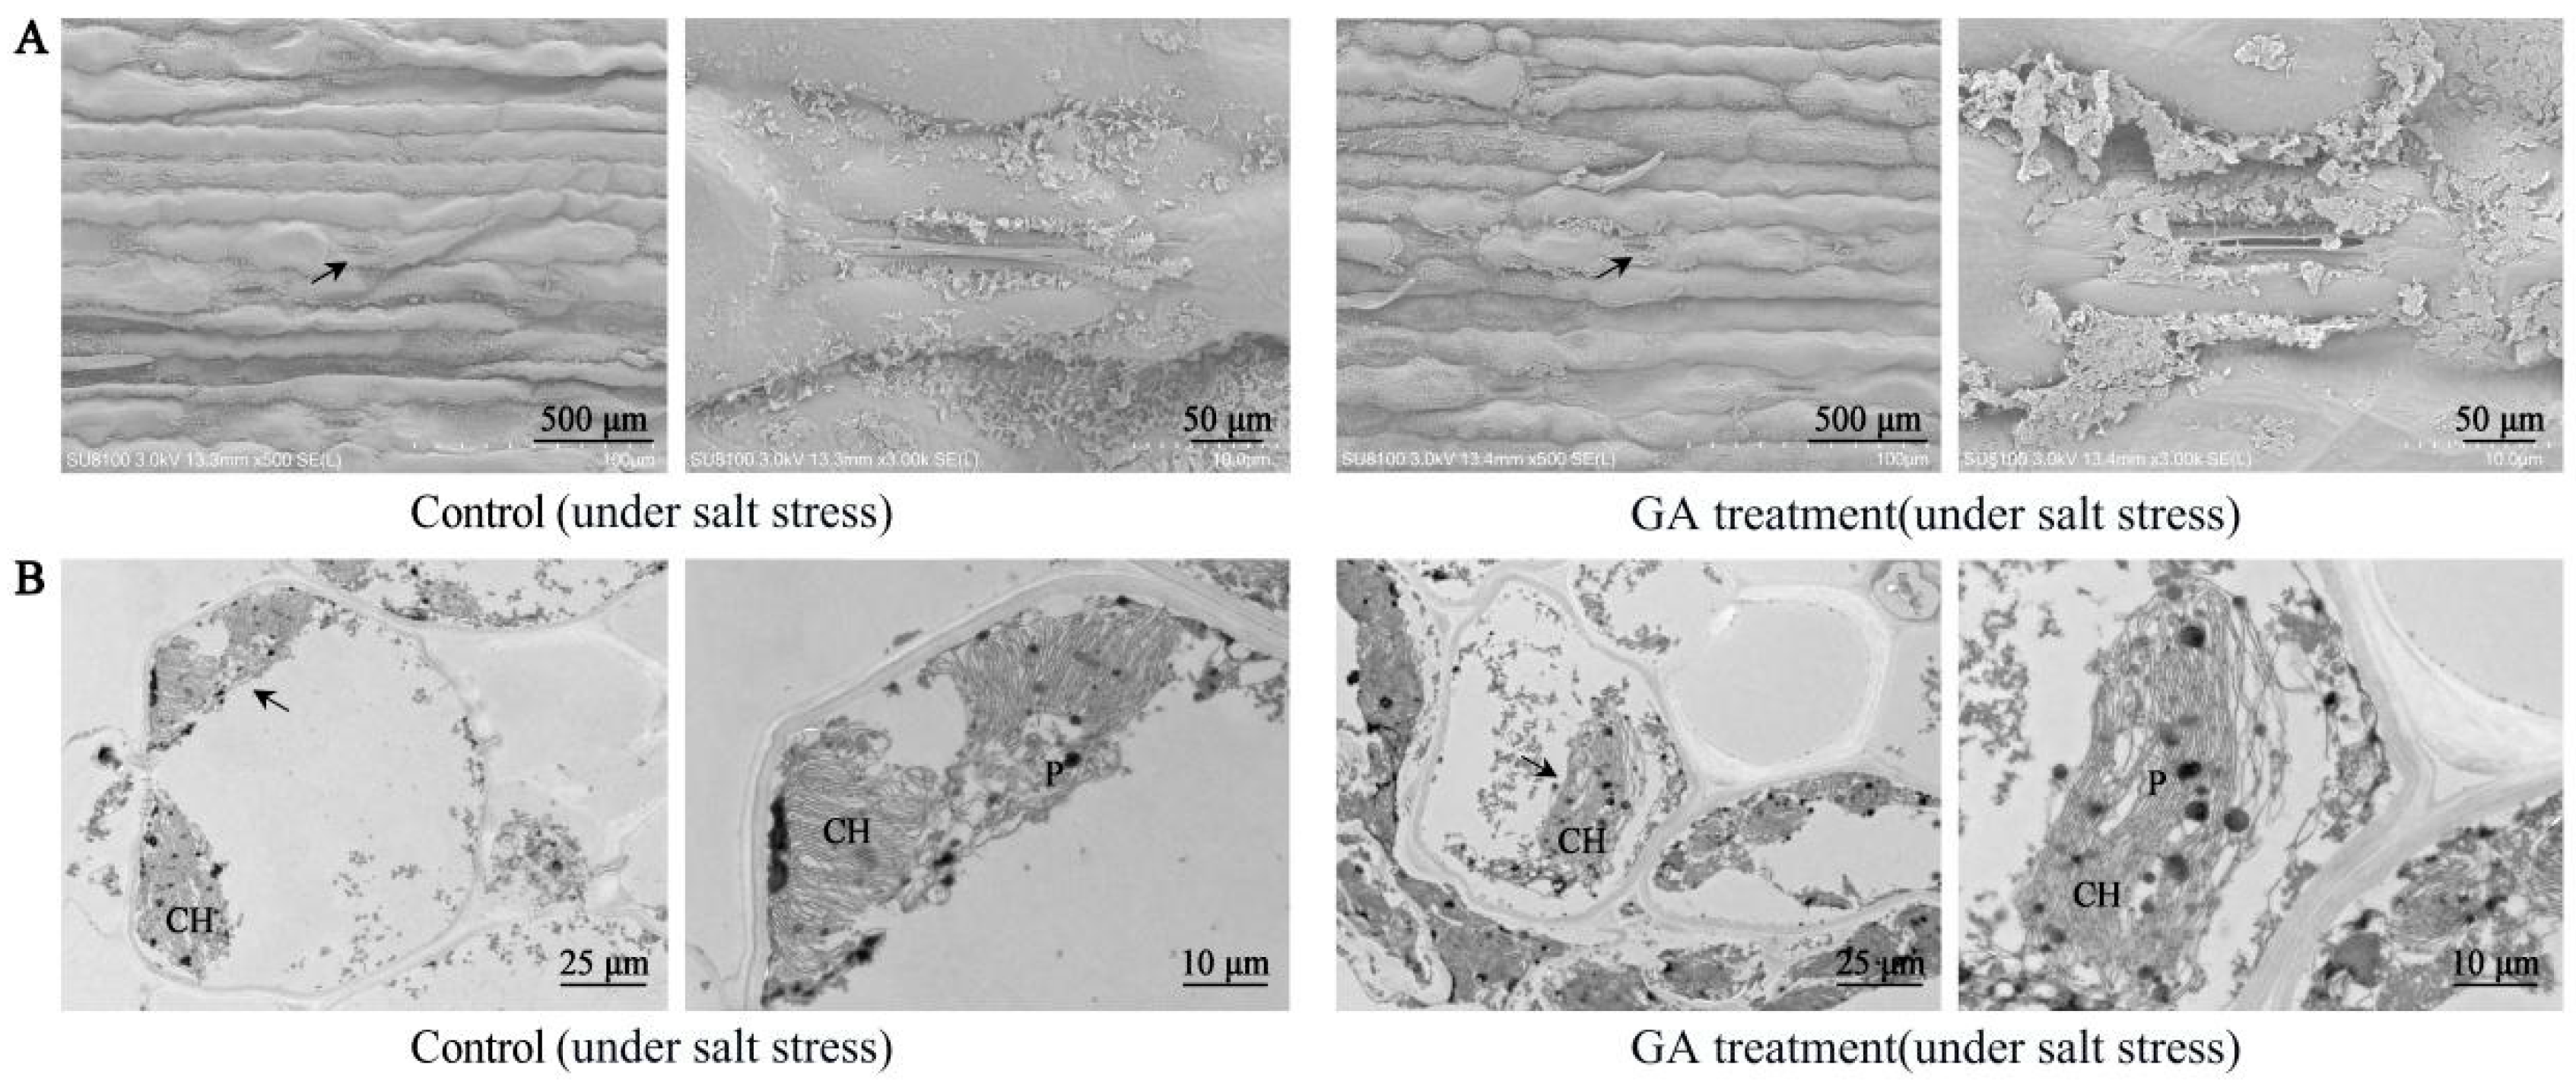
2.4. Effect of GA3 Treatment on Leaf Ultrastructure in Sorghum (“Jitian 3”) under Salt Stress

To further analyze the effect of 50 mg/L GA3 treatment on leaf ultrastructure in sorghum “Jitian 3”, we assessed mesophyll cells’ and sorghum leaf chloroplasts using TEM. As shown in Figure 5, under salt stress, almost all sorghum leaf stomata were closed in the control group; however, the stomatal aperture with the GA3 treatment was obviously wider than the controls (Figure 5A). TEM was adopted to assess the mesophyll cells’ ultrastructure in sorghum leaves (Figure 5B). The results revealed that, under salt and drought stress, mesophyll cells were severely deformed and irregularly shaped, chloroplasts gradually broke down, and part of the starch granular structure was disrupted. Compared with the control, the mesophyll cells’ ultrastructure of the GA3-treated leaves was more intact, as were the chloroplasts and starch granules.

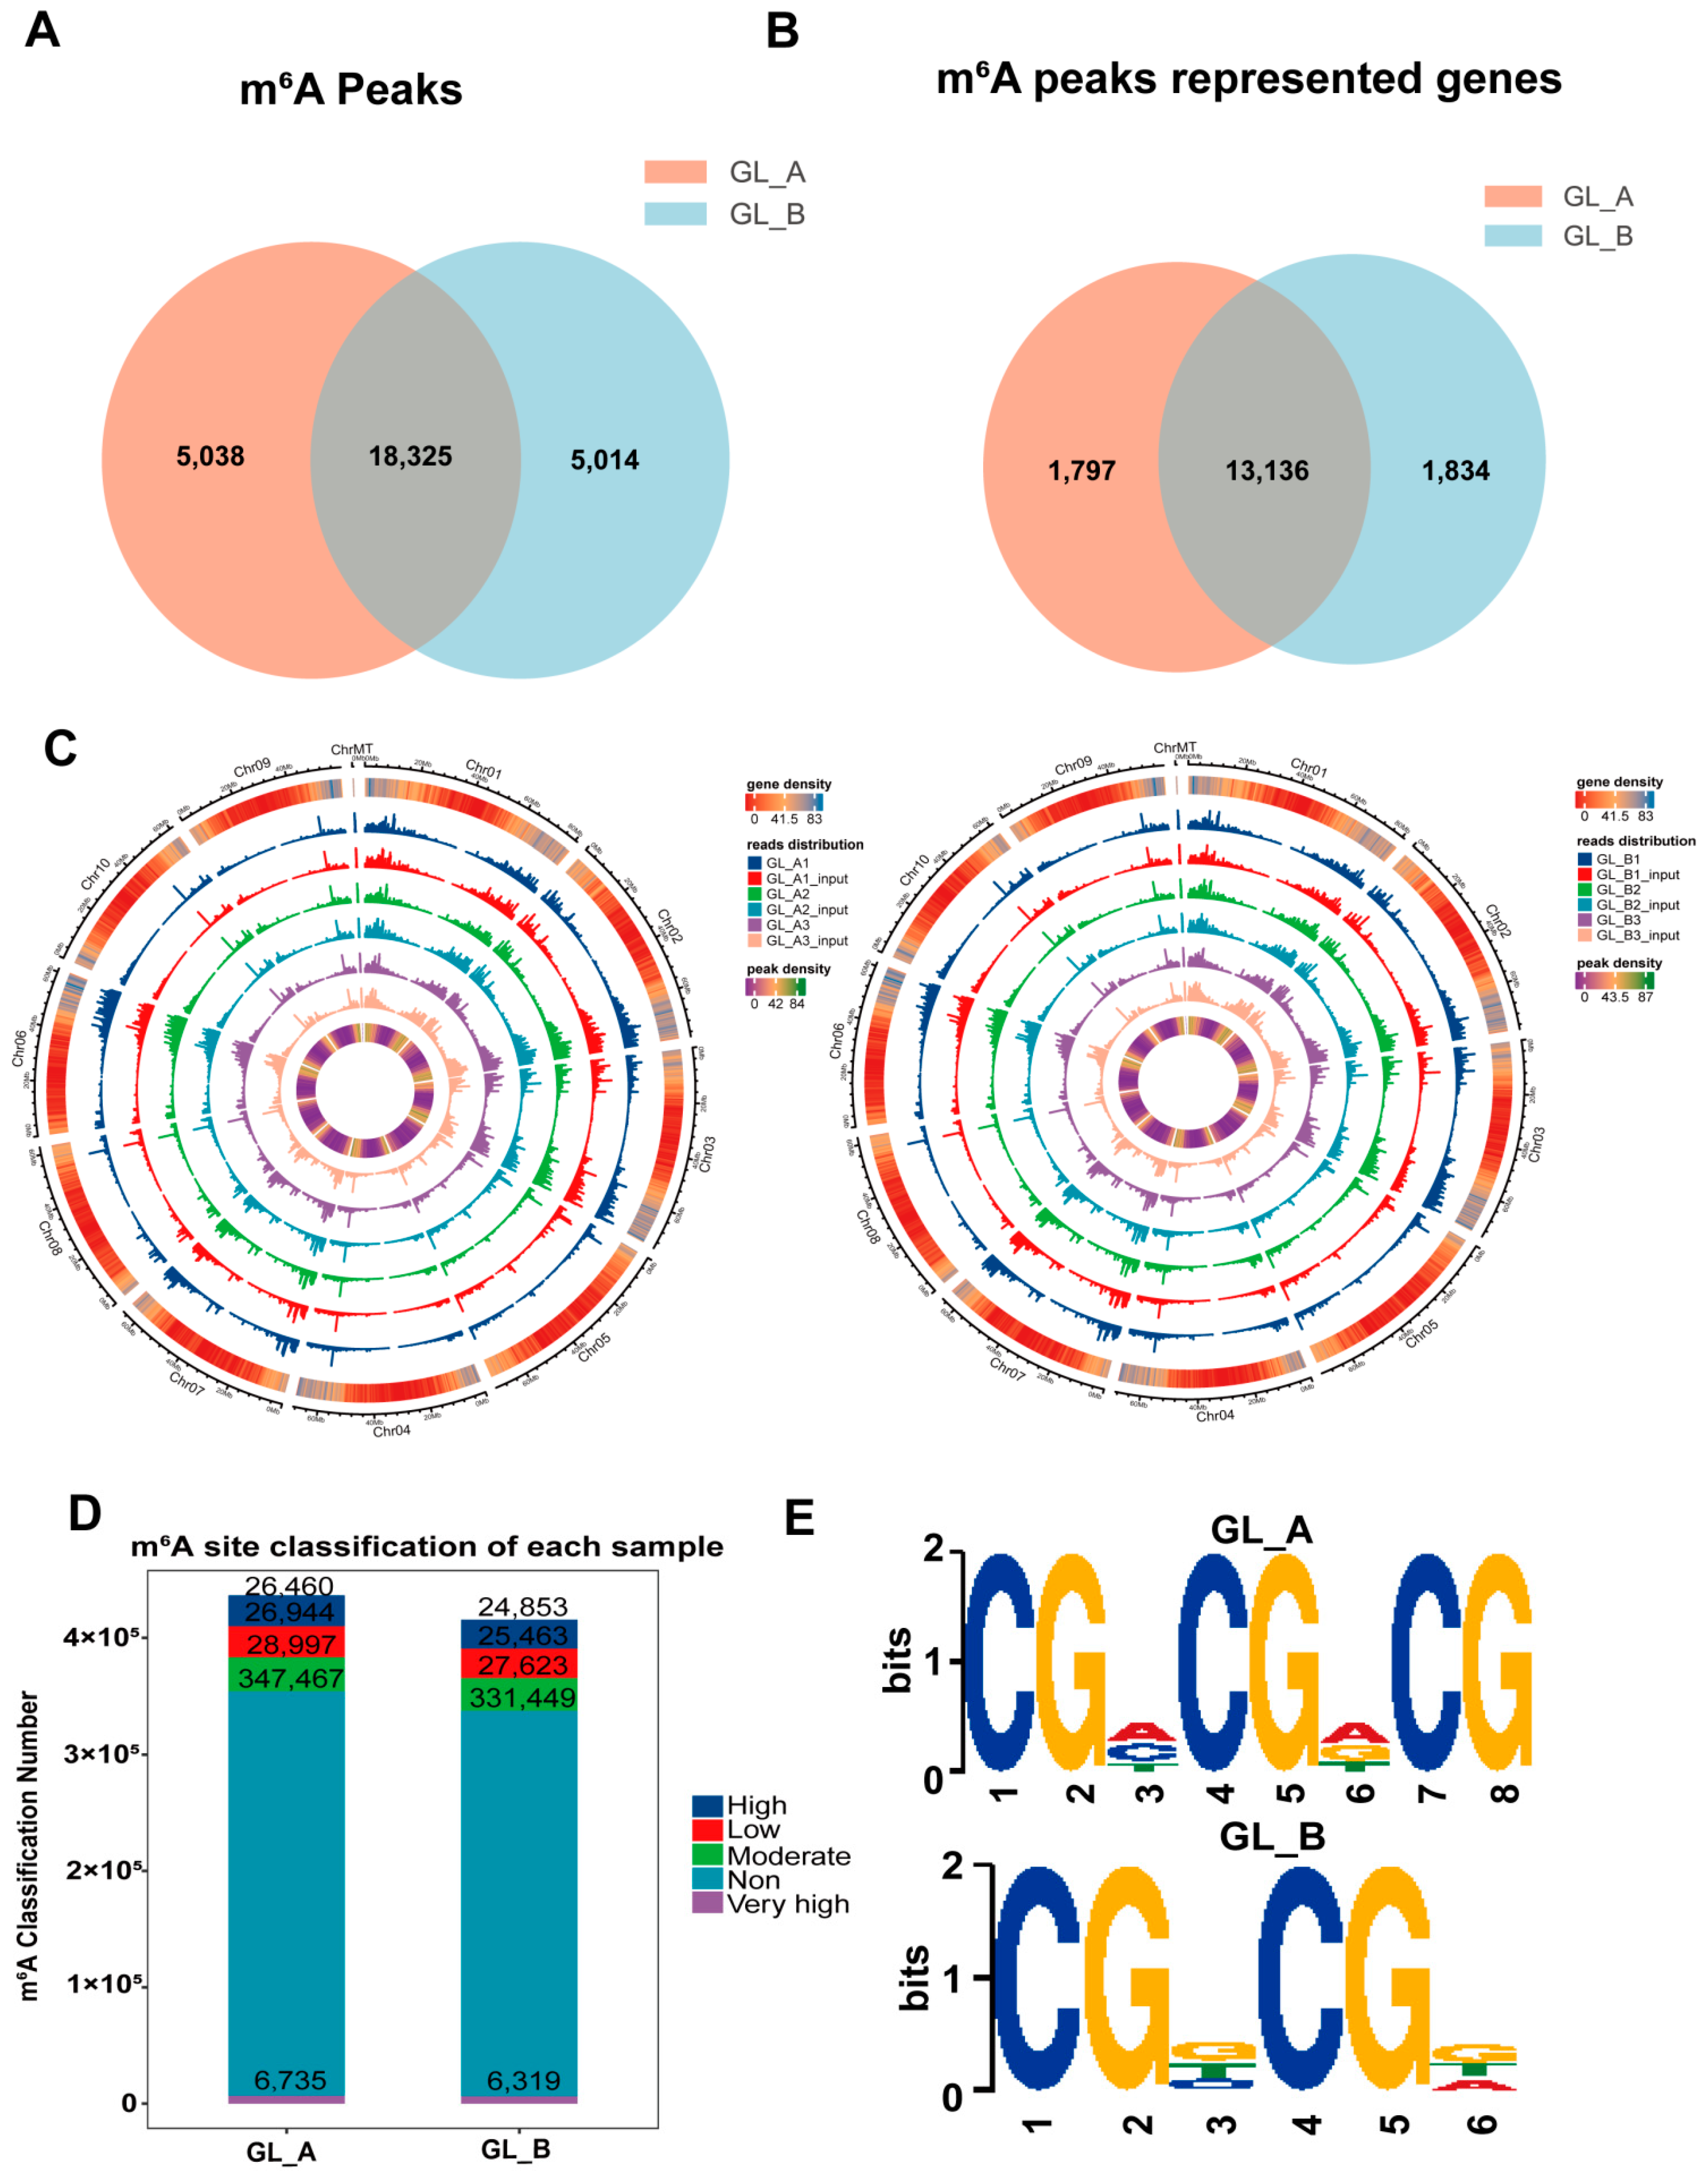
2.5. m6A-M Profile within Sorghum under GA3 Treatment, as Evidenced by a Transcriptome-Wide m6A-seq

In this study, sorghum leaf tissues, treated with either 150 mM NaCl + 50 mg/L GA3 treatment (GL_A) or 150 mM NaCl treatment (GL_B), were used for m6A-seq assay, with three independent replicates per treatment. Using m6A-seq, we achieved about 48.48 Mb raw reads per sample, and approximately 89.45 million clean reads were mapped to the sorghum reference genome per sample (Supplementary Table S1). In terms of RNA-seq, about 55.90 Mb raw reads were obtained per leaf, and approximately 103.86 valid reads were mapped to the reference genome per leaf. The mapped reads proportion was between 88.97 and 94.87 (Supplementary Table S1). These results suggested that the high-quality sequencing data was suitable for use in subsequent analyses.
Employing the MeTDiff tool, we identified 23,363 and 16,200 m6A peaks in the GL_A and GL_B leaves, respectively (Figure 6A). Among them, 5038 and 5014 distinct peaks were noted in the GL_A and GL_B leaves, respectively, which reflected the difference between the examined leaves in the total m6A-M trends. Similarly, we annotated 14,933 and 14,970 genes in the GL_A and GL_B leaves, respectively (Figure 6B). Additionally, 18,325 peaks were persistently present in both leaves, and 13,136 genes (87.9% of all genes) were modified via m6A among the examined leaves. Furthermore, in terms of the genomic distribution, the m6A distribution analysis suggested that the m6A peaks were differentially distributed on the sorghum chromosomes in each group (Figure 6C). In addition, we also evaluated the differential m6A site stratification of each sample in both leaves (Figure 6D). The motif analysis revealed that both leaves harbored the classical m6A consensus sequences (Figure 6E). This finding added to the credibility of our m6A peaks and suggested the presence of a strong methylation modification system.

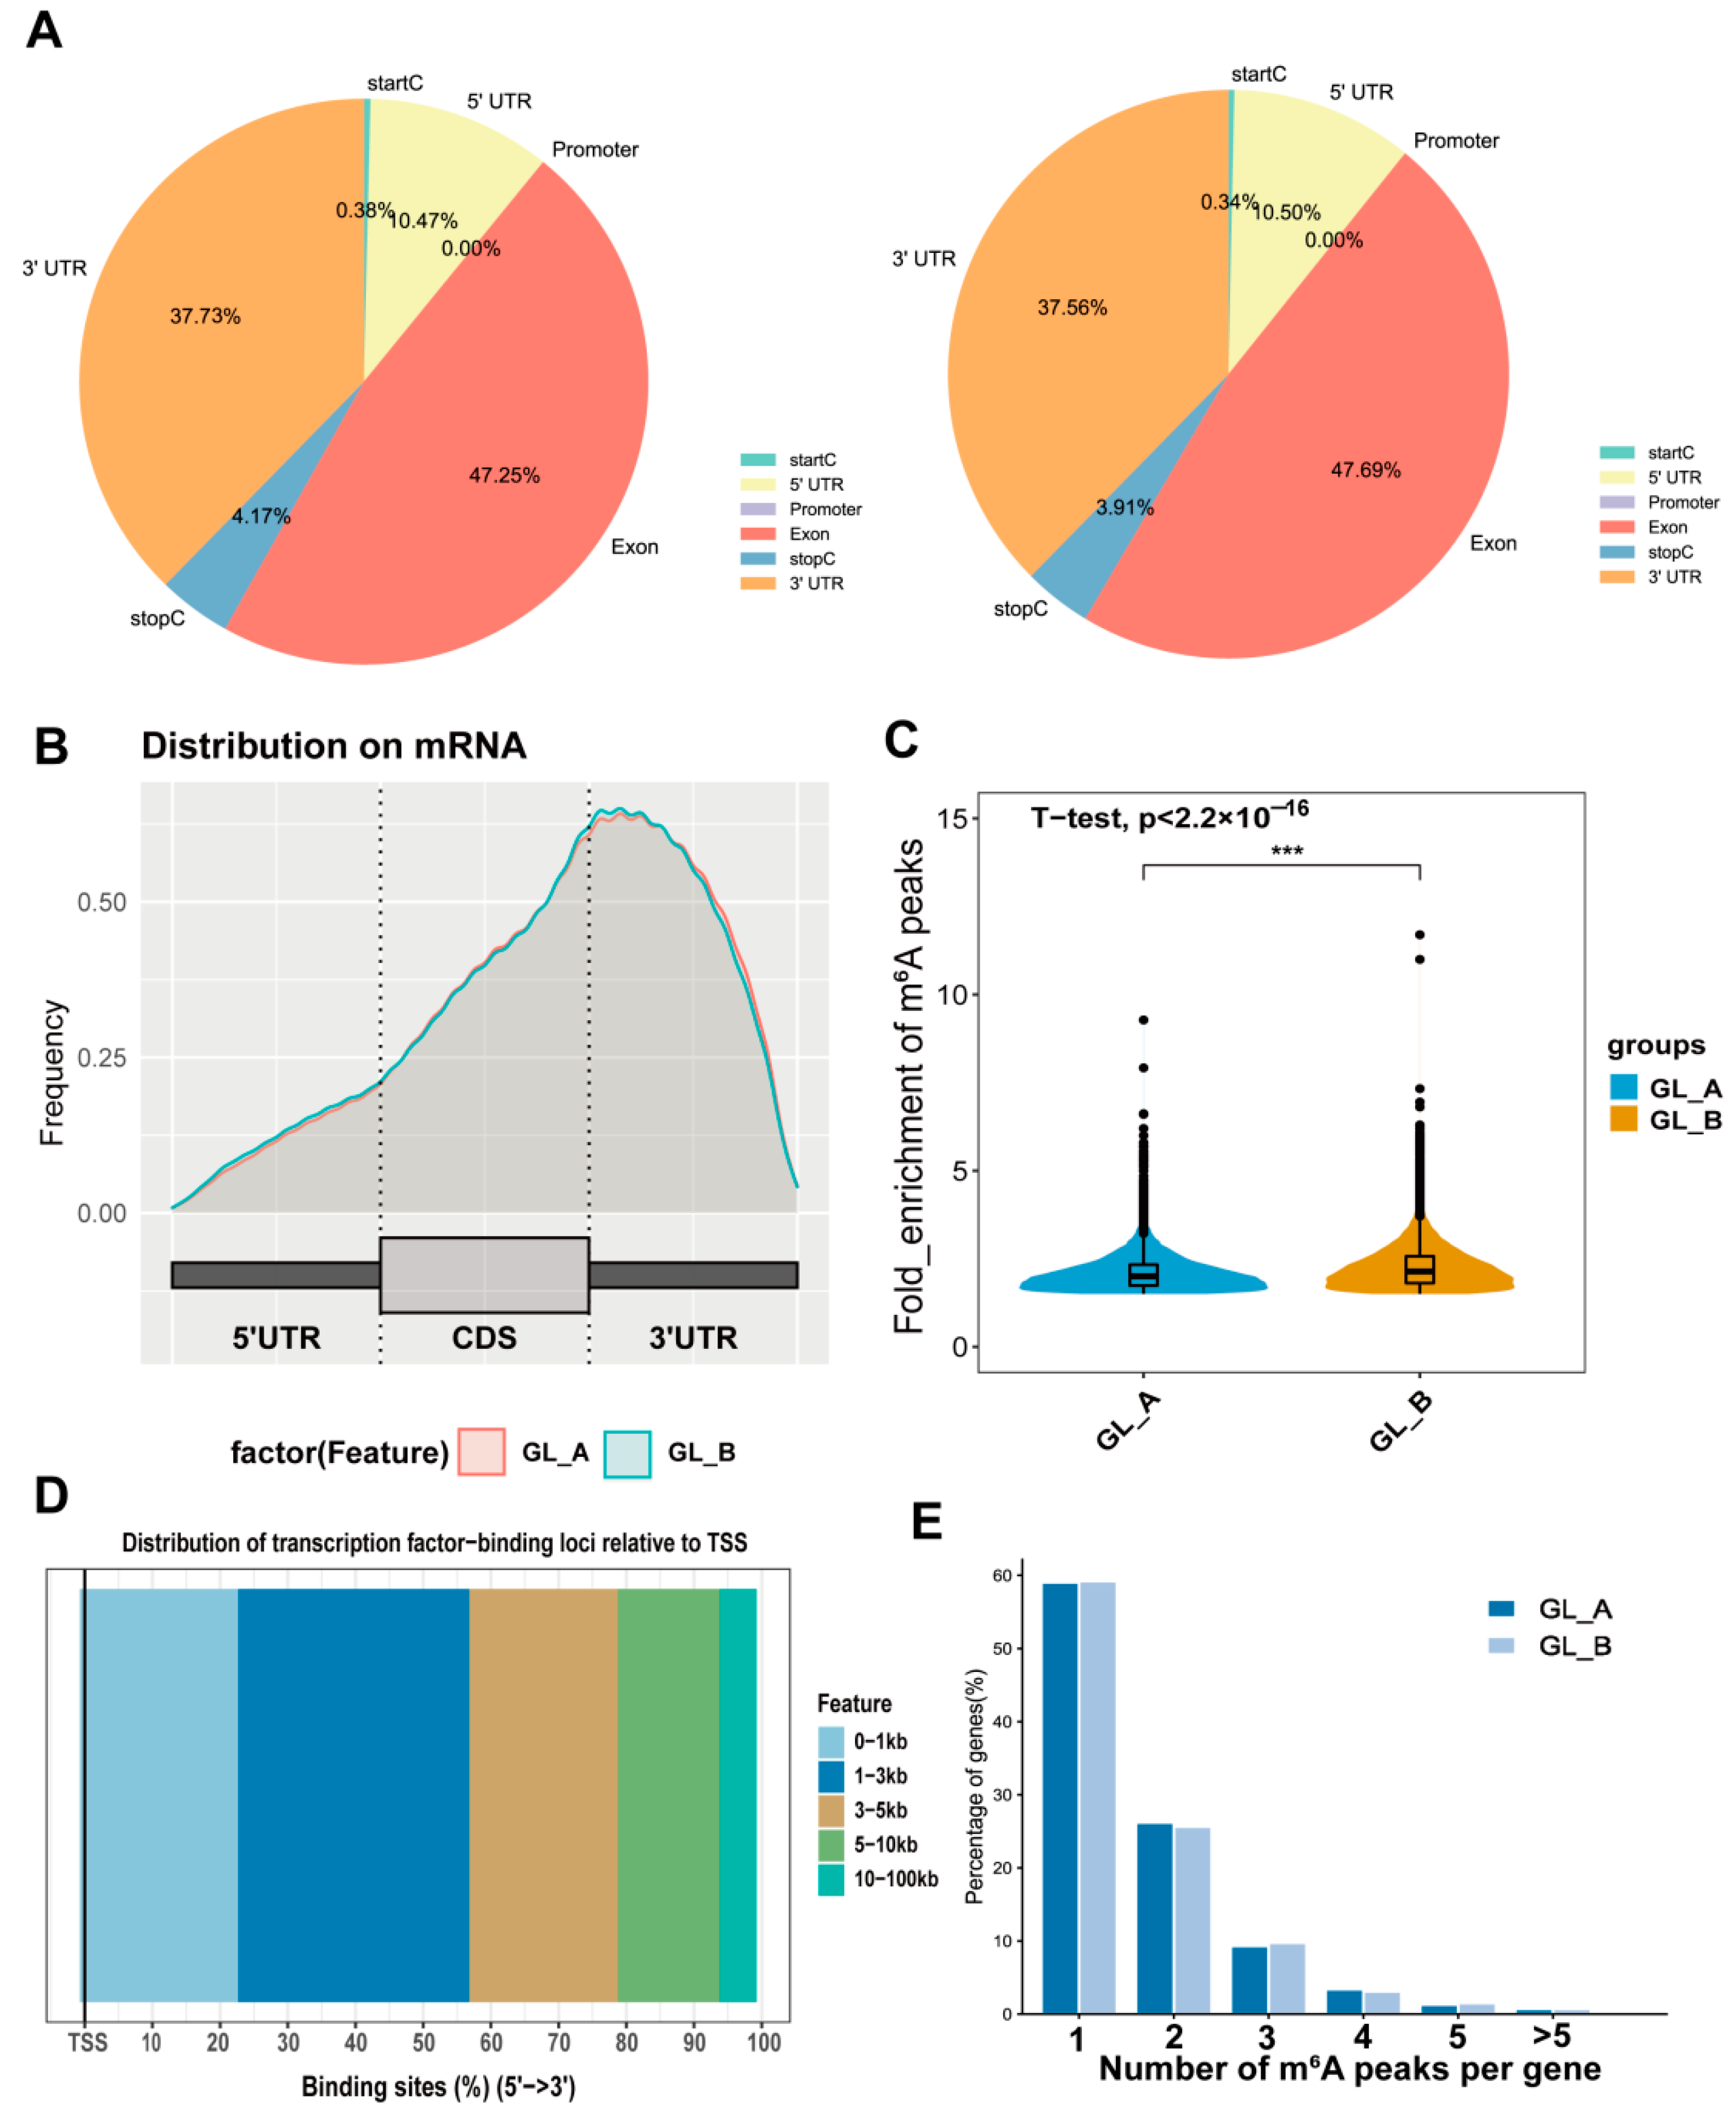
2.6. m6A-M Distribution in Sorghum under GA3 Treatment

To explore the preferential m6A sites within transcripts, we assessed the m6A peaks profile in the sorghum transcriptome via coordination of the sorghum reference genome. The mRNA was separated into distinct regions as follows: the 5′-untranslated region (5′UTR), promoter, close to the start codon (startC), coding sequence (CDS) or exon, close to the stop codon (stopC), and the 3′UTRs. Based on our analysis, m6A-modified peaks enrichment was the maximum in the CDS (exon), followed by the 3′UTRs, 5′UTRs, and stopC region in the examined leaves (Figure 7A). The m6A peak density distribution exhibited similar trends in both the GA3-treated (GL_A) and control (GL_B) leaves (Figure 7B). However, the m6A peak enrichment degree varied significantly among the pairwise leaves (p-value < 2.2 × 10⁻¹⁶; Figure 7C). Furthermore, we analyzed the distribution of transcription-factor-binding loci relative to TSS, which was mainly located in the 1–3 kb region (Figure 7D). The m6A modified peak distribution of individual genes was assessed, and we revealed that most genes contained 1–3 m6A peaks in the GL_A and GL_B leaves (Figure 7E).

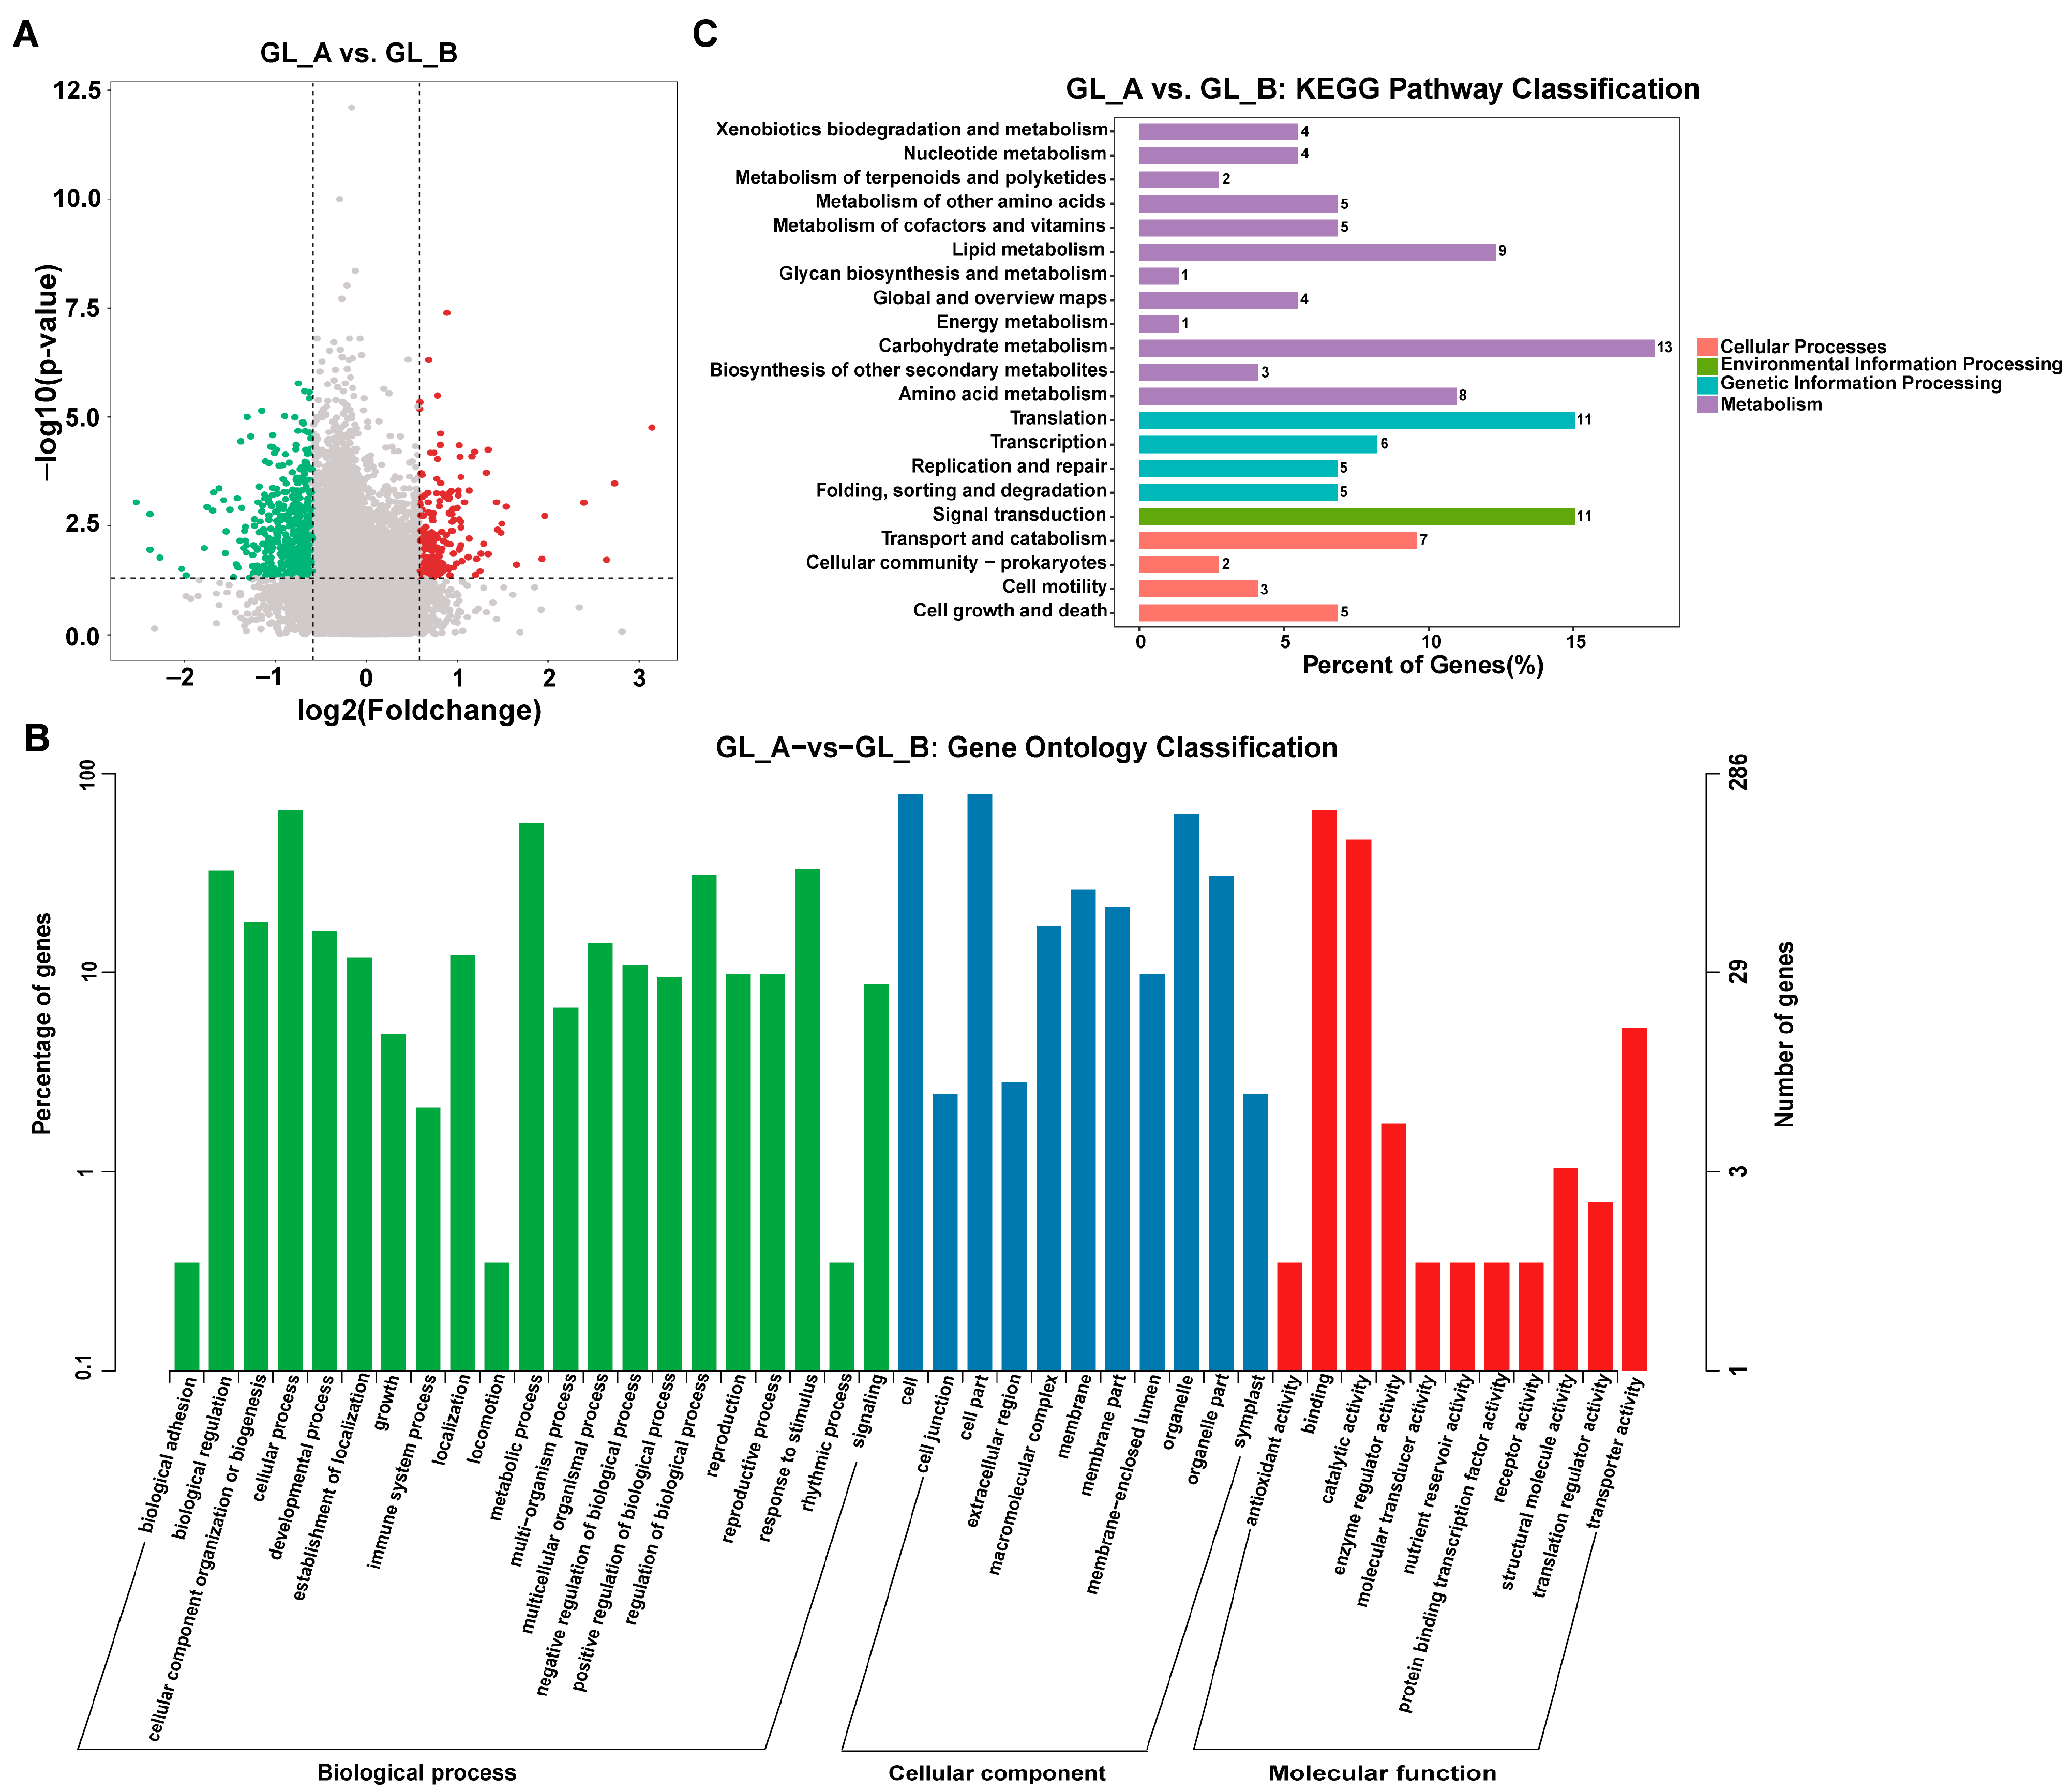
2.7. Differentially Methylated Gene (DMG) Evaluation

To elucidate the role of m6A-M in sorghum following GA3 treatment, we conducted a pairwise comparison to identify DMGs. Relative to the GL_B group, 752 distinct DMGs were evident within 726 transcripts in the GL_A group (Figure 8A; Supplementary Table S2). Moreover, we carried out GO and KEGG analyses to establish the physiological roles of m6A-M in sorghum following GA3 treatment. Based on our GO analysis, all DMGs were primarily enriched in the organelle (ontology: cellular component (CC)), interacting, catalytic, and transporter activities (ontology: molecular function (MF)), as well as the developmental and metabolic process (ontology: biological process (BP)) (Figure 8B). KEGG evaluation revealed that the DMGs were markedly involved in the phosphatidylinositol signaling, lysine degradation, inositol phosphate metabolism, and so on (Figure 8C).

2.8. RNA-Seq-Based Screening of Differentially Expressed Genes (DEG)

In sorghum, we further analyzed the transcriptional differences between GA3 treatment (GL_A, n = 3) and controls (GL_B, n = 3) (Figure 9A). Using RNA-Seq, we identified a total of 2455 DEGs in the GL_A versus GL_B group (Figure 9B). Among them, 1335 were upregulated and 1120 were downregulated. The DEG hierarchical cluster profile is presented in Figure 9C. In addition, all DEGs were primarily enriched in 20 marked KEGG networks (p < 0.05, Figure 9D). Of note, most DEGs were strongly associated with the phenylpropanoid biosynthesis network and the plant hormone signaling network, followed by flavonoid biosynthesis and the tyrosine metabolic axis, and so on.

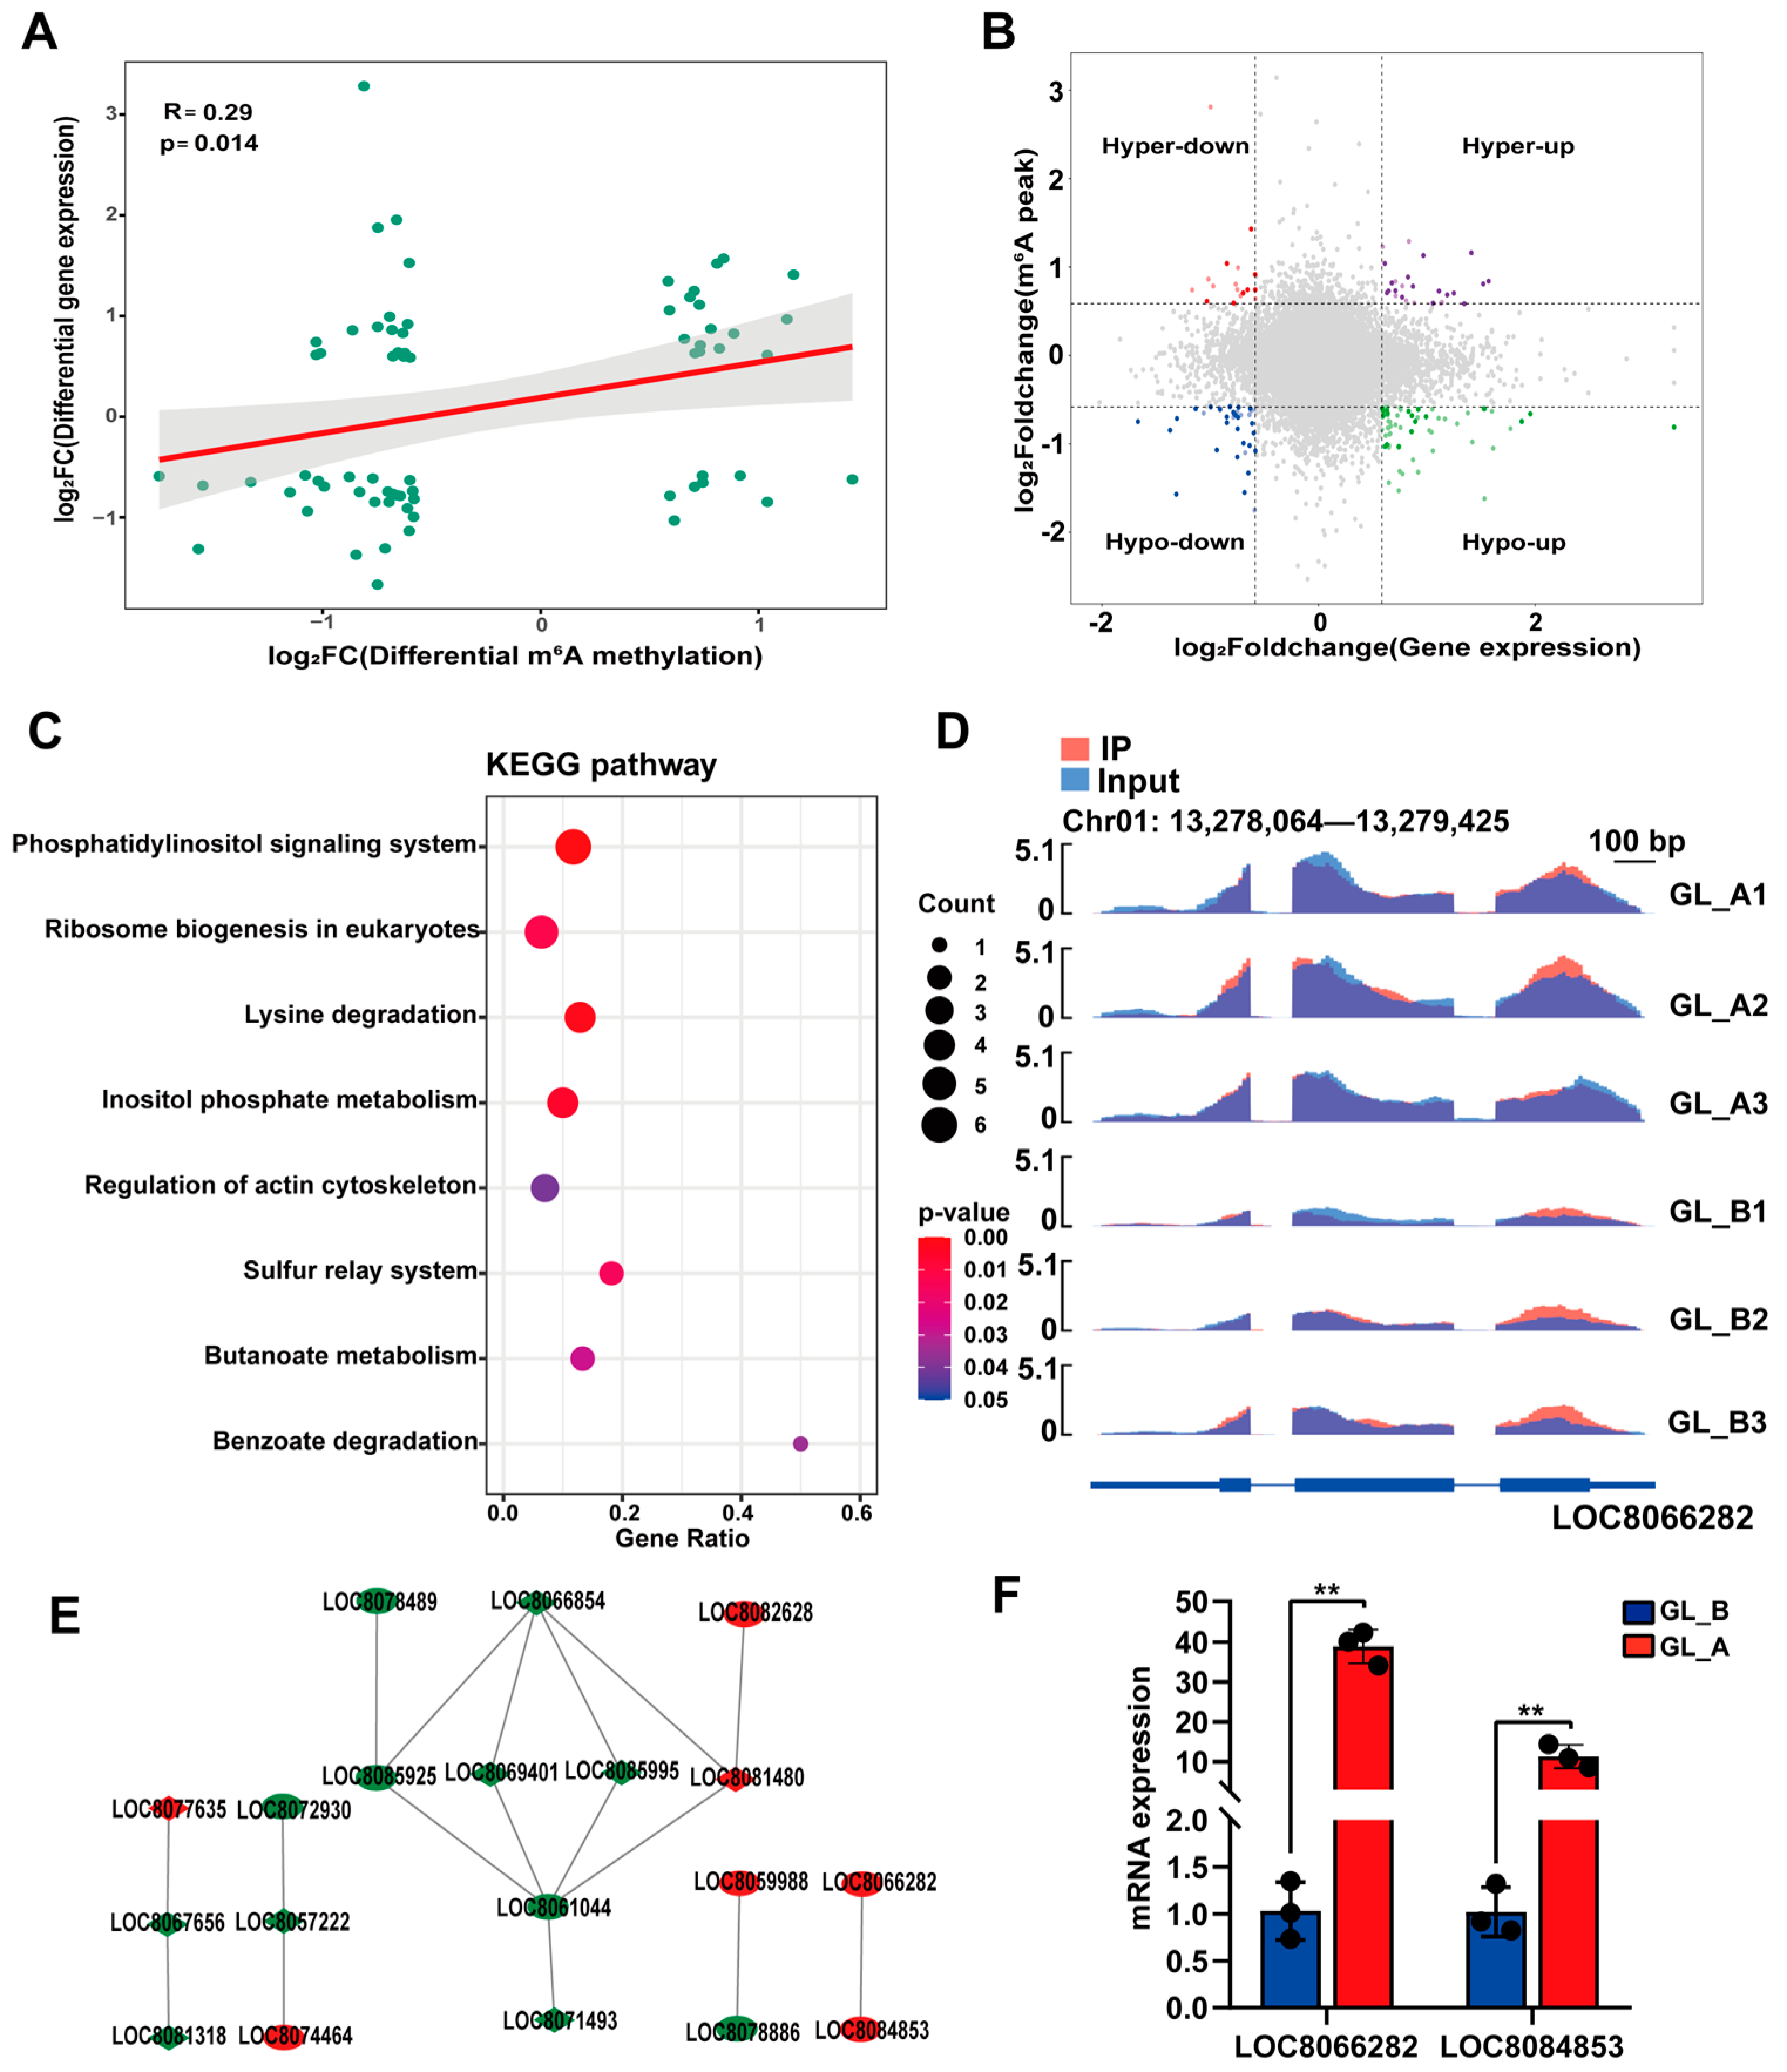
2.9. Conjoined Assessment of m6A- and RNA-seq Results

To elucidate a possible association between m6A-M and gene expression, we conducted a cross-analysis of our m6A- and RNA-seq results. Figure 10A depicts a strong and direct association between DEMs and gene expression (p = 0.014, Spearman r = 0.29). Given that the absolute X and Y values were >2, the four-quadrant diagram analysis demonstrated a strong correlation between 682 DMGs and 660 associated genes (Figure 10B). Ultimately, 70 DMGs were strongly associated with transcript expression (p < 0.05, Supplementary Table S3). In addition, we employed all the identified genes in the KEGG network analyses (Figure 10C). Based on our analysis, most genes were markedly enriched in eight KEGG networks, namely the phosphatidylinositol axis, eukaryotic ribosomal biogenesis, lysine degradation, inositol phosphate metabolism, and so on. In the phosphatidylinositol axis, the LOC8066282 transcript revealed a substantial hypermethylated peak (Figure 10D). Based on our STRING analysis, 19 genes were grouped into PPIs networks (Figure 10E). Among them, two DMGs (LOC8066282, LOC8084853) were chosen for analysis via RT-qPCR. We revealed that the selected DMG expression showed a tendency comparable to that of RNA-Seq (Figure 10F). Our findings suggested the critical roles of these candidate genes in the development of sorghum under GA3 treatment.

3. Discussion

Salinity is one of the most harmful abiotic stresses that inhibit plant growth and development. Similar findings have been described in which a low concentration of salt (<0.3%) had little effect on the growth of caster beans and even had some promotional effect, while a high concentration of salt (>0.6%) significantly inhibited the growth of seedlings [21]. Gibberellins (GA3 as the major type) are important plant hormones that are widely used to regulate plant growth during the whole life cycle of crop plants. A previous study showed that GA3 significantly enhanced plant growth and biomass yield of mustard (Brassica juncea L.) [11]. Thus, we identified the optimal GA3 concentration (50 mg/L) for alleviating salt stress by assessing its effect of on sorghum phenotypic and morphological variations, chlorophyll contents, antioxidant enzymes activities, organic content, and leaf ultrastructure. Plant height and leaf characteristics are important indicators of crop growth and development. Under salt stress, plant height, leaf area, and dry weight of sorghum plants are significantly reduced [22]. Gibberellins can regulate the osmotic potential of cells by accumulating intracellular substances that are harmless to protoplasts, thus resisting osmotic stress. Antioxidant enzymes play an important role in the scavenging of reactive oxygen species under salt stress. Under salt stress, reactive oxygen species (ROS) can damage functional macromolecular structures such as intracellular proteins and unsaturated fatty acids, leading to cell membrane lipid peroxidation [23]. After gibberellin application, the activity of SOD is increased, acting as the first line of defense for scavenging ROS. In this study, our findings showed that GA3 treatment with an appropriate concentration can enhance the protective enzyme activity in sorghum seedling leaves. Therefore, it is concluded in the present study that GA3 treatment increased the salt tolerance of sorghum seedlings, partly via improving the antioxidant system.
Some studies have shown that m6A modification (m6A-M) leads to mRNA instability at specific transcripts, which demonstrated the essential roles of m6A in various plant developmental processes and different tissues, including leaves and root tips [24,25]. MeRIP-seq is commonly employed to profile m6A-M in various species. Dominissini et al. successfully generated human and mice m6A-M patterns and explored transcriptome-wide m6A-M status in multiple species [26]. Other investigators characterized m6A-M patterns in Arabidopsis thaliana [27], Oryza sativa [13], and Saccharomyces cerevisiae [28]. Unfortunately, there have been limited studies on the sorghum m6A-M profile. Herein, we were the first to characterize the transcriptome-wide m6A-M landscape in sorghum leaves via MeRIP-seq. Our analysis demonstrated that the m6A-M sites were mostly enriched in the CDS and 3′UTRs, with somewhat reduced sites in the start/stopC regions. In mice, these peaks were more frequent across the internal region of modified transcripts, and they exhibited the following distribution frequencies: 37% CDS, 30% stopC, 20% 3′-UTR, and 13% TSS [29]. In A. thaliana, the m6A-M locations were mostly within the 3′-UTR and stop/startC regions [27]. Likewise, in O. sativa, most m6A-Ms were in the intergenic regions, with 70% prevalence in the CDS and 3′-UTR, and 20% in the intronic and 5′-UTR regions [13]. Based on these results, the m6A-M profile is species-specific. Generally, most mammalian and plant m6A-M locations are markedly enriched in the CDS and 3′-UTR regions, thereby indicating that these modification profiles are similar to the classical topological m6A patterns of mature transcripts. The m6A enrichment in these terminal regions is strongly correlated with RNA stability and signal transduction and may modulate targeting recruitments that regulate transcript transport or transfer. As the targets and mechanisms of m6A-mediated sorghum leaves development are poorly understood, mapping m6A targets in leaves under GA3 treatment will provide insights into m6A roles in salt stress.
Functionally, m6A-Ms control a myriad of biological processes, namely metabolism, differentiation, and disease etiology [30,31]. m6A-M profiles differ depending on tissues and environmental stimuli. Environment- and stimuli-based m6A-M profiles were previously examined in murine embryonic stem cells, embryonic fibroblasts, and preadipocytes [32,33]. Herein, we evaluated the m6A-M profile differences between GA3-exposed and control sorghum leaves. We demonstrated that genes that fell under DEGs and DMGs were closely related to metabolic networks such as the phosphatidylinositol axis and inositol phosphate. The leaf-specific m6A modified transcripts are mainly enriched in genes related to photosynthesis and respiratory metabolism, while the transcripts in roots are mainly enriched in genes that respond to stress, redox processes, and transporters. However, a large number of m6A modified transcripts in leaves are related to development, stress response, cell proliferation and differentiation [34]. Plants establish numerous cellular and molecular networks to adapt to salt stress. These include transport system activation, metabolic regulation, and transcriptional response modulation [35]. The phosphoinositol axis serves an essential function in plant development and their response to environmental stress [36]. In terms of the identified m6A-modified genes, our RNA-seq and qPCR co-analyses revealed that LOC8066282 was a significant DEG in GA3-treated sorghum. Moreover, LOC8066282 associates with LOC8084853 in the generated PPI network. LOC8066282 contributes to the phosphoinositol axis, thereby regulating salt stress. This indicates that both LOC8066282 and LOC8084853 likely serve essential roles following GA3 treatment. However, limited investigations assessed sorghum LOC8066282. Thus, it is critical to extensively examine the relationship between LOC8066282 levels and sorghum development using Cas9-knockout experiments. In this study, we provided a comprehensive review of the advances in the roles of gibberellins on the growth, physiology, and molecular mechanisms of sorghum under salt stress, intending to better understand the roles of gibberellins in improving the yield and quality of sorghum grown in saline soils.

4. Material and Methods

4.1. Plant Materials, Growth Condition, and GA3 Treatment

The homogeneous and healthy sorghum seed cultivar was “Jitian 3”, a gift from the Agricultural Research Institute in Hebei Province. A factorial format was used to design the experiment, and it included one salinity concentration, 150 mM NaCl, and five GA3 concentrations, which were 0, 25, 50, 75, and 100 mg/L. Each treatment was replicated thrice. All sorghum seeds were immersed in varying GA3 concentrations for 12 h without light at 25 ℃. Subsequently, homogeneous and healthy sorghum bean seeds were selected and soaked with 0.1% NaClO solution for 15 min for disinfection, and then rinsed with purified water three times. Afterwards, the seeds were put in a Petri dish and soaked with 1/2 concentration of Hoagland solution for 48 h for pre-germination. Seeds with comparable bud lengths were planted in a plastic tray (50 cm long; 30 cm wide; 5 cm high) with air holes on the bottom. Next, all pots (5 cm in top diameter and 2.5 cm in bottom diameter) were packed with quartz sand. We planted a maximum of three seeds per pot at a depth of 3 cm. All data and sample collection were randomly performed at 40 days from one of three replicates per treatment. Lastly, the collected samples, along with 0 mg/L and 50 mg/L GA3 controls, were assessed and further evaluated via RNA sequencing.

4.2. Morpho-Physiological Assessments

We collected six sorghum plants from GA3 treatment (n = 3) and controls (n = 3) and carefully rinsed them with distilled water. Next, the true leaf length and width, plant height, and root strength measurements were recorded. The roots were cleaned with distilled water before separation into roots, stems, and leaves. The fresh weight was recorded. Then, the leaves were oven-dried at 70 ℃ for 72 h until a constant weight was achieved for biomass evaluation. At this point, the dry weight was recorded.

4.3. Chlorophyll Contents

To examine the chlorophyll composition, we followed the Arnon method, with slight modifications. In short, leaves were overnight (ON) immersed in 10 ml of 80% acetone without light, then 0.5 g of the leaf samples were isolated, followed by 10,000× g, 5 min centrifugation, and absorption (abs) measurement (supernatant) at 645 and 663 nm via a spectrophotometer. To determine chlorophyll levels in mg g−1 FW, we utilized the following formulas:
Total-Chl = [20.2(A645) + 8.02(A663)] × (V/1000W),
Chl-a = [12.7(A663) − 2.69(A645)] × (V/1000W), and
Chl-b = [22.9(A645) − 4.69(A663)] × (V/1000W).
where A645 and A663 represented chlorophyll abs at 645 and 663 nm, respectively; V represented the total extract volume; W represented the fresh leaf weight.

4.4. Antioxidant Enzymatic Activities Determination

To determine the enzymatic activity, 0.5 g of fresh sorghum seedling leaf was sliced into smaller portions, then combined with quartz sand and 5 mL 50 mM/L phosphate-buffered solution (pH = 7.8). This mixture was then crushed on ice prior to centrifugation at 15,000 r/min for 20 min at 4 °C. The resulting supernatant was maintained at low temperature until SOD, POD, and CAT activities were assessed via corresponding kits (Suzhou Keming Biotechnology Co., Ltd., Suzhou, China) following kit directions.

4.5. Evaluation of Soluble Sugar, Soluble Protein, Free Amino Acid, and Starch Content

The soluble sugar content was assessed via the anthrone colorimetry procedure. Soluble protein was evaluated via the coomassie bright-blue G-250 staining technique. Free amino acid was detected via the ninhydrin chromogenic method. Starch content was detected by the 3,5-dinitrosalicylic acid method.

4.6. Evaluation of MDA and Proline

The leaf MDA concentration was measured via the thiobarbituric acid reaction, as reported by Heath and Packer (1968) [37]. Proline quantification employed a procedure reported by Bates et al. (1973) [38], with slight modifications.

4.7. Anatomical Observation

The Zhao et al. (2020) study was referenced for our anatomical evaluation [39]. Fresh leaves were sliced into smaller portions with approximate dimensions of 1 × 1 cm, prior to fixation in 2.5% glutaraldehyde, and maintained at 4 °C for ≥4 h. Then, the leaves were rinsed thrice in 0.1 M phosphate buffer for 15 min each, prior to a secondary fixation in 1% osmium tetroxide for 4 h. Subsequently, they underwent dehydration in 100% acetone and acetone containing anhydrous sodium sulfate for 15 min each. Following embedding in Spurr resin, the sections were sliced, followed by double-staining with uranyl acetate and lead citrate. Lastly, mesophyll cell and chloroplast observation and imaging were performed under a transmission electron microscopy (TEM) (HT7700, HITACHI, Tokyo, Japan).

4.8. RNA Extraction, Library Generation, and Sequencing

Total sorghum leaf RNA was isolated from GA3-treated (GL_A, n = 3) and control leaves (GL_B, n = 3) using Trizol (Invitrogen, Carlsbad, CA, USA), and RNA quality was determined via a NanoDrop ND-1000 spectrophotometer (Thermo Fisher Scientific, Waltham, MA, USA). Subsequently, MeRIP- and RNA-seq were carried out by Oebiotech Corporation (Shanghai, China), employing protocols from prior publications [40]. In brief, the GenSeq™ m6A-MeRIP Kit (GenSeq Inc., Shanghai, China) was employed for m6A RNA immunoprecipitation (IP), following kit protocols. The IP and control samples were then utilized to generate an RNA-seq library using the NEBNext® Ultra II Directional RNA Library Prep Kit (New England Biolabs, Inc., Washington, DC, USA). An Agilent 2100 Bioanalyzer (Agilent Technologies, Inc., Santa Clara, CA, USA) was employed for quality confirmation of the prepared libraries, and an Illumina HiSeq 4000 sequencer (Illumina, Inc., San Diego, CA, USA) was employed for library sequencing with 150 bp paired-end reads. Lastly, the raw high-throughput m6A and RNA-seq data were uploaded into the NCBI SRA database (BioProject ID: PRJNA858555).

4.9. m6A Sequencing Data Analysis

Following sequencing, the raw data (raw reads) in fastq format were initially processed with the Trimmomatic software [41]. Clean data (clean reads) were achieved via removal of reads with adapter, ploy-N, or reduced-quality data from raw information. In the meantime, the SortMeRNA software was employed for ribosomal RNA read elimination [42]. Next, the clean library reads underwent alignment against Sorghum bicolor reference genome (https://www.ncbi.nlm.nih.gov/genome/?term=sorghum, accessed on 15 February 2022) using HISAT2 [43]. To determine the methylated RNA IP sequencing data quality, we employed the Guitar R package [44] and deeptools software [45]. The m6A-enriched peaks in each m6A IP sample were recognized via the MeTDiff software with matched controls [46]. The peaks were stratified by intersection with gene architecture with the ChIPseeker [47]. Differential m6A-M rates between GA3-treated and control plants were assessed with diffReps [48]. Significant peaks were defined as log2|fold change| ≥ 1 and FDR ≤ 0.05.
Next, we evaluated the m6A-peak-distribution profile, based on various functional regions (TSS, CDS, stopC, 3′-UTR, 5′-UTR), and the m6A peaks throughout the entire mRNA were established with the Integrative Genomics Viewer tool (http://software.broadinstitute.org/software/igv/, accessed on 20 March 2022). Relevant motifs were screened via MEME suite (http://meme-suite.org/, accessed on 8 May 2022) and DREME (http://memesuite.org/tools/dreme, accessed on 8 May 2022). The HTSeq program (v0.9.1) was employed for raw mRNA-seq read data retrieval, which was then adjusted via edgeR. Lastly, we conducted the GO (www.geneontology.org, accessed on 16 May 2022) and KEGG network (www.genome.jp/kegg, accessed on 16 May 2022) enrichment analyses of differentially expressed mRNAs and differentially methylated genes (DMGs).

4.10. Quantitative Real-Time PCR (qRT-PCR) Analysis

qRT-PCR was utilized for mRNA assessment using BIO-RAD CFX Connect™ Optics Module (Bio-Rad, Hercules, CA, USA). Isolated leaf RNA (1 μg) was converted to cDNA in a 10 μL reaction using the superscript first-strand synthesis system (PrimeScript® RT Reagent Kit With gDNA Eraser, TaKaRa, Osaka, Japan). SORBI served as the endogenous control. All targeted primers were synthesized by Beijing Qingke Biotechnology Co., Ltd. (Beijing, China) and are summarized in Supplementary Table S4. SYBR® Premix Ex Taq™ was employed for qRT-PCR reactions (TaKaRa, Osaka, Japan). The PCR cycles were adjusted as described below: 55 °C for 2 min, 95 °C for 30 s (denaturation), 40 cycles at 95 °C for 5s, 55 °C for 15 s, and 72 °C for 30 s. Relative gene expression was computed using the 2−ΔΔCt comparative threshold (Ct) formula.

4.11. Statistical Analysis

One-way ANOVAs in SPSS, version 25.0 (IBM, Armonk, New York, NY, USA), were employed for all data analyses. A p-value < 0.05 was deemed as significant.

5. Conclusions

Herein, we established an m6A RNA-methylation profile using high-throughput sequencing. Our work highlights the critical physiological roles of epigenetic alterations in sorghum. Using combined m6A-RIP- and RNA-seq analyses, we demonstrated the influence of 70 DMGs in modulating gene expression. Moreover, we identified the node genes (LOC8066282, LOC8084853), which have principal roles in the modulation of sorghum development. Additional investigations are warranted to validate the identified DMGs in sorghum.

Supplementary Materials

The supporting information can be downloaded at: https://www.mdpi.com/article/10.3390/ijms231810674/s1.

Author Contributions

Y.W. and G.Z. planned and designed the experiments. Y.W. and J.L. performed the experiments. Y.W. analyzed the data and wrote the manuscript. All authors have read and agreed to the published version of the manuscript.

Funding

This work was supported by the National Natural Science Funds (32102411), the Natural Science Foundation of Jiangsu Province of China (BK20200924), the China National Key R&D Program (2022YFE0113400), the Natural Science Foundation of Jiangsu Higher Education Institutions of China (20KJB210005), Jiangsu Association for Science and Technology young Scientific and technological Talents Project—supported by Yanqing Wu. We thank the OE Biotech Co., Ltd. (Shanghai, China) for RNA-seq and Zhou Xuan for assistance with the data upload.

Institutional Review Board Statement

Not applicable.

Informed Consent Statement

Not applicable.

Data Availability Statement

The raw high-throughput m6A and RNA-seq data were uploaded into the NCBI SRA database (BioProject ID: PRJNA858555).

Conflicts of Interest

The authors declare that they have no competing interests.

Abbreviations

GA3gibberellic acid
m6A-Mm6A methylation
SODsuperoxide dismutase
PODperoxidase
CATCatalase
UTRuntranslated region
stopCstop codon
startCstart codon
CDScoding sequence
DMGsdifferentially methylated genes
DEGsdifferentially expressed genes
PCAprincipal component analysis
qRT-PCR quantitative real-time polymerase chain reaction

References

  1. An, J.P.; Yao, J.F.; Xu, R.R.; You, C.X.; Wang, X.F.; Hao, Y.J. An apple NAC transcription factor enhances salt stress tolerance by modulating the ethylene response. Physiol. Plantarum 2018, 164, 279–289. [Google Scholar] [CrossRef] [PubMed]
  2. Hu, D.G.; Ma, Q.J.; Sun, C.H.; Sun, M.H.; You, C.X.; Hao, Y.J. Overexpression of MdSOS2L1, a CIPK protein kinase, in-creases the antioxidant metabolites to enhance salt tolerance in apple and tomato. Physiol. Plantarum 2016, 156, 201–214. [Google Scholar] [CrossRef]
  3. Song, J.; Shi, G.W.; Gao, B.; Fan, H.; Wang, B.S. Waterlogging and salinity effects on two Suaeda salsa populations. Physiol. Plantarum 2011, 141, 343–351. [Google Scholar] [CrossRef] [PubMed]
  4. Munns, R.; Tester, M. Mechanisms of salinity tolerance. Annu. Rev. Plant Biol. 2008, 59, 651–681. [Google Scholar] [CrossRef] [PubMed]
  5. Elkahoui, S.; Smaoui, A.; Zarrouk, M.; Ghrir, R.; Limam, H. Salt-induced lipid changes in Catharanthus roseus cultured cell suspensions. Phytochemistry 2004, 65, 1911–1917. [Google Scholar] [CrossRef]
  6. Lopéz-Pérez, L.; Martinez-Ballesta, M.D.; Maurel, C.; Carvajal, M. Changes in plasma membrane lipids, aquaporins and proton pump of broccoli roots, as an adaptation mechanism to salinity. Phytochemistry 2009, 70, 492–500. [Google Scholar] [CrossRef]
  7. Kerkeb, L.; Donaire, J.P.; Venema, K.; Rodriguez-Rosales, M.P. Tolerance to NaCl induces changes in plasma membrane lipid composition, flfluidity and H+-ATPase activity of tomato calli. Physiol. Plantarum 2001, 113, 217–224. [Google Scholar] [CrossRef]
  8. Muniandi, S.K.M.; Hossain, M.A.; Abdullah, M.P.; Ab Shukor, N.A. Gibberellic acid (GA(3)) affects growth and development of some selected kenaf (Hibiscus cannabinus L.) cultivars. Ind. Crops Prod. 2018, 118, 180–187. [Google Scholar] [CrossRef]
  9. Camara, M.C.; Vandenberghe, L.P.S.; Rodrigues, C.; de Oliveira, J.; Faulds, C.; Bertrand, E.; Soccol, C.R. Current advances in gibberellic acid (GA(3)) production, patented technologies and potential applications. Planta 2018, 248, 1049–1062. [Google Scholar] [CrossRef]
  10. Kandil, A.A.; Sharief, A.E.; Abido, W.A.E.; Awed, A.M. Effect of Gibberellic Acid on Germination Behaviour of Sugar Beet Cultivars under Salt Stress Conditions of Egypt. Sugar Tech 2014, 16, 211–221. [Google Scholar] [CrossRef]
  11. Ahmad, P. Growth and antioxidant responses in mustard (Brassica juncea L.) plants subjected to combined effect of gibberellic acid and salinity. Arch. Agron. Soil Sci. 2010, 56, 575–588. [Google Scholar] [CrossRef]
  12. Clancy, M.J.; Shambaugh, M.E.; Timpte, C.S.; Bokar, J.A. Induction of sporulation in Saccharomyces cerevisiae leads to the formation of N6-methyladenosine in mRNA: A potential mechanism for the activity of the IME4 gene. Nucleic Acids Res. 2002, 30, 4509–4518. [Google Scholar] [CrossRef] [PubMed]
  13. Li, Y.; Wang, X.; Li, C.; Hu, S.; Yu, J.; Song, S. Transcriptome-wide N6-methyladenosine profiling of rice callus and leaf reveals the presence of tissue-specific competitors involved in selective mRNA modification. RNA Biol. 2014, 11, 1180–1188. [Google Scholar] [CrossRef] [PubMed]
  14. Duan, H.C.; Wei, L.H.; Zhang, C.; Wang, Y.; Chen, L.; Lu, Z.K.; Chen, P.R.; He, C.; Jia, G.F. ALKBH10B is An RNA N6-Methyladenosine Demethylase Affecting Arabidopsis Floral Transition. Plant Cell 2017, 29, 2995–3011. [Google Scholar] [CrossRef] [PubMed]
  15. Murik, O.; Chandran, S.A.; Nevo-Dinur, K.; Sultan, L.D.; Best, C.; Stein, Y.; Hazan, C.; Ostersetzer Biran, O. Topologies of N6-adenosine methylation (m6A) in land plant mitochondria and their putative effects on organellar gene expression. Plant J. 2020, 101, 1269–1286. [Google Scholar] [CrossRef] [PubMed]
  16. Guo, J.; Tang, H.W.; Li, J.; Perrimon, N.; Yan, D. Xio is a component of the Drosophila sex determination pathway and RNA N6-methyladenosine methyltransferase complex. Proc. Natl. Acad. Sci. USA 2018, 115, 3674–3679. [Google Scholar] [CrossRef]
  17. Xu, K.; Yang, Y.; Feng, G.H.; Sun, B.F.; Chen, J.Q.; Li, Y.F.; Chen, Y.S.; Zhang, X.X.; Wang, C.X.; Jiang, L.Y. Mettl3-mediated m6A regulates spermatogonial differentiation and meiosis initiation. Cell Res. 2017, 27, 1100–1114. [Google Scholar] [CrossRef]
  18. Yang, Y.; Hsu, P.J.; Chen, Y.S.; Yang, Y.G. Dynamic transcriptomic m6A decoration: Writers, erasers, readers and functions in RNA metabolism. Cell Res. 2018, 28, 616–624. [Google Scholar] [CrossRef]
  19. Shao, Y.L.; Wong, C.E.; Shen, L.S.; Yu, H. N6-methyladenosine modification underlies messenger RNA metabolism and plant development. Curr. Opin. Plant Biol. 2021, 63, 102047. [Google Scholar] [CrossRef]
  20. Zhang, T.Y.; Wang, Z.Q.; Hu, H.C.; Chen, Z.Q.; Liu, P.; Gao, S.Q.; Zhang, F.; He, L.; Jin, P.; Xu, M.Z.; et al. Transcriptome-Wide N6-Methyladenosine (m6A) Profiling of Susceptible and Resistant Wheat Varieties Reveals the Involvement of Variety-Specific m6A Modification Involved in Virus-Host Interaction Pathways. Front. Microbiol. 2021, 12, 656302. [Google Scholar] [CrossRef]
  21. Zhou, G.S.; Ma, B.L.; Li, J.; Feng, C.N.; Lu, J.F.; Qin, P. Determining salinity threshold level for castor bean emergence and stand establishment. Crop. Sci. 2010, 50, 2030–2036. [Google Scholar] [CrossRef]
  22. Fatima, H.; Khan, A.; Nadeem, M. Exogenous application of ascorbic acid and gibberellic acid improved tolerance of maize to NaCl stress. Fresen. Environ. Bull. 2022, 31, 1380–1387. [Google Scholar]
  23. Netondo, G.W.; Onyango, J.C.; Beck, E. Sorghum and salinity: II. Gas exchange and chlorophyll fluorescence of sorghum under salt stress. Crop Sci. 2004, 44, 806–811. [Google Scholar] [CrossRef]
  24. Arribas-Hernández, L.; Bressendorff, S.; Hansen, M.H.; Poulsen, C.; Erdmann, S.; Brodersen, P. An m6A-YTH module controls developmental timing and morphogenesis in Arabidopsis. Plant Cell 2018, 30, 952–967. [Google Scholar] [CrossRef]
  25. Vespa, L.; Vachon, G.; Berger, F.; Perazza, D.; Faure, J.D.; Herzog, M. The immunophilin-interacting protein AtFIP37 from Arabidopsis is essential for plant development and is involved in trichome endoreduplication. Plant Physiol. 2004, 134, 1283–1292. [Google Scholar] [CrossRef]
  26. Dominissini, D.; Moshitch-Moshkovitz, S.; Schwartz, S.; Salmon-Divon, M.; Ungar, L.; Osenberg, S.; Cesarkas, K.; Jacob-Hirsch, J.; Amariglio, N.; Kupiec, M.; et al. Topology of the human and mouse m6A RNA methylomes revealed by m6A-seq. Nature 2012, 485, 201–206. [Google Scholar] [CrossRef]
  27. Luo, G.Z.; MacQueen, A.; Zheng, G.Q.; Duan, H.C.; Dore, L.C.; Lu, Z.K.; Liu, J.; Chen, K.; Jia, G.F.; Bergelson, J.; et al. Unique features of the m6A methylome in Arabidopsis thaliana. Nat. Commun. 2014, 5, 5630. [Google Scholar] [CrossRef]
  28. Schwartz, S.; Agarwala, S.D.; Mumbach, M.R.; Jovanovic, M.; Mertins, P.; Shishkin, A.; Tabach, Y.; Mikkelsen, T.S.; Satija, R.; Ruvkun, G.; et al. High-resolution mapping reveals a conserved, widespread, dynamic mRNA methylation program in yeast meiosis. Cell 2013, 155, 1409–1421. [Google Scholar] [CrossRef]
  29. Meyer, K.D.; Saletore, Y.; Zumbo, P.; Elemento, O.; Mason, C.E.; Jaffrey, S.R. Comprehensive analysis of mRNA methylation reveals enrichment in 3’UTRs and near stop codons. Cell 2012, 149, 1635–1646. [Google Scholar] [CrossRef]
  30. Wu, R.F.; Liu, Y.H.; Zhao, Y.L.; Bi, Z.; Yao, Y.X.; Liu, Q.; Wang, F.Q.; Wang, Y.Z.; Wang, X.X. m6A methylation controls pluripotency of porcine induced pluripotent stem cells by targeting SOCS3/JAK2/STAT3 pathway in a YTHDF1/YTHDF2-orchestrated manner. Cell Death Dis. 2019, 10, 171. [Google Scholar] [CrossRef]
  31. Lin, S.; Choe, J.; Du, P.; Triboulet, R.; Gregory, R.I. The m6A methyltransferase METTL3 promotes translation in human cancer cells. Mol. Cell 2016, 62, 335–345. [Google Scholar] [CrossRef] [Green Version]
  32. Zhao, X.; Yang, Y.; Sun, B.F.; Shi, Y.; Yang, X.; Xiao, W.; Hao, Y.J.; Ping, X.L.; Chen, Y.S.; Wang, W.J.; et al. FTO-dependent demethylation of N6-methyladenosine regulates mRNA splicing and is required for adipogenesis. Cell Res. 2014, 24, 1403–1419. [Google Scholar] [CrossRef]
  33. Geula, S.; Moshitch-Moshkovitz, S.; Dominissini, D.; Mansour, A.A.; Kol, N.; Salmon-Divon, M.; Hershkovitz, V.; Peer, E.; Mor, N.; Manor, Y.S.; et al. m6A mRNA methylation facilitates resolution of naïve pluripotency toward differentiation. Science 2015, 347, 1002–1006. [Google Scholar] [CrossRef]
  34. Wan, Y.; Tang, K.; Zhang, D.; Xie, S.; Zhu, X.; Wang, Z.; Lang, Z. Transcriptome-wide high-throughput deep m6A-seq reveals unique differential m6A methylation patterns between three organs in Arabidopsis thaliana. Genome Biol. 2015, 16, 272. [Google Scholar] [CrossRef]
  35. van Zelm, E.; Zhang, Y.X.; Testerink, C. Salt tolerance mechanisms of plants. Annu. Rev. Plant Biol. 2020, 71, 403–433. [Google Scholar] [CrossRef]
  36. Yung, W.S.; Li, M.W.; Sze, C.C.; Wang, Q.N.; Lam, H.M. Histone modifications and chromatin remodelling in plants in response to salt stress. Physiol. Plantarum 2021, 173, 1495–1513. [Google Scholar] [CrossRef]
  37. Heath, R.L.; Packer, L. Photoperoxidation in isolated chloroplasts. I. Kinetics and stoichiometry of fatty acid peroxidation. Arch. Biochem. Biophys. 1968, 125, 189–198. [Google Scholar] [CrossRef]
  38. Bates, L.S.; Waldren, R.P.; Teare, I.D. Rapid determination of free proline for water-stress studies. Plant Soil 1973, 39, 205–207. [Google Scholar] [CrossRef]
  39. Zhao, D.Q.; Fang, Z.W.; Tang, Y.H.; Tao, J. Graphene Oxide as an Effective Soil Water Retention Agent Can Confer Drought Stress Tolerance to Paeonia ostii without Toxicity. Environ. Sci. Technol. 2020, 54, 8269–8279. [Google Scholar] [CrossRef]
  40. Dominissini, D.; Moshitch-Moshkovitz, S.; Salmon-Divon, M.; Amariglio, N.; Rechavi, G. Transcriptome-wide mapping of N6-methyladenosine by m6A-seq based on immunocapturing and massively parallel sequencing. Nat. Protoc. 2013, 8, 176–189. [Google Scholar] [CrossRef]
  41. Bolger, A.M.; Lohse, M.; Usadel, B. Trimmomatic: A flexible trimmer for Illumina sequence data. Bioinformatics 2014, 30, 2114–2120. [Google Scholar] [CrossRef] [Green Version]
  42. Kopylova, E.; Noé, L.; Touzet, H. SortMeRNA: Fast and accurate filtering of ribosomal RNAs in metatranscriptomic data. Bioinformatics 2012, 28, 3211–3217. [Google Scholar] [CrossRef]
  43. Kim, D.; Langmead, B.; Salzberg, S.L. HISAT: A fast spliced aligner with low memory requirements. Nat. Methods 2015, 12, 357–360. [Google Scholar] [CrossRef]
  44. Cui, X.; Wei, Z.; Zhang, L.; Liu, H.; Sun, L.; Zhang, S.W.; Huang, Y.; Meng, J. Guitar: An R/Bioconductor Package for Gene Annotation Guided Transcriptomic Analysis of RNA-Related Genomic Features. Biomed Res. Int. 2016, 2016, 8367534. [Google Scholar] [CrossRef]
  45. Ramírez, F.; Dündar, F.; Diehl, S.; Grüning, B.A.; Manke, T. deepTools: A flexible platform for exploring deep-sequencing data. Nucleic Acids Res. 2014, 42, W187–W191. [Google Scholar] [CrossRef]
  46. Cui, X.; Zhang, L.; Meng, J.; Rao, M.K.; Chen, Y.; Huang, Y. MeTDiff: A Novel Differential RNA Methylation Analysis for MeRIP-Seq Data. IEEE/ACM Trans. Comput. Biol. Bioinform. 2018, 15, 526–534. [Google Scholar] [CrossRef]
  47. Yu, G.C.; Wang, L.G.; He, Q.Y. ChIPseeker: An R/Bioconductor package for ChIP peak annotation, comparison and visualization. Bioinformatics 2015, 31, 2382–2383. [Google Scholar] [CrossRef]
  48. Shen, L.; Shao, N.Y.; Liu, X.; Maze, I.; Feng, J.; Nestler, E.J. diffReps: Detecting differential chromatin modifification sites from ChIP-seq data with biological replicates. PLoS ONE 2013, 8, e65598. [Google Scholar] [CrossRef] [Green Version]
Figure 1. Phenotypic difference of the sorghum with exogenous gibberellic acid (GA3) exposure under salinity-stressed conditions. All sorghum plants were subjected to salt stress via the addition of 150 mM NaCl solution. CK represents the control group with salt stress. S1~S4 represent the experimental leaves with 25 mg/L GA3, 50 mg/L GA3, 75 mg/L GA3, and 100 mg/L GA3 treatment under salt stress, respectively.
Ijms 23 10674 g001
Figure 2. The outcome of varying exogenous GA3 concentrations on the phenotypic variations of sorghum seedling development under 150 mM NaCl exposure. CK—0 mg/L GA3; S1—25 mg/L GA3; S2—50 mg/L GA3; S3—75 mg/L GA3; S4—100 mg/L GA3. Six sorghum plants from GA3 treatment (n = 3) and the control group (n = 3) were used for phenotypic determination, including plant height, leaf width, fresh weight, leaf length, root length, and dry weight. All data are presented as the mean ± SD, Superscript different lowercase letters means significant difference (p < 0.05), Superscript same lowercase letters means significant difference showed no significant difference (p > 0.05).
Ijms 23 10674 g002
Figure 3. The influence of varying exogenous GA3 concentrations on chlorophyll content and antioxidant enzymatic activities of sorghum seedlings developed in the presence of 150 mM NaCl. CK—0 mg/L GA3; S1—25 mg/L GA3; S2—50 mg/L GA3; S3—75 mg/L GA3; S4—100 mg/L GA3. Six sorghum plants from GA3 treated (n = 3) and control leaves (n = 3) were used for the determination of chlorophyll contents, as well as superoxide dismutase (SOD), peroxidase (POD), and catalase (CAT) activities. All data are presented as the mean ± SD, Superscript different lowercase letters means significant difference (p <0.05), Superscript same lowercase letters means significant difference showed no significant difference (p >0.05).
Ijms 23 10674 g003
Figure 4. The outcome of varying exogenous GA3 concentrations on organic sorghum seedlings content developed under 150 mM NaCl conditions. CK—0 mg/L GA3; S1—25 mg/L GA3; S2—50 mg/L GA3; S3—75 mg/L GA3; S4—100 mg/L GA3. Six sorghum plants from GA3 treatment (n = 3) and control group (n = 3) were used for the determination of organic content, including soluble sugar, soluble protein, starch content, free proline, MDA levels, and free amino acid. All data are presented as the mean ± SD, Superscript different lowercase letters means significant difference (p < 0.05), Superscript same lowercase letters means significant difference showed no significant difference (p > 0.05).
Ijms 23 10674 g004
Figure 5. The outcome of GA3 treatment on the anatomical structure of sorghum leaves under salt stress. (A)—Influence of GA3 (50 mg/L) treatment on the epidermal structure and stomatal status of sorghum leaves under salt stress; (B)—influence of GA3 (50 mg/L) treatment on the cellular ultrastructure of sorghum leaves under salt stress; the figure on the right is an enlarged version of the area marked by a black arrow on the left figure. CH—chloroplast; P—plastoglobuli.
Ijms 23 10674 g005
Figure 6. Transcriptome-wide m6A analysis in sorghum under GA3 treatment. (A) The quantity of common and distinct m6A peaks following GA3 (GL_A) versus control (GL_B) treatment. (B) A Venn diagram illustrating the m6A-associated mRNAs in both leaves. (C) m6A peak distribution across chromosomes in both leaves. (D) m6A site stratification in both leaves. (E) The top motif enrichments are related to m6A peaks in both leaves.
Ijms 23 10674 g006
Figure 7. A summary of the m6A methylation (m6A-M) profile in sorghum under GA3 treatment. (A) Pie charts depicting the m6A peak distribution within transcripts. (B) Metagene plots illustrating the identified m6A peak regions within transcripts following GA3 (GL_A) and control (GL_B) treatments. (C) Violin plot revealing the m6A peak enrichment status distribution of individual leaves; *** p < 0.001. (D) The transcription-factor-binding loci distribution relative to TSS. (E) The quantity of m6A peaks per gene in the GL_A and GL_B leaves.
Ijms 23 10674 g007
Figure 8. Differential m6A peaks of the pairwise comparison leaves. (A) Volcano plots depicting the differential peaks in the examined leaves. Red dots represent upregulated differentially methylated genes (DMGs) in GL_A group; green dots represent downregulated differentially methylated genes (DMGs) in GL_A group. (B) GO analysis for differentially methylated genes (DMGs). (C) KEGG network enrichment evaluation of DMGs.
Ijms 23 10674 g008
Figure 9. Analysis of differential expression, based on RNA-Seq data, between the analyzed leaves. (A) Principal component analysis (PCA) of Sorghum between the GA3-treated (GL_A, n = 3) and control (GL_B, n = 3) leaves. (B) Volcano plots depicting the differential gene expression between the examined leaves. (C) Heatmap plot of all DEGs. (D) KEGG network enrichment analyses of all DEGs.
Ijms 23 10674 g009
Figure 10. Combined analysis of the m6A- and RNA-seq data. (A) Log2FC (mRNA expression) versus log2FC (differential m6A methylation) dot plot depicting a strong and direct relationship between the sum of m6A-M and mRNA profile. (B) Four quadrant plots depicting DEGs with differentially methylated m6A peaks. Red dots represent the downregulated DEGs with hypermethylated m6A sites; Purple dots represent the upregulated DEGs with hypermethylated m6A sites; Green dots represent the downregulated DEGs with hypomethylated m6A sites; Blue dots represent the upregulated DEGs with hypomethylated m6A sites. (C) KEGG network enrichment analysis of genes depicting a considerable alteration in m6A and transcript expression. Different shades of colour represent the degree of significance. (D) m6A-modified LOC8066282 transcript data visualization. (E) Protein–protein interactions (PPIs) of genes with considerable alterations in m6A and mRNA transcript levels. Red annotated genes were upregulated DEGs in GL_A group, green annotated genes were downregulated DEGs in GL_A group. (F) Relative transcript expression, as evidenced by qPCR of critical genes in the examined leaves; ** p < 0.01.
Ijms 23 10674 g010
Publisher’s Note: MDPI stays neutral with regard to jurisdictional claims in published maps and institutional affiliations.

