Article

FGFR1–4 RNA-Based Gene Alteration and Expression Analysis in Squamous Non-Small Cell Lung Cancer

by
Joanna Moes-Sosnowska
1,
Monika Skupinska
2,
Urszula Lechowicz
1,
Ewa Szczepulska-Wojcik
3,
Paulina Skronska
1,
Adriana Rozy
1,
Aneta Stepniewska
1,
Renata Langfort
3,
Piotr Rudzinski
4,
Tadeusz Orlowski
4,
Delfina Popiel
2,
Aleksandra Stanczak
5,
Maciej Wieczorek
2,5 and
Joanna Chorostowska-Wynimko
1,*
1
Department of Genetics and Clinical Immunology, National Institute of Tuberculosis and Lung Diseases, 01-138 Warsaw, Poland
2
Preclinical Development Department, Celon Pharma S.A, Research & Development Centre, 05-152 Kazun Nowy, Poland
3
Department of Pathology, National Institute of Tuberculosis and Lung Diseases, 01-138 Warsaw, Poland
4
Department of Surgery, National Institute of Tuberculosis and Lung Diseases, 01-138 Warsaw, Poland
5
Clinical Development Department, Celon Pharma S.A., Research & Development Centre, 05-152 Kazun Nowy, Poland
*
Author to whom correspondence should be addressed.
Int. J. Mol. Sci. 2022, 23(18), 10506; https://doi.org/10.3390/ijms231810506
Submission received: 28 July 2022 / Revised: 27 August 2022 / Accepted: 2 September 2022 / Published: 10 September 2022
(This article belongs to the Special Issue State-of-the-Art of Molecular Biology in Poland)

Abstract

:
While fibroblast growth factor receptors (FGFRs) are involved in several biological pathways and FGFR inhibitors may be useful in the treatment of squamous non-small cell lung cancer (Sq-NSCLC), FGFR aberrations are not well characterized in Sq-NSCLC. We comprehensively evaluated FGFR expression, fusions, and variants in 40 fresh-frozen primary Sq-NSCLC (stage IA3–IV) samples and tumor-adjacent normal tissues using real-time PCR and next-generation sequencing (NGS). Protein expression of FGFR1–3 and amplification of FGFR1 were also analyzed. FGFR1 and FGFR4 median gene expression was significantly (p < 0.001) decreased in tumors compared with normal tissue. Increased FGFR3 expression enhanced the recurrence risk (hazard ratio 4.72, p = 0.029), while high FGFR4 expression was associated with lymph node metastasis (p = 0.036). Enhanced FGFR1 gene expression was correlated with FGFR1 protein overexpression (r = 0.75, p = 0.0003), but not with FGFR1 amplification. NGS revealed known pathogenic FGFR2,3 variants, an FGFR3::TACC3 fusion, and a novel TACC1::FGFR1 fusion together with FGFR1,2 variants of uncertain significance not previously reported in Sq-NSCLC. These findings expand our knowledge of the Sq-NSCLC molecular background and show that combining different methods increases the rate of FGFR aberrations detection, which may improve patient selection for FGFRi treatment.

1. Introduction

Lung cancer is the most common cause of cancer-related death worldwide [1]. The squamous non-small cell lung cancer histotype (Sq-NSCLC) accounts for 20–30% of non-small cell lung cancer. The only approved novel first line systemic therapy for Sq-NSCLC is immune checkpoint inhibitors [2,3]. Therefore, it is important to identify effective targeted therapies and reliable predictive molecular biomarkers for Sq-NSCLC patients.
Recent studies have indicated the potential of fibroblast growth factor receptor inhibitors (FGFRis) as treatment due to the high rate of fibroblast growth factor receptor (FGFR) aberrations found in targetable oncogenic pathways [4] (reviewed in [5,6,7]). However, most early-phase clinical trials with FGFRis have shown only a partial response, which may be a result of the poor predictive power of FGFR1 amplification, which was initially the only predictive biomarker of response to FGFRis in Sq-NSCLC [7,8,9,10,11]. Subsequent studies revealed that FGFR mutations, fusions, or expression might provide more precise information on potential responders. In this context, FGFR gene variants and expression have been evaluated in several preclinical and clinical studies, albeit with conflicting results. For instance, FGFR mRNA or protein levels were reported as significant predictors of sensitivity to AZD4547 [12], BGJ398 [13], ponatinib [12,14], and rogaratinib [15], while others showed inconsistent results [10,16,17].
Members of the fibroblast growth factor (FGF) family, the FGFR1–4 genes, encode four highly conserved tyrosine kinase receptors (FGFR1–4). Each FGFR consists of an extracellular region composed of three immunoglobulin-like domains (Ig I–Ig III), a single hydrophobic transmembrane domain, and a cytoplasmic tyrosine kinase domain. The extracellular domains interact with FGFs, which leads to dimerization of the FGFR followed by activation by sequential autophosphorylation of tyrosine residues [7]. FGFR signaling activates the phosphoinositide-3-kinase (PI3K)/AKT, signal transducer and activator of transcription (STAT), and mitogen activated protein kinase (MAPK) pathways [18]. Deregulated FGF/FGFR signaling through FGFR gene amplification, mRNA overexpression, mutation, or gene fusion is associated with ligand-independent dimerization of FGFRs and subsequent activation of cancer-related signaling pathways (PI3K/AKT, STAT, and MAPK), affecting cell proliferation, survival, metabolism, migration, and the cell cycle. While FGFR1–4 play roles in several biological pathways, simultaneous manifestation of their aberrations and expression in Sq-NSCLC has not been well characterized. Additionally, little is known about the clinical importance of FGFR1–4 expression. Finally, the difference between tumors and the surrounding lung tissue has not yet been comprehensively explored, especially in squamous lung cancer.
Therefore, to expand our knowledge of the role of FGFRs in Sq-NSCLC as well as their use as potential biomarkers for FGFRi treatment, a comprehensive evaluation of FGFR aberrations and their clinical importance in Sq-NSCLC was conducted using real-time PCR (RT-PCR) and next-generation sequencing (NGS) to assess gene expression, fusions, and variants, as well as FGFR1–3 protein expression and FGFR1 amplification. Moreover, the difference between FGFR1–4 expression levels in primary tumors and tumor-adjacent normal tissues, as well as the predictive value of FGFR1–4 mRNA expression, was investigated.

2. Results

2.1. FGFR1–4 mRNA Expression in Sq-NSCLC Tumors and Tumor-Adjacent Normal Tissue

FGFR1 and FGFR4 gene expression levels were significantly decreased in tumor samples (n = 20) compared with tumor-adjacent normal tissue (n = 20): FGFR1 (p = 0.0002) and FGFR4 (p = 0.000001) (Figure 1). Nevertheless, FGFR1 and FGFR4 expression levels were increased and approximated to expression in tumor-adjacent normal tissue (fold-change, ~1) in individual tumor samples: 3 (15%) and 1 (5%), respectively (Figure S1). FGFR2 and FGFR3 mRNA expression levels were not significantly different between tumor and tumor-adjacent normal tissues (p = 0.97 and p = 0.9, respectively). However, in individual tumor samples, FGFR2 and FGFR3 expression levels were enhanced: fold-changes > 2 were observed in 5 (12.5%) and 7 (17.5%) samples, respectively (Figure S1).
Additionally, since the anchored multiplex PCR followed by NGS can be used in gene expression studies, the FGFR1-3 expression levels obtained from the RT-PCR and NGS were compared. The analysis revealed high correlation within FGFR1, FGFR2, and FGFR3 expression assessed with both methods (r = 0.77, p = 0.000001; r = 0.86, p = 0.000001; and r = 0.95, p = 0.000001, respectively; Figure 2 and Supplementary Figure S2) in 40 Sq-NSCLC tumor samples.

2.2. Clinical Significance of FGFR1–4 mRNA Expression

Analysis of FGFR1–4 expression and disease-free survival (DFS) revealed that the increased level of FGFR3 mRNA was correlated with an increased risk of recurrence (RT-PCR: hazard ratio (HR) 4.72, p = 0.029; NGS: HR 7.9, p = 0.0049). Kaplan–Meier survival curves also showed a trend toward poorer prognosis for patients with high FGFR3 expression compared to those with low expression (Figure 3). The mean DFS time of patients with high and low FGFR3 expression was 620 days (<2 years) and 1037 days (~3 years), respectively. FGFR1 (RT-PCR: p = 0.44, NGS: p = 0.56), FGFR2 (RT-PCR: p = 0.22, NGS: p = 0.19), and FGFR4 (p = 0.97) expression levels did not affect the risk of recurrence.

2.3. Association between the FGFR1–4 Expression and Clinicopathological Features

Interestingly, analysis of FGFR1–4 expression association with clinicopathological characteristics (Table 1) revealed that the FGFR4 mRNA expression was significantly higher in patients with lymph node metastasis (median: 0.02 vs. 0.01, p = 0.036; Figure 4), while FGFR1–3 expression levels were not significantly related to any of the clinicopathological features examined.

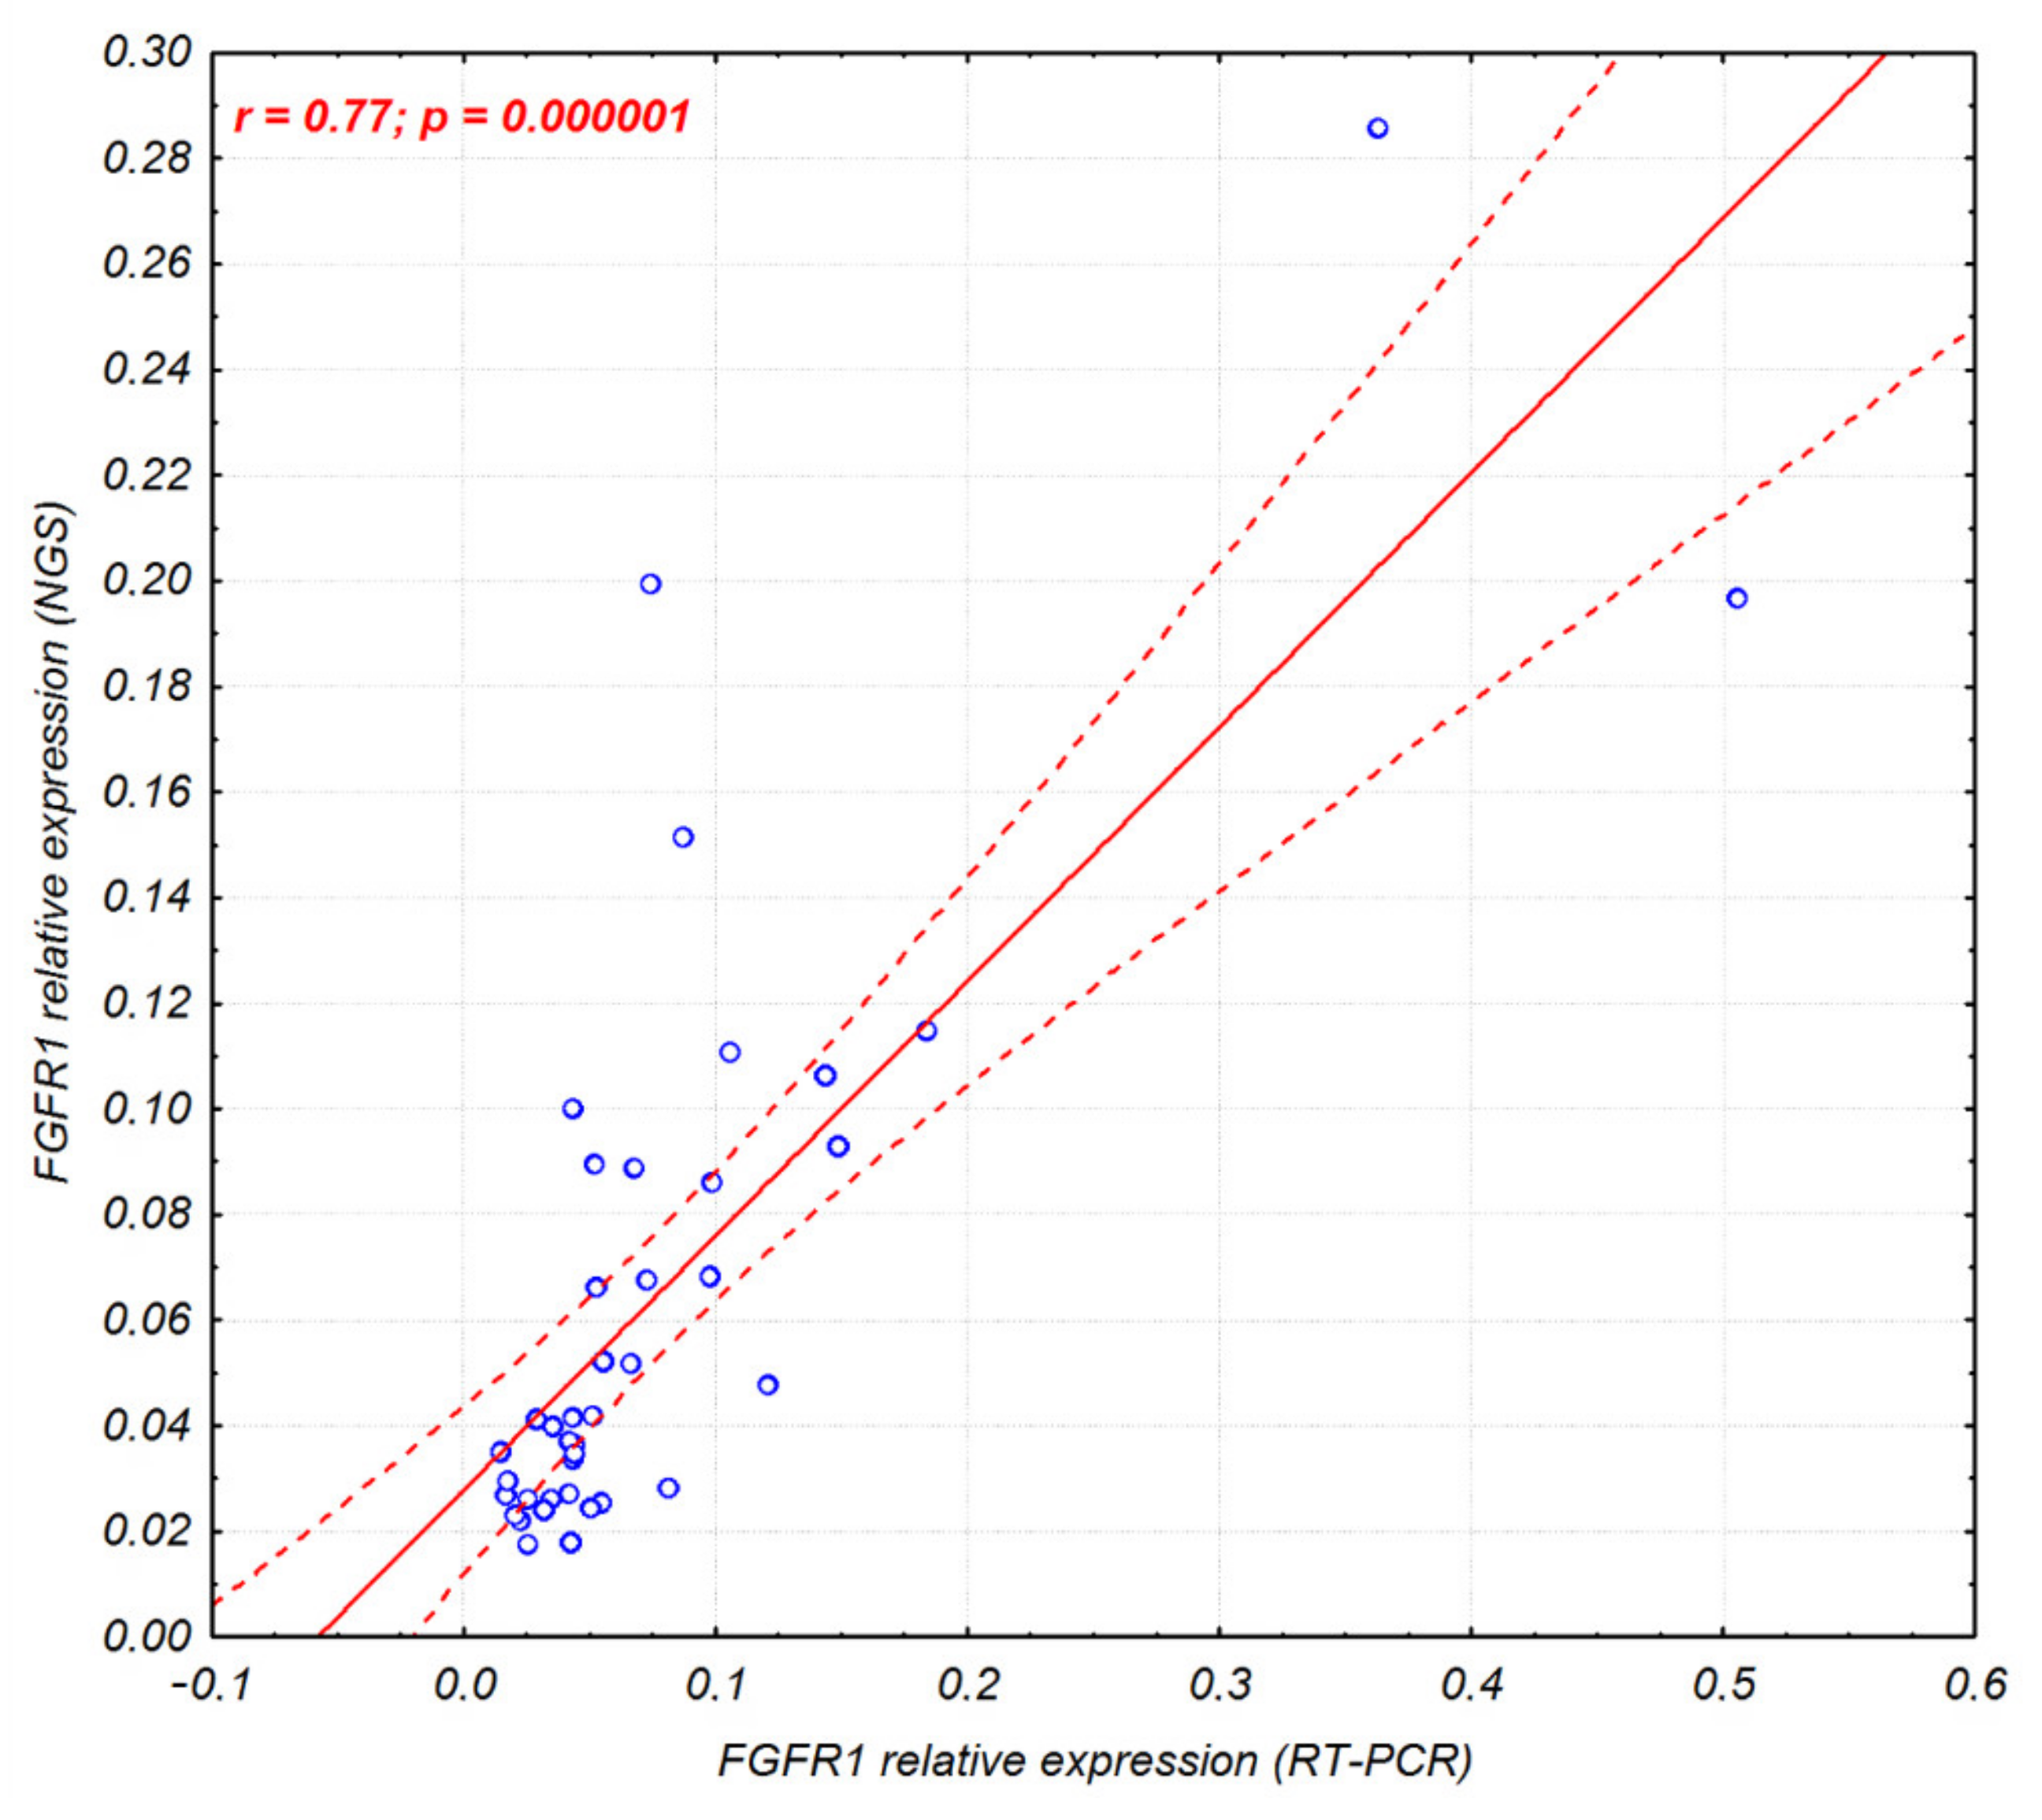
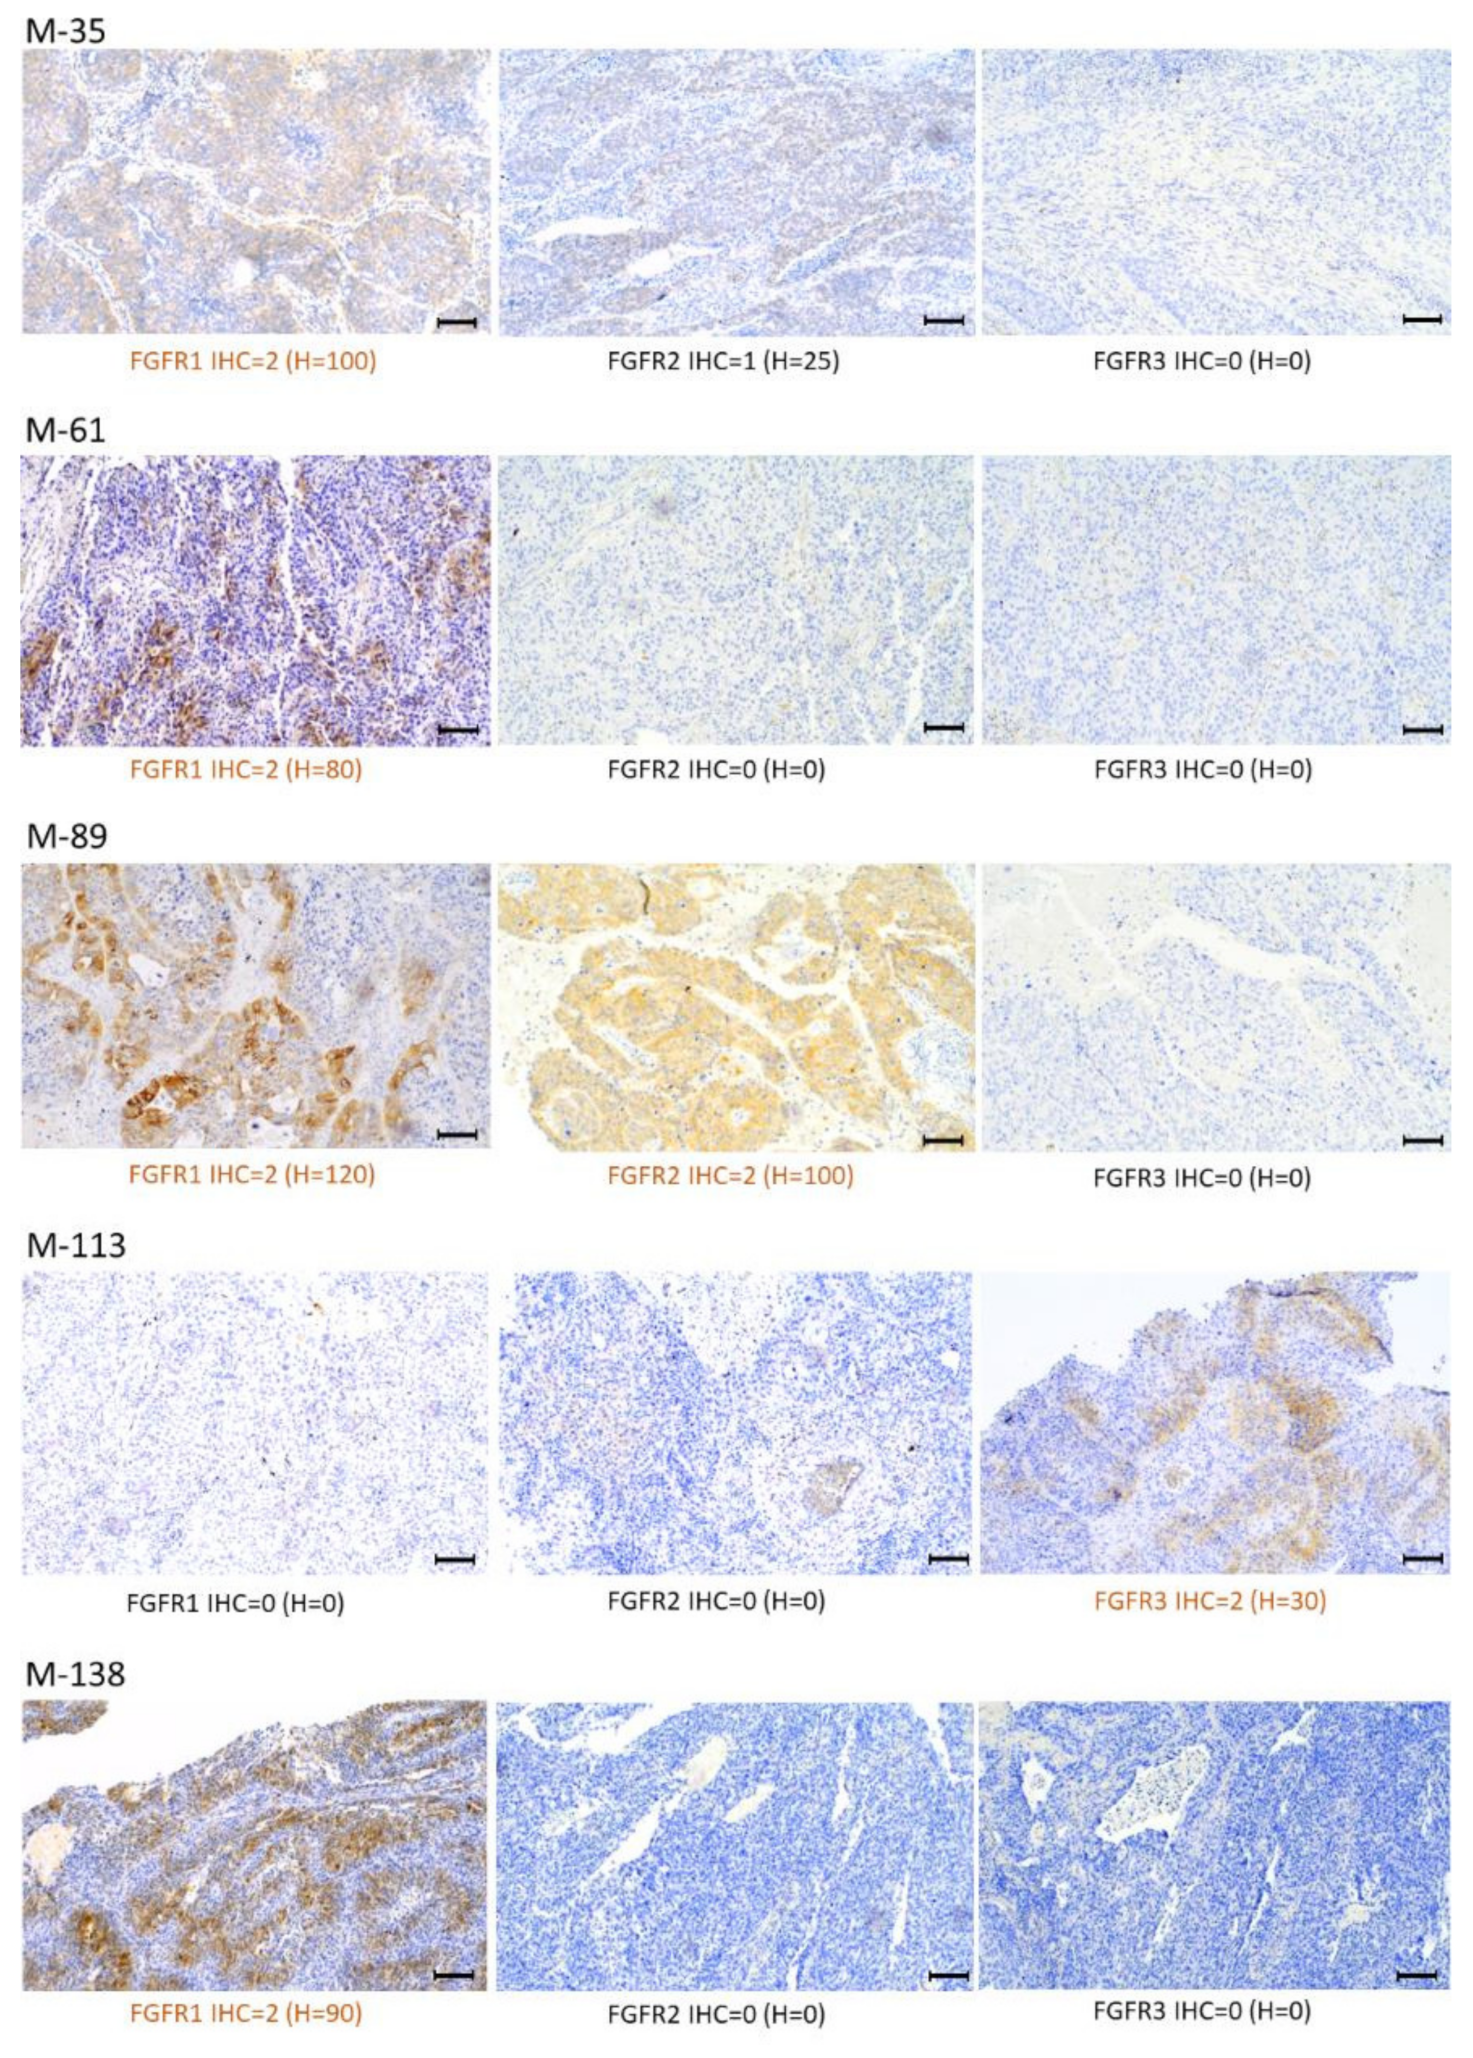
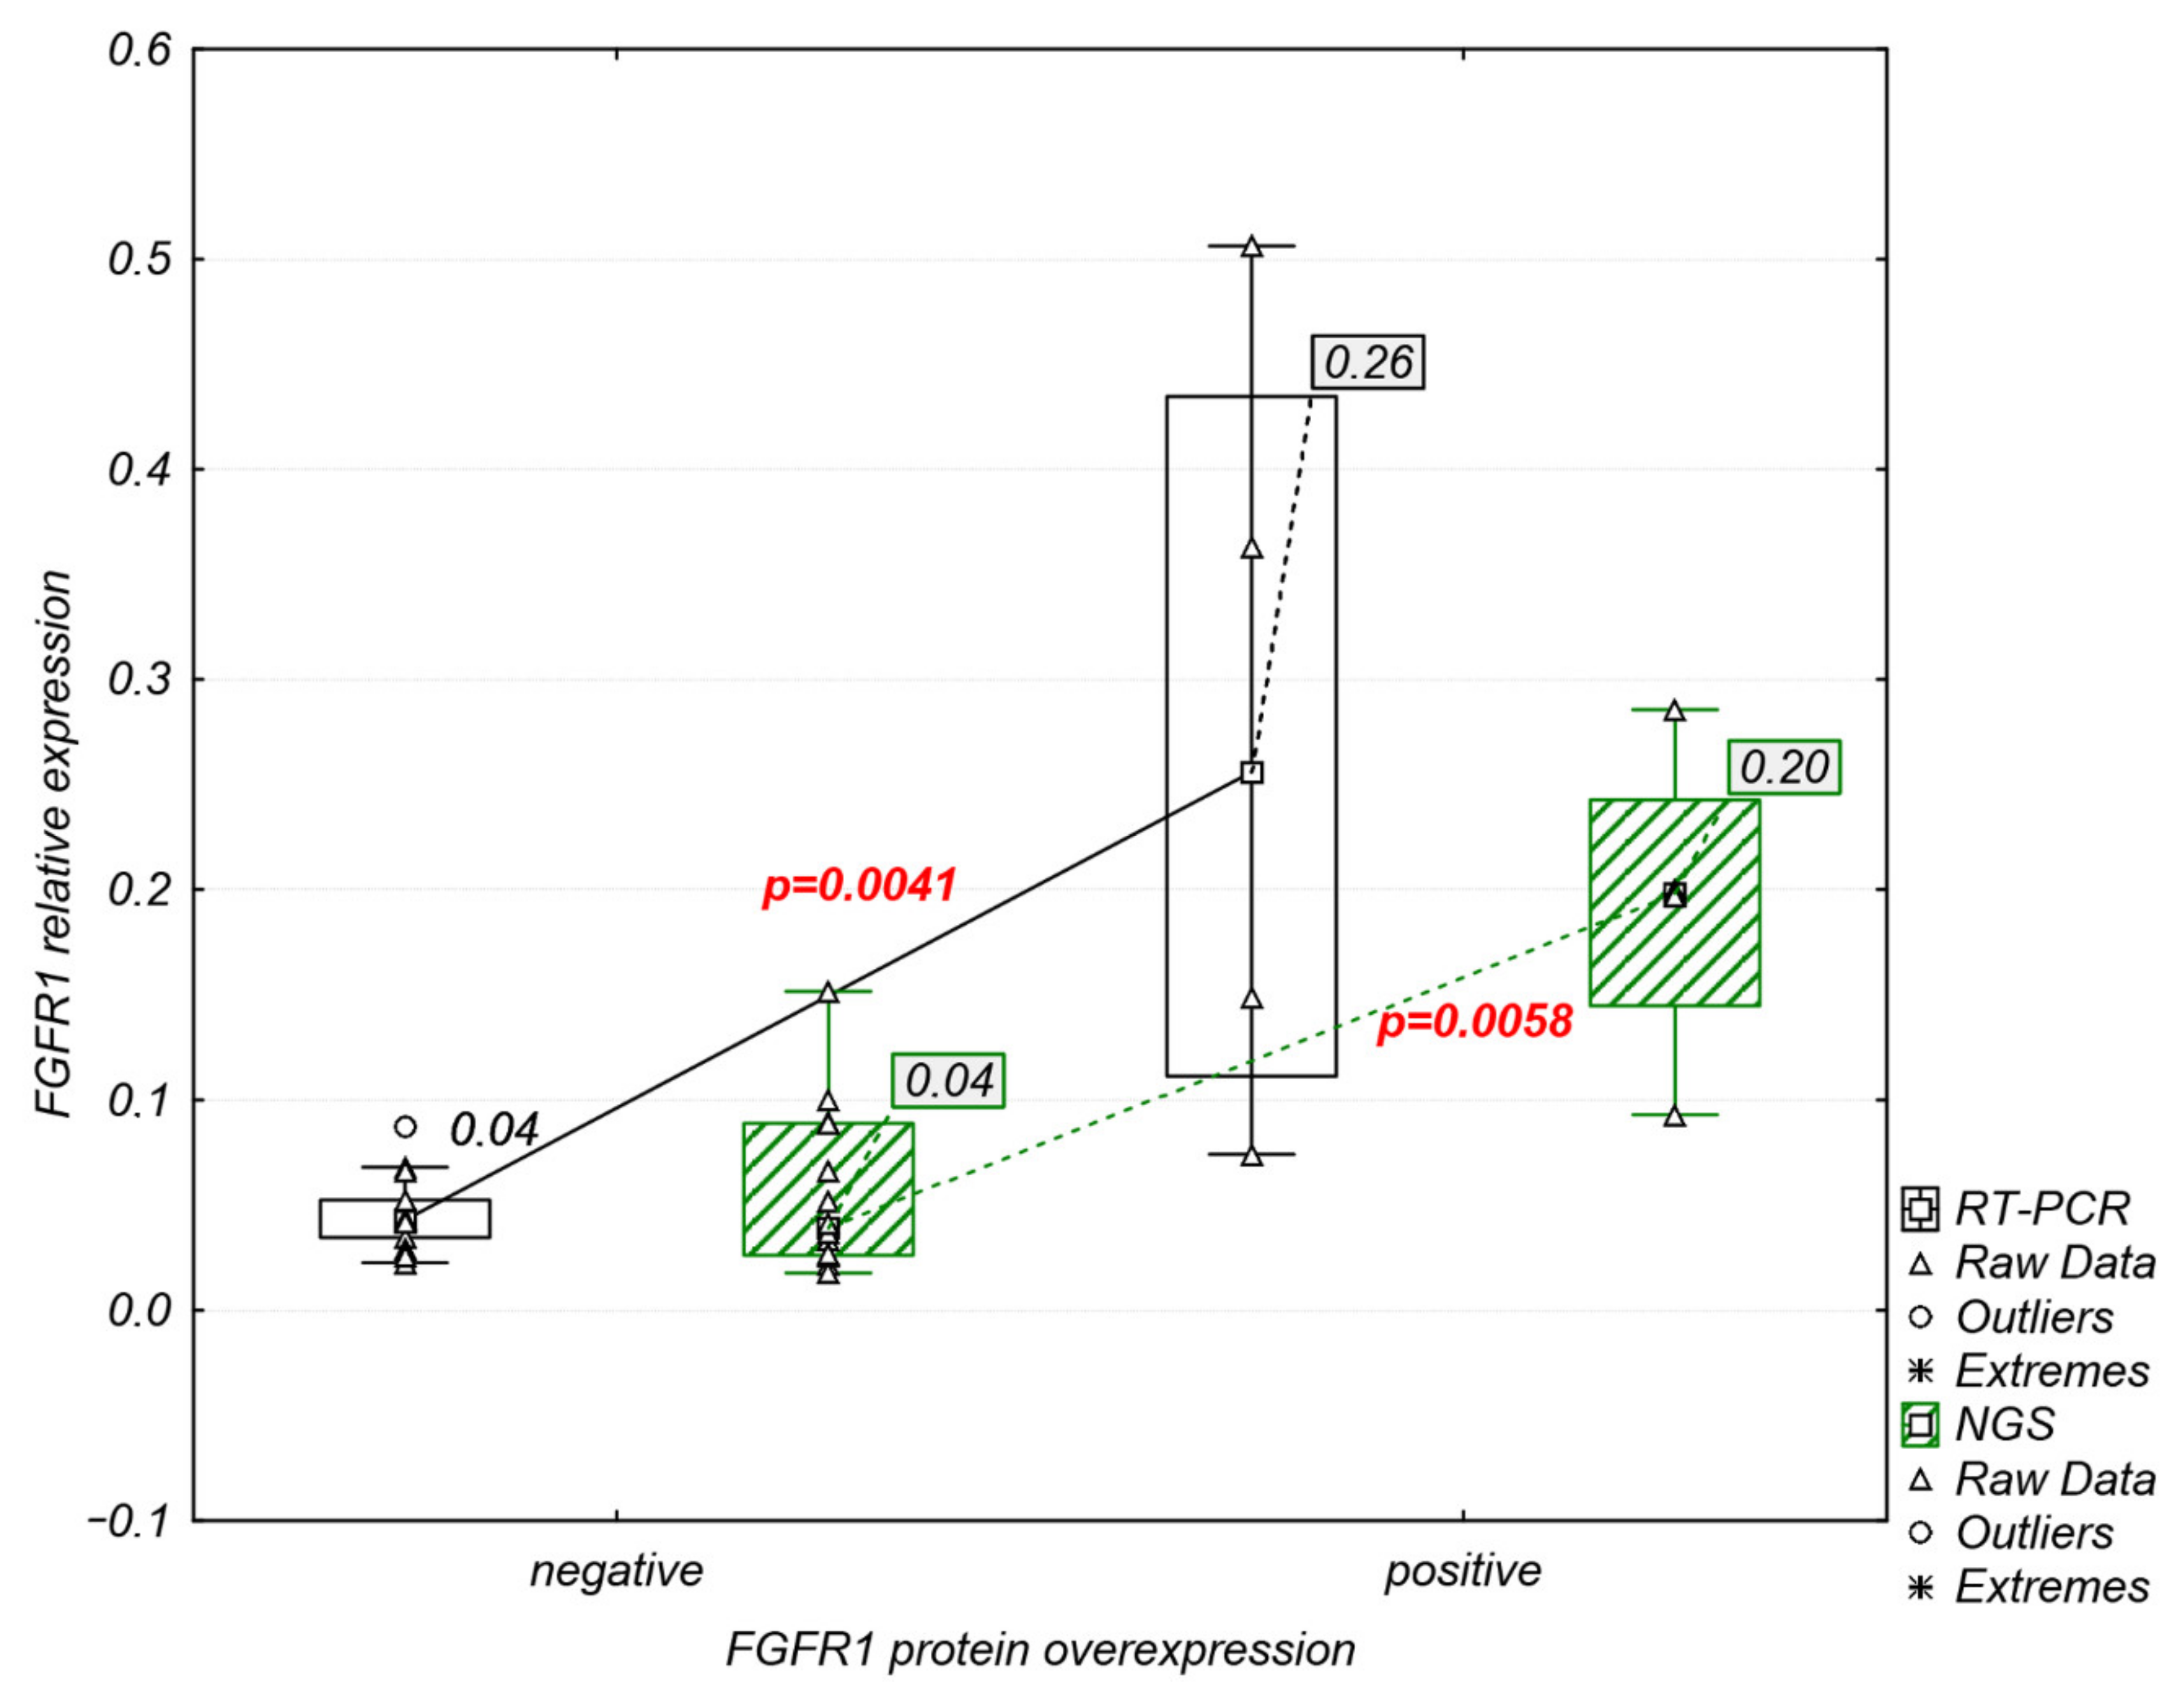
2.4. Analysis of FGFR1–3 Protein Overexpression and FGFR1 Amplification

FGFR1–3 protein overexpression was detected both in the cytoplasm and cell membrane in 5 of 18 (27.7%) tumor samples (Figure 5). FGFR1 overexpression was observed in four samples (M-35, M-61, M-89, and M-138), while one sample showed co-expression of FGFR1 and FGFR2 (M-89). FGFR3 protein overexpression was observed in one sample (M-113) (Figure 5). Comparative analysis of FGFRs mRNA and protein expression revealed that FGFR1 protein overexpression was significantly correlated with increased mRNA levels of FGFR1 (RT-PCR: r = 0.75, p = 0.0003; NGS: r = 0.67, p = 0.002) (Figure 6).
FGFR1 amplification was detected in 7 of 15 (46%) samples with available fluorescence in situ hybridization (FISH) results (Figure 7), while high FGFR1 amplification was observed in three samples (20%) (M-37, M-61, and M-89). In two samples (M-61 and M-89), concurrent FGFR1 amplification and protein was observed. Statistical analysis revealed no correlation between FGFR1 amplification and mRNA (RT-PCR: p = 0.58, NGS: p = 0.37) or protein (p = 0.47) expression levels.

2.5. Detection of FGFR Oncogenic Gene Fusions and Genetic Variants

2.5.1. Squamous Non-Small Lung Tumors

RNA analysis was performed for all 40 tumor and five tumor-adjacent normal samples. In the tumor group, two (5%) different (“strong” and “low confidence”) FGFR gene fusions were detected (Table 2). The first identified fusion was previously known as the FGFR3::TACC3 fusion (ex17::ex11) (M-20; Figure S3). Its exact breakpoint is indicated in the Archer Quiver database, and despite the low percent structural variation reads for GSP2 (5.49%) was categorized as “strong”. The second discovered fusion event was the TACC1::FGFR1 fusion (ex2::ex2) (M-61; Figure S4), which was categorized as “low confidence” because of the low percent of structural variation reads for GSP2 (4.66%). No fusion events were found in tumor-adjacent normal tissues (M-20P, M-33P, M-61P, M-135P, and M-138P).
FGFR variant analysis (based on the ClinVar database) revealed two pathogenic variants (5%), three variants of uncertain significance (7.5%), and one variant with no clinically significant information (2.5%) (Table 2). Pathogenic, missense variants of FGFR2 (c.870G>T), and FGFR3 (c.746C>G) were detected in two individual tumors (M-119 and M-115, respectively). Among the variants of uncertain significance, the missense FGFR1 (c.899T>C, p.(Ile300Thr)) and FGFR2 (c.2419G>A, p.(Glu807Lys)) gene variants were found in single tumors (M-88 and M-1, respectively), while the frameshift variant of FGFR2 (c.2398dup, p.(Ser800PhefsTer22)) was found in seven tumors and one tumor-adjacent normal tissue sample. The missense variant of FGFR2 (c.2211G>T, p.(Met737Ile)) with no clinical significance in the ClinVar database was detected in one tumor (M-6).
Correlations of described FGFRs genetic changes with FGFRs expression level in Sq-NSCLC revealed statistically significant but weak association of FGFR2 c.2398dup (p.(Ser800PhefsTer22)) variant with the increased FGFR2 mRNA expression level (p = 0.02, r = 0.36).

2.5.2. Commercial Controls

We detected 12 gene fusions and 2 oncogenic isoforms (100%) in the commercially available positive control (Seraseq) with the Archer FusionPlex Lung gene NGS panel (Table S1). Thirteen (92.85%) met all basic recommendations for “strong” fusion detection: number of start sites over 3, minimum of 5 unique breakpoint-spanning reads that support the gene fusion, and minimum of 10% of total reads for GSP2 over the wild-type transcript. The only remaining fusion, SLC45A3::BRAF, had 3.67% of reads supporting the fusion, below the default (10.0%) threshold. The negative control for EML4::ALK, CCDC6::RET, SLC34A2::ROS1, TPM3::NTRK1, and ETV6::NTRK3 fusions (Horizon) was identified as fusion-negative (100%) using the NGS panel.

3. Discussion

Our findings revealed significantly decreased FGFR1 and FGFR4 mRNA expression in tumor tissue compared with tumor-adjacent normal tissue. Meanwhile, expressions of both genes were enhanced in selected tumor samples, reaching values similar to surrounding normal tissue. FGFR2 and FGFR3 mRNA expression varied between tumor and tumor-adjacent normal tissues and were enhanced 2–10 times in several tumor samples. Accordingly, FGFR1 mRNA expression was lower in Sq-NCLC compared with normal tissues as per The Cancer Genome Atlas and Genotype-Tissue Expression data [19]. FGFR1 expression has recently been linked to the highly negative correlation between FGFR1 mRNA and methylation levels (average of three CpG sites: cg10823844, cg15791248, and cg27646230) in tumor samples [19]. In contrast to our results, Ren et al. [13] demonstrated that nearly 50% of tumors had an increase in FGFR1 mRNA expression compared with tumor-adjacent normal tissue; however, in their study, FGFR1 expression was normalized to GAPDH. Research has indicated that the choice of stable reference gene is crucial for accurate results in gene expression studies [20,21,22]. Our previous results assessing reference genes in Sq-NSCLC showed that GAPDH gene expression was diverse and unstable in tumor and tumor-adjacent normal tissue samples, whereas POLR2A and ACTB expression levels were the most stable among analyzed samples (Figure S5) [22].
To our knowledge, this study is the first to show significantly lower FGFR4 mRNA expression in Sq-NSCLC compared with normal lung tissue. Huang et al. [23] as the only one compared FGFR4 mRNA expression levels in lung tumors and adjacent normal tissues with results inconsistent with our results, i.e., the FGFR4 mRNA level was significantly higher in tumor tissues. Importantly, in that study [23], the detailed tumor histotype was not mentioned and GAPDH was used for normalization. Additionally, lower FGFR4 expression at the mRNA and protein levels was reported in lung tissues obtained from patients with idiopathic pulmonary fibrosis (IPF) compared with control patients. The authors indicated that the lower FGFR expression level was related to FGFR4 downregulation by pro-fibrotic factors (TGFβ, CTGF, and ET-1) [24]. Simultaneously, our work revealed enhanced FGFR4 mRNA levels in several samples. In vitro analysis of squamous lung cancer cell lines showed that FGFR4 overexpression leads to FGFR4 auto-activation and increased cell growth, clonogenicity, soft agar colony formation [25], and enhanced cell proliferation, whereas knockdown of FGFR4 can reduce proliferation [23]. Recent studies have indicated that FGFR4 deficiency might regulate the tumor immune microenvironment by activating the antigen presentation process and cellular immunity to the change in sensitivity to immune checkpoint inhibitor treatment in NSCLC [26].
In the present study, we revealed a significant association between increased FGFR4 expression and lymph node metastasis in Sq-NSCLC, but there was no significant association between FGFR1–4 mRNA expression and other clinicopathological features. A relationship between FGFR4 and lymph node metastasis has been implied. High FGFR4 protein overexpression has been correlated with lymph node metastasis in triple-negative breast cancers [27] and gastric cancer [28,29]. Earlier studies demonstrated that FGFR4 overexpression may be a result of gene amplification, especially in breast cancer tumors with high lymph node metastases, as well as in estrogen receptor- and progesterone receptor-positive tumors [30]. Additionally, the FGFR4 p.(Gly388Arg) variant, located in the transmembrane domain, has been correlated with poorer overall and progression-free survival in Sq-NSCLC patients with lymph node involvement [31]; this can be linked to increased FGFR4 stability and sustained activation, as has been shown in prostate cancer [32].
Herein, we present the novel finding that increased FGFR3 mRNA expression might be a negative prognostic marker in terms of the risk of recurrence of squamous cell lung cancer. Due to the relatively small number of patients analyzed, our results should be interpreted with caution. Nevertheless, mRNA levels of FGFR3 mRNA have been associated with worse DFS in oropharyngeal squamous cell carcinoma (p = 0.005) [33] and in non-muscle-invasive bladder cancer (HR 3.78, p < 0.001) [34]. The FGFR3 mRNA level is also a negative prognostic factor for lung adenocarcinoma [35] and squamous cell laryngeal cancer [36], where high FGFR3 expression was significantly correlated with shorter overall survival (OS). By contrast, high FGFR3 mRNA expression was associated with better progression-free survival in patients with primary pT1 bladder cancer (log-rank, p < 0.001) [37]. Our study did not reveal any clinical significance of FGFR1, 2, and 4 mRNA levels in terms of tumor relapse; however, the impact of FGFR1 mRNA level on squamous cell lung cancer patient survival remains controversial. For instance, elevated FGFR1 expression was reported as a negative factor that negatively impacted patient survival [38], while Wynes et al. [14] revealed no prognostic association with OS or DFS. OS is a widely used endpoint for assessing the prognostic value of studied variables. However, censoring patients at death or the date of last follow-up (for OS), especially in groups with a small number of observations, can lead to an overestimation of OS [39]. In the present study, only DFS (i.e., the time to cancer recurrence or death from any cause) was analyzed.
Additionally, the presented results show the usefulness of anchored multiplex PCR followed by NGS for FGFR1–3 gene expression analysis. The high correlation (77–95%) of FGFR expression obtained with the use of RT-PCR and an NGS panel was observed, despite the different sets of reference genes. In RT-PCR, POLR2A and ACTB were used to normalize expression, while the NGS panel contained CHMP2A, GPI, RAB7A, and VCP. Thus far, use of the relative gene expression data obtained with the applied NGS panel for genetic profiling has been described for acute myeloid leukemia [40], while it was previously limited to determining gene fusion occurrence [41,42].
Our study confirmed that FGFR1 protein overexpression is more frequent (6–9%) [19,43] than overexpression of FGFR2 and FGFR3 (3.4% and 6.6% [44]) in Sq-NSCLC. Moreover, in agreement with Rooney et al. [12] and Bogatyrova et al. [19], we confirmed the significant association between FGFR1 mRNA and protein overexpression. Remarkably, there was no significant correlation between FGFR1 mRNA/protein expression and gene amplification, likely due to the fact that only 31–50% of Sq-NSCLCs with an increased FGFR1 gene copy number overexpressed FGFR1 mRNA, while FGFR1 mRNA expression was absent in 25% of FGFR1-amplified tumors [4,14,45].
Considering that FGFR mutations and fusions are detected in Sq-NSCLC (reviewed in [7]), we performed targeted FGFR sequencing with the use of anchored multiplex PCR technology followed by NGS, which was previously shown to efficiently discover genomic aberrations, including novel fusions. We found one FGFR3::TACC3 fusion (2.5%), which is the most frequent somatic translocation in Sq-NSCLC (range: 0.6–5.3%) [44,46,47,48,49,50,51,52,53]. Interestingly, mRNA expression of FGFR3 was slightly increased (fold change = 1.5) compared with tumor-adjacent normal tissue in this sample. Nonetheless, previous reports have shown that this fusion event is not correlated with FGFR3 mRNA or protein overexpression in Sq-NSCLC [44], in contrast with glioblastomas [54]. Parker et al. [55] suggested that loss of the 3′ region of FGFR3 might abolish downregulation by miR-99a and lead to overexpression of the fusion gene. We also detected a new somatic fusion event, a combination of TACC1 and FGFR1. Truncated TACC1 was fused before the FGFR1 extracellular immunoglobulin-like domain (Ig). Because this fusion did not cause truncation of FGFR1, its effect remains unknown. Additionally, FGFR1 amplification together with mRNA and protein overexpression were observed in this tumor. Two pathogenic, missense variants of FGFR2 and FGFR3, c.870G>T (p.(Trp290Cys)) and c.746C>G (p.(Ser249Cys)), were also detected at a frequency of 5%, consistent with previously published results [8,10,56,57,58,59,60]. Both variants are located in the FGFR protein extracellular domain (Ig III) and induce constitutive dimerization and receptor activation via modest dimer stabilization in the absence of ligand [61]. Among variants of uncertain significance (based on the ClinVar database), we identified the FGFR1 (c.899T>C, p.(Ile300Thr)) and FGFR2 (c.2419G>A, p.(Glu807Lys)) missense variants and one FGFR2 frameshift (1 bp duplication) variant (c.2398dup, p.(Ser800PhefsTer22)). To our knowledge, this is the first detection of these variants in Sq-NSCLC. The FGFR1 (c.899T>C) missense variant was previously reported in craniosynostosis by Wilkie et al. [62] and nonsyndromic trigonocephaly by Kress et al. [63]. This variant results in amino acid substitution p.(Ile300Thr) located in the extracellular domain (Ig III). However, based on in silico analysis (UniProt) available via the VarSome database, it is unclear whether this variant causes a pathogenic or benign effect on the protein. Clinical significance scoring (based on the American College of Medical Genetics (ACMG) guidelines for the interpretation of sequence variants [64]) showed that it is likely a benign variant. The FGFR2 (c.2419G>A) variant results in an amino acid substitution at the end of the cytoplasmic domain of FGFR2 (p.(Glu807Lys)), aside from the kinase domain. Localization of this variant indicates a weak clinical relevance, confirmed by VarSome database scoring, suggesting a benign clinical significance. Until now, occurrence of this variant has been associated with Apert syndrome (acrocephalo-syndactyly type 1) in the ClinVar database. No further information or publications are available. The last detected variant of uncertain significance, FGFR2 (c.2398dup), results in a premature translational stop codon in the FGFR2 gene (p.(Ser800Phefs*22)). CMG classification in the VarSome database indicates a pathogenic clinical significance. Our results showed slightly association with increased FGFR2 mRNA expression level, but without protein overexpression what may arise from the issue that the frameshift is located at the end of the cytoplasmic domain of the FGFR2 protein, next to the kinase domain, and results in disruption of the last 23 amino acids of the FGFR2 protein. Therefore, its clinical relevance may be weak. This variant was also detected in tumor-adjacent normal tissue, indicating germline origin. It has not been reported previously in the literature (with the exception of the ClinVar database where it was linked with craniosynostosis), which might be a result of its low allelic frequency (~2.5%). We also report a new, single-nucleotide variant of the FGFR2 gene (c.2211G>T), which causes a missense amino acid change p.(Met737Ile) at the end of the kinase domain. ACMG classification in the VarSome database indicates a likely pathogenic effect; there is no available information on its functional and clinical significance.
Finally, presented results revealed FGFR overexpression, variants, and fusions considered as potential biomarkers of the response to FGFRi treatment. For instance, enhanced FGFR1–3 mRNA expression levels represent promising FGFRi biomarkers since 5.6% of patients treated with rogaratinib (NCT03762122) achieved partial response and 64% had stable disease [65]. Interestingly, the FGFR3::TACC3 fusion is considered an FGFRi predictive biomarker in gliomas (NCT02824133, NCT04424966) and cholangiocarcinoma (NCT03773302) [66]. However, in Sq-NSCLC, few clinical studies, and a scarcity of available data, mostly from individual Sq-NSCLC cases [9,67], indicate the need for further research in this field. Clinical studies with AZD4547 (SWOG S1400D, NCT02965378, NCT00979134) revealed Sq-NSCLC patients with FGFR3 p.(Ser249Cys) who achieved partial response (1.5 months with ~32% tumor shrinkage) [9] or stable disease (2.6-month progression-free survival and 12% tumor shrinkage) [10], while no significant benefit of AZD4547 [9] or BGJ398 (NCT01004224) [8] was shown in two other patients (2–4% tumor size decrease). Our results also identify FGFR1 and FGFR2 variants not previously described in Sq-NSCLC; the predictive power of these variants for FGFRi treatment will require further investigation.

4. Materials and Methods

4.1. Patient and Tumor Selection

This study included patients with a lung cancer diagnosis (n = 63) (Sq-NSCLC (n = 56) and adenosquamous carcinoma (n = 7)) who underwent a surgical procedure at the National Institute of Tuberculosis and Lung Diseases and for whom cancer-tissue samples (formalin-fixed, paraffin-embedded (FFPE)) were obtained during the intraoperative procedure performed for diagnostic purposes. Tumor tissue samples, together with corresponding tumor-adjacent normal tissue (taken from the surgical resection margin at least 5 cm from the tumor), were snap-frozen in liquid nitrogen followed by storage at −80 °C until further analysis (“fresh-frozen” tissue samples). Cryostat sections were stained with hematoxylin and eosin and evaluated by a pathologist for cancer cell content, stromal cell contamination, and necrosis. Only tumor samples from 46 patients containing greater than 50% cancer cells and tumor-adjacent normal tissue samples without any cancer cells were selected.
Finally, the study group consisted of 40 cancer patients for whom a sufficient amount of RNA was available. All tumors were uniformly reviewed and classified histologically according to the World Health Organization guidelines [68]. Clinical stage was determined with the use of the TNM Classification of Malignant Tumors (8th edition) [69]. Clinicopathological characteristics are presented in Table 1.

4.2. RNA Control Material for NGS

Two commercially available reference samples for fusion detection, positive control-Seraseq® FFPE Tumor Fusion RNA Reference Material v2 (SeraCare, Milford, MA, USA) and negative control-5 Fusion Multiplex RNA Negative Control (Horizon Discovery, Waterbeach, UK), were used. The Seraseq material contained 12 significant RNA fusions and two oncogenic isoforms that could be detected with the Lung FusionPlex panel (Table S1). The Horizon material was negative for five common gene fusions (EML4::ALK, CCDC6::RET, SLC34A2::ROS1, TPM3::NTRK1, and ETV6::NTRK3).

4.3. RNA Extraction and cDNA Synthesis

Total RNA was extracted from fresh-frozen tissues with the use of RNeasy Plus Mini Kit (Qiagen, Hilden, Germany) according to the manufacturer’s instructions. gDNA Eliminator columns allowed for the elimination of genomic DNA while avoiding RNA damage during DNase digestion. RNA quantity (260/280 ratio) was measured with the use of a NanoDrop UV spectrophotometer (ThermoFisher, Waltham, MA, USA) and Quantus fluorometer (Promega, Madison, WI, USA). Additionally, RNA quality was assessed by RNA electrophoresis with the 2100 Bioanalyzer System (Agilent, Santa Clara, CA, USA). The RNA integrity number ranged from 4.4 to 9.8 with a median value of 8.8. One microgram of total RNA was transcribed to cDNA using the High-Capacity cDNA Reverse Transcription Kit (ThermoFisher) with random primers according to the manufacturer’s instructions.

4.4. Real-Time Polymerase Chain Reactions (RT-PCR)

RT-PCR was run in triplicate using the TaqMan Universal PCR Master Mix with AmpErase™ Uracil N-Glycosylase (ThermoFisher) and approximately 10 ng of total RNA from 40 tumors and 20 corresponding tumor-adjacent normal tissue samples reverse transcribed to cDNA. Quantitative RT-PCR was run on the 7500 Fast Real-Time PCR System (Applied Biosystems, Waltham, MA, USA) with the use of the FAM- and VIC-labeled TaqMan Gene Expression Assays (ThermoFisher) for FGFR1 (Hs00241111_m1), FGFR2 (Hs01552918_m1), FGFR3 (Hs00179829_m1), FGFR4 (Hs00242558_m1), POLR2A (Hs00172187_m1), and ACTB (Hs99999903_m1). The RT-PCR results were averaged and FGFR1–4 gene expression levels were normalized to the reference genes ACTB and POLR2A (Figure S5) [22]. Gene expression was analyzed with the use of a relative quantification method. For the 20 patients with both tumor and corresponding tumor-adjacent normal tissue samples available, data were expressed as a fold-change in expression between tumor and normal samples (−2−ΔΔCt method).

4.5. Next-Generation Sequencing (NGS)

RNA from tumor tissue and tumor-adjacent normal tissue was sequenced and screened for gene fusions, variants, and expression of 14 genes of interest (ALK, BRAF, EGFR, FGFR1–3, KRAS, MET, NRG1, NTRK1–3, RET, and ROS1) using the FusionPlex Lung kit (Archer Dx, Boulder, CO, USA). Briefly, RNA (68–250 ng) was transcribed to cDNA using random priming. Next, cDNA quality was checked with the PreSeq RNA QC Assay (Archer Dx). Only cDNA with PreSeq result CP < 28 was used for DNA library construction according to the manufacturer’s instructions. Subsequently, concentration and quality of obtained libraries were determined using the KAPA Universal Library Quantification Kit (Roche Diagnostics, Basel, Switzerland). Next, libraries were normalized, multiplexed, and sequenced using the MiSeq Reagent Kit, v3 (600 cycles) (Illumina, San Diego, CA, USA) on the MiSeq platform. Samples were sequenced in four runs with average quality parameters: QC30 of 85.4% and cluster density of 1324 k/mm2. The Illumina MiSeq sequencer generated paired-end sequence reads with an average of 1.15 million (range: 0.38–3.5) reads per sample (detailed sample statistics are shown in Table S2). NGS results were analyzed in Archer Analysis software v6.2 (Archer Dx), which aligns sequencing data against the human genome (version hg19) with the use of BWA (Burrows-Wheeler Alignment Tool) and Bowtie 2 (an ultrafast, memory-efficient short read aligner) for mapping. For the quality check (QC metric), four control genes (CHMP2A (charged multivesicular body protein 2A), GPI (glucose-6-phosphate isomerase), RAB7A (RAB7A, member RAS oncogene family), and VCP (valosin containing protein)) served as reliable indicators of overall RNA quality and content in the sample. A QC metric of at least 10 was required to support the targets of the assay. The median QC metric of analyzed samples was 503.88 (range: 242.5–607.4).
Gene fusions were called with the following detection limits: total number of supportive reads spanning the fusion junction ≥ 5; number of unique start sites for the fusion sequence specific primer ≥ 3; and percent of supporting reads at breakpoint supporting fusion ≥ 10%. Analysis of a control sample (described below) revealed that the percent of reads at breakpoint supporting fusion could be lowered to 3.6%. Results of the fusion annotation were split into two categories: “strong confidence” fusion and oncogenic isoform candidates and “low confidence” fusion candidates.
Gene variants were called and listed when the altered allele frequency was ≥5%, altered allele count was ≥10%, and read depth was ≥100 reads. Additionally, detected variants with an allele frequency above 2% with a minimum sequencing depth of ≥100 reads and a minimum variant depth of 10% were kept and listed if they were found in ClinVar or COSMIC databases, or had a deleterious impact on the protein. All detected variants were reviewed manually with the use of Archer Analysis software.
The relative gene expression level was assessed based on the ratio of averaged unique RNA reads originating from all GSP2 primers across the targeted and housekeeping genes (CHMP2A, GPI, RAB7A, and VCP) with Archer Analysis software.

4.6. Immunohistochemistry (IHC)

FGFR1, FGFR2, and FGFR3 protein expression levels were determined in 18 tumors (FFPE tissue samples). Immunohistochemistry (IHC) was performed according to the manufacturer’s instructions. Slides were stained with the Dako Omnis immunostainer and Dako EnVision Flex + reagents (Dako Omnis, Dako Agilent Technologies, Leuven, Belgium). Tissues were incubated with the following primary antibodies: anti-FGFR1 (clone D8E4, Cell Signaling Technology, Danvers, MA, USA), anti-FGFR2 (ab10647, Abcam, Cambridge, UK), and anti-FGFR3 (clone B-9; Santa Cruz Biotechnology, Santa Cruz, CA, USA) as previously described [70,71,72]. The IHC slides were counterstained with hematoxylin and coverslips were applied. Staining intensity was categorized based on a four-level scale: negative (0), weak (1), moderate (2), and strong (3). Overexpression was defined as follows: FGFR1—moderate (2) or strong (3) intensity membrane and/or cytoplasmic staining in ≥ 10% tumor cancer cells previously described by Theelen et al. [44]; FGFR2—moderate (2) or strong (3) complete membrane staining intensity in ≥ 10% tumor cancer cells evaluated according to the HercepTest scoring guideline [73]; FGFR3—at least weak but extensive positivity (2) or strong positivity (regardless of extent) (3), as previously described by Tomlinson et al. [74]. Continuous variables were used according to the following formula: H-score = 0 x (% cells with no staining [0]) + 1 x (% cells staining faint, weakly [1+]) + 2 x (% cells staining moderately [2+]) + 3 x (% cells staining strongly [3+]).

4.7. Fluorescence In Situ Hybridization (FISH)

FGFR1 gene amplification using FISH was determined in 18 FFPE tumor samples using in a ZytoLight SPEC FGFR1/CEN 8 Dual Color Probe (containing probes specific for the 8p11 locus and the chromosome 8 centromere (CEN8)) (ZytoVision, Bremerhaven, Germany) and ZytoLight FISH-Tissue Implementation Kit (ZytoVision) according to the manufacturer’s instructions. Briefly, after pre-treatment, the slides were denatured in the presence of 10 μL of probe for 10 min at 76 °C and hybridized at 37 °C overnight. Sixty tumor cell nuclei were assessed by two independent observers. The criteria of FGFR1 amplification were as follows: FGFR1/CEN8 ≥ 2.0 or the average number of FGFR1 signals per cell ≥6 or ≥10% of tumor cells containing ≥ 15 FGFR1 signals or large clusters [75].

4.8. Statistical Analysis

Comparison of the FGFR1, FGFR2, FGFR3, and FGFR4 gene expression between tumor and tumor-adjacent tissues was performed with the Mann–Whitney U test. Associations between FGFR1, FGFR2, FGFR3, and FGFR4 gene expression and clinicopathological data (Table 1), FGFR1–3 protein expression, and FGFR1 amplification were analyzed with the Kruskal–Wallis test. To estimate the association between FGFR mRNA expression level and clinical endpoint (DFS), univariate Cox proportional hazards model, the Kaplan–Meier method and log-rank test were used. Statistical calculation of correlation and strength of the relationship between mRNA expression levels from RT-PCR and NGS and FGFR protein expression were performed using Spearman’s rank correlation coefficient. mRNA expression was analyzed as a continuous variable and as a categorical variable for Kaplan–Meier analysis (the median value of expression for the entire group was used as a cut-off point).
A p-value < 0.05 was considered significant. All calculations were performed using Statistica software (StatSoft, Tulsa, OK, USA).

5. Conclusions

FGFR1 and FGFR4 mRNA levels are significantly decreased in Sq-NSCLC tissue compared with tumor-adjacent normal tissue. Furthermore, our study shows that the increased tumor mRNA expression of FGFR3 is an unfavorable prognostic factor in terms of the risk of recurrence for Sq-NSCLC patients and the increased FGFR4 mRNA level is correlated with lymph node metastasis occurrence. We also confirm the association of increased FGFR1 mRNA with protein overexpression but not with FGFR1 amplification. Moreover, NGS revealed new and well-known FGFR variants and fusions.
FGFR mRNA and protein expression analysis in tumor and tumor-adjacent normal tissues, along with the identification of fusions and variants and investigation of amplification status, have increased our knowledge of the molecular background of Sq-NSCLC. Our data also show that the use of different methods increases the detection of FGFR aberrations, which may aid in the selection of patients most likely to respond to treatment with FGFRis.

Supplementary Materials

The supporting information can be downloaded at: https://www.mdpi.com/article/10.3390/ijms231810506/s1.

Author Contributions

Conceptualization, J.M.-S. and J.C.-W.; investigation, J.M.-S., M.S., U.L., E.S.-W., P.S., A.R., A.S. (Aneta Stepniewska); clinical material collection and description (resources), P.R., T.O., E.S.-W., R.L.; writing—original draft preparation, J.M.-S.; writing—review and editing, J.M.-S., U.L., M.S., D.P., J.C.-W.; funding acquisition, A.S. (Aleksandra Stanczak), D.P., J.C.-W., M.W. All authors have read and agreed to the published version of the manuscript.

Funding

This research was funded by the National Center of Research and Development and pharmaceutical company Celon Pharma S.A., under project “CELONKO” (STRATEGMED2/266776/17/NCBR/2015).

Institutional Review Board Statement

The study was conducted in accordance with the Declaration of Helsinki, and approved by the Ethics Committee of National Institute of Tuberculosis and Lung Diseases (KB 8/2014).

Informed Consent Statement

The institutional review board approved this study. No additional patient informed consent that was specific to this study was required given its retrospective nature.

Data Availability Statement

Not applicable.

Acknowledgments

The authors would like to thank Krystyna Sierota for excellent technical assistance.

Conflicts of Interest

The funders had no role in the design of the study; in the collection, analyses, or interpretation of data; in the writing of the manuscript; or in the decision to publish the results.

References

  1. Ferlay, J.; Colombet, M.; Soerjomataram, I.; Parkin, D.M.; Piñeros, M.; Znaor, A.; Bray, F. Cancer Statistics for the Year 2020: An Overview. Int. J. Cancer 2021, 149, 778–789. [Google Scholar] [CrossRef] [PubMed]
  2. Reck, M.; Remon, J.; Hellmann, M.D. First-Line Immunotherapy for Non-Small-Cell Lung Cancer. J. Clin. Oncol. 2022, 40, 586–597. [Google Scholar] [CrossRef] [PubMed]
  3. Reck, M.; Rodríguez-Abreu, D.; Robinson, A.G.; Hui, R.; Csőszi, T.; Fülöp, A.; Gottfried, M.; Peled, N.; Tafreshi, A.; Cuffe, S.; et al. Pembrolizumab versus Chemotherapy for PD-L1–Positive Non–Small-Cell Lung Cancer. N. Engl. J. Med. 2016, 375, 1823–1833. [Google Scholar] [CrossRef]
  4. Cancer Genome Atlas Research Network Comprehensive Genomic Characterization of Squamous Cell Lung Cancers. Nature 2012, 489, 519–525. [CrossRef]
  5. Babina, I.S.; Turner, N.C. Advances and Challenges in Targeting FGFR Signalling in Cancer. Nat. Rev. Cancer 2017, 17, 318–332. [Google Scholar] [CrossRef]
  6. Hashemi-Sadraei, N.; Hanna, N. Targeting FGFR in Squamous Cell Carcinoma of the Lung. Target. Oncol. 2017, 12, 741–755. [Google Scholar] [CrossRef]
  7. Moes-Sosnowska, J.; Chorostowska-Wynimko, J. Fibroblast Growth Factor Receptor 1-4 Genetic Aberrations as Clinically Relevant Biomarkers in Squamous Cell Lung Cancer. Front. Oncol. 2022, 12, 780650. [Google Scholar] [CrossRef] [PubMed]
  8. Nogova, L.; Sequist, L.V.; Perez Garcia, J.M.; Andre, F.; Delord, J.-P.; Hidalgo, M.; Schellens, J.H.M.; Cassier, P.A.; Camidge, D.R.; Schuler, M.; et al. Evaluation of BGJ398, a Fibroblast Growth Factor Receptor 1-3 Kinase Inhibitor, in Patients with Advanced Solid Tumors Harboring Genetic Alterations in Fibroblast Growth Factor Receptors: Results of a Global Phase I, Dose-Escalation and Dose-Expansion Study. J. Clin. Oncol. 2017, 35, 157–165. [Google Scholar] [CrossRef]
  9. Aggarwal, C.; Redman, M.W.; Lara, P.N., Jr.; Borghaei, H.; Hoffman, P.; Bradley, J.D.; Newman, A.J., III; Feldman, M.J.; Minichiello, K.; Miao, J.; et al. SWOG S1400D (NCT02965378), a Phase II Study of the Fibroblast Growth Factor Receptor Inhibitor AZD4547 in Previously Treated Patients with Fibroblast Growth Factor Pathway-Activated Stage IV Squamous Cell Lung Cancer (Lung-MAP Substudy). J. Thorac. Oncol. 2019, 14, 1847–1852. [Google Scholar] [CrossRef]
  10. Paik, P.K.; Shen, R.; Berger, M.F.; Ferry, D.; Soria, J.-C.; Mathewson, A.; Rooney, C.; Smith, N.R.; Cullberg, M.; Kilgour, E.; et al. A Phase Ib Open-Label Multicenter Study of AZD4547 in Patients with Advanced Squamous Cell Lung Cancers. Clin. Cancer Res. 2017, 23, 5366–5373. [Google Scholar] [CrossRef] [PubMed] [Green Version]
  11. Andre, F.; Ranson, M.; Dean, E.; Varga, A.; van der Noll, R.; Stockman, P.K.; Ghiorghiu, D.; Kilgour, E.; Smith, P.D.; Macpherson, M.; et al. Abstract LB-145: Results of a Phase I Study of AZD4547, an Inhibitor of Fibroblast Growth Factor Receptor (FGFR), in Patients with Advanced Solid Tumors. Cancer Res. 2013, 73, LB-145. [Google Scholar] [CrossRef]
  12. Rooney, C.; Geh, C.; Williams, V.; Heuckmann, J.M.; Menon, R.; Schneider, P.; Al-Kadhimi, K.; Dymond, M.; Smith, N.R.; Baker, D.; et al. Characterization of FGFR1 Locus in SqNSCLC Reveals a Broad and Heterogeneous Amplicon. PLoS ONE 2016, 11, e0149628. [Google Scholar] [CrossRef]
  13. Ren, M.; Hong, M.; Liu, G.; Wang, H.; Patel, V.; Biddinger, P.; Silva, J.; Cowell, J.; Hao, Z. Novel FGFR Inhibitor Ponatinib Suppresses the Growth of Non-Small Cell Lung Cancer Cells Overexpressing FGFR1. Oncol. Rep. 2013, 29, 2181–2190. [Google Scholar] [CrossRef] [PubMed]
  14. Wynes, M.W.; Hinz, T.K.; Gao, D.; Martini, M.; Marek, L.A.; Ware, K.E.; Edwards, M.G.; Böhm, D.; Perner, S.; Helfrich, B.A.; et al. FGFR1 MRNA and Protein Expression, Not Gene Copy Number, Predict FGFR TKI Sensitivity across All Lung Cancer Histologies. Clin. Cancer Res. 2014, 20, 3299–3309. [Google Scholar] [CrossRef] [PubMed]
  15. Grünewald, S.; Politz, O.; Bender, S.; Héroult, M.; Lustig, K.; Thuss, U.; Kneip, C.; Kopitz, C.; Zopf, D.; Collin, M.-P.; et al. Rogaratinib: A Potent and Selective Pan-FGFR Inhibitor with Broad Antitumor Activity in FGFR-Overexpressing Preclinical Cancer Models. Int. J. Cancer 2019, 145, 1346–1357. [Google Scholar] [CrossRef]
  16. Addeo, A.; Joerger, M.; Rothschild, S.; Eboulet, E.I.; Godar, G.; Waibel-Pachinger, C.; Haefliger, S.; Mark, M.T.; Fernandez, E.; Mach, N.; et al. Fibroblast Growth Factor Receptor (FGFR) Inhibitor Rogaratinib in Patients with Advanced Pretreated Squamous-Cell Non-Small Cell Lung Cancer over-Expressing FGFR MRNA: The SAKK 19/18 Phase II Study. J. Clin. Oncol. 2021, 39, e21119. [Google Scholar] [CrossRef]
  17. Ng, T.L.; Yu, H.; Smith, D.E.; Boyle, T.A.; York, E.R.; Leedy, S.; Gao, D.; Aisner, D.L.; Van Bokhoven, A.; Heasley, L.E.; et al. Preselection of Lung Cancer Cases Using FGFR1 MRNA and Gene Copy Number for Treatment with Ponatinib. Clin. Lung Cancer 2019, 20, e39–e51. [Google Scholar] [CrossRef]
  18. Ornitz, D.M.; Itoh, N. The Fibroblast Growth Factor Signaling Pathway. Wiley Interdiscip. Rev. Dev. Biol. 2015, 4, 215–266. [Google Scholar] [CrossRef]
  19. Bogatyrova, O.; Mattsson, J.S.M.; Ross, E.M.; Sanderson, M.P.; Backman, M.; Botling, J.; Brunnström, H.; Kurppa, P.; La Fleur, L.; Strell, C.; et al. FGFR1 Overexpression in Non-Small Cell Lung Cancer Is Mediated by Genetic and Epigenetic Mechanisms and Is a Determinant of FGFR1 Inhibitor Response. Eur. J. Cancer 2021, 151, 136–149. [Google Scholar] [CrossRef]
  20. Gresner, P.; Gromadzinska, J.; Wasowicz, W. Reference Genes for Gene Expression Studies on Non-Small Cell Lung Cancer. Acta Biochim. Pol. 2009, 56, 307–316. [Google Scholar] [CrossRef]
  21. Smith, T.A.D.; AbdelKarem, O.A.; Irlam-Jones, J.J.; Lane, B.; Valentine, H.; Bibby, B.A.S.; Denley, H.; Choudhury, A.; West, C.M.L. Selection of Endogenous Control Genes for Normalising Gene Expression Data Derived from Formalin-Fixed Paraffin-Embedded Tumour Tissue. Sci. Rep. 2020, 10, 17258. [Google Scholar] [CrossRef] [PubMed]
  22. Moes-Sosnowska, J.; Szczepulska-Wojcik, E.; Rozy, A.; Rudzinski, S.; Langfort, R.; Rudzinski, P.; Orlowski, T.; Chorostowska-Wynimko, J. FGFR1–4 and MET Expression Analysis and Evaluation of Reliable Reference Genes in Sq-NSCLC. Eur. Respir. J. 2019, 54, PA3665. [Google Scholar] [CrossRef]
  23. Huang, H.-P.; Feng, H.; Qiao, H.-B.; Ren, Z.-X.; Zhu, G.-D. The Prognostic Significance of Fibroblast Growth Factor Receptor 4 in Non-Small-Cell Lung Cancer. Onco. Targets. Ther. 2015, 8, 1157–1164. [Google Scholar] [CrossRef] [PubMed]
  24. Justet, A.; Ghanem, M.; Jaillet, M.; Hachem, M.; Boghanim, T.; Vadel, A.; Mailleux, A.; Crestani, B. FGFR4 Has pro Fibrotic Properties in Idiopathic Pulmonary Fibrosis. Eur. Respir. J. 2020, 56, 3359. [Google Scholar] [CrossRef]
  25. Quintanal-Villalonga, Á.; Ferrer, I.; Guruceaga, E.; Cirauqui, C.; Marrugal, Á.; Ojeda, L.; García, S.; Zugazagoitia, J.; Muñoz-Galván, S.; Lopez-Rios, F.; et al. FGFR1 and FGFR4 Oncogenicity Depends on N-Cadherin and Their Co-Expression May Predict FGFR-Targeted Therapy Efficacy. EBioMedicine 2020, 53, 102683. [Google Scholar] [CrossRef]
  26. Wang, L.; Ren, Z.; Yu, B.; Tang, J. Development of Nomogram Based on Immune-Related Gene FGFR4 for Advanced Non-Small Cell Lung Cancer Patients with Sensitivity to Immune Checkpoint Inhibitors. J. Transl. Med. 2021, 19, 22. [Google Scholar] [CrossRef]
  27. Wei, W.; Cao, S.; Liu, J.; Wang, Y.; Song, Q.; Leha, A.; Sun, S.; Zhang, X.; Liang, X.; Jiang, Y. Fibroblast Growth Factor Receptor 4 as a Prognostic Indicator in Triple-Negative Breast Cancer. Transl. Cancer Res. 2020, 9, 6881–6888. [Google Scholar] [CrossRef]
  28. Inokuchi, M.; Murase, H.; Otsuki, S.; Kawano, T.; Kojima, K. Different Clinical Significance of FGFR1–4 Expression between Diffuse-Type and Intestinal-Type Gastric Cancer. World J. Surg. Oncol. 2017, 15, 2. [Google Scholar] [CrossRef]
  29. Murase, H.; Inokuchi, M.; Takagi, Y.; Kato, K.; Kojima, K.; Sugihara, K. Prognostic Significance of the Co-Overexpression of Fibroblast Growth Factor Receptors 1, 2 and 4 in Gastric Cancer. Mol. Clin. Oncol. 2014, 2, 509–517. [Google Scholar] [CrossRef]
  30. Jaakkola, S.; Salmikangas, P.; Nylund, S.; Partanen, J.; Armstrong, E.; Pyrhönen, S.; Lehtovirta, P.; Nevanlinna, H. Amplification of Fgfr4 Gene in Human Breast and Gynecological Cancers. Int. J. Cancer 1993, 54, 378–382. [Google Scholar] [CrossRef]
  31. Quintanal-Villalonga, Á.; Carranza-Carranza, A.; Meléndez, R.; Ferrer, I.; Molina-Pinelo, S.; Paz-Ares, L. Prognostic Role of the FGFR4-388Arg Variant in Lung Squamous-Cell Carcinoma Patients with Lymph Node Involvement. Clin. Lung Cancer 2017, 18, 667–674.e1. [Google Scholar] [CrossRef]
  32. Wang, J.; Yu, W.; Cai, Y.; Ren, C.; Ittmann, M.M. Altered Fibroblast Growth Factor Receptor 4 Stability Promotes Prostate Cancer Progression. Neoplasia 2008, 10, 847–856. [Google Scholar] [CrossRef] [PubMed]
  33. Nannapaneni, S.; Griffith, C.C.; Magliocca, K.R.; Chen, W.; Lyu, X.; Chen, Z.; Wang, D.; Wang, X.; Shin, D.M.; Chen, Z.G.; et al. Co-Expression of Fibroblast Growth Factor Receptor 3 with Mutant P53, and Its Association with Worse Outcome in Oropharyngeal Squamous Cell Carcinoma. PLoS ONE 2021, 16, e0247498. [Google Scholar] [CrossRef]
  34. Sikic, D.; Taubert, H.; Breyer, J.; Eckstein, M.; Weyerer, V.; Keck, B.; Kubon, J.; Otto, W.; Worst, T.S.; Kriegmair, M.C.; et al. The Prognostic Value of FGFR3 Expression in Patients with T1 Non-Muscle Invasive Bladder Cancer. Cancer Manag. Res. 2021, 13, 6567–6578. [Google Scholar] [CrossRef] [PubMed]
  35. Jing, P.; Zhao, N.; Xie, N.; Ye, M.; Zhang, Y.; Zhang, Z.; Li, M.; Lai, X.; Zhang, J.; Gu, Z. MiR-24-3p/FGFR3 Signaling as a Novel Axis Is Involved in Epithelial-Mesenchymal Transition and Regulates Lung Adenocarcinoma Progression. J. Immunol. Res. 2018, 2018, 2834109. [Google Scholar] [CrossRef]
  36. Starska, K.; Forma, E.; Lewy-Trenda, I.; Stasikowska-Kanicka, O.; Skóra, M.; Bryś, M. Fibroblast Growth Factor Receptor 1 and 3 Expression Is Associated with Regulatory PI3K/AKT Kinase Activity, as Well as Invasion and Prognosis, in Human Laryngeal Cancer. Cell. Oncol. 2018, 41, 253–268. [Google Scholar] [CrossRef] [PubMed]
  37. Kang, H.W.; Kim, Y.-H.; Jeong, P.; Park, C.; Kim, W.T.; Ryu, D.H.; Cha, E.-J.; Ha, Y.-S.; Kim, T.-H.; Kwon, T.G.; et al. Expression Levels of FGFR3 as a Prognostic Marker for the Progression of Primary PT1 Bladder Cancer and Its Association with Mutation Status. Oncol. Lett. 2017, 14, 3817–3824. [Google Scholar] [CrossRef] [PubMed]
  38. Weiss, J.; Sos, M.L.; Seidel, D.; Peifer, M.; Zander, T.; Heuckmann, J.M.; Ullrich, R.T.; Menon, R.; Maier, S.; Soltermann, A.; et al. Frequent and Focal FGFR1 Amplification Associates with Therapeutically Tractable FGFR1 Dependency in Squamous Cell Lung Cancer. Sci. Transl. Med. 2010, 2, 62ra93. [Google Scholar] [CrossRef] [PubMed]
  39. Gil, F.; Miranda-Filho, A.; Uribe-Perez, C.; Arias-Ortiz, N.E.; Yépez-Chamorro, M.C.; Bravo, L.M.; de Vries, E. Impact of the Management and Proportion of Lost to Follow-up Cases on Cancer Survival Estimates for Small Population-Based Cancer Registries. J. Cancer Epidemiol. 2022, 2022, 9068214. [Google Scholar] [CrossRef]
  40. Kang, D.; Jung, J.; Park, S.; Cho, B.-S.; Kim, H.-J.; Kim, Y.; Lee, J.-M.; Kim, H.S.; Ahn, A.; Kim, M.; et al. Genetic Characteristics According to Subgroup of Acute Myeloid Leukemia with Myelodysplasia-Related Changes. J. Clin. Med. 2022, 11, 2378. [Google Scholar] [CrossRef]
  41. Desmeules, P.; Boudreau, D.K.; Bastien, N.; Boulanger, M.-C.; Bossé, Y.; Joubert, P.; Couture, C. Performance of an RNA-Based next-Generation Sequencing Assay for Combined Detection of Clinically Actionable Fusions and Hotspot Mutations in NSCLC. JTO Clin. Res. Rep. 2022, 3, 100276. [Google Scholar] [CrossRef] [PubMed]
  42. Guseva, N.V.; Jaber, O.; Tanas, M.R.; Stence, A.A.; Sompallae, R.; Schade, J.; Fillman, A.N.; Miller, B.J.; Bossler, A.D.; Ma, D. Anchored Multiplex PCR for Targeted Next-Generation Sequencing Reveals Recurrent and Novel USP6 Fusions and Upregulation of USP6 Expression in Aneurysmal Bone Cyst. Genes Chromosomes Cancer 2017, 56, 266–277. [Google Scholar] [CrossRef] [PubMed]
  43. Sands, J.M.; Nguyen, T.; Shivdasani, P.; Sacher, A.G.; Cheng, M.L.; Alden, R.S.; Jänne, P.A.; Kuo, F.C.; Oxnard, G.R.; Sholl, L.M. Next-Generation Sequencing Informs Diagnosis and Identifies Unexpected Therapeutic Targets in Lung Squamous Cell Carcinomas. Lung Cancer 2020, 140, 35–41. [Google Scholar] [CrossRef] [PubMed]
  44. Theelen, W.S.; Mittempergher, L.; Willems, S.M.; Bosma, A.J.; Peters, D.D.; van der Noort, V.; Japenga, E.J.; Peeters, T.; Koole, K.; Šuštić, T.; et al. FGFR1, 2 and 3 Protein Overexpression and Molecular Aberrations of FGFR3 in Early Stage Non-Small Cell Lung Cancer: FGFR Expression in Early Stage Non-Small Lung Cancer. J. Pathol. Clin. Res. 2016, 2, 223–233. [Google Scholar] [CrossRef]
  45. Hibi, M.; Kaneda, H.; Tanizaki, J.; Sakai, K.; Togashi, Y.; Terashima, M.; De Velasco, M.A.; Fujita, Y.; Banno, E.; Nakamura, Y.; et al. FGFR Gene Alterations in Lung Squamous Cell Carcinoma Are Potential Targets for the Multikinase Inhibitor Nintedanib. Cancer Sci. 2016, 107, 1667–1676. [Google Scholar] [CrossRef]
  46. Lim, S.H.; Sun, J.-M.; Choi, Y.-L.; Kim, H.R.; Ahn, S.; Lee, J.Y.; Lee, S.-H.; Ahn, J.S.; Park, K.; Kim, J.H.; et al. Efficacy and Safety of Dovitinib in Pretreated Patients with Advanced Squamous Non-Small Cell Lung Cancer with FGFR1 Amplification: A Single-Arm, Phase 2 Study: Dovitinib InFGFR1-Amplified SCC. Cancer 2016, 122, 3024–3031. [Google Scholar] [CrossRef]
  47. Wu, Y.-M.; Su, F.; Kalyana-Sundaram, S.; Khazanov, N.; Ateeq, B.; Cao, X.; Lonigro, R.J.; Vats, P.; Wang, R.; Lin, S.-F.; et al. Identification of Targetable FGFR Gene Fusions in Diverse Cancers. Cancer Discov. 2013, 3, 636–647. [Google Scholar] [CrossRef]
  48. Stransky, N.; Cerami, E.; Schalm, S.; Kim, J.L.; Lengauer, C. The Landscape of Kinase Fusions in Cancer. Nat. Commun. 2014, 5, 4846. [Google Scholar] [CrossRef]
  49. Wang, R.; Wang, L.; Li, Y.; Hu, H.; Shen, L.; Shen, X.; Pan, Y.; Ye, T.; Zhang, Y.; Luo, X.; et al. FGFR1/3 Tyrosine Kinase Fusions Define a Unique Molecular Subtype of Non-Small Cell Lung Cancer. Clin. Cancer Res. 2014, 20, 4107–4114. [Google Scholar] [CrossRef]
  50. Qin, A.; Johnson, A.; Ross, J.S.; Miller, V.A.; Ali, S.M.; Schrock, A.B.; Gadgeel, S.M. Detection of Known and Novel FGFR Fusions in Non-Small Cell Lung Cancer by Comprehensive Genomic Profiling. J. Thorac. Oncol. 2019, 14, 54–62. [Google Scholar] [CrossRef] [Green Version]
  51. Kim, Y.; Hammerman, P.S.; Kim, J.; Yoon, J.-A.; Lee, Y.; Sun, J.-M.; Wilkerson, M.D.; Pedamallu, C.S.; Cibulskis, K.; Yoo, Y.K.; et al. Integrative and Comparative Genomic Analysis of Lung Squamous Cell Carcinomas in East Asian Patients. J. Clin. Oncol. 2014, 32, 121–128. [Google Scholar] [CrossRef]
  52. Zhou, Z.; Liu, Z.; Ou, Q.; Wu, X.; Wang, X.; Shao, Y.; Liu, H.; Yang, Y. Targeting FGFR in Non-Small Cell Lung Cancer: Implications from the Landscape of Clinically Actionable Aberrations of FGFR Kinases. Cancer Biol. Med. 2021, 18, 490–501. [Google Scholar] [CrossRef] [PubMed]
  53. Gozgit, J.M.; Wong, M.J.; Moran, L.; Wardwell, S.; Mohemmad, Q.K.; Narasimhan, N.I.; Shakespeare, W.C.; Wang, F.; Clackson, T.; Rivera, V.M. Ponatinib (AP24534), a Multitargeted Pan-FGFR Inhibitor with Activity in Multiple FGFR-Amplified or Mutated Cancer Models. Mol. Cancer Ther. 2012, 11, 690–699. [Google Scholar] [CrossRef] [PubMed]
  54. Schittenhelm, J.; Ziegler, L.; Sperveslage, J.; Mittelbronn, M.; Capper, D.; Burghardt, I.; Poso, A.; Biskup, S.; Skardelly, M.; Tabatabai, G. FGFR3 Overexpression Is a Useful Detection Tool for FGFR3 Fusions and Sequence Variations in Glioma. Neurooncol. Pract. 2021, 8, 209–221. [Google Scholar] [CrossRef] [PubMed]
  55. Parker, B.C.; Annala, M.J.; Cogdell, D.E.; Granberg, K.J.; Sun, Y.; Ji, P.; Li, X.; Gumin, J.; Zheng, H.; Hu, L.; et al. The Tumorigenic FGFR3-TACC3 Gene Fusion Escapes MiR-99a Regulation in Glioblastoma. J. Clin. Investig. 2013, 123, 855–865. [Google Scholar] [CrossRef] [PubMed]
  56. Helsten, T.; Elkin, S.; Arthur, E.; Tomson, B.N.; Carter, J.; Kurzrock, R. The FGFR Landscape in Cancer: Analysis of 4,853 Tumors by next-Generation Sequencing. Clin. Cancer Res. 2016, 22, 259–267. [Google Scholar] [CrossRef]
  57. Liao, R.G.; Jung, J.; Tchaicha, J.; Wilkerson, M.D.; Sivachenko, A.; Beauchamp, E.M.; Liu, Q.; Pugh, T.J.; Pedamallu, C.S.; Hayes, D.N.; et al. Inhibitor-Sensitive FGFR2 and FGFR3 Mutations in Lung Squamous Cell Carcinoma. Cancer Res. 2013, 73, 5195–5205. [Google Scholar] [CrossRef]
  58. Dutt, A.; Salvesen, H.B.; Chen, T.-H.; Ramos, A.H.; Onofrio, R.C.; Hatton, C.; Nicoletti, R.; Winckler, W.; Grewal, R.; Hanna, M.; et al. Drug-Sensitive FGFR2 Mutations in Endometrial Carcinoma. Proc. Natl. Acad. Sci. USA 2008, 105, 8713–8717. [Google Scholar] [CrossRef]
  59. Majewski, I.J.; Mittempergher, L.; Davidson, N.M.; Bosma, A.; Willems, S.M.; Horlings, H.M.; de Rink, I.; Greger, L.; Hooijer, G.K.J.; Peters, D.; et al. Identification of Recurrent FGFR3 Fusion Genes in Lung Cancer through Kinome-Centred RNA Sequencing: Kinase Fusion Genes in NSCLC. J. Pathol. 2013, 230, 270–276. [Google Scholar] [CrossRef]
  60. Flockerzi, F.A.; Roggia, C.; Langer, F.; Holleczek, B.; Bohle, R.M. FGFR1 Gene Amplification in Squamous Cell Carcinomas of the Lung: A Potential Favorable Prognostic Marker for Women and for Patients with Advanced Cancer. Virchows Arch. 2018, 472, 759–769. [Google Scholar] [CrossRef]
  61. Nakamura, I.T.; Kohsaka, S.; Ikegami, M.; Ikeuchi, H.; Ueno, T.; Li, K.; Beyett, T.S.; Koyama, T.; Shimizu, T.; Yamamoto, N.; et al. Comprehensive Functional Evaluation of Variants of Fibroblast Growth Factor Receptor Genes in Cancer. NPJ Precis. Oncol. 2021, 5, 66. [Google Scholar] [CrossRef] [PubMed]
  62. Wilkie, A.O.M.; Bochukova, E.G.; Hansen, R.M.S.; Taylor, I.B.; Rannan-Eliya, S.V.; Byren, J.C.; Wall, S.A.; Ramos, L.; Venâncio, M.; Hurst, J.A.; et al. Clinical Dividends from the Molecular Genetic Diagnosis of Craniosynostosis. Am. J. Med. Genet. A 2006, 140, 2631–2639. [Google Scholar] [CrossRef] [PubMed]
  63. Kress, W.; Petersen, B.; Collmann, H.; Grimm, T. An Unusual FGFR1 Mutation (Fibroblast Growth Factor Receptor 1 Mutation) in a Girl with Non-Syndromic Trigonocephaly. Cytogenet. Cell Genet. 2000, 91, 138–140. [Google Scholar] [CrossRef] [PubMed]
  64. Richards, S.; Aziz, N.; Bale, S.; Bick, D.; Das, S.; Gastier-Foster, J.; Grody, W.W.; Hegde, M.; Lyon, E.; Spector, E.; et al. Standards and Guidelines for the Interpretation of Sequence Variants: A Joint Consensus Recommendation of the American College of Medical Genetics and Genomics and the Association for Molecular Pathology. Genet. Med. 2015, 17, 405–424. [Google Scholar] [CrossRef] [PubMed]
  65. Joerger, M.; Cho, B.C.; Mach, N.; Caballero, C.; Soo, R.A.; Wirth, M.; Sayehli, C.; Navarro, A.; Keam, B.; Piciu, A.-M.; et al. Early Clinical Experience with the Pan-FGFR Inhibitor Rogaratinib in Patients with Non-Small Cell Lung Cancer Selected Based on FGFR MRNA Expression Levels. J. Clin. Oncol. 2019, 37, e20661. [Google Scholar] [CrossRef]
  66. De Luca, A.; Esposito Abate, R.; Rachiglio, A.M.; Maiello, M.R.; Esposito, C.; Schettino, C.; Izzo, F.; Nasti, G.; Normanno, N. FGFR Fusions in Cancer: From Diagnostic Approaches to Therapeutic Intervention. Int. J. Mol. Sci. 2020, 21, 6856. [Google Scholar] [CrossRef]
  67. Bahleda, R.; Italiano, A.; Hierro, C.; Mita, A.; Cervantes, A.; Chan, N.; Awad, M.; Calvo, E.; Moreno, V.; Govindan, R.; et al. Multicenter Phase I Study of Erdafitinib (JNJ-42756493), Oral Pan-Fibroblast Growth Factor Receptor Inhibitor, in Patients with Advanced or Refractory Solid Tumors. Clin. Cancer Res. 2019, 25, 4888–4897. [Google Scholar] [CrossRef]
  68. Travis, W.D.; Brambilla, E.; Burke, A.P.; Marx, A.; Nicholson, A.G. Introduction to the 2015 World Health Organization Classification of Tumors of the Lung, Pleura, Thymus, and Heart. J. Thorac. Oncol. 2015, 10, 1240–1242. [Google Scholar] [CrossRef]
  69. Brierley, J.D.; Gospodarowicz, M.K.; Wittekind, C. TNM Classification of Malignant Tumours; John Wiley & Sons: Nashville, TN, USA, 2016; ISBN 9781119263579. [Google Scholar]
  70. Skupinska, M.M.; Obtulowicz, T.; Moes-Sosnowska, J.; Rozy, A.; Szczepulska, E.; Langfort, R.; Wynimko, J.C.; Stanczak, A.; Pieczykolan, J.; Wieczorek, M.; et al. 1409P Comparing Different Methods of FGFR1 Aberrations Analysis in Squamous Cell Lung Cancer (SqCLC) Targeted Therapy. Ann. Oncol. 2020, 31, S891. [Google Scholar] [CrossRef]
  71. Skupinska, M.M.; Jesiotr, M.; Chrom, P.; Mroz, A.; Cierniak, S.; Winiarek, M.; Wyrwicz, L.S.; Pieczykolan, J.; Wieczorek, M.; Stanczak, A.; et al. The Role of FGFR2 Amplification and Expression in Patients with Advanced or Metastatic Gastric Cancer Receiving Fluoropyrimidine-Based Chemotherapy. Ann. Oncol. 2018, 29 (Suppl. 8), viii218. [Google Scholar] [CrossRef]
  72. Sosnowski, R.; Popiel, D.; Gapska, P.; Skupińska, M.; Stajno, P.; Sobieszek-Prochorec, M.; Ligaj, M.; Demkow, T.; Stańczak, A.; Wieczorek, M.; et al. 712P Analysis of Fibroblast Growth Factor Receptor 3 Aberrations in Bladder Cancer, for Enabling Personalized and Effective Therapy Based on FGFR Inhibitor. Ann. Oncol. 2021, 32, S719. [Google Scholar] [CrossRef]
  73. Dowsett, M.; Bartlett, J.; Ellis, I.O.; Salter, J.; Hills, M.; Mallon, E.; Watters, A.D.; Cooke, T.; Paish, C.; Wencyk, P.M.; et al. Correlation between Immunohistochemistry (HercepTest) and Fluorescence in Situ Hybridization (FISH) for HER-2 in 426 Breast Carcinomas from 37 Centres. J. Pathol. 2003, 199, 418–423. [Google Scholar] [CrossRef] [PubMed]
  74. Tomlinson, D.C.; Baldo, O.; Harnden, P.; Knowles, M.A. FGFR3 Protein Expression and Its Relationship to Mutation Status and Prognostic Variables in Bladder Cancer. J. Pathol. 2007, 213, 91–98. [Google Scholar] [CrossRef] [PubMed]
  75. Schultheis, A.M.; Bos, M.; Schmitz, K.; Wilsberg, L.; Binot, E.; Wolf, J.; Büttner, R.; Schildhaus, H.-U. Fibroblast Growth Factor Receptor 1 (FGFR1) Amplification Is a Potential Therapeutic Target in Small-Cell Lung Cancer. Mod. Pathol. 2014, 27, 214–221. [Google Scholar] [CrossRef] [PubMed] [Green Version]
Figure 1. Relative expression of (a) FGFR1; (b) FGFR2; (c) FGFR3; (d) FGFR4 genes in Sq-NSCLC tumor and tumor-adjacent normal tissues. Significant differences of FGFR1 and FGFR4 expression are indicated in red.
Ijms 23 10506 g001
Figure 2. Correlation scatter plot of the FGFR1 gene expression assessed by RT-PCR and NGS (Archer Lung FusionPlex) in 40 Sq-NSCLC tumor samples. Corresponding figures for FGFR2 and FGFR3 gene expression are shown in Supplementary Figure S2.
Ijms 23 10506 g002
Figure 3. Kaplan–Meier curves of disease-free survival (DFS) obtained by stratifying Sq-NSCLC patients with follow-up data available according to FGFR3 expression level assessed by (a) RT-PCR with a cut-off point at the median value of 0.021; (b) NGS with a cut-off point at the median value of 0.023. The complete observations are indicated by circles and censored by vertical marks.
Ijms 23 10506 g003
Figure 4. Significant associations of FGFR4 expression with pN-regional lymph node metastasis.
Ijms 23 10506 g004
Figure 5. Patterns of FGFR1, FGFR2, and FGFR3 expression via immunohistochemistry (IHC) in selected Sq-NSCLC samples (magnification, ×100; scale bars, 100 μm). Staining intensity (described in the Materials and Methods) was stratified according to: a four-graded scale: negative (IHC = 0), weak (IHC = 1), moderate (IHC = 2), and strong (IHC = 3); and H-score determined as follows: 0 x (% cells with no staining [0]) + 1 × (% cells staining faint, weakly [1+]) + 2 × (% cells staining moderately [2+]) + 3 × (% cells staining strongly [3+]).
Ijms 23 10506 g005
Figure 6. Significant association between relative mRNA and protein levels of FGFR1.
Ijms 23 10506 g006
Figure 7. FGFR1, FGFR2, and FGFR3 transcript and protein levels together with FGFRs variants and FGFR1 amplification status. Heat maps illustrate the (a) FGFR1-3 relative gene expression values (mRNA) with differentiation for RT-PCR and NGS methods; (b) FGFR1-3 protein expression levels based on H-score; (c) FGFRs variants occurrence with differentiation for clinical significance and FGFRs fusions; (d) FGFR1 amplification status based on FGFR1/CEN8 ≥ 2.0 or the average number of FGFR1 signals per cell ≥ 6 or ≥10% of tumor cells containing ≥ 15 FGFR1 signals or large clusters; for Sq-NSCLC samples. The largest gene expression values (a,b) are displayed in red color, intermediate values in shades of orange and yellow, and the smallest values in light yellow. Dark colored cells in the map (c,d) represent the variants, fusion, or an FGFR1 amplification occurrence, while no FGFRs variants, fusion, or amplification occurrence is indicated in light yellow. Not analyzed cells are indicated in white.
Ijms 23 10506 g007
Table 1. Patient characteristics.
Patients n = 40Frequency%
Age (Range 47–80 Years) Median (67 Years)
<67 (0)1845.00
≥67 (1)2255.00
Gender
Male (0)3075.00
Female (1)1025.00
Histological type
Squamous cell carcinoma3485.0
Carcinoma adenosquamous615.0
Histopathological Grade
G1.G2 (0)2562.5
G3.G4 (1)1537.5
Clinical stage
IA. IB. IIA (0)2152.5
IIB. IIIA. IV (1)1845.0
Cannot be assessed12.50
pT-Primary Tumor size
≤4 cm (0)1845.0
>4 cm (1)2255.0
pN-Regional Lymph Nodes invasion
Negative (0)2870.0
Positive (1)1127.5
Cannot be assessed12.50
pV-Venous Invasion
Negative (0)2460.0
Positive (microscopic) (1)1640.0
pL-Lymphatic Invasion
Negative (0)2152.5
Positive (1)1947.5
pM-Distant metastasis
Negative (0)1947.5
Positive (1)12.50
Not available2050.0
pR-Residual tumor
Negative (0)3587.5
Positive (1)410.0
Cannot be assessed12.50
Actinic keratosis
Negative (0)1332.5
Positive (1)2562.5
Cannot be assessed25.0
FGFR1 protein expression
Negative (0)1435.0
Positive (1)410.0
Not assessed2255.0
FGFR2 protein expression
Negative (0)1742.5
Positive (1)12.5
Not assessed2255.0
FGFR3 protein expression
Negative (0)1742.5
Positive (1)12.5
Not assessed2255.0
FGFR1 amplification
Negative (0)820.0
Positive (1)717.5
Not assessed2562.5
Number of patients at risk of recurrence (DFS)
1 year37.5
2 year410.0
3 year912.5
>3 year547.5
No follow up data1947.5
Outcome
NED1537.5
AWD615.0
DOD--
DOC--
No follow up data1947.5
DFS—disease-free survival; NED—no evidence of disease; AWD—alive with disease; DOD—died of disease; DOC—died of other causes; OS—overall survival.
Table 2. FGFR gene fusions and variants detected in 13 of 40 Sq-NSCLC clinical specimens using RNA-based NGS.
FGFR RNA Variants
Patient NoSample NameSymbolHGVScHGVSpConsequenceClinical SignificanceDepthAOAF
1M-1FGFR2c.2419G>Ap.(Glu807Lys)MissenseUncertain significance/Benign7963140.39
2M-6FGFR2c.2211G>Tp.(Met737Ile)MissenseNo information/Pathogenic7004270.61
3M-11FGFR2c.2398dupp.(Ser800PhefsTer22)FrameshiftUncertain significance/Pathogenic3136620.01
4M-17FGFR2c.2398dupp.(Ser800PhefsTer22)frameshiftUncertain significance/Pathogenic2624630.02
5M-77FGFR2c.2398dupp.(Ser800PhefsTer22)frameshiftUncertain significance/Pathogenic2898810.03
6M-88FGFR1c.899T>Cp.(Ile300Thr)missenseUncertain significance/Uncertain significance2781840.66
7M-115FGFR3c.746C>Gp.(Ser249Cys) (S249C)missensePathogenic/Pathogenic2511240.49
8M-119FGFR2c.870G>Tp.(Trp290Cys) (W290C)missensePathogenic/Pathogenic304240.08
9M-123FGFR2c.2398dupp.(Ser800PhefsTer22)frameshiftUncertain significance/Pathogenic3016700.02
10M-135FGFR2c.2398dupp.(Ser800PhefsTer22)frameshiftUncertain significance/Pathogenic1189300.02
M-135PFGFR2c.2398dupp.(Ser800PhefsTer22)frameshiftUncertain significance/Pathogenic643150.02
11M-138FGFR2c.2398dupp.(Ser800PhefsTer22)frameshiftUncertain significance/Pathogenic1633400.02
M-138Pnd
FGFR RNA Fusions
Patient noSample nameSymbolSSReads%ReadsBreakpoint
12M-20FGFR3::TACC317355.49chr4:1808661.chr4:1741429
M-20Pnd
13M-61TACC1::FGFR117254.66chr8:38646337.chr8:38315052
M-61Pnd
M-X—tumors; M-XP—tumor-adjacent normal tissues; nd—no fusion and/or variant detected; SS—number of supportive reads with unique start sites; Reads—total number of supportive reads; %Reads—percent of reads at breakpoint supporting fusion; Breakpoint—the breakpoints associated with the event, in hg19 coordinates; Depth—the total high quality unique molecule depth covering the variant; AO—total number of reads that support the alternate allele; AF—the allele fraction (AF) of the reads that support the alternative allele. Clinical Significance—clinical interpretation of sequence variants based on ClinVar* and Varsome** databases; Reference transcripts: FGFR1: NM_023110.3, NP_075598.2; FGFR2: NM_022970.3, NP_075259.4; FGFR3: NM_000142.4, NP_000133.1; TACC1: NM_006283.2; TACC3: NM_006342.2
Publisher’s Note: MDPI stays neutral with regard to jurisdictional claims in published maps and institutional affiliations.

