


Exploration of N-Arylsulfonyl-indole-2-carboxamide Derivatives as Novel Fructose-1,6-bisphosphatase Inhibitors by Molecular Simulation


Abstract
:1. Introduction
2. Results and Discussion
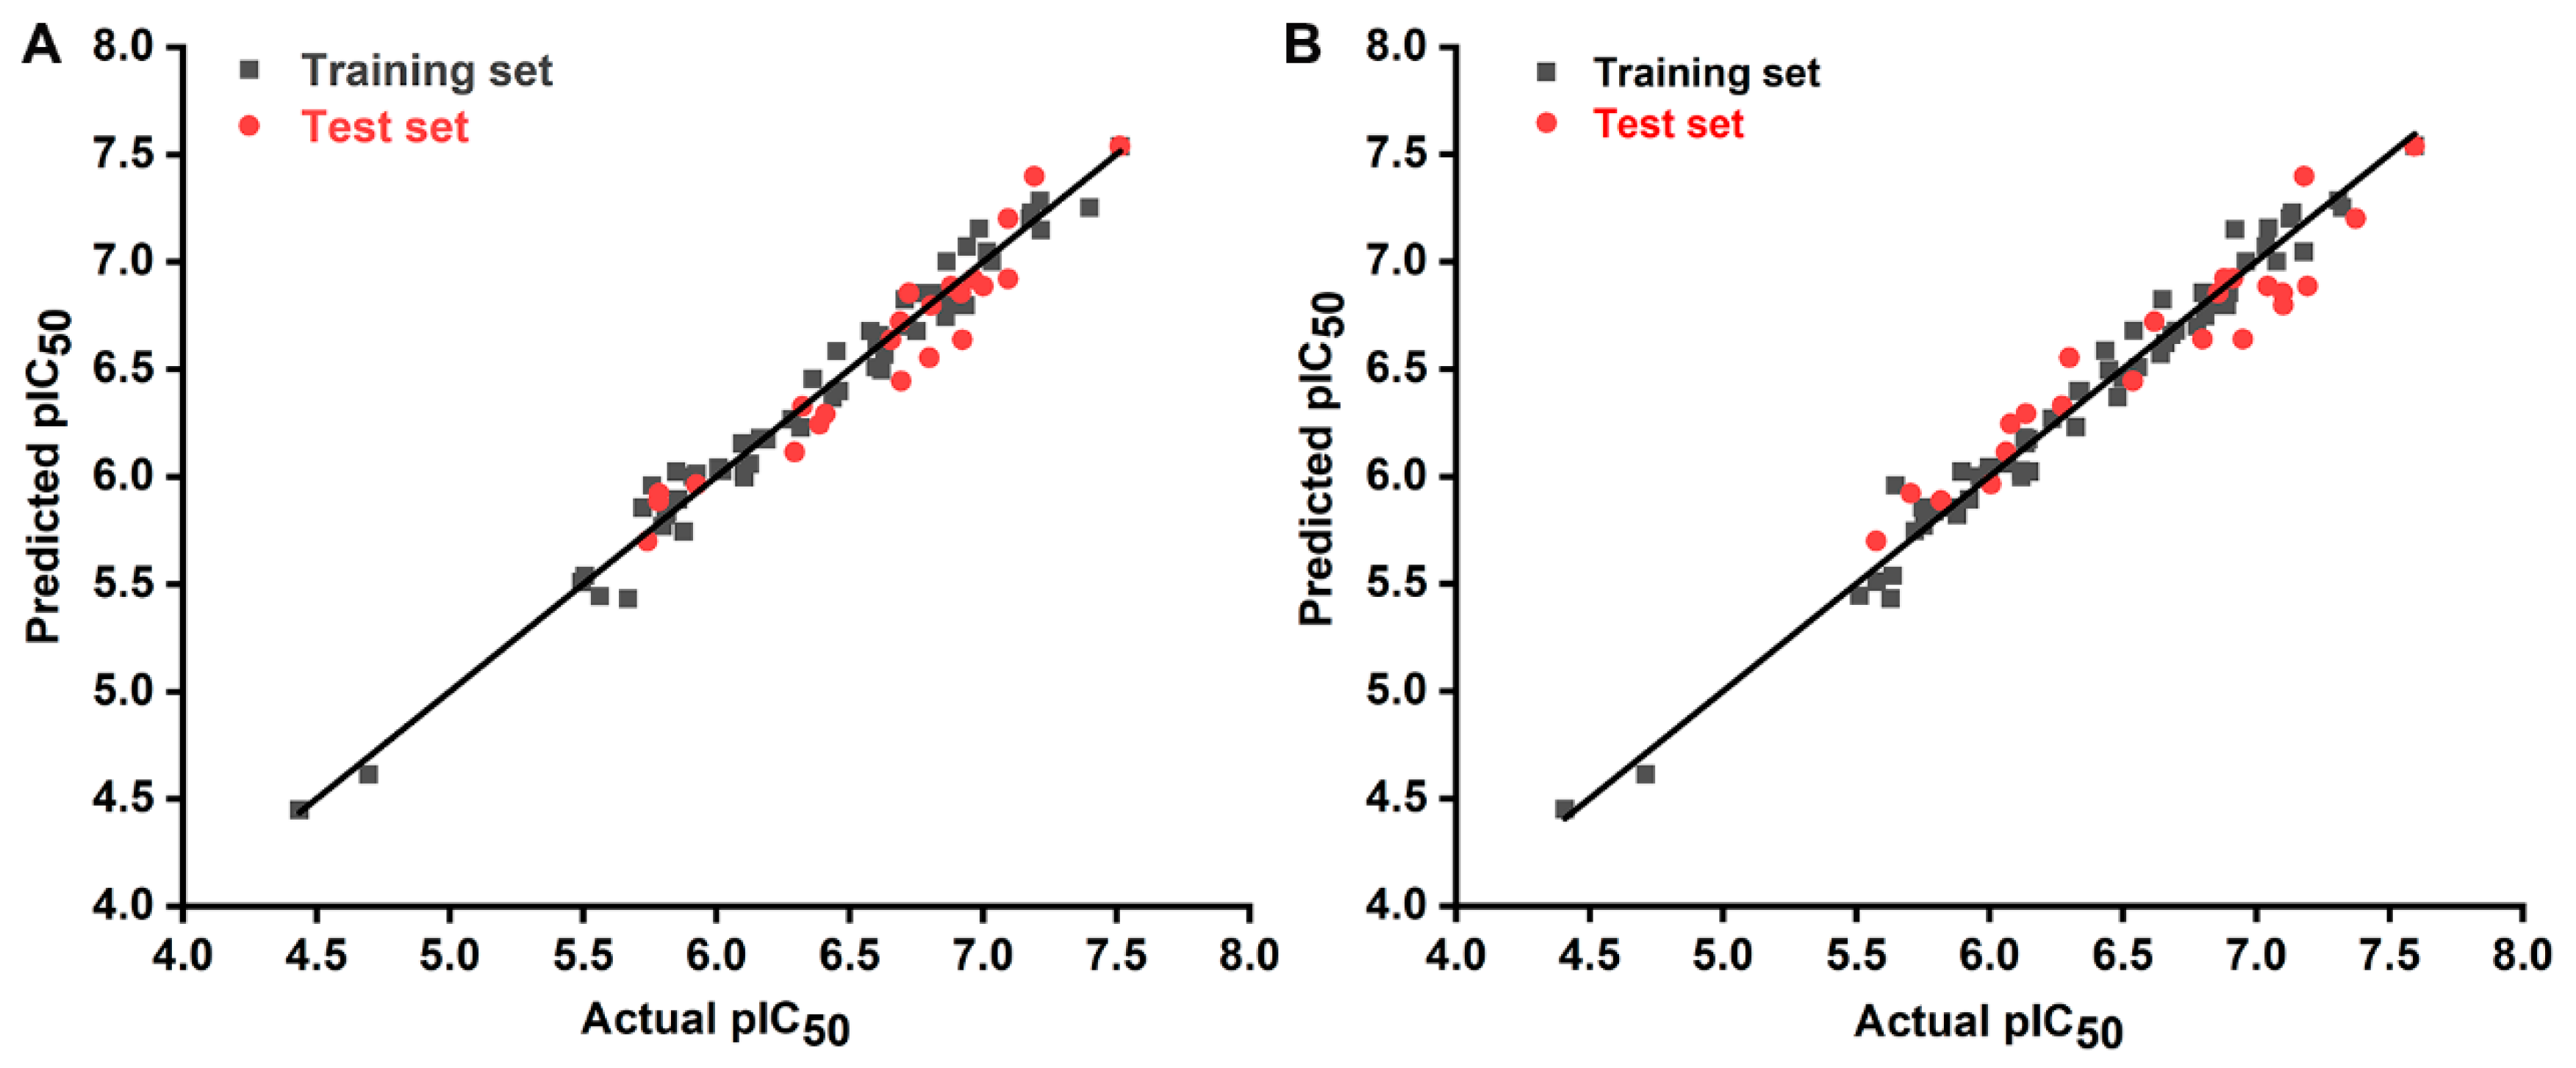
2.1. 3D-QSAR Model
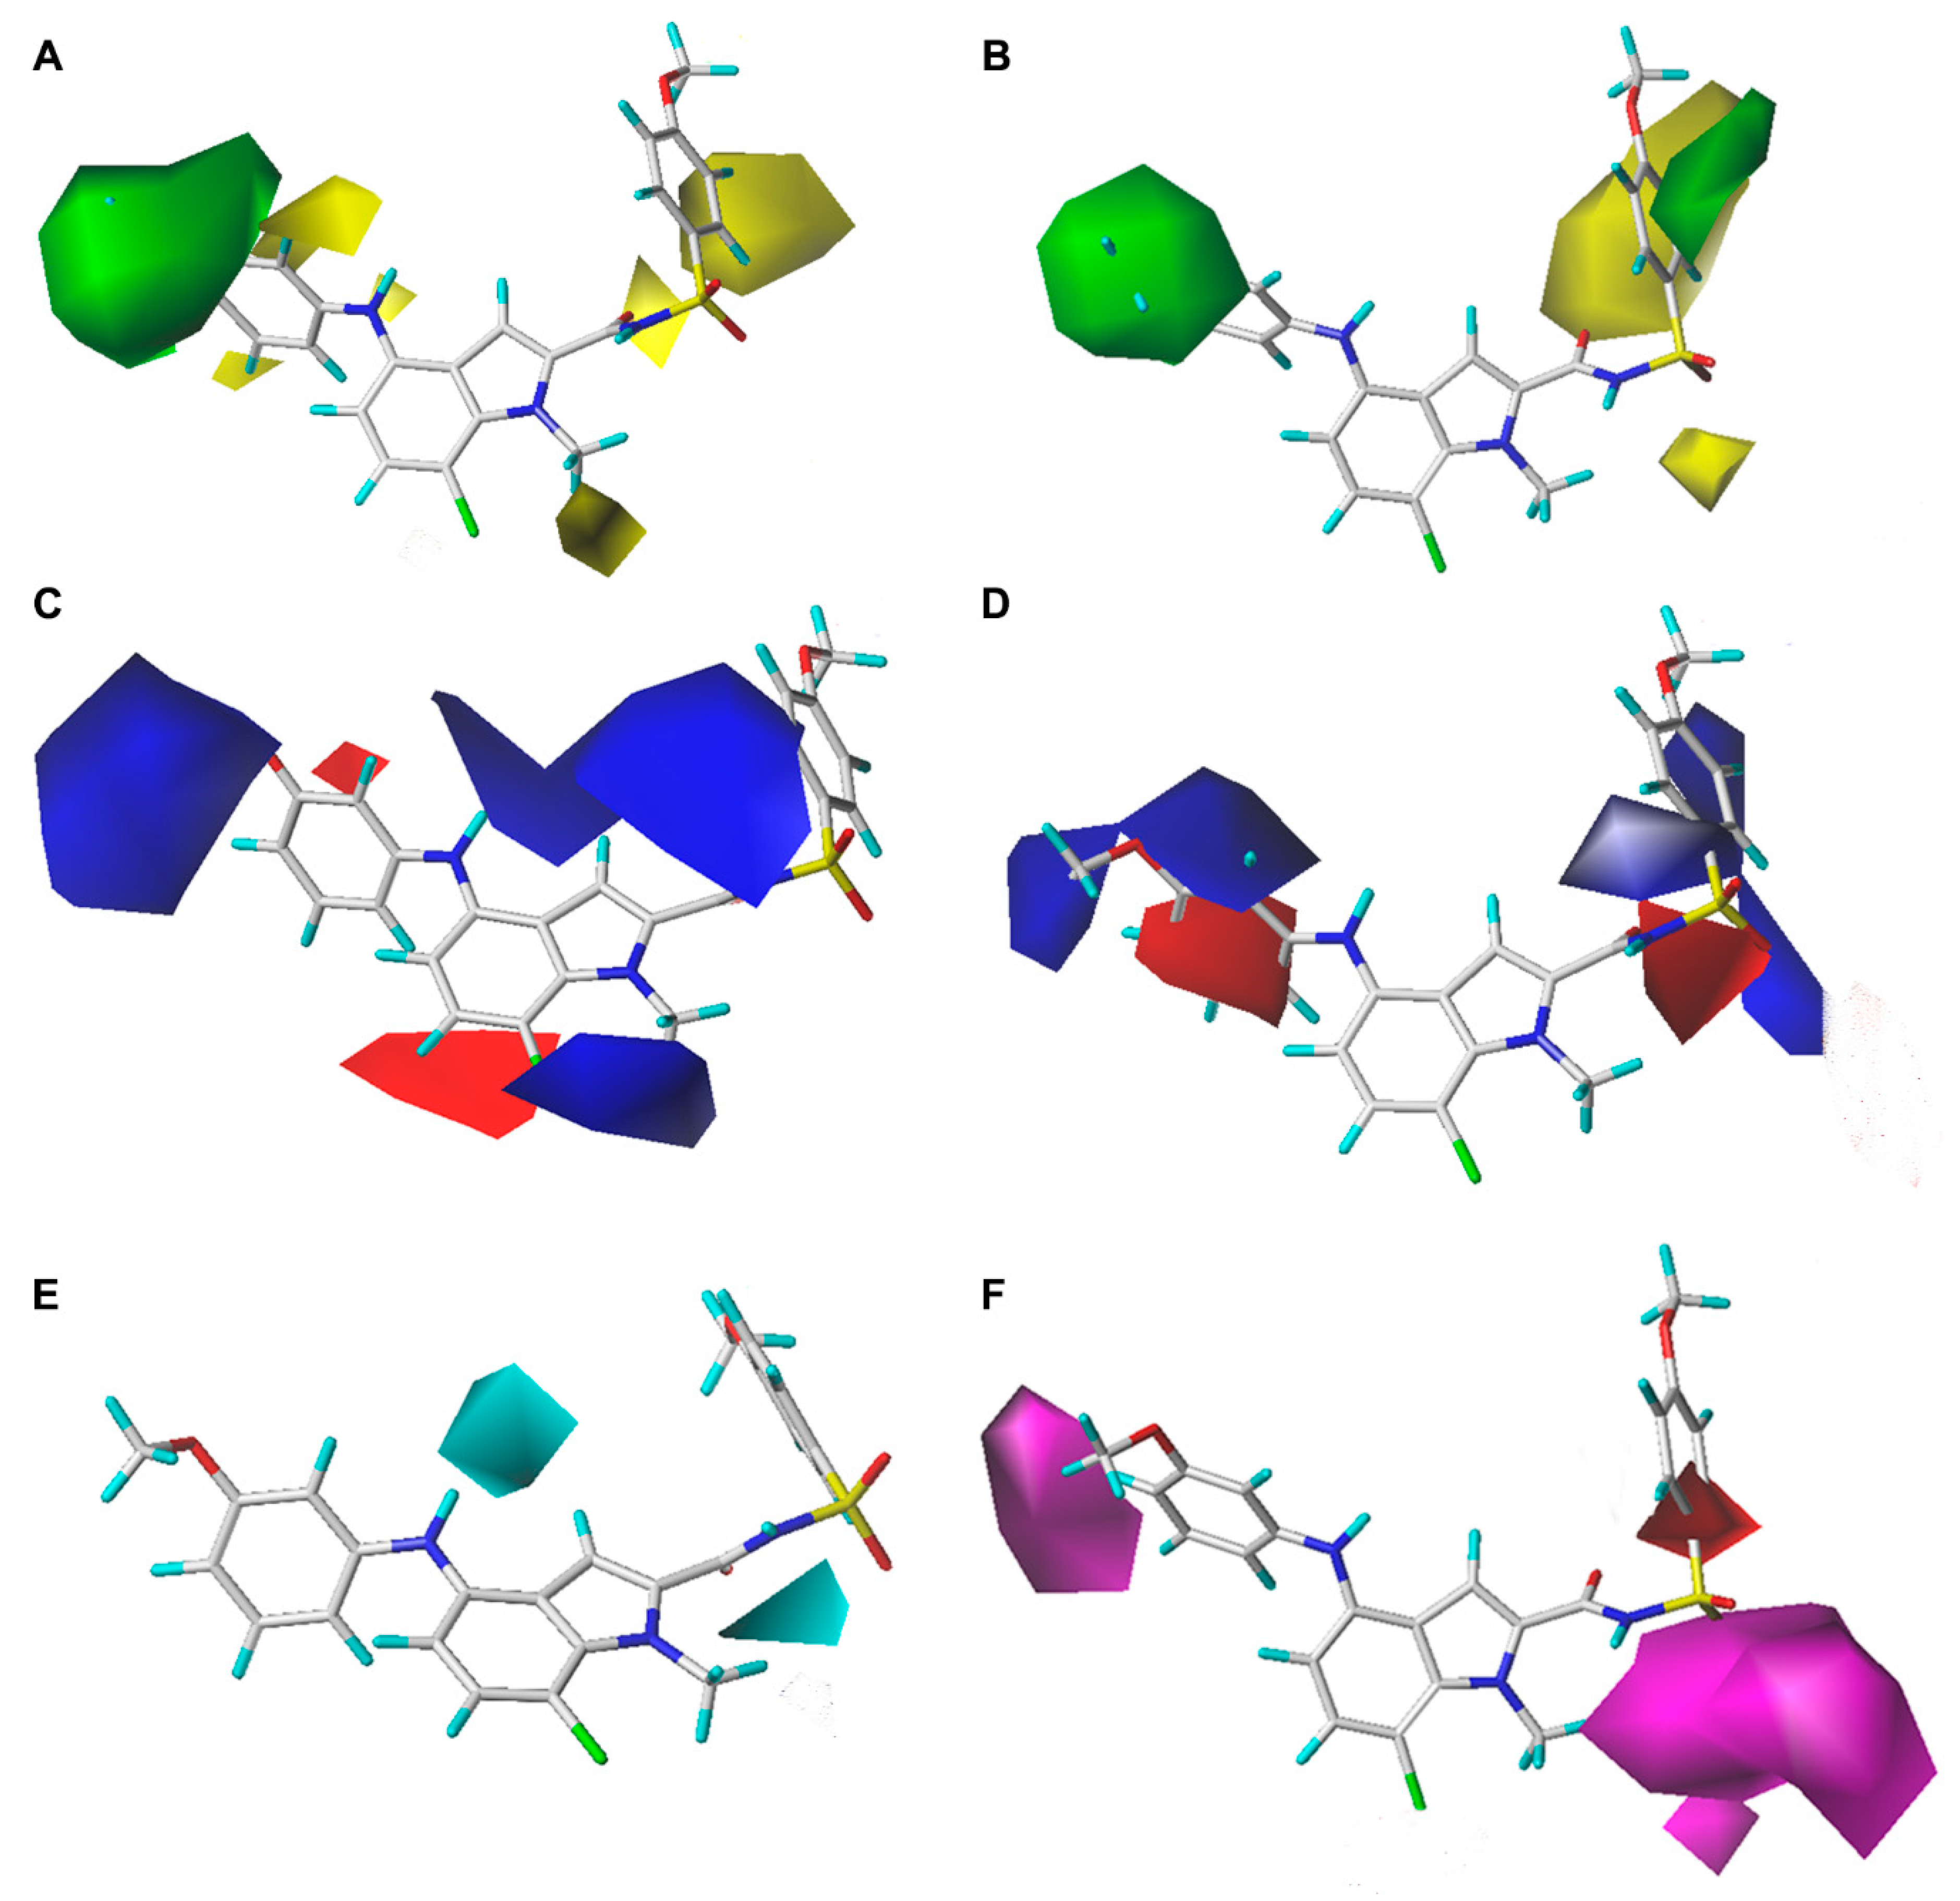
2.2. Contour Map Analysis
2.3. Pharmacophore Modeling
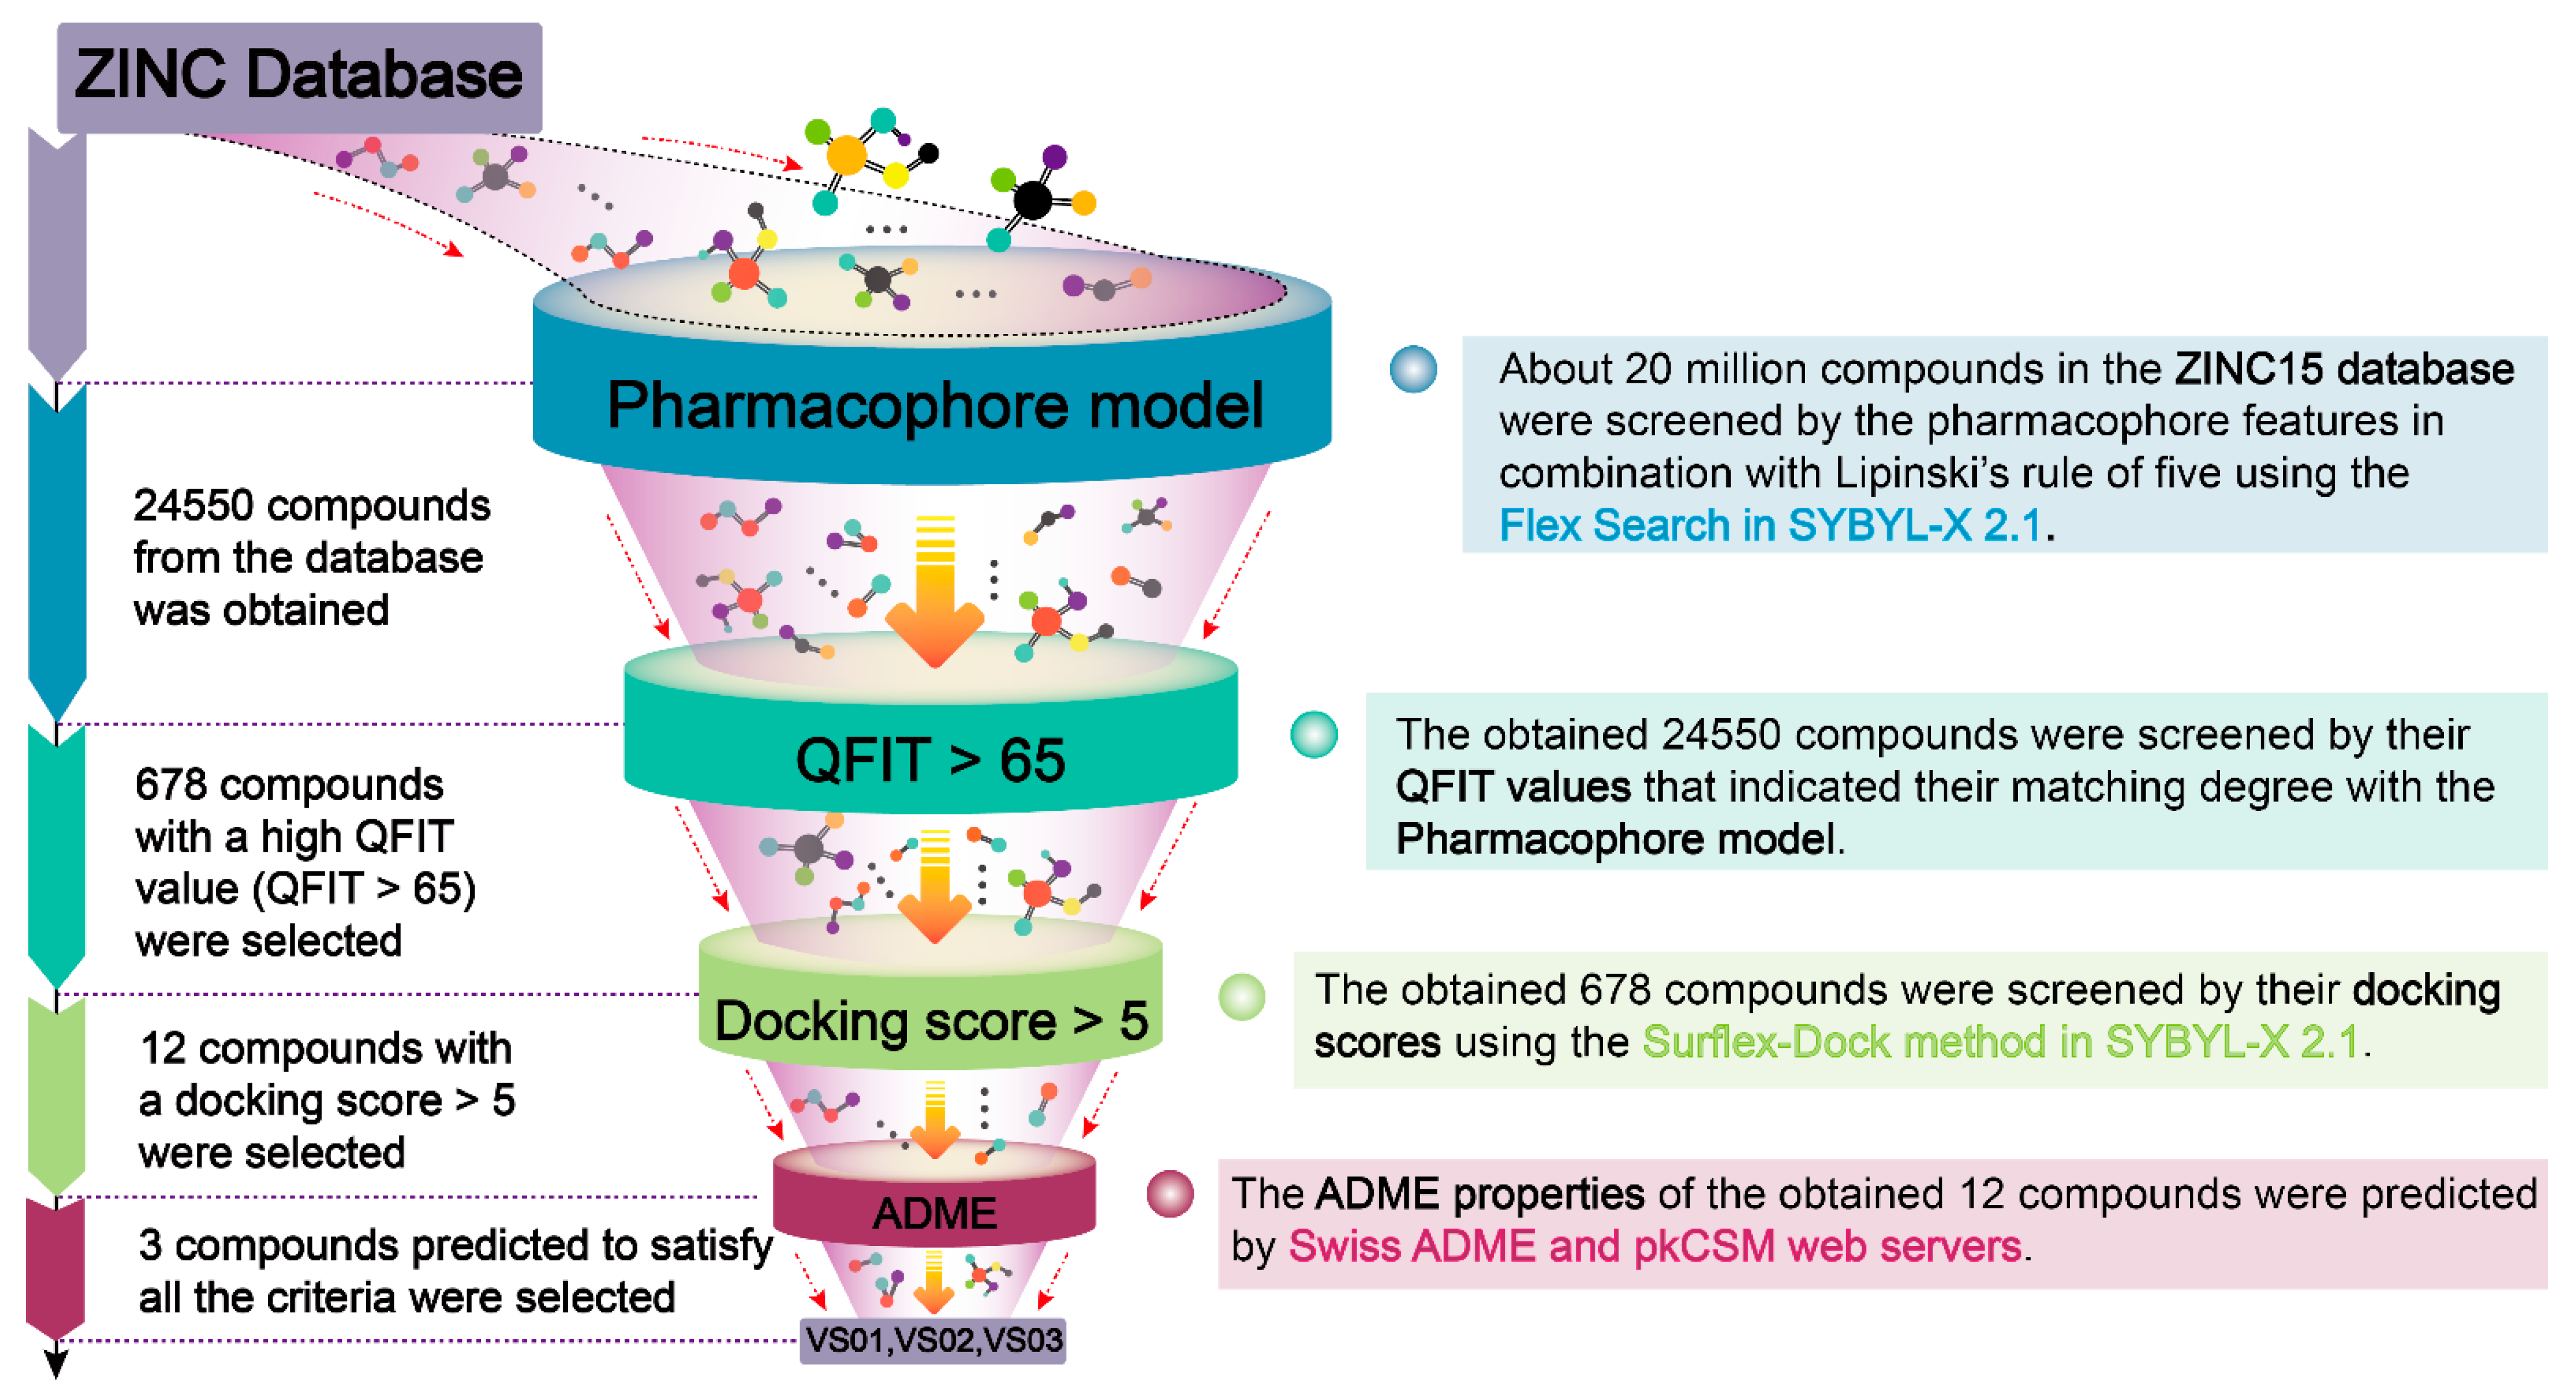
2.4. Virtual Screening
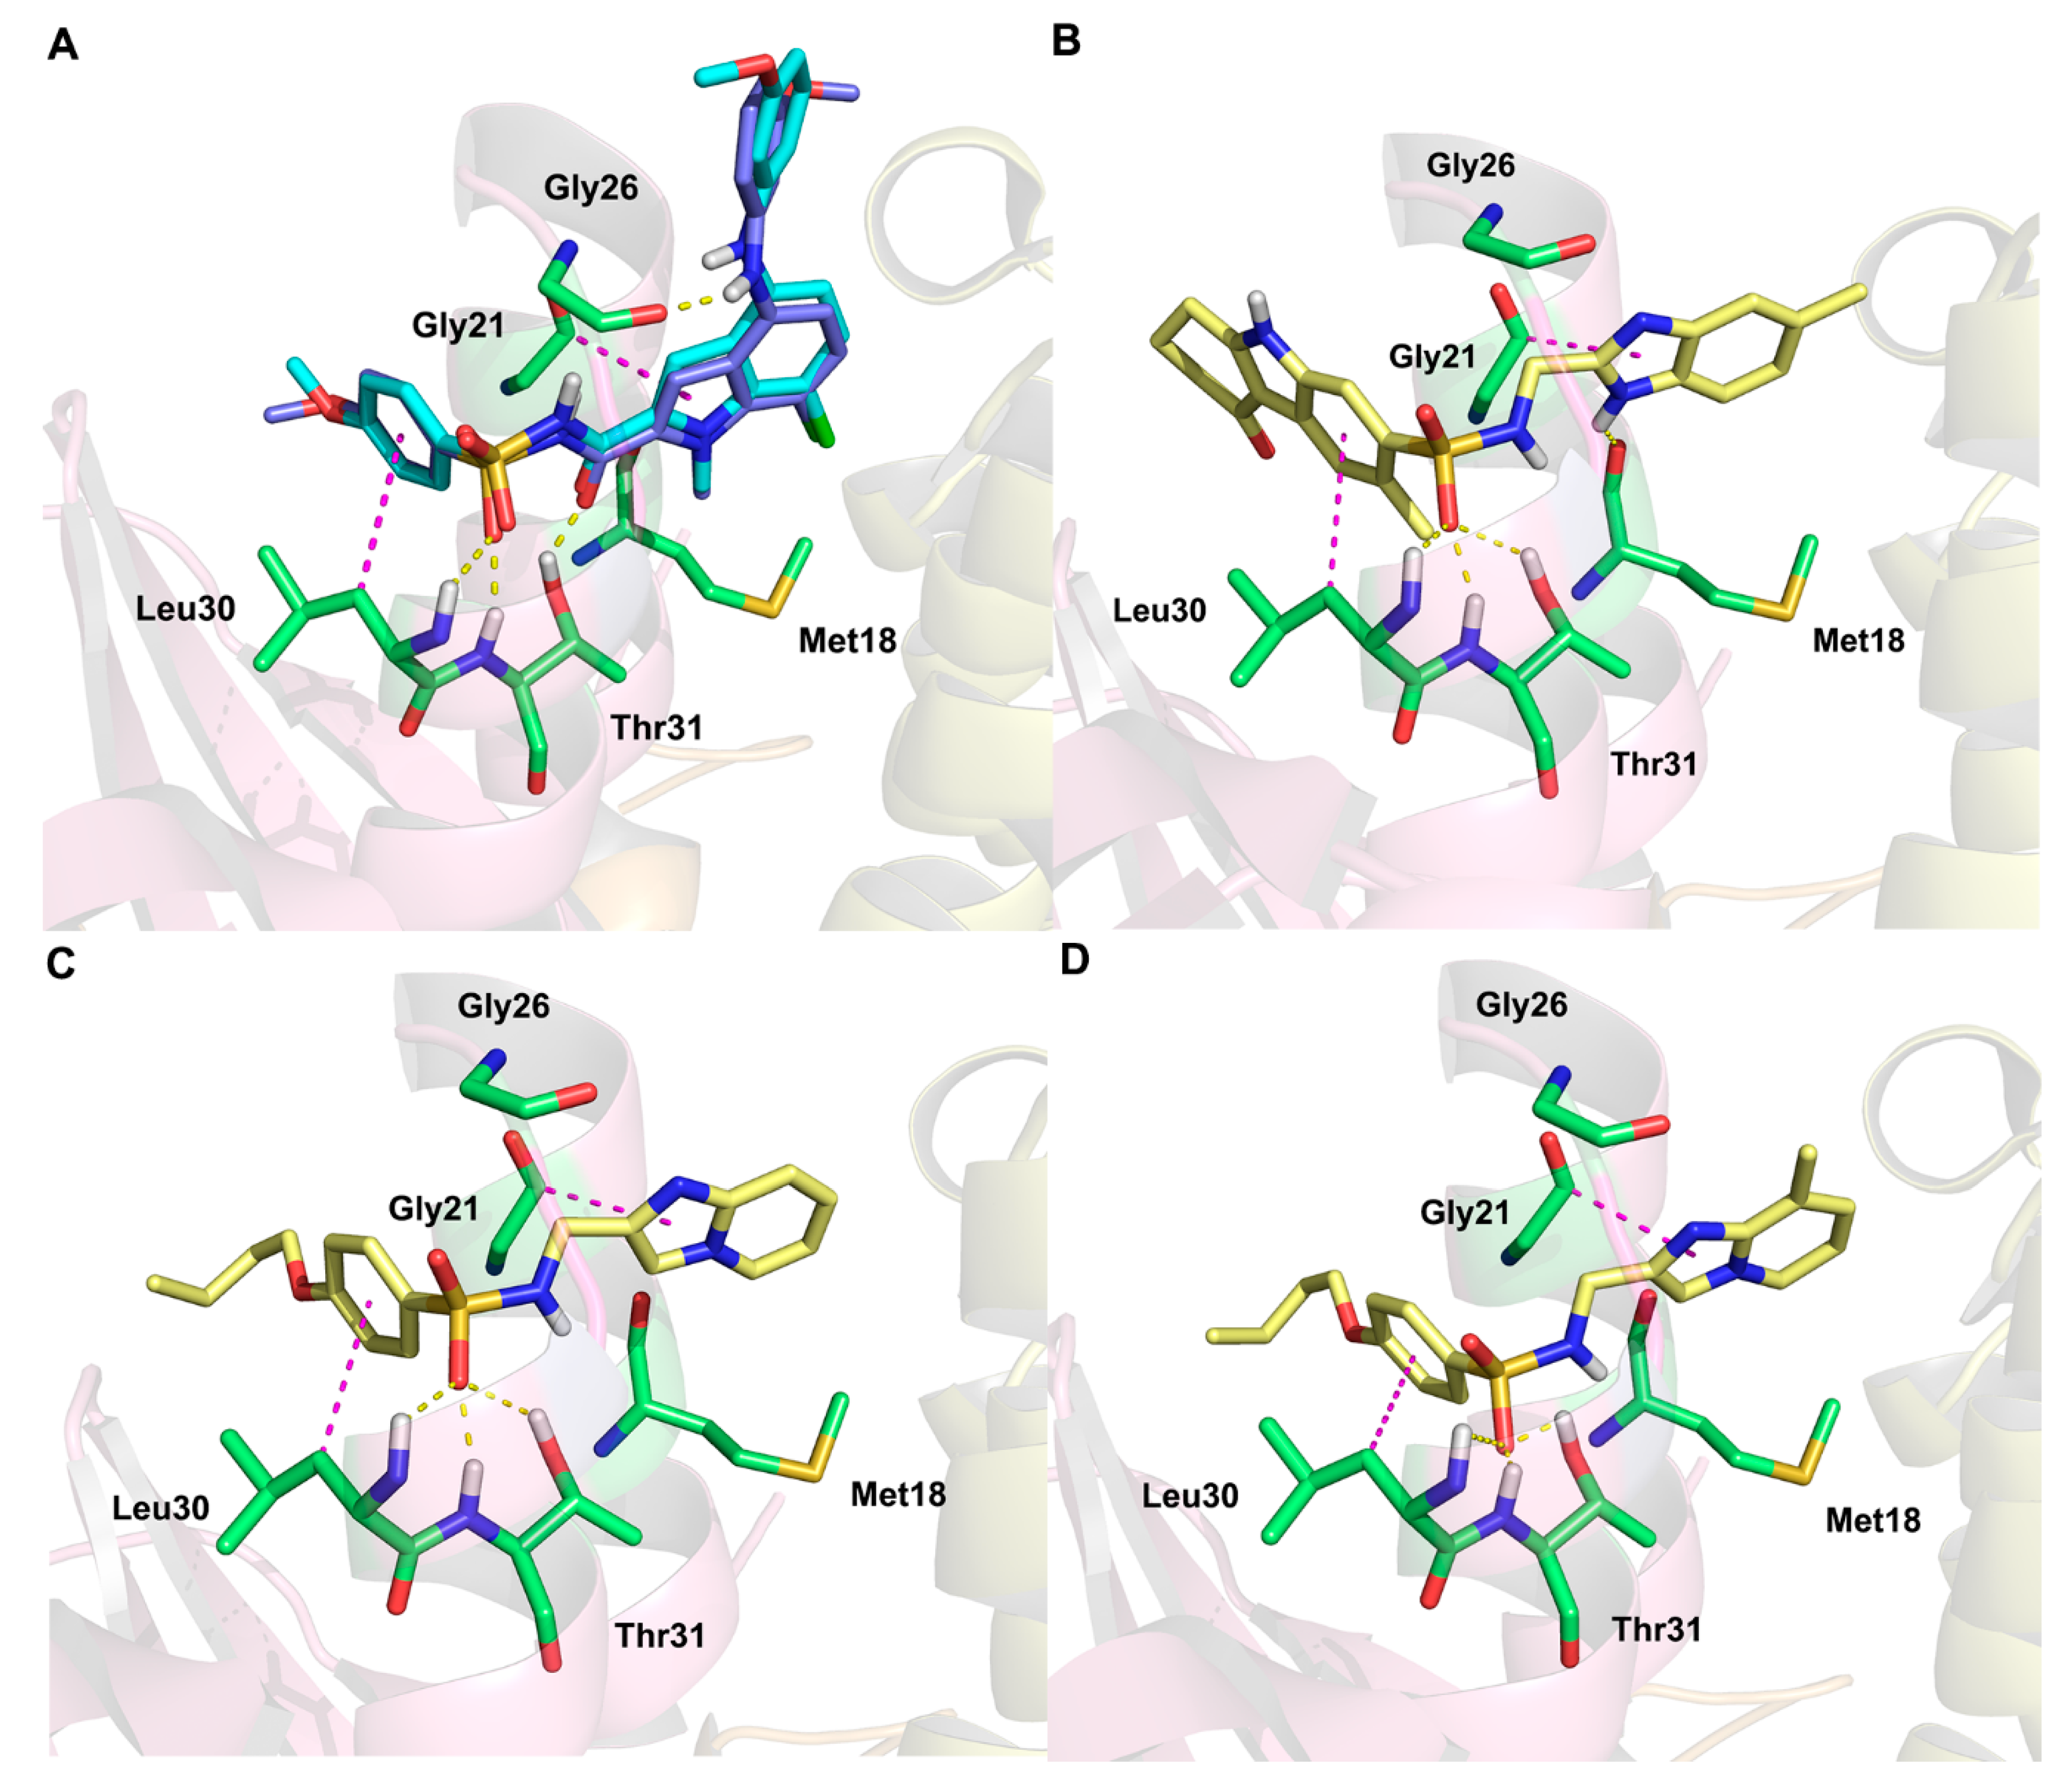
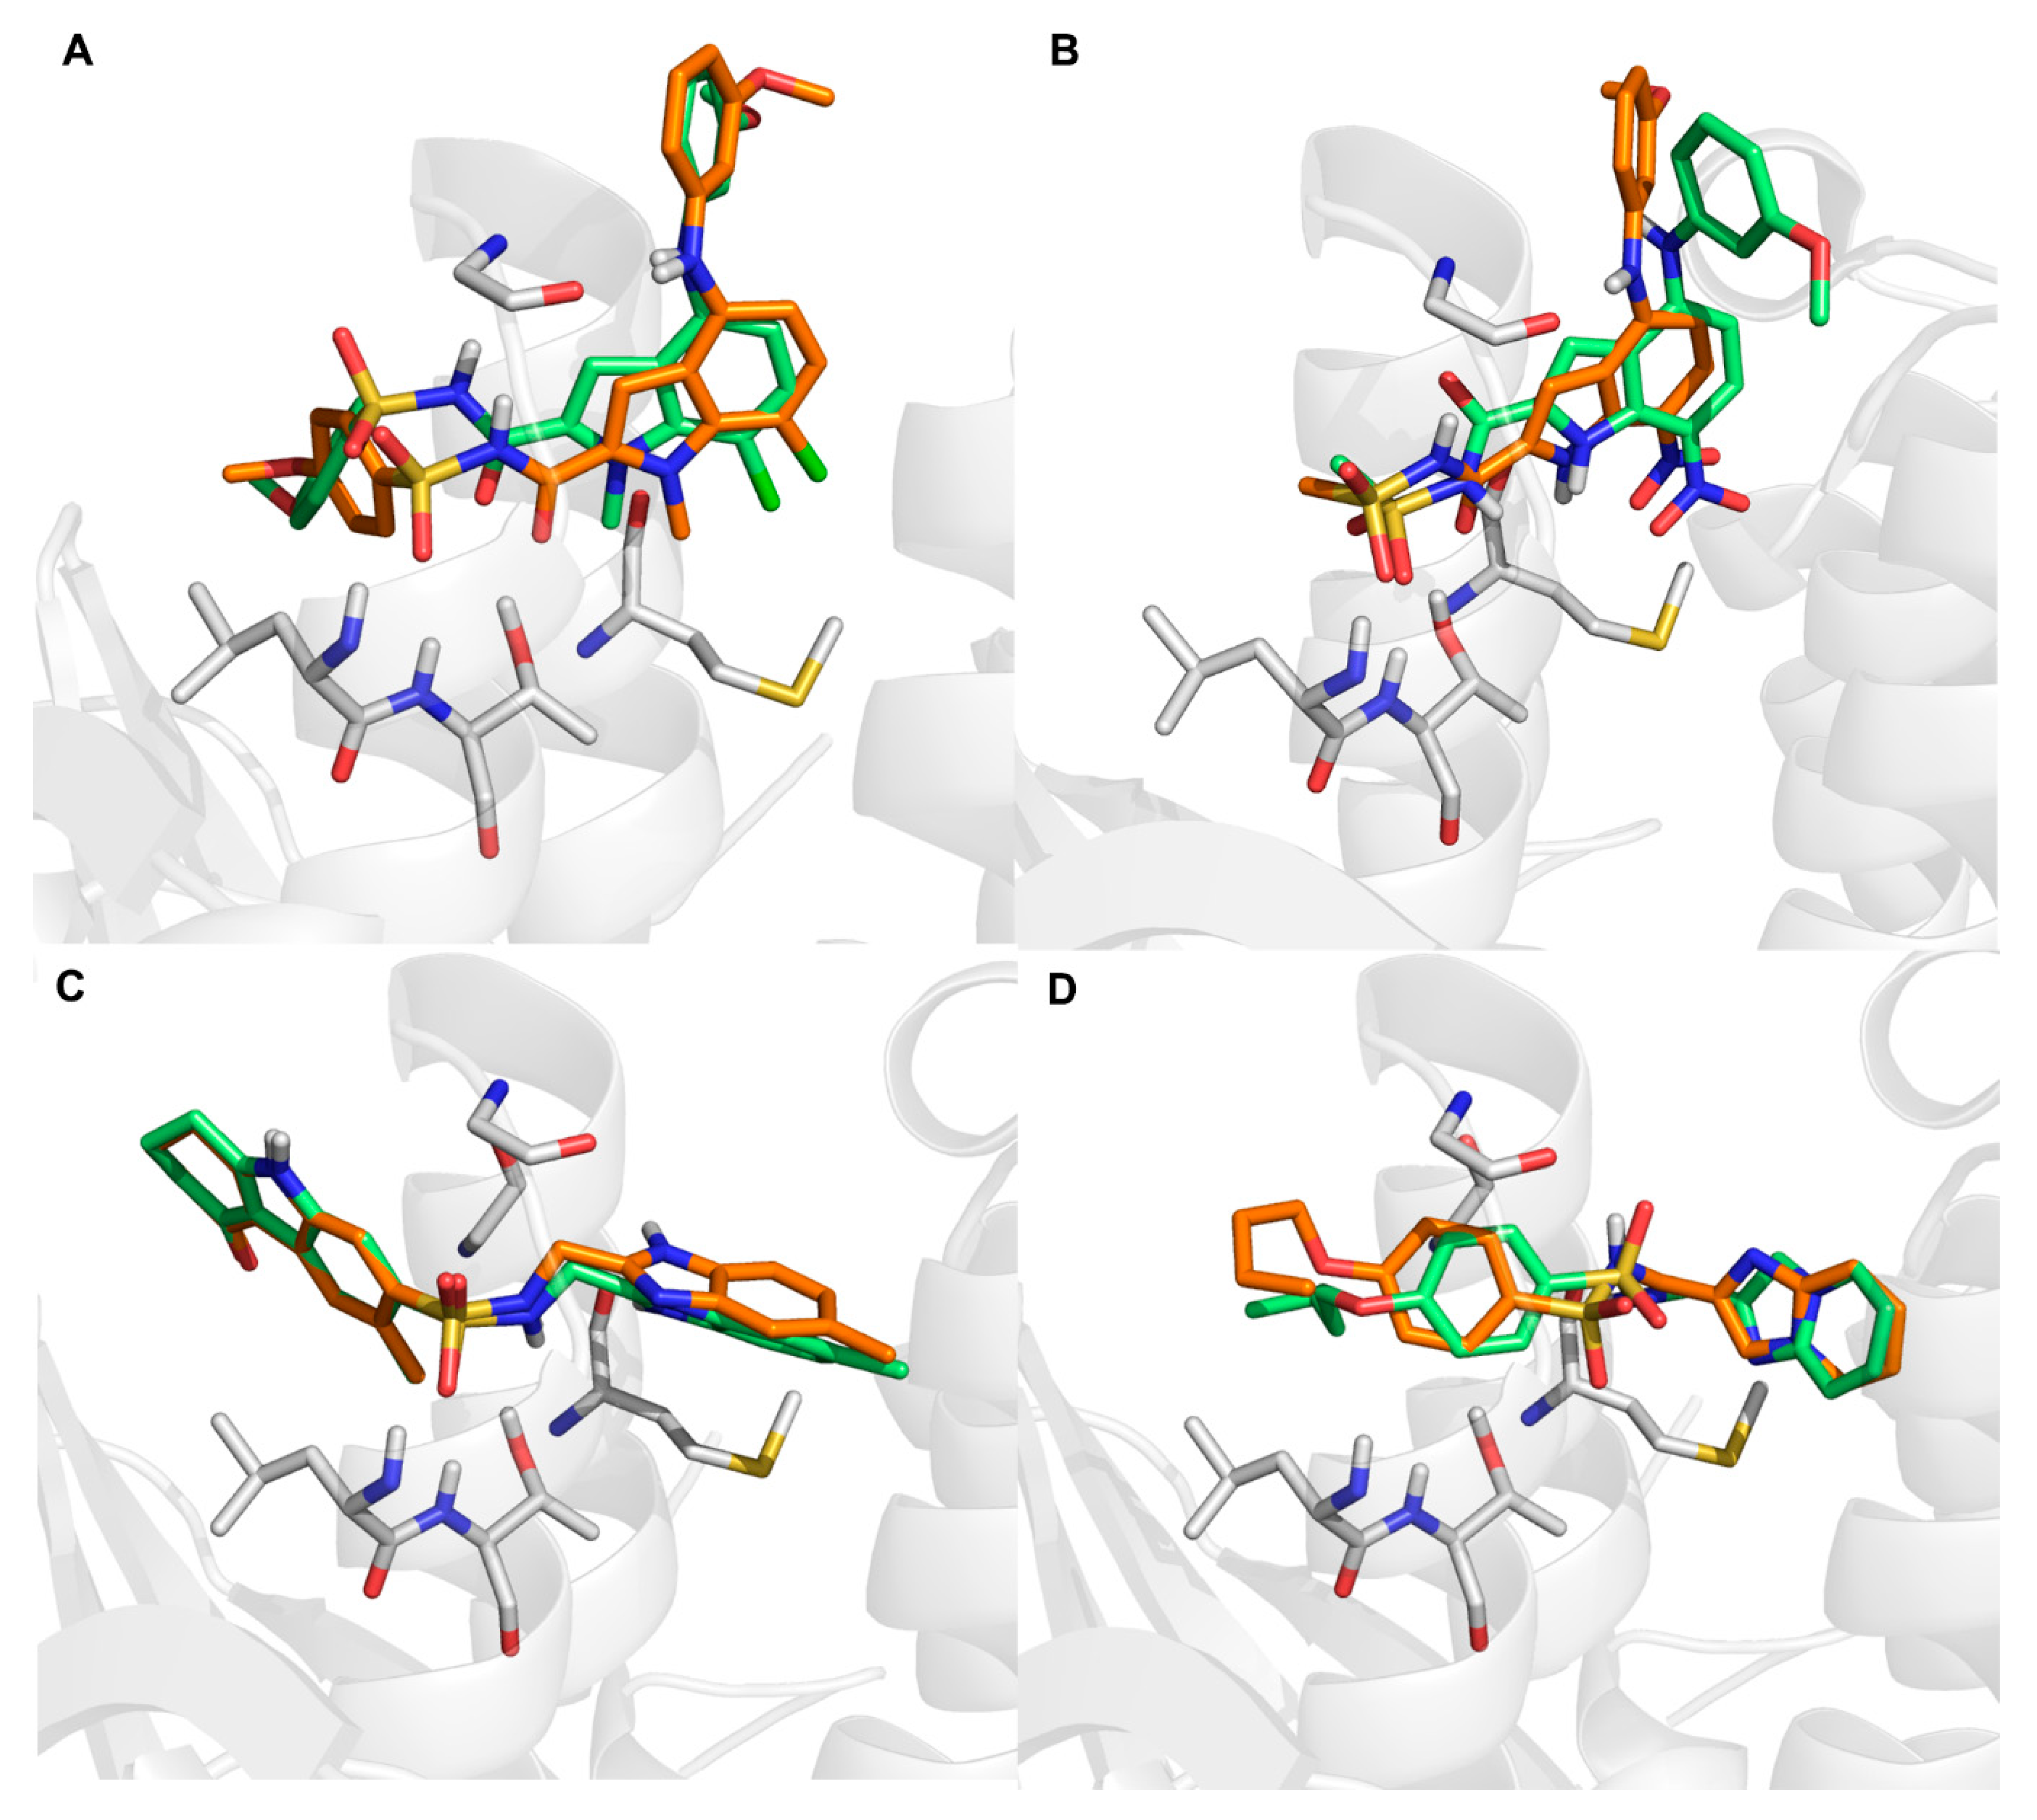
2.5. Molecular Docking
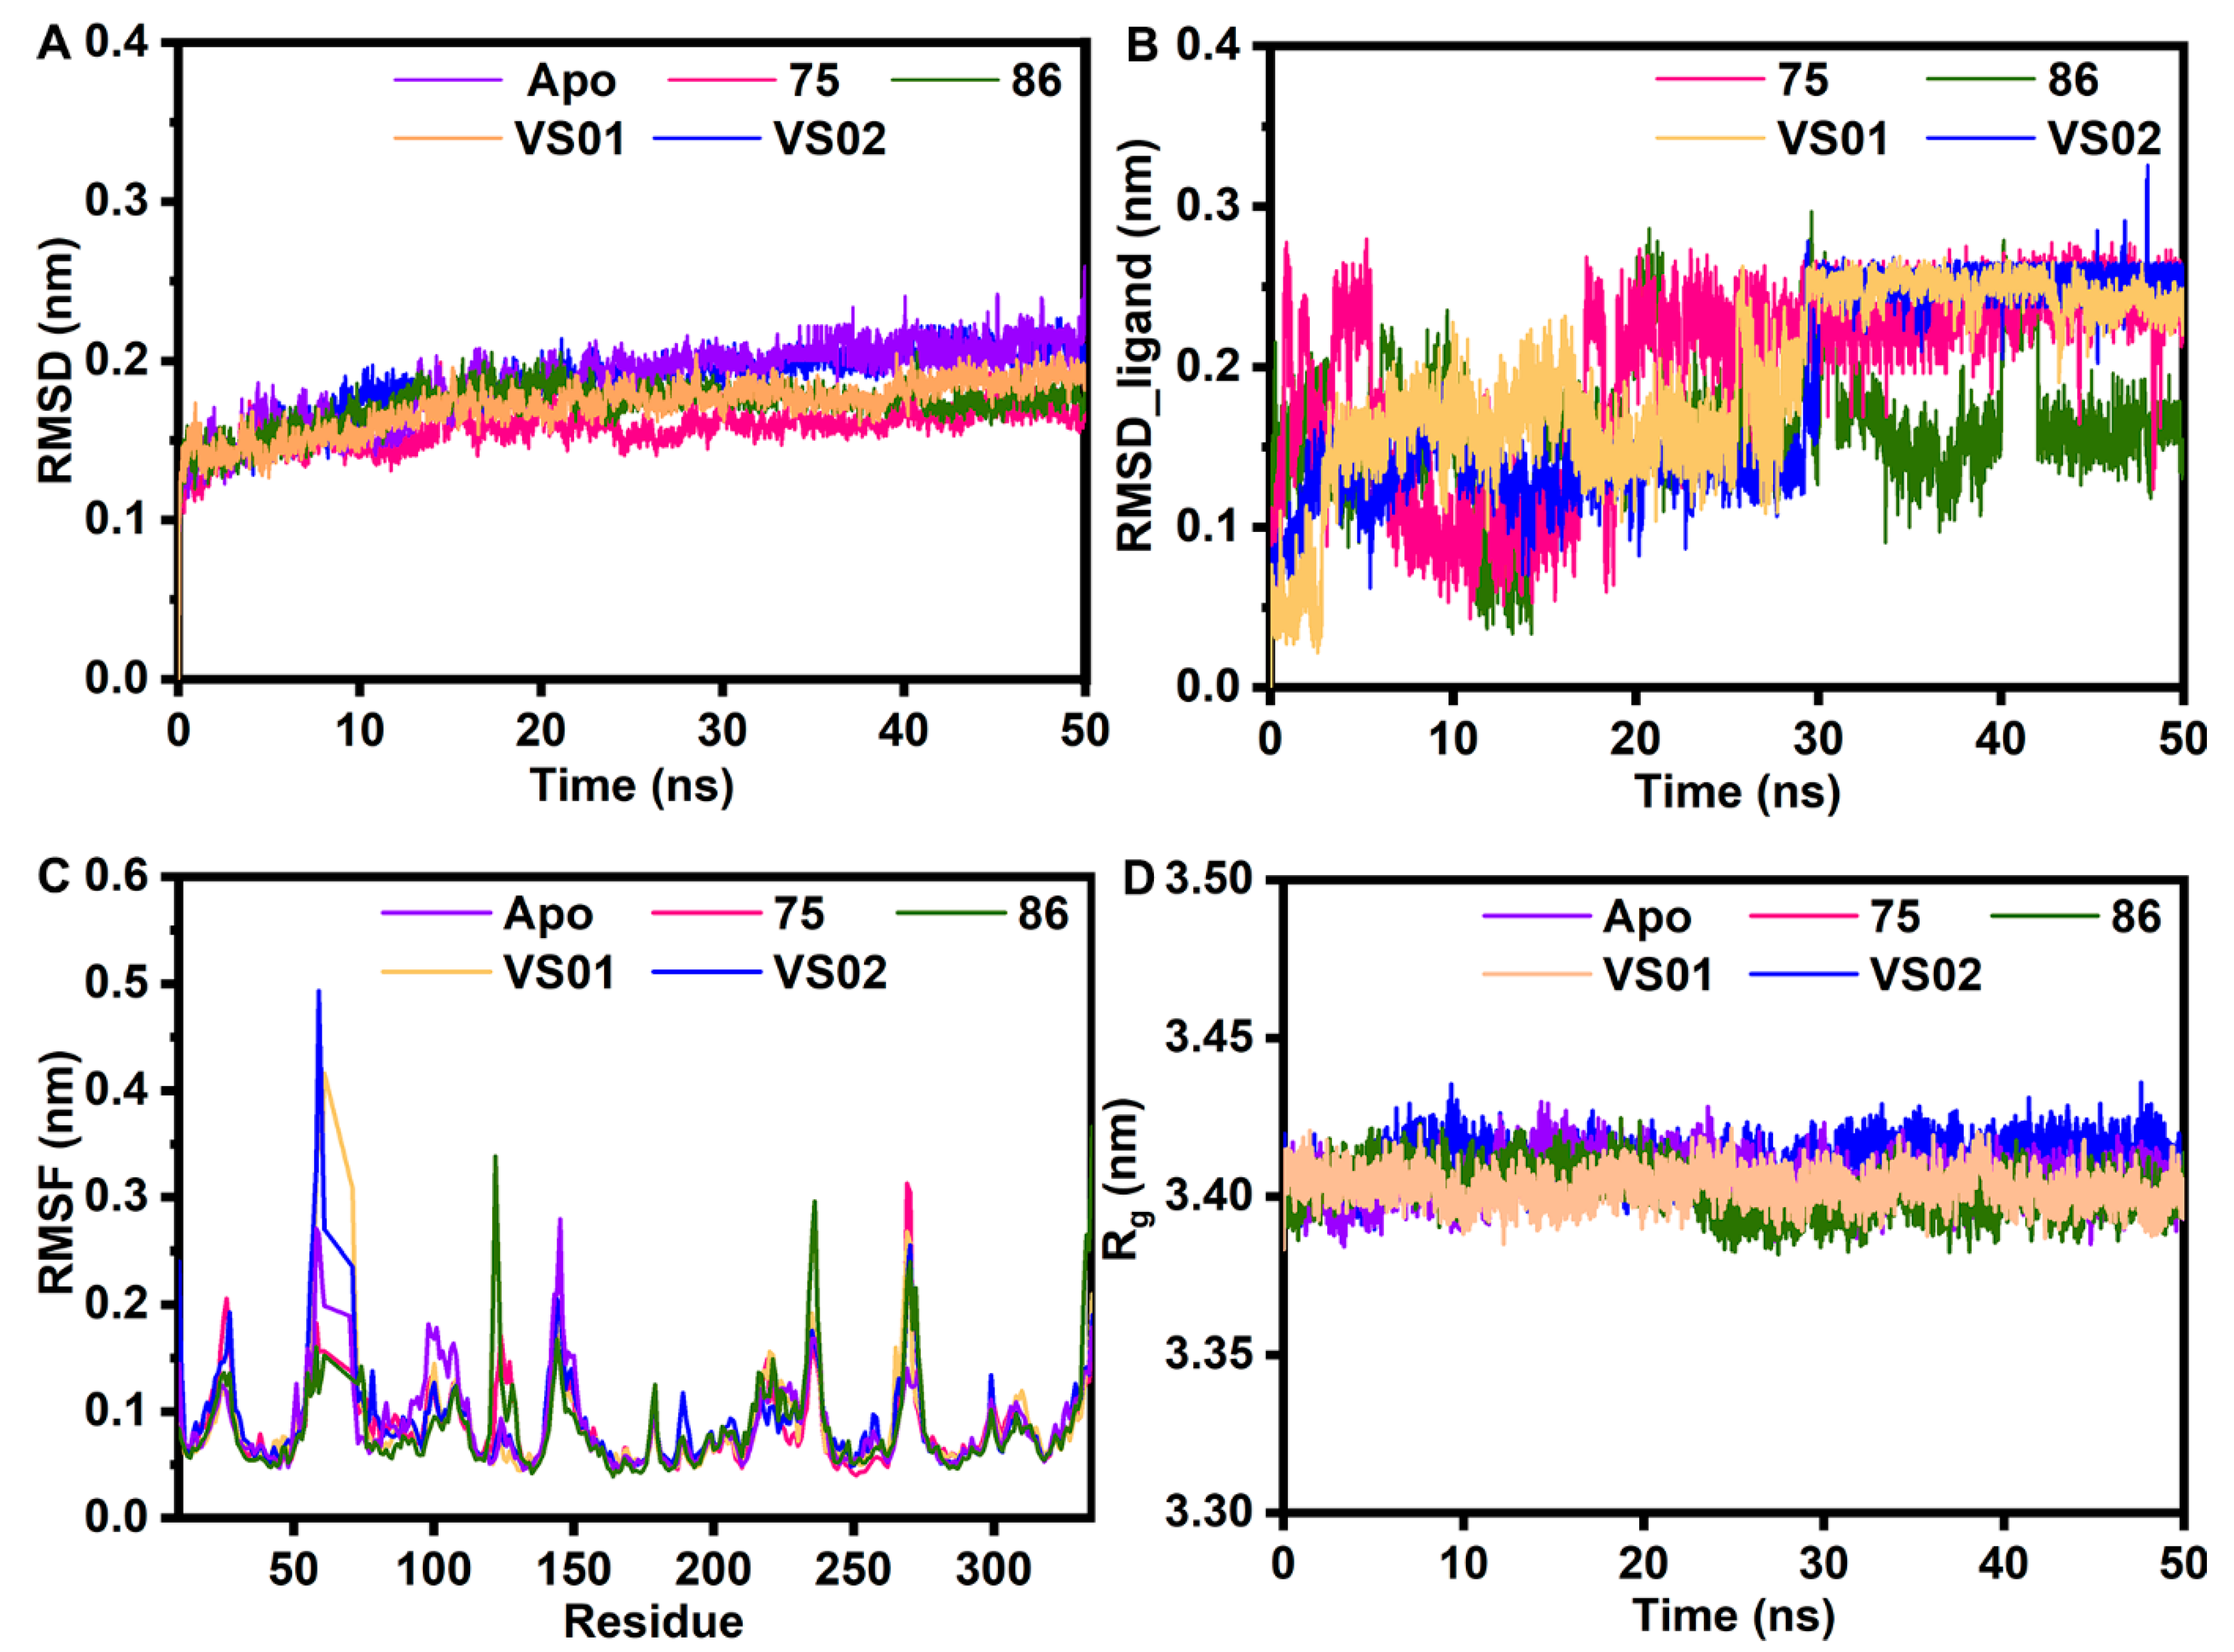
2.6. MD Simulation
3. Materials and Methods
3.1. Dataset and Optimization
3.2. 3D-QSAR Study
3.3. Pharmacophore Modeling
3.4. Molecular Docking
3.5. Virtual Screening
3.6. MD Simulation
4. Conclusions
Supplementary Materials
Author Contributions
Funding
Institutional Review Board Statement
Informed Consent Statement
Data Availability Statement
Conflicts of Interest
References
- Matsunaga, M.; Chen, J.; Jijiwa, M.; Lim, E. The impact of diabetes and osteoarthritis on the occurrence of stroke, acute myocardial infarction, and heart failure among older adults with non-valvular atrial fibrillation in Hawaii: A retrospective observational cohort study. BMC Public Health 2021, 21, 1183. [Google Scholar] [CrossRef] [PubMed]
- Summers-Gibson, L. The relationships between diabetes self-care, diabetes time management, and diabetes distress in women with type 2 diabetes mellitus. Sci. Diabetes Self-Manag. Care 2021, 47, 245–254. [Google Scholar] [CrossRef] [PubMed]
- Yang, Q.; Sun, J.; Shao, D.; Zhang, H.; Bai, C.; Cao, F. The association between diabetes complications, diabetes distress, and depressive symptoms in patients with type 2 diabetes mellitus. Clin. Nurs. Res. 2020, 30, 293–301. [Google Scholar] [CrossRef] [PubMed]
- Kaur, R.; Dahiya, L.; Kumar, M. Fructose-1,6-bisphosphatase inhibitors: A new valid approach for management of type 2 diabetes mellitus. Eur. J. Med. Chem. 2017, 141, 473–505. [Google Scholar] [CrossRef]
- Porte, D.; Kahn, S. Mechanisms for hyperglycemia in type II diabetes mellitus: Therapeutic implications for sulfonylurea treatment—an update. Am. J. Med. 1991, 90 (Suppl. 1), S8–S14. [Google Scholar] [CrossRef]
- Legouis, D.; Faivre, A.; Cippa, P.; de Seigneux, S. Renal gluconeogenesis: An underestimated role of the kidney in systemic glucose metabolism. Nephrol. Dial. Transplant. 2020, 37, 1417–1425. [Google Scholar] [CrossRef]
- Sharma, R.; Tiwari, S. Renal gluconeogenesis in insulin resistance: A culprit for hyperglycemia in diabetes. World J. Diabetes 2021, 12, 13. [Google Scholar] [CrossRef]
- Hundal, R.; Krssak, M.; Dufour, S.; Laurent, D.; Lebon, V.; Chandramouli, V.; Inzucchi, S.; Schumann, W.; Petersen, K.; Landau, B.; et al. Mechanism by which metformin reduces glucose production in type 2 diabetes. Diabetes 2000, 49, 2063–2069. [Google Scholar] [CrossRef]
- Rendell, M. Current and emerging gluconeogenesis inhibitors for the treatment of Type 2 diabetes. Expert. Opin. Pharmacother. 2021, 22, 2167–2179. [Google Scholar] [CrossRef]
- Yang, J.; Jin, X.; Yan, Y.; Shao, Y.; Pan, Y.; Roberts, L.; Zhang, J.; Huang, H.; Jiang, J. Inhibiting histone deacetylases suppresses glucose metabolism and hepatocellular carcinoma growth by restoring FBP1 expression. Sci. Rep. 2017, 7, 43864. [Google Scholar] [CrossRef] [Green Version]
- Yip, J.; Geng, X.; Shen, J.; Ding, Y. Cerebral Gluconeogenesis and Diseases. Front. Pharmacol. 2016, 7, 521. [Google Scholar] [CrossRef]
- Lan, P.; Wu, Z.; Chen, W.; Sun, P.; Chen, W. Molecular modeling studies on phosphonic acid-containing thiazole derivatives: Design for fructose-1,6-bisphosphatase inhibitors. J. Mol. Model. 2012, 18, 973–990. [Google Scholar] [CrossRef]
- Heng, S.; Harris, K.; Kantrowitz, E. Designing inhibitors against fructose 1,6-bisphosphatase: Exploring natural products for novel inhibitor scaffolds. Eur. J. Med. Chem. 2010, 45, 1478–1484. [Google Scholar] [CrossRef] [PubMed]
- Dang, Q.; Liu, Y.; Cashion, D.; Kasibhatla, S.; Jiang, T.; van Poelje, P.; Potter, S.; Erion, M. Discovery of a series of phosphonic acid-containing thiazoles and orally bioavailable diamide prodrugs that lower glucose in diabetic animals through inhibition of fructose-1,6-bisphosphatase. J. Med. Chem. 2011, 1, 153–165. [Google Scholar] [CrossRef] [PubMed]
- Penhoat, A.; Fayard, L.; Stefanutti, A.; Mithieux, G.; Rajas, F. Intestinal gluconeogenesis is crucial to maintain a physiological fasting glycemia in the absence of hepatic glucose production in mice. Metabolism 2014, 63, 104–111. [Google Scholar] [CrossRef]
- Gizak, A.; Duda, P.; Wisniewski, J.; Rakus, D. Fructose-1,6-bisphosphatase: From a glucose metabolism enzyme to multifaceted regulator of a cell fate. Adv. Biol. Regul. 2019, 72, 41–50. [Google Scholar] [CrossRef] [PubMed]
- Han, X.; Huang, Y.; Wei, L.; Chen, H.; Guo, Y.; Tang, Z.; Hu, W.; Xia, Q.; Wang, Q.; Yan, J.; et al. Biological evaluation and SAR analysis of novel covalent inhibitors against fructose-1,6-bisphosphatase. Bioorg. Med. Chem. 2020, 28, 115624. [Google Scholar] [CrossRef]
- Bie, J.; Liu, S.; Li, Z.; Mu, Y.; Xu, B.; Shen, Z. Discovery of novel indole derivatives as allosteric inhibitors of fructose-1,6-bisphosphatase. Eur. J. Med. Chem. 2015, 90, 394–405. [Google Scholar] [CrossRef]
- Han, X.; Huang, Y.; Zhang, R.; Xiao, S.; Zhu, S.; Qin, N.; Hong, Z.; Wei, L.; Feng, J.; Ren, Y.; et al. New insight into the binding modes of TNP-AMP to human liver fructose-1,6-bisphosphatase. Spectrochim. Acta. A Mol. Biomol. Spectrosc. 2016, 165, 155–160. [Google Scholar] [CrossRef]
- Mutyala, R.; Reddy, R.; Sumakanth, M.; Reddanna, P.; Reddy, M. Calculation of relative binding affinities of fructose 1,6-bisphosphatase mutants with adenosine monophosphate using free energy perturbation method. J. Comput. Chem. 2007, 28, 932–937. [Google Scholar] [CrossRef]
- Zhang, Y.; Xie, Z.; Zhou, G.; Zhang, H.; Lu, J.; Zhang, W. Fructose-1,6-bisphosphatase regulates glucose-stimulated insulin secretion of mouse pancreatic beta-cells. Endocrinology 2010, 151, 4688–4695. [Google Scholar] [CrossRef] [PubMed]
- van Poelje, P.; Potter, S.; Erion, M. Fructose-1, 6-bisphosphatase inhibitors for reducing excessive endogenous glucose production in type 2 diabetes. Handb. Exp. Pharmacol. 2011, 203, 279–301. [Google Scholar] [CrossRef]
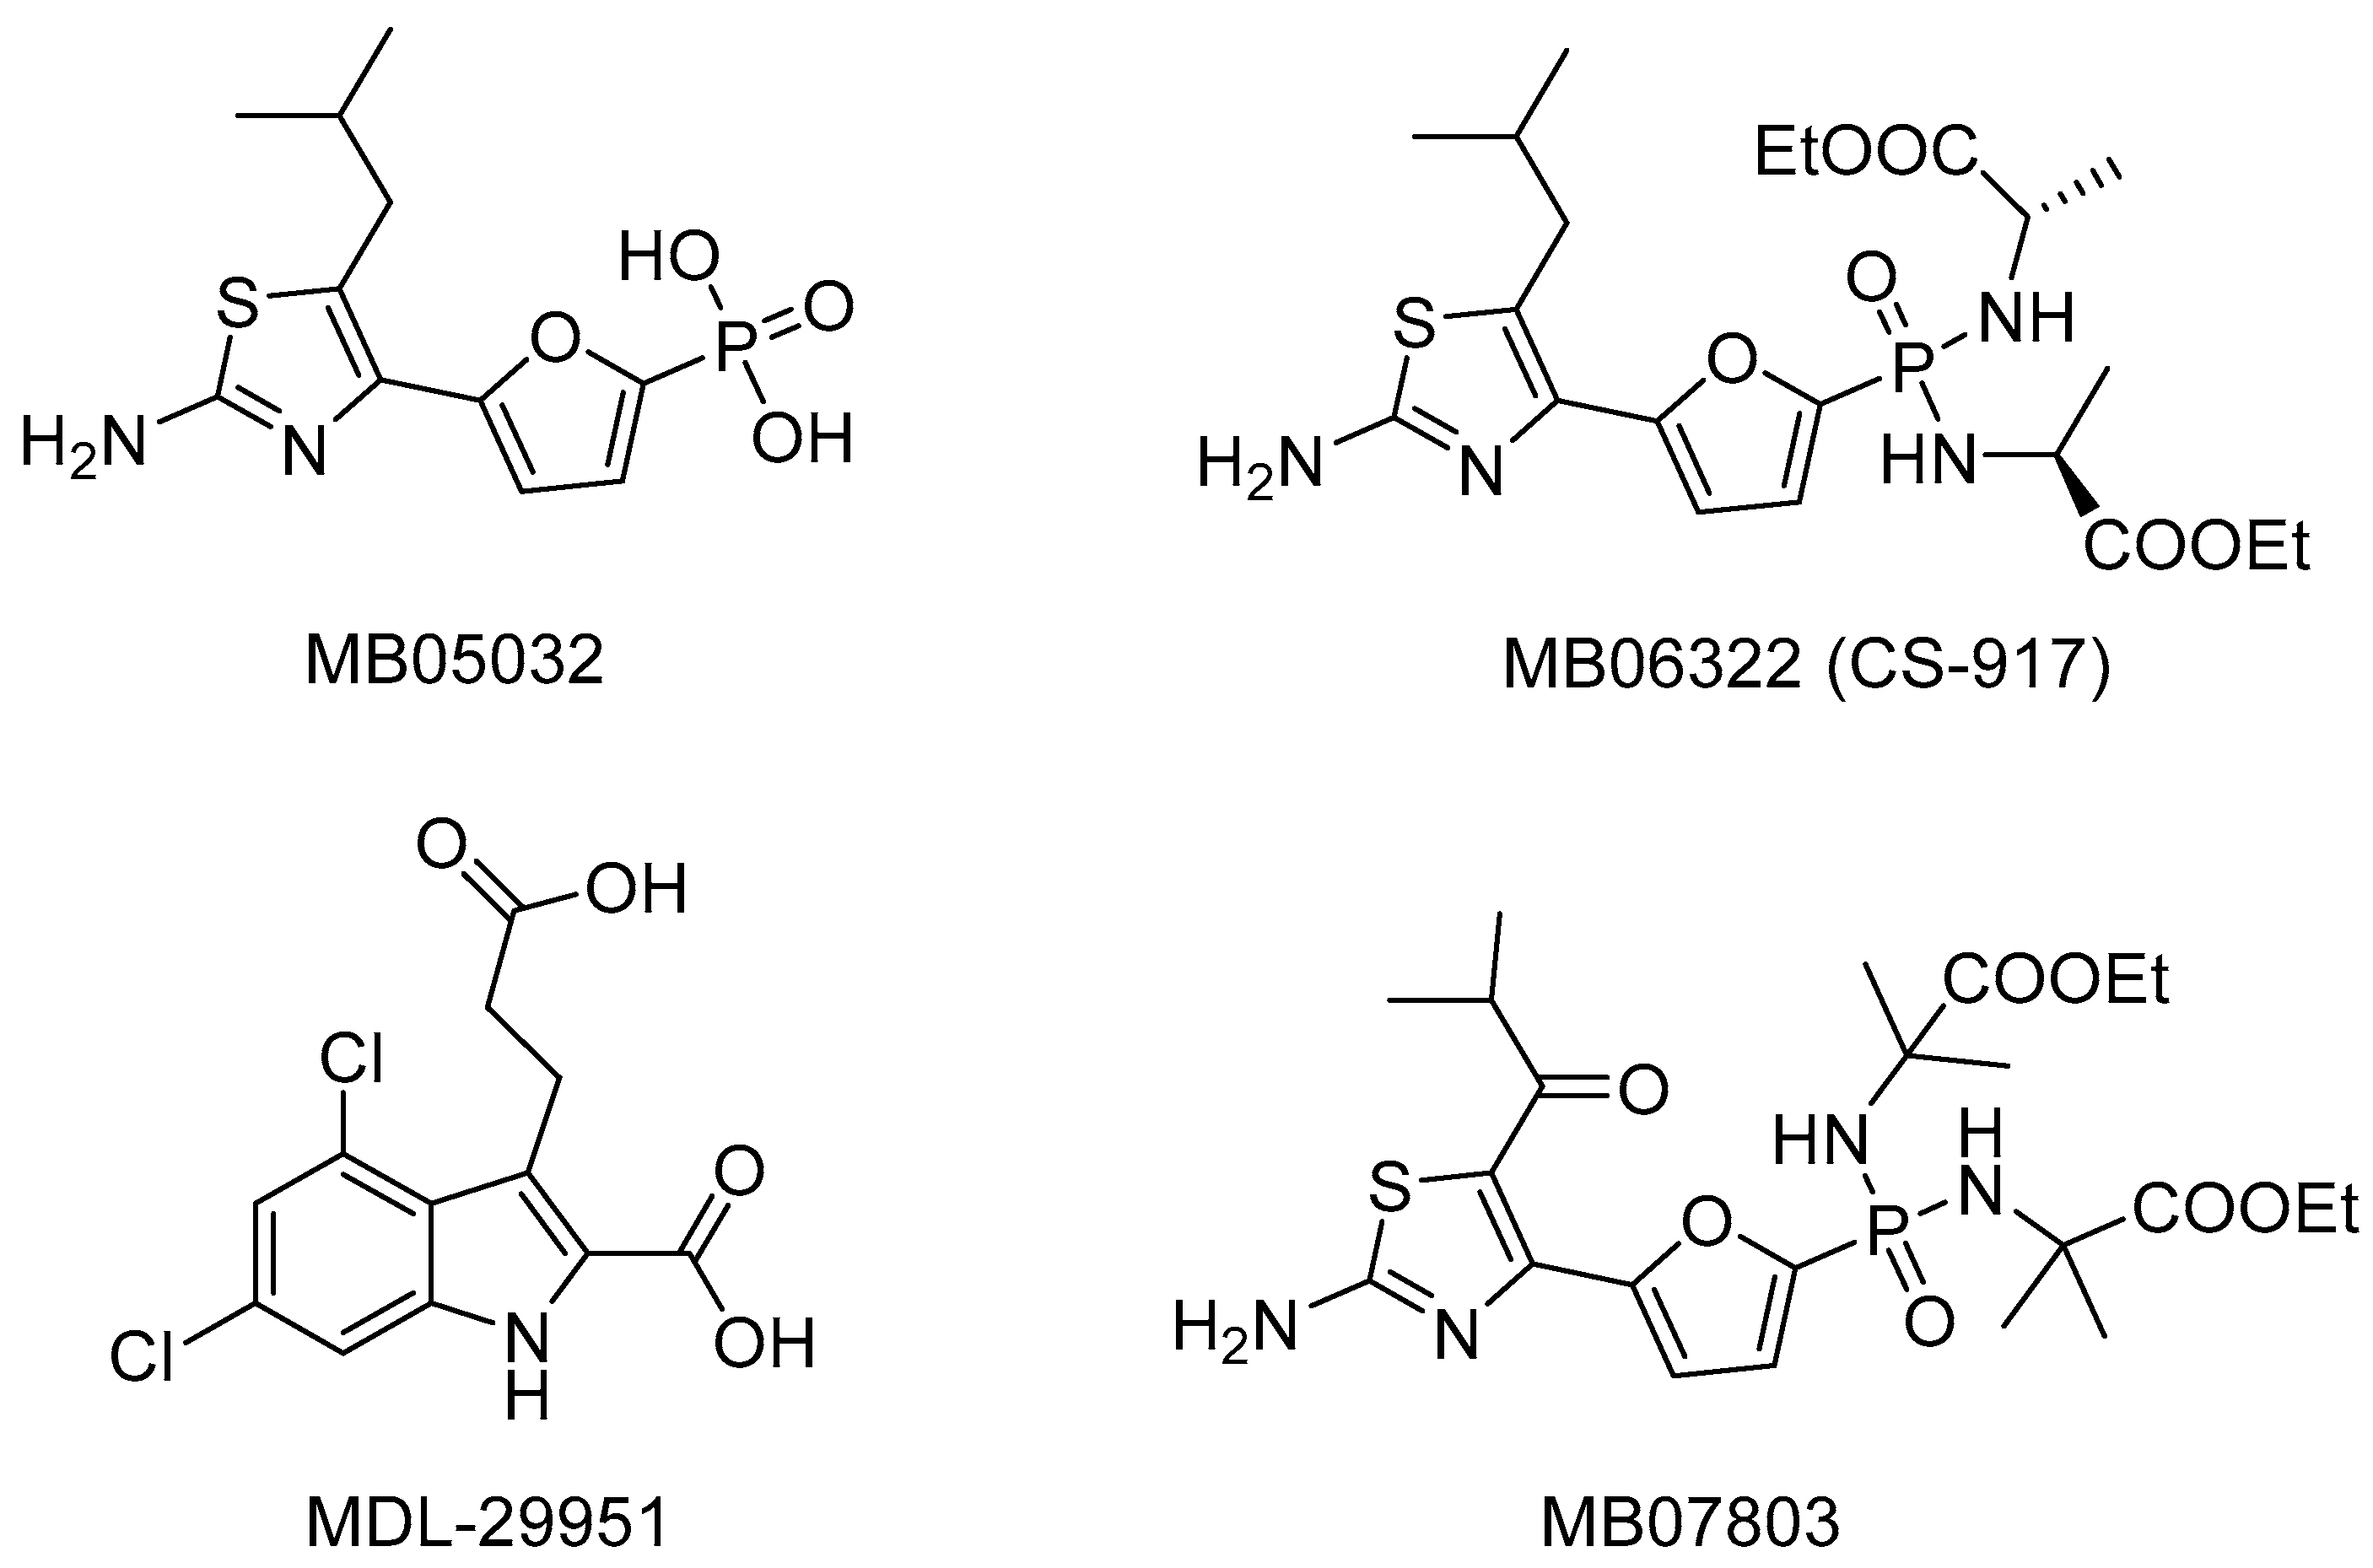
- Erion, M.; van Poelje, P.; Dang, Q.; Kasibhatla, S.; Potter, S.; Reddy, M.; Reddy, K.; Jiang, T.; Lipscomb, W. MB06322 (CS-917): A potent and selective inhibitor of fructose 1,6-bisphosphatase for controlling gluconeogenesis in type 2 diabetes. Proc. Natl. Acad. Sci. USA 2005, 102, 7970–7975. [Google Scholar] [CrossRef] [PubMed]
- Wright, S.; Carlo, A.; Danley, D.; Hageman, D.; Karam, G.; Mansour, M.; McClure, L.; Pandit, J.; Schulte, G.; Treadway, J.; et al. 3-(2-Carboxy-ethyl)-4,6-dichloro-1H-indole-2-carboxylic acid: An allosteric inhibitor of fructose-1,6-bisphosphatase at the AMP site. Bioorg. Med. Chem. Lett. 2003, 13, 2055–2058. [Google Scholar] [CrossRef]
- Rosini, M.; Mancini, F.; Tarozzi, A.; Colizzi, F.; Andrisano, V.; Bolognesi, M.; Hrelia, P.; Melchiorre, C. Design, synthesis, and biological evaluation of substituted 2,3-dihydro-1H-cyclopen-ta[b] quinolin-9-ylamine related compounds as fructose-1,6-bisphosphatase inhibitors. Bioorg. Med. Chem. Lett. 2006, 14, 7846–7853. [Google Scholar] [CrossRef] [PubMed]
- Wright, S.; Hageman, D.; Mcclure, L.; Carlo, A.; Treadway, J.; Mathiowetz, A.; Withka, J.; Bauer, P. Allosteric inhibition of fructose-1,6-bisphosphatase by anilinoquinazolines. Bioorg. Med. Chem. Lett. 2001, 1, 17–21. [Google Scholar] [CrossRef]
- Zhou, J.; Bie, J.; Wang, X.; Liu, Q.; Li, R.; Chen, H.; Hu, J.; Cao, H.; Ji, W.; Li, Y.; et al. Discovery of N-arylsulfonyl-indole-2-carboxamide derivatives as potent, selective, and orally bioavailable fructose-1,6-bisphosphatase inhibitors-design, synthesis, in vivo glucose lowering effects, and X-ray crystal complex analysis. J. Med. Chem. 2020, 63, 10307–10329. [Google Scholar] [CrossRef]
- Walters, W. Going further than Lipinski’s rule in drug design. Expert Opin. Drug Discov. 2012, 7, 99–107. [Google Scholar] [CrossRef]
- Baba, Y.; Isomura, T.; Kashima, H. Wisdom of crowds for synthetic accessibility evaluation. J. Mol. Graph. Model. 2018, 80, 217–223. [Google Scholar] [CrossRef]
- Bie, J.; Liu, S.; Zhou, J.; Xu, B.; Shen, Z. Design, synthesis and biological evaluation of 7-nitro-1H-indole-2-carboxylic acid derivatives as allosteric inhibitors of fructose-1,6-bisphosphatase. Bioorg. Med. Chem. 2014, 22, 1850–1862. [Google Scholar] [CrossRef]
- Chen, Z.; Pei, J.; Rui, L.; Xiao, F. Performance characteristics of asphalt materials based on molecular dynamics simulation–A review. Constr. Build. Mater. 2018, 189, 695–710. [Google Scholar] [CrossRef]
- Kato, K.; Nakayoshi, T.; Kurimoto, E.; Oda, A. Molecular dynamics simulations for the protein-ligand complex structures obtained by computational docking studies using implicit or explicit solvents. Chem. Phys. Lett. 2021, 781, 139022. [Google Scholar] [CrossRef]
- Rakhshani, H.; Dehghanian, E.; Rahati, A. Enhanced GROMACS: Toward a better numerical simulation framework. J. Mol. Model. 2019, 25, 355. [Google Scholar] [CrossRef]
- Wang, C.; Zhai, N.; Zhao, Y.; Wu, F.; Luo, X.; Ju, X.; Liu, G.; Liu, H. Exploration of novel hepatitis B virus capsid assembly modulators by integrated molecular simulations. ChemistrySelect 2021, 6, 12524–12536. [Google Scholar] [CrossRef]
- Bush, B.; Nachbar, R. Sample-distance partial least squares: PLS optimized for many variables, with application to CoMFA. J. Comput. Aided Mol. Des. 1993, 7, 587–619. [Google Scholar] [CrossRef]
- Li, M.; Wei, D.; Zhao, H.; Du, Y. Genotoxicity of quinolones: Substituents contribution and transformation products QSAR evaluation using 2D and 3D models. Chemosphere 2014, 95, 220–226. [Google Scholar] [CrossRef]
- Liu, G.; Wang, W.; Wan, Y.; Ju, X.; Gu, S. Application of 3D-QSAR, Pharmacophore, and Molecular Docking in the Molecular Design of Diarylpyrimidine Derivatives as HIV-1 Nonnucleoside Reverse Transcriptase Inhibitors. Int. J. Mol. Sci. 2018, 19, 1436. [Google Scholar] [CrossRef]
- Chen, Y.; Gao, Y.; Wu, F.; Luo, X.; Ju, X.; Liu, G. Computationally exploring novel xanthine oxidase inhibitors using docking-based 3D-QSAR, molecular dynamics, and virtual screening. New J. Chem. 2020, 44, 19276–19287. [Google Scholar] [CrossRef]
- Zhai, N.; Wang, C.; Wu, F.; Xiong, L.; Luo, X.; Ju, X.; Liu, G. Exploration of novel xanthine oxidase inhibitors based on 1,6-dihydropyrimidine-5-carboxylic acids by an integrated in silico Study. Int. J. Mol. Sci. 2021, 22, 8122. [Google Scholar] [CrossRef]
- Gao, Y.; Chen, Y.; Tian, Y.; Zhao, Y.; Wu, F.; Luo, X.; Ju, X.; Liu, G. In silico study of 3-hydroxypyrimidine-2,4-diones as inhibitors of HIV RT-associated RNase H using molecular docking, molecular dynamics, 3D-QSAR, and pharmacophore models. New J. Chem. 2019, 43, 17004–17017. [Google Scholar] [CrossRef]
- Mysinger, M.; Carchia, M.; Irwin, J.; Shoichet, B. Directory of useful decoys, enhanced (DUD-E): Better ligands and decoys for better benchmarking. J. Med. Chem. 2012, 55, 6582–6594. [Google Scholar] [CrossRef] [PubMed]
- Kalva, S.; Singam, E.; Rajapandian, V.; Saleena, L.; Subramanian, V. Discovery of potent inhibitor for matrix metalloproteinase-9 by pharmacophore based modeling and dynamics simulation studies. J. Mol. Graph. Model. 2014, 49, 25–37. [Google Scholar] [PubMed]
- Tian, Y.; Gao, Y.; Chen, Y.; Liu, G.; Ju, X. Identification of the fipronil resistance associated mutations in nilaparvata lugens GABA receptors by molecular modeling. Molecules 2019, 24, 4116. [Google Scholar] [CrossRef]
- Halperin, I.; Ma, B.; Wolfson, H.; Nussinov, R. Principles of docking: An overview of search algorithms and a guide to scoring functions. Proteins: Struct. Funct. Bioinform. 2002, 47, 409–443. [Google Scholar] [CrossRef] [PubMed]
- Malik, N.; Dhiman, P.; Khatkar, A. In silico and 3D-QSAR studies of natural based derivatives as xanthine oxidase inhibitors. Curr. Top. Med. Chem. 2019, 19, 123–138. [Google Scholar] [CrossRef]
- Gao, Y.; Zhang, Y.; Wu, F.; Pei, J.; Luo, X.; Ju, X.; Zhao, C.; Liu, G. Exploring the interaction mechanism of desmethyl-broflanilide in insect GABA receptors and screening potential antagonists by in silico simulations. J. Agric. Food Chem. 2020, 68, 14768–14780. [Google Scholar] [CrossRef] [PubMed]
- Daina, A.; Michielin, O.; Zoete, V. SwissADME: A free web tool to evaluate pharmacokinetics, drug-likeness and medicinal chemistry friendliness of small molecules. Sci. Rep. 2017, 7, 42717. [Google Scholar] [CrossRef]
- Pires, D.; Blundell, T.; Ascher, D. pkCSM: Predicting small-molecule pharmacokinetic and toxicity properties using graph-based signatures. J. Med. Chem. 2015, 58, 4066–4072. [Google Scholar] [CrossRef]
- Salsbury, F. Molecular dynamics simulations of protein dynamics and their relevance to drug discovery. Curr. Opin. Pharmacol. 2010, 10, 738–744. [Google Scholar] [CrossRef]
- Siuda, I.; Baoukina, S.; Tieleman, D. Molecular dynamics studies on structural changes in NK-lysin and saposins A, C, and D. Biophys. J. 2014, 106, 51a. [Google Scholar] [CrossRef] [Green Version]
- Vlachakis, D.; Bencurova, E.; Papangelopoulos, N.; Kossida, S. Current state-of-the-art molecular dynamics methods and applications. Adv. Protein Chem. Struct. Biol. 2014, 94, 269–313. [Google Scholar] [PubMed]
- Fogolari, F.; Brigo, A.; Molinari, H. Protocol for MM/PBSA molecular dynamics simulations of proteins. Biophys. J. 2003, 85, 159–166. [Google Scholar] [CrossRef]
- Kumari, R.; Kumar, R.; Lynn, A. g_mmpbsa—A GROMACS tool for high-throughput MM-PBSA calculations. J. Chem. Inf. Model. 2014, 54, 1951–1962. [Google Scholar] [CrossRef] [PubMed]
- Zhu, T.; Lee, H.; Lei, H.; Jones, C.; Patel, K.; Johnson, M.; Hevener, K. Fragment-based drug discovery using a multidomain, parallel MD-MM/PBSA screening protocol. J. Chem. Inf. Model. 2013, 53, 560–572. [Google Scholar] [CrossRef] [Green Version]


| Model | q2 | ONC | SEE | R2 | F | Field Contributions (%) | |||||
|---|---|---|---|---|---|---|---|---|---|---|---|
| S | E | H | D | A | |||||||
| CoMFA | S + E | 0.709 | 8 | 0.097 | 0.979 | 391.215 | 0.720 | 0.280 | |||
| CoMSIA | S + E + D + A | 0.716 | 9 | 0.100 | 0.978 | 255.130 | 0.210 | 0.453 | 0.164 | 0.173 | |
| S + E + H + D + A | 0.688 | 7 | 0.137 | 0.957 | 169.816 | 0.174 | 0.396 | 0.159 | 0.164 | 0.107 | |
| S + E + H + D | 0.680 | 8 | 0.108 | 0.974 | 242.510 | 0.191 | 0.444 | 0.200 | 0.165 | ||
| S + H + D + A | 0.674 | 10 | 0.127 | 0.965 | 129.665 | 0.310 | 0.292 | 0.231 | 0.167 | ||
| E + H + D + A | 0.656 | 7 | 0.151 | 0.948 | 139.441 | 0.482 | 0.194 | 0.200 | 0.165 | ||
| S + E + H + A | 0.645 | 8 | 0.111 | 0.972 | 229.649 | 0.207 | 0.472 | 0.201 | 0.120 | ||
| S + E + D | 0.709 | 8 | 0.125 | 0.965 | 197.980 | 0.250 | 0.572 | 0.178 | |||
| S + E + A | 0.684 | 8 | 0.109 | 0.974 | 240.297 | 0.251 | 0.551 | 0.198 | |||
| E + H + D | 0.647 | 9 | 0.106 | 0.975 | 224.324 | 0.543 | 0.268 | 0.189 | |||
| S + E + H | 0.632 | 7 | 0.132 | 0.961 | 185.138 | 0.233 | 0.563 | 0.204 | |||
| S + H + A | 0.628 | 9 | 0.144 | 0.955 | 120.028 | 0.404 | 0.362 | 0.234 | |||
| S + H + D | 0.608 | 8 | 0.114 | 0.940 | 101.829 | 0.374 | 0.322 | 0.303 | |||
| E + D | 0.702 | 8 | 0.157 | 0.945 | 111.999 | 0.779 | 0.221 | ||||
| S + E | 0.682 | 6 | 0.171 | 0.932 | 123.398 | 0.284 | 0.716 | ||||
| Parameters | rpre2 | k | k′ | rm2 | rm′2 | RMSE | MAE | |||
|---|---|---|---|---|---|---|---|---|---|---|
| CoMFA | 0.932 | 0.994 | 1.006 | 0.001 | 0.003 | 0.901 | 0.879 | 0.890 | 0.136 | 0.227 |
| CoMSIA | 0.890 | 0.996 | 1.003 | 0.051 | 0.012 | 0.720 | 0.821 | 0.770 | 0.173 | 0.223 |
| Name | SPECIFICITY | N_HITS | FEATS | PARETO | ENERGY | STERICS | HBOND | MOL_QRY |
|---|---|---|---|---|---|---|---|---|
| MODEL_01 | 3.439 | 7 | 10 | 0 | 375.51 | 2500.6 | 730.9 | 213.08 |
| MODEL_02 | 4.480 | 5 | 9 | 0 | 1066.94 | 2531.6 | 729.7 | 253.40 |
| MODEL_03 | 3.410 | 7 | 9 | 0 | 31.81 | 2210.7 | 694.3 | 146.23 |
| MODEL_04 | 4.327 | 8 | 9 | 0 | 68.89 | 2241.9 | 716.2 | 184.60 |
| MODEL_05 | 4.113 | 7 | 10 | 0 | 40.75 | 2092 | 694.8 | 210.56 |
| MODEL_06 | 3.475 | 5 | 10 | 0 | 57.5 | 2456.3 | 688.6 | 195.00 |
| MODEL_07 | 4.661 | 8 | 9 | 0 | 210.92 | 2459.1 | 728.9 | 171.08 |
| MODEL_08 | 4.001 | 6 | 12 | 0 | 714.62 | 2523.8 | 652.8 | 296.56 |
| MODEL_09 | 4.328 | 7 | 9 | 0 | 487.87 | 2358 | 734.5 | 172.41 |
| MODEL_10 | 4.681 | 7 | 8 | 0 | 173.61 | 2459.1 | 716.6 | 107.49 |
| No. | Structure | Total Score |
|---|---|---|
| 75 |  | 7.08 |
| 86 | 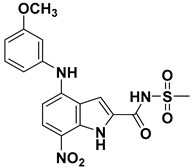 | 4.74 |
| VS01 | 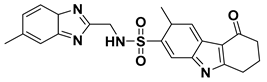 | 7.85 |
| VS02 | 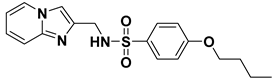 | 6.98 |
| VS03 | 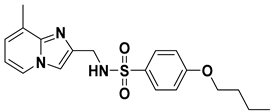 | 6.12 |
| System | FBPase-75 | FBPase-86 | FBPase-VS01 | FBPase-VS02 |
|---|---|---|---|---|
| van der Waal energy | −143.12 ± 7.43 | −74.52 ± 4.41 | −181.10 ± 5.94 | −145.09 ± 12.29 |
| Electrostatic energy | −68.41 ± 8.80 | −34.62 ± 5.47 | −61.10 ± 9.40 | −46.80 ± 13.98 |
| Polar solvation energy | 145.28 ± 10.45 | 81.69 ± 7.72 | 153.16 ± 13.12 | 111.41 ± 23.14 |
| SASA energy | −16.49 ± 0.96 | −15.42 ± 3.13 | −18.38 ± 0.99 | −16.92 ± 0.83 |
| Binding free energy | −82.73 ± 8.60 | −42.87 ± 6.31 | −107.42 ± 10.48 | −97.40 ± 16.10 |
Publisher’s Note: MDPI stays neutral with regard to jurisdictional claims in published maps and institutional affiliations. |
© 2022 by the authors. Licensee MDPI, Basel, Switzerland. This article is an open access article distributed under the terms and conditions of the Creative Commons Attribution (CC BY) license (https://creativecommons.org/licenses/by/4.0/).
Share and Cite
Zhao, Y.; Yang, H.; Wu, F.; Luo, X.; Sun, Q.; Feng, W.; Ju, X.; Liu, G. Exploration of N-Arylsulfonyl-indole-2-carboxamide Derivatives as Novel Fructose-1,6-bisphosphatase Inhibitors by Molecular Simulation. Int. J. Mol. Sci. 2022, 23, 10259. https://doi.org/10.3390/ijms231810259
Zhao Y, Yang H, Wu F, Luo X, Sun Q, Feng W, Ju X, Liu G. Exploration of N-Arylsulfonyl-indole-2-carboxamide Derivatives as Novel Fructose-1,6-bisphosphatase Inhibitors by Molecular Simulation. International Journal of Molecular Sciences. 2022; 23(18):10259. https://doi.org/10.3390/ijms231810259
Chicago/Turabian StyleZhao, Yilan, Honghao Yang, Fengshou Wu, Xiaogang Luo, Qi Sun, Weiliang Feng, Xiulian Ju, and Genyan Liu. 2022. "Exploration of N-Arylsulfonyl-indole-2-carboxamide Derivatives as Novel Fructose-1,6-bisphosphatase Inhibitors by Molecular Simulation" International Journal of Molecular Sciences 23, no. 18: 10259. https://doi.org/10.3390/ijms231810259
APA StyleZhao, Y., Yang, H., Wu, F., Luo, X., Sun, Q., Feng, W., Ju, X., & Liu, G. (2022). Exploration of N-Arylsulfonyl-indole-2-carboxamide Derivatives as Novel Fructose-1,6-bisphosphatase Inhibitors by Molecular Simulation. International Journal of Molecular Sciences, 23(18), 10259. https://doi.org/10.3390/ijms231810259