
Chromosomal Instability Characterizes Pediatric Medulloblastoma but Is Not Tolerated in the Developing Cerebellum

 , , , , , and
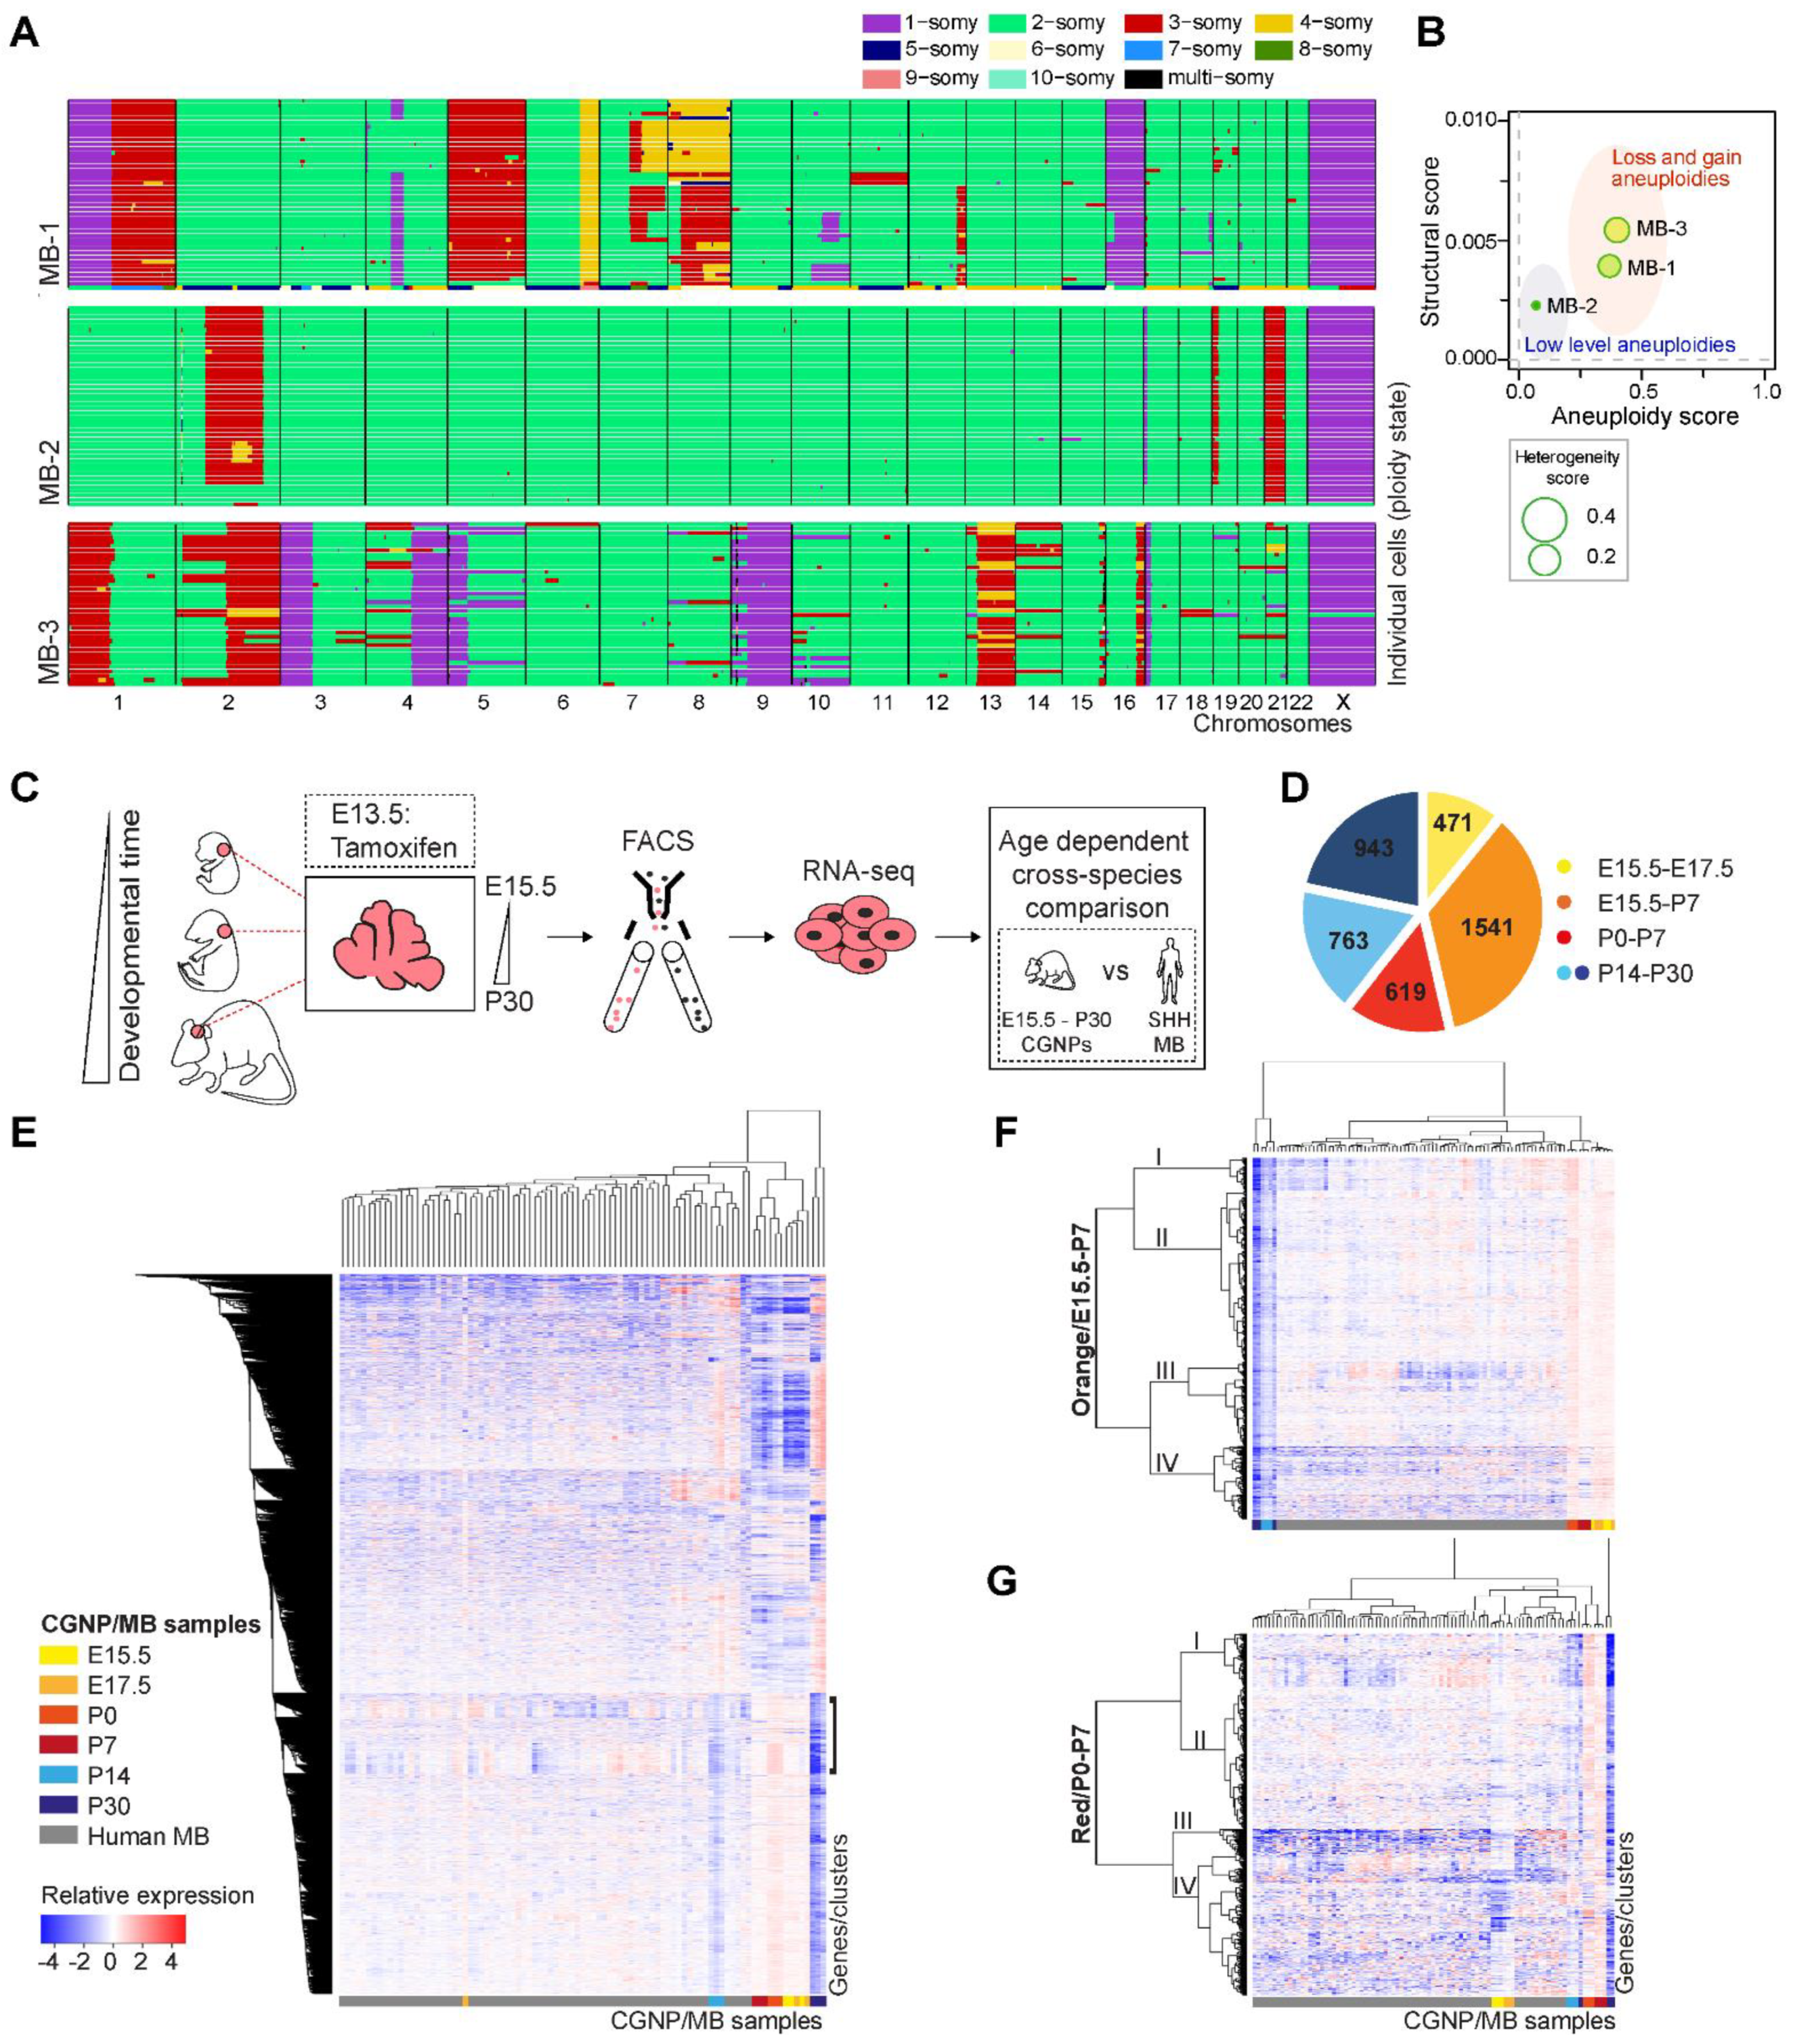
Abstract
:1. Introduction
2. Results
2.1. Single Cell Karyotyping Reveals Genomic Instability and Intra-Tumor Heterogeneity in Pediatric Medulloblastoma, Indicative of Ongoing CIN
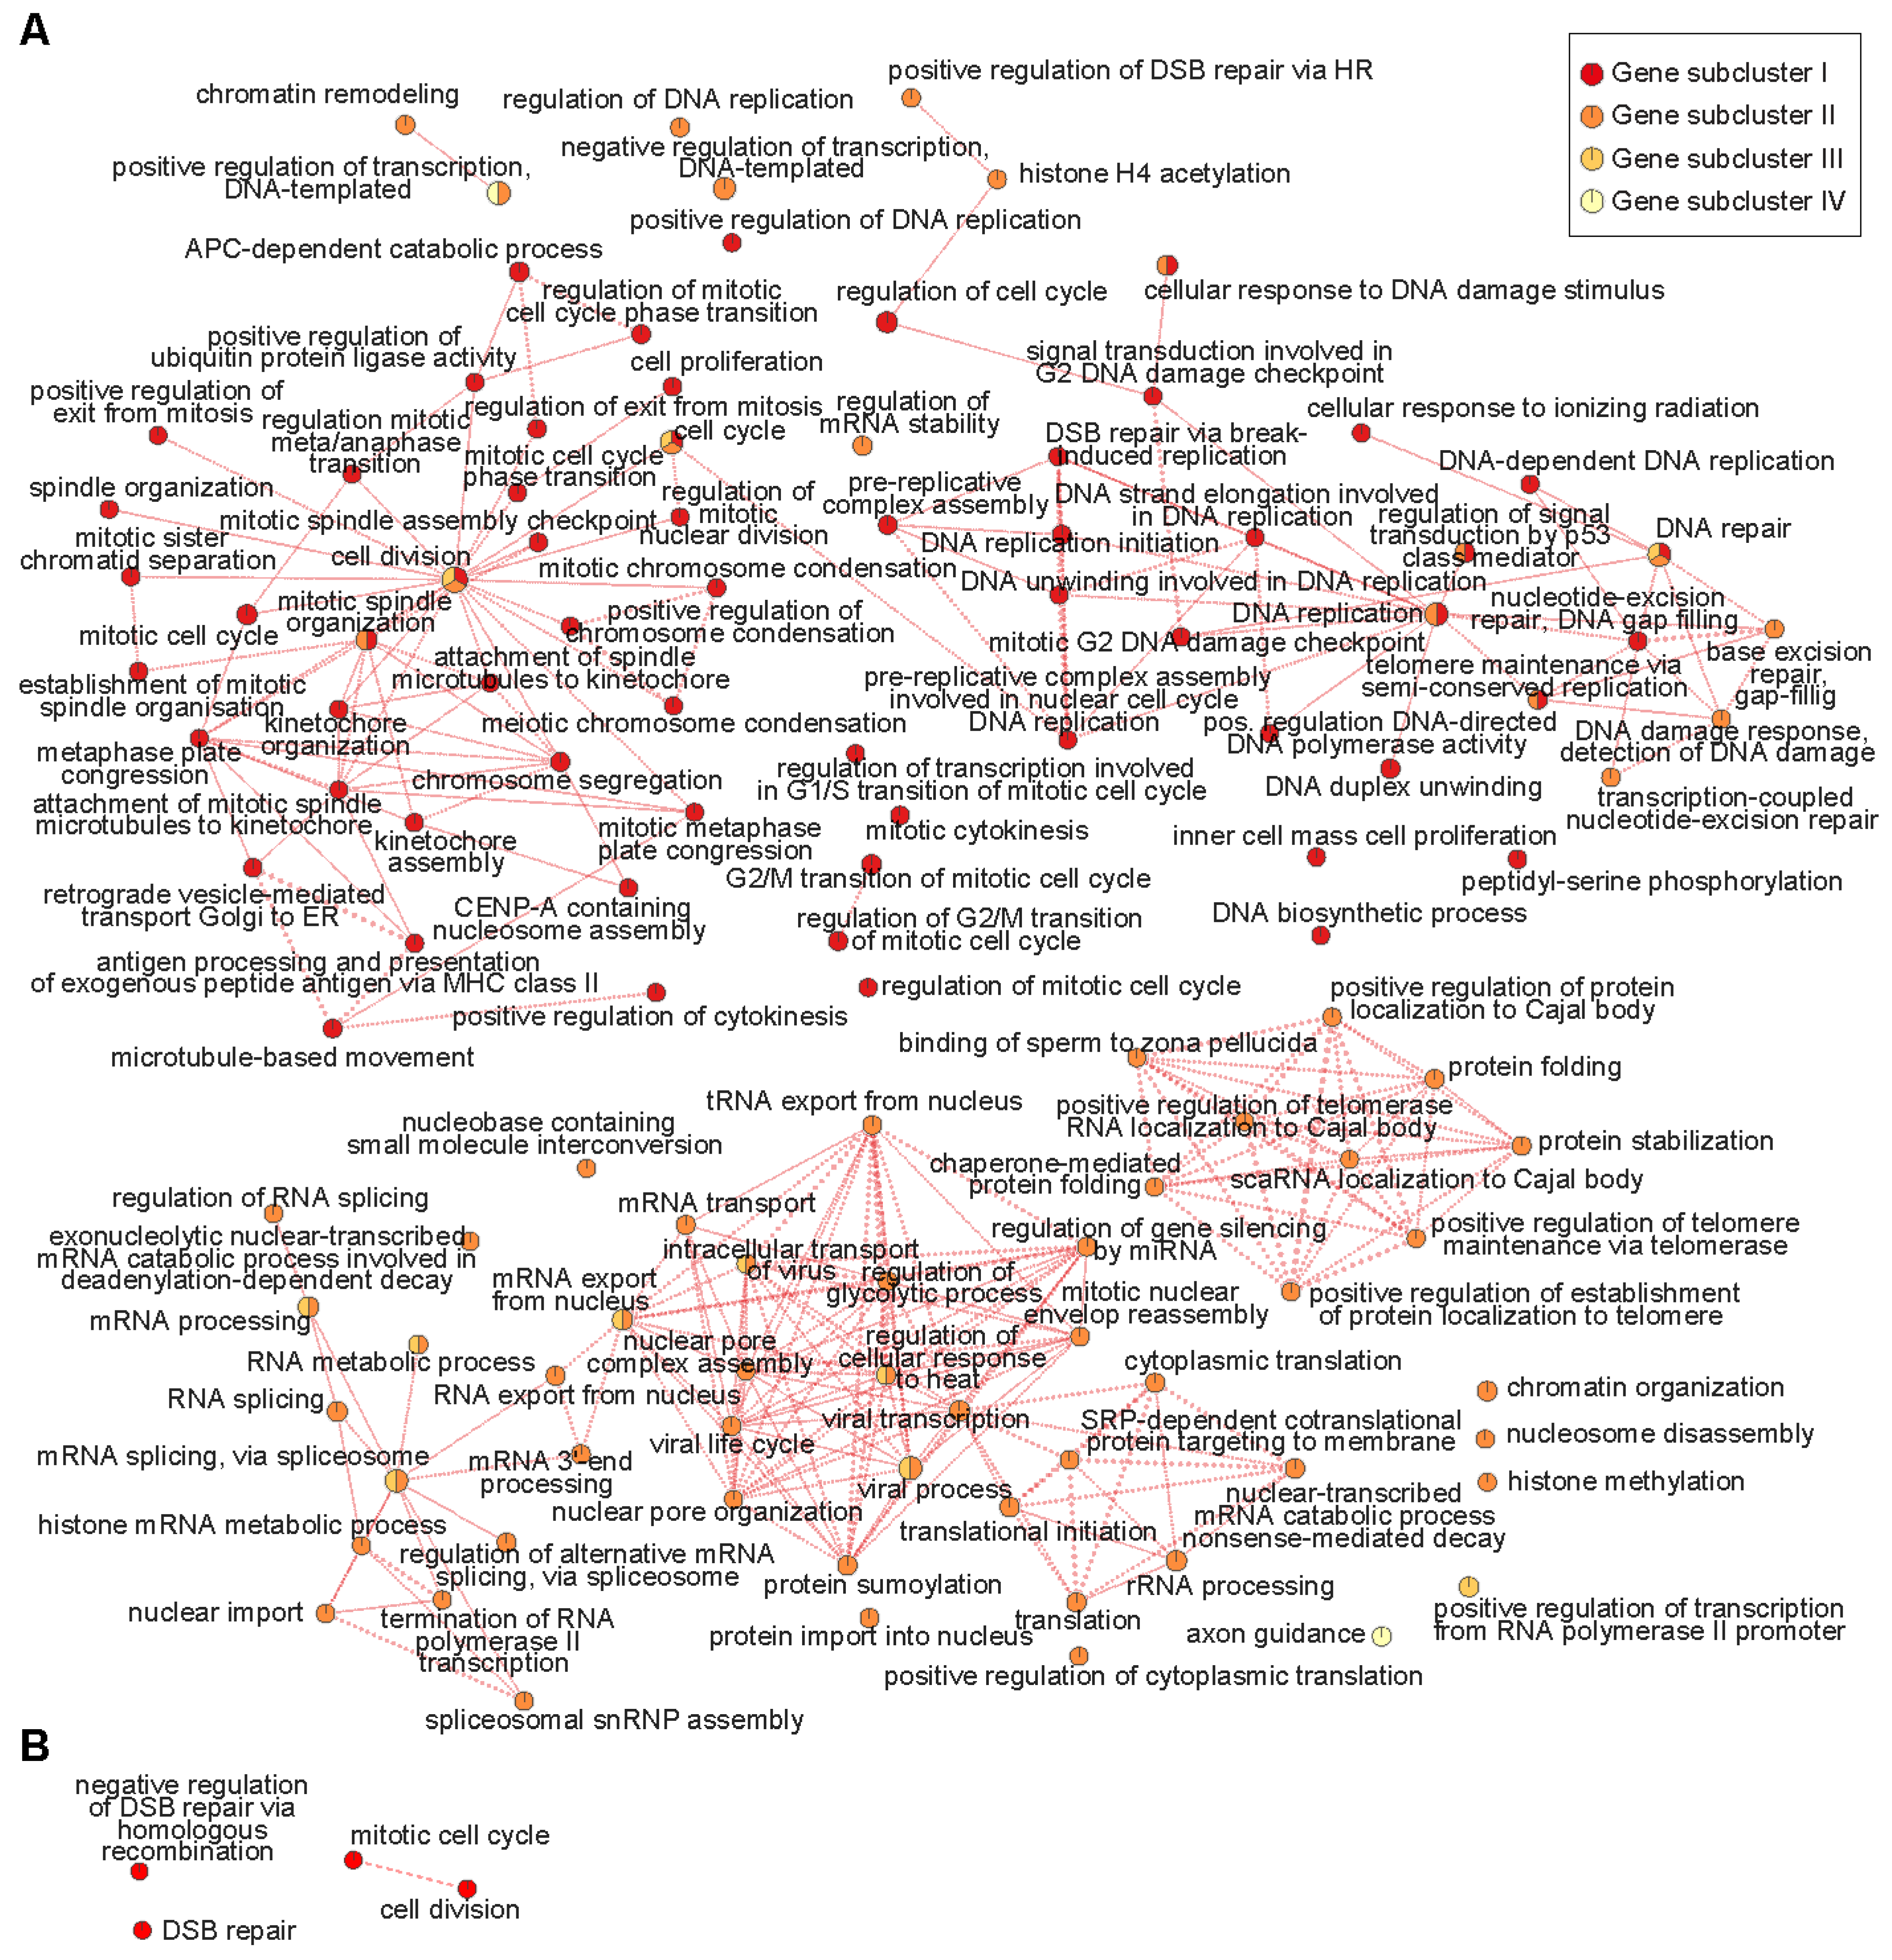
2.2. Enrichment for DNA Replication, Repair, and Mitosis-Related Processes Is Dependent on Developmental Age in CGNPs and Characterizes a Subset of Medulloblastoma Patients
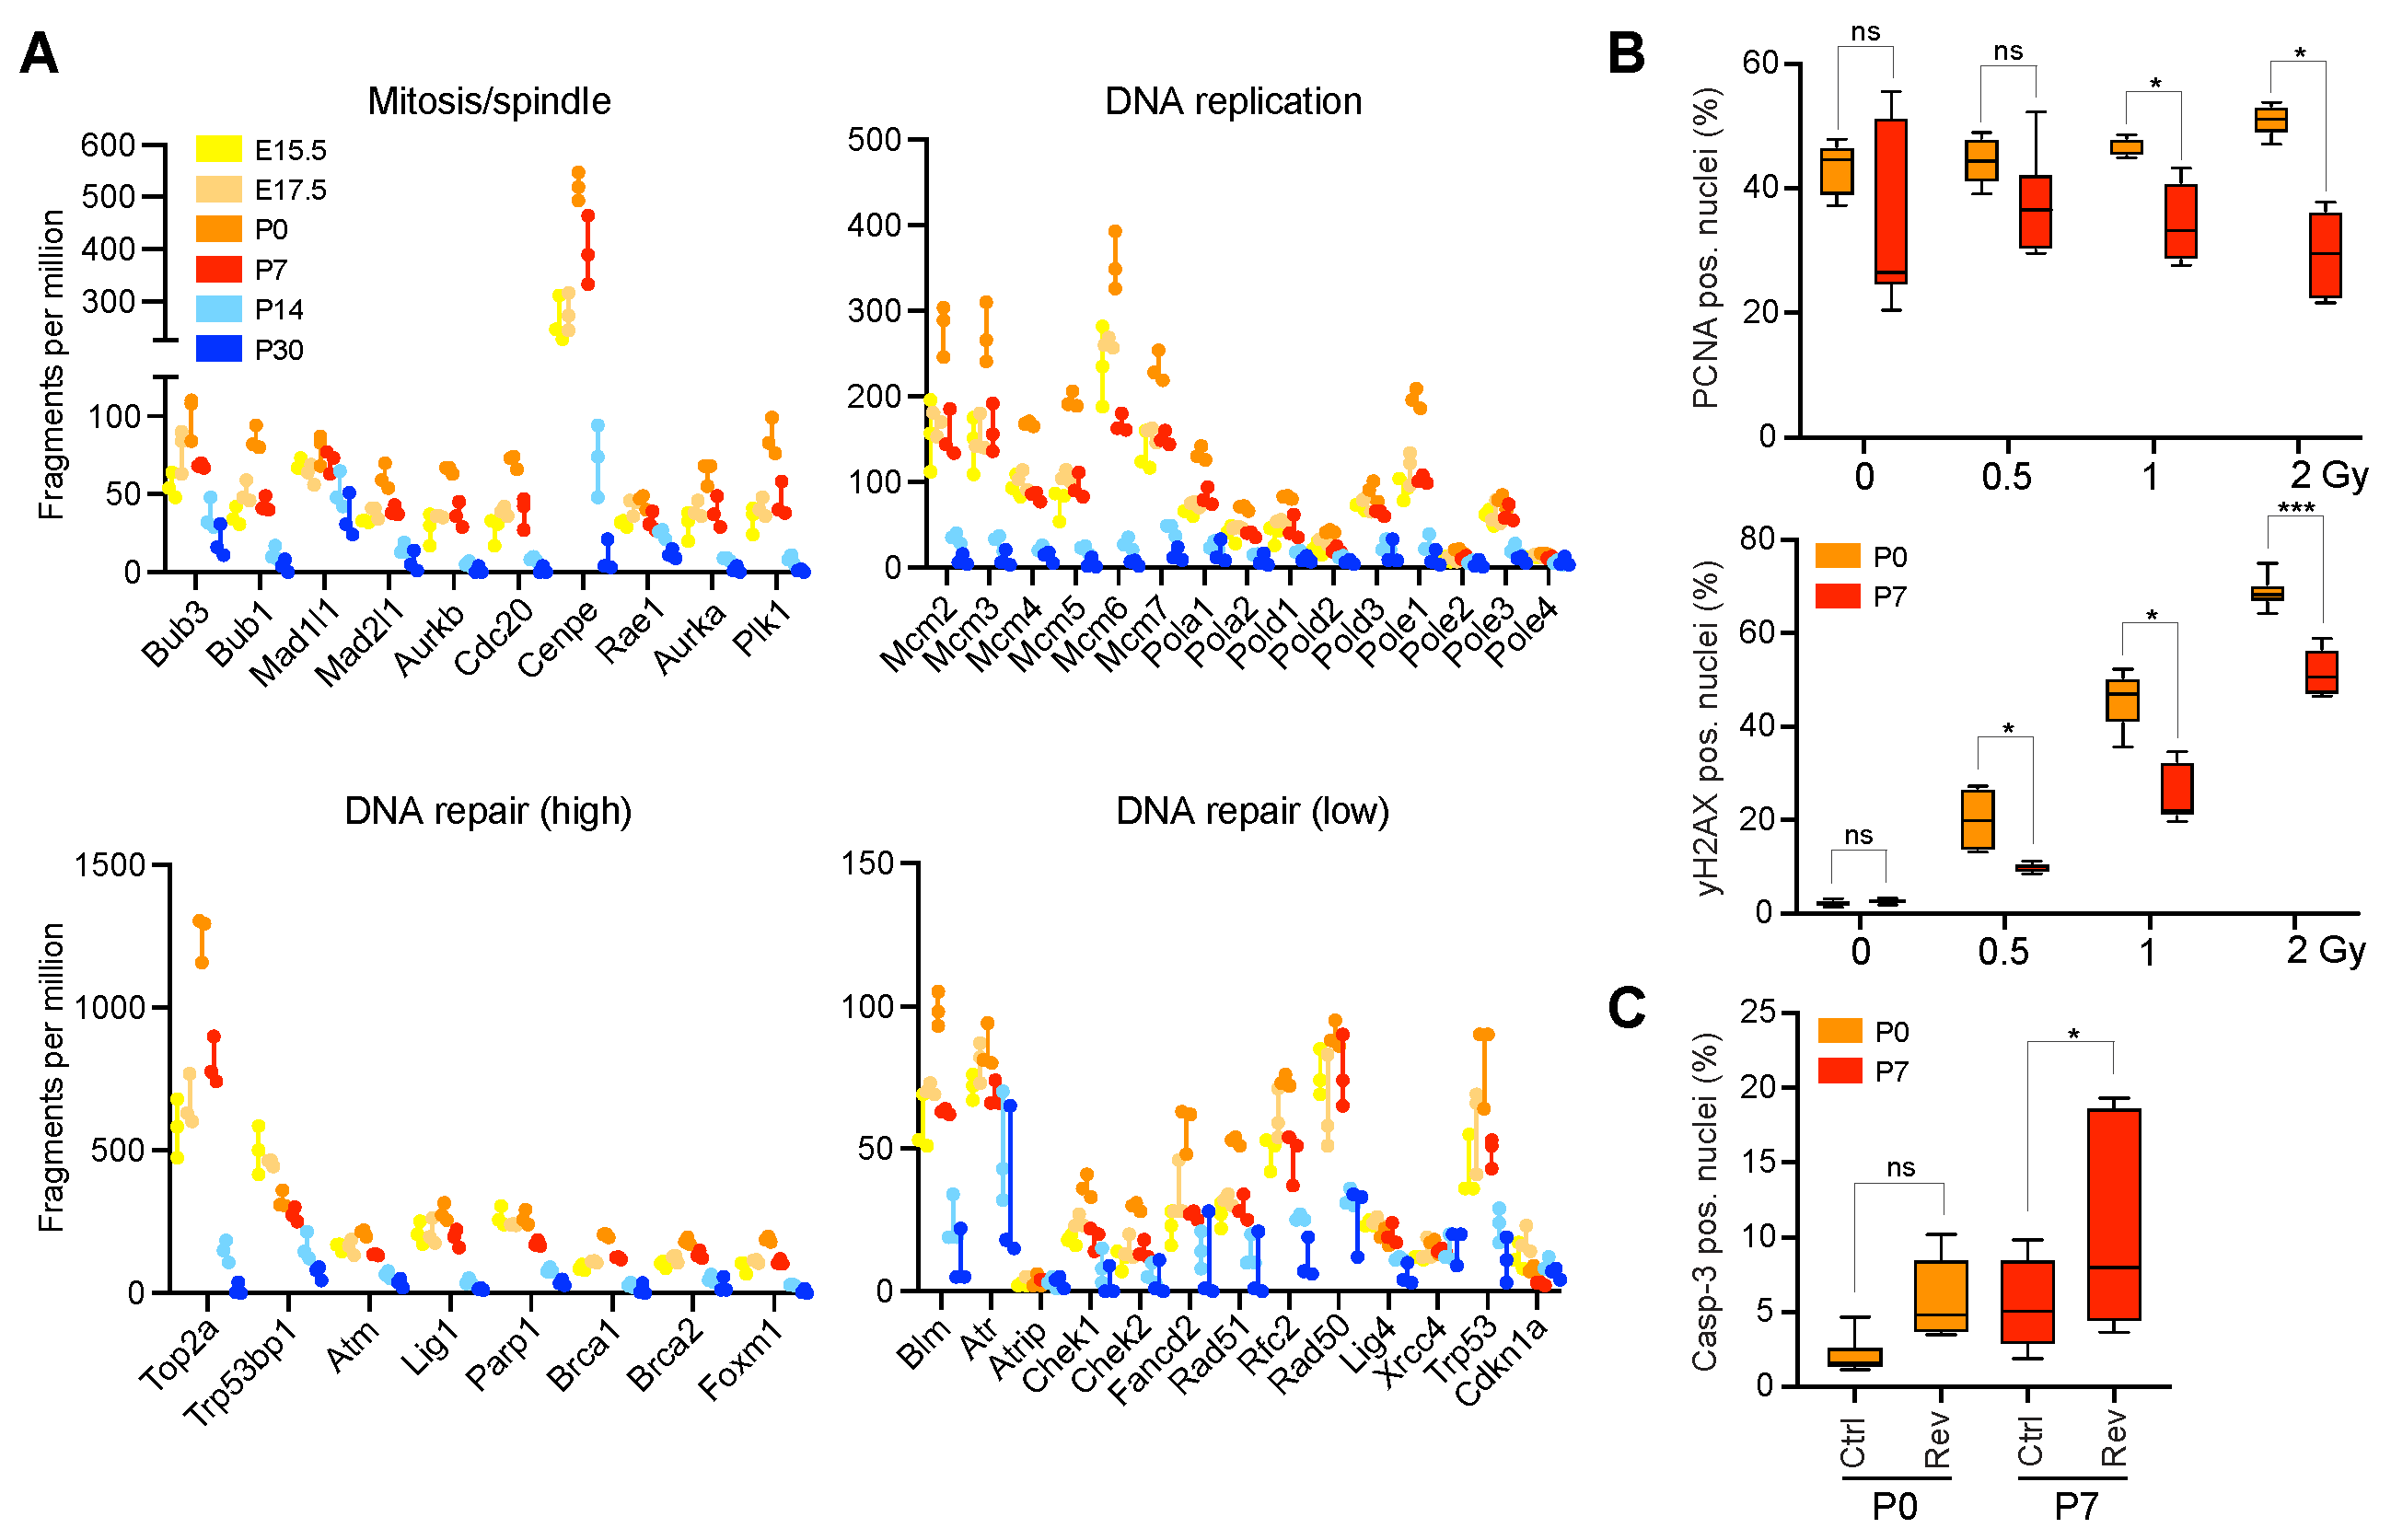
2.3. Neonatal CGNPs Are Sensitive to Ionizing Radiation and CIN Induction
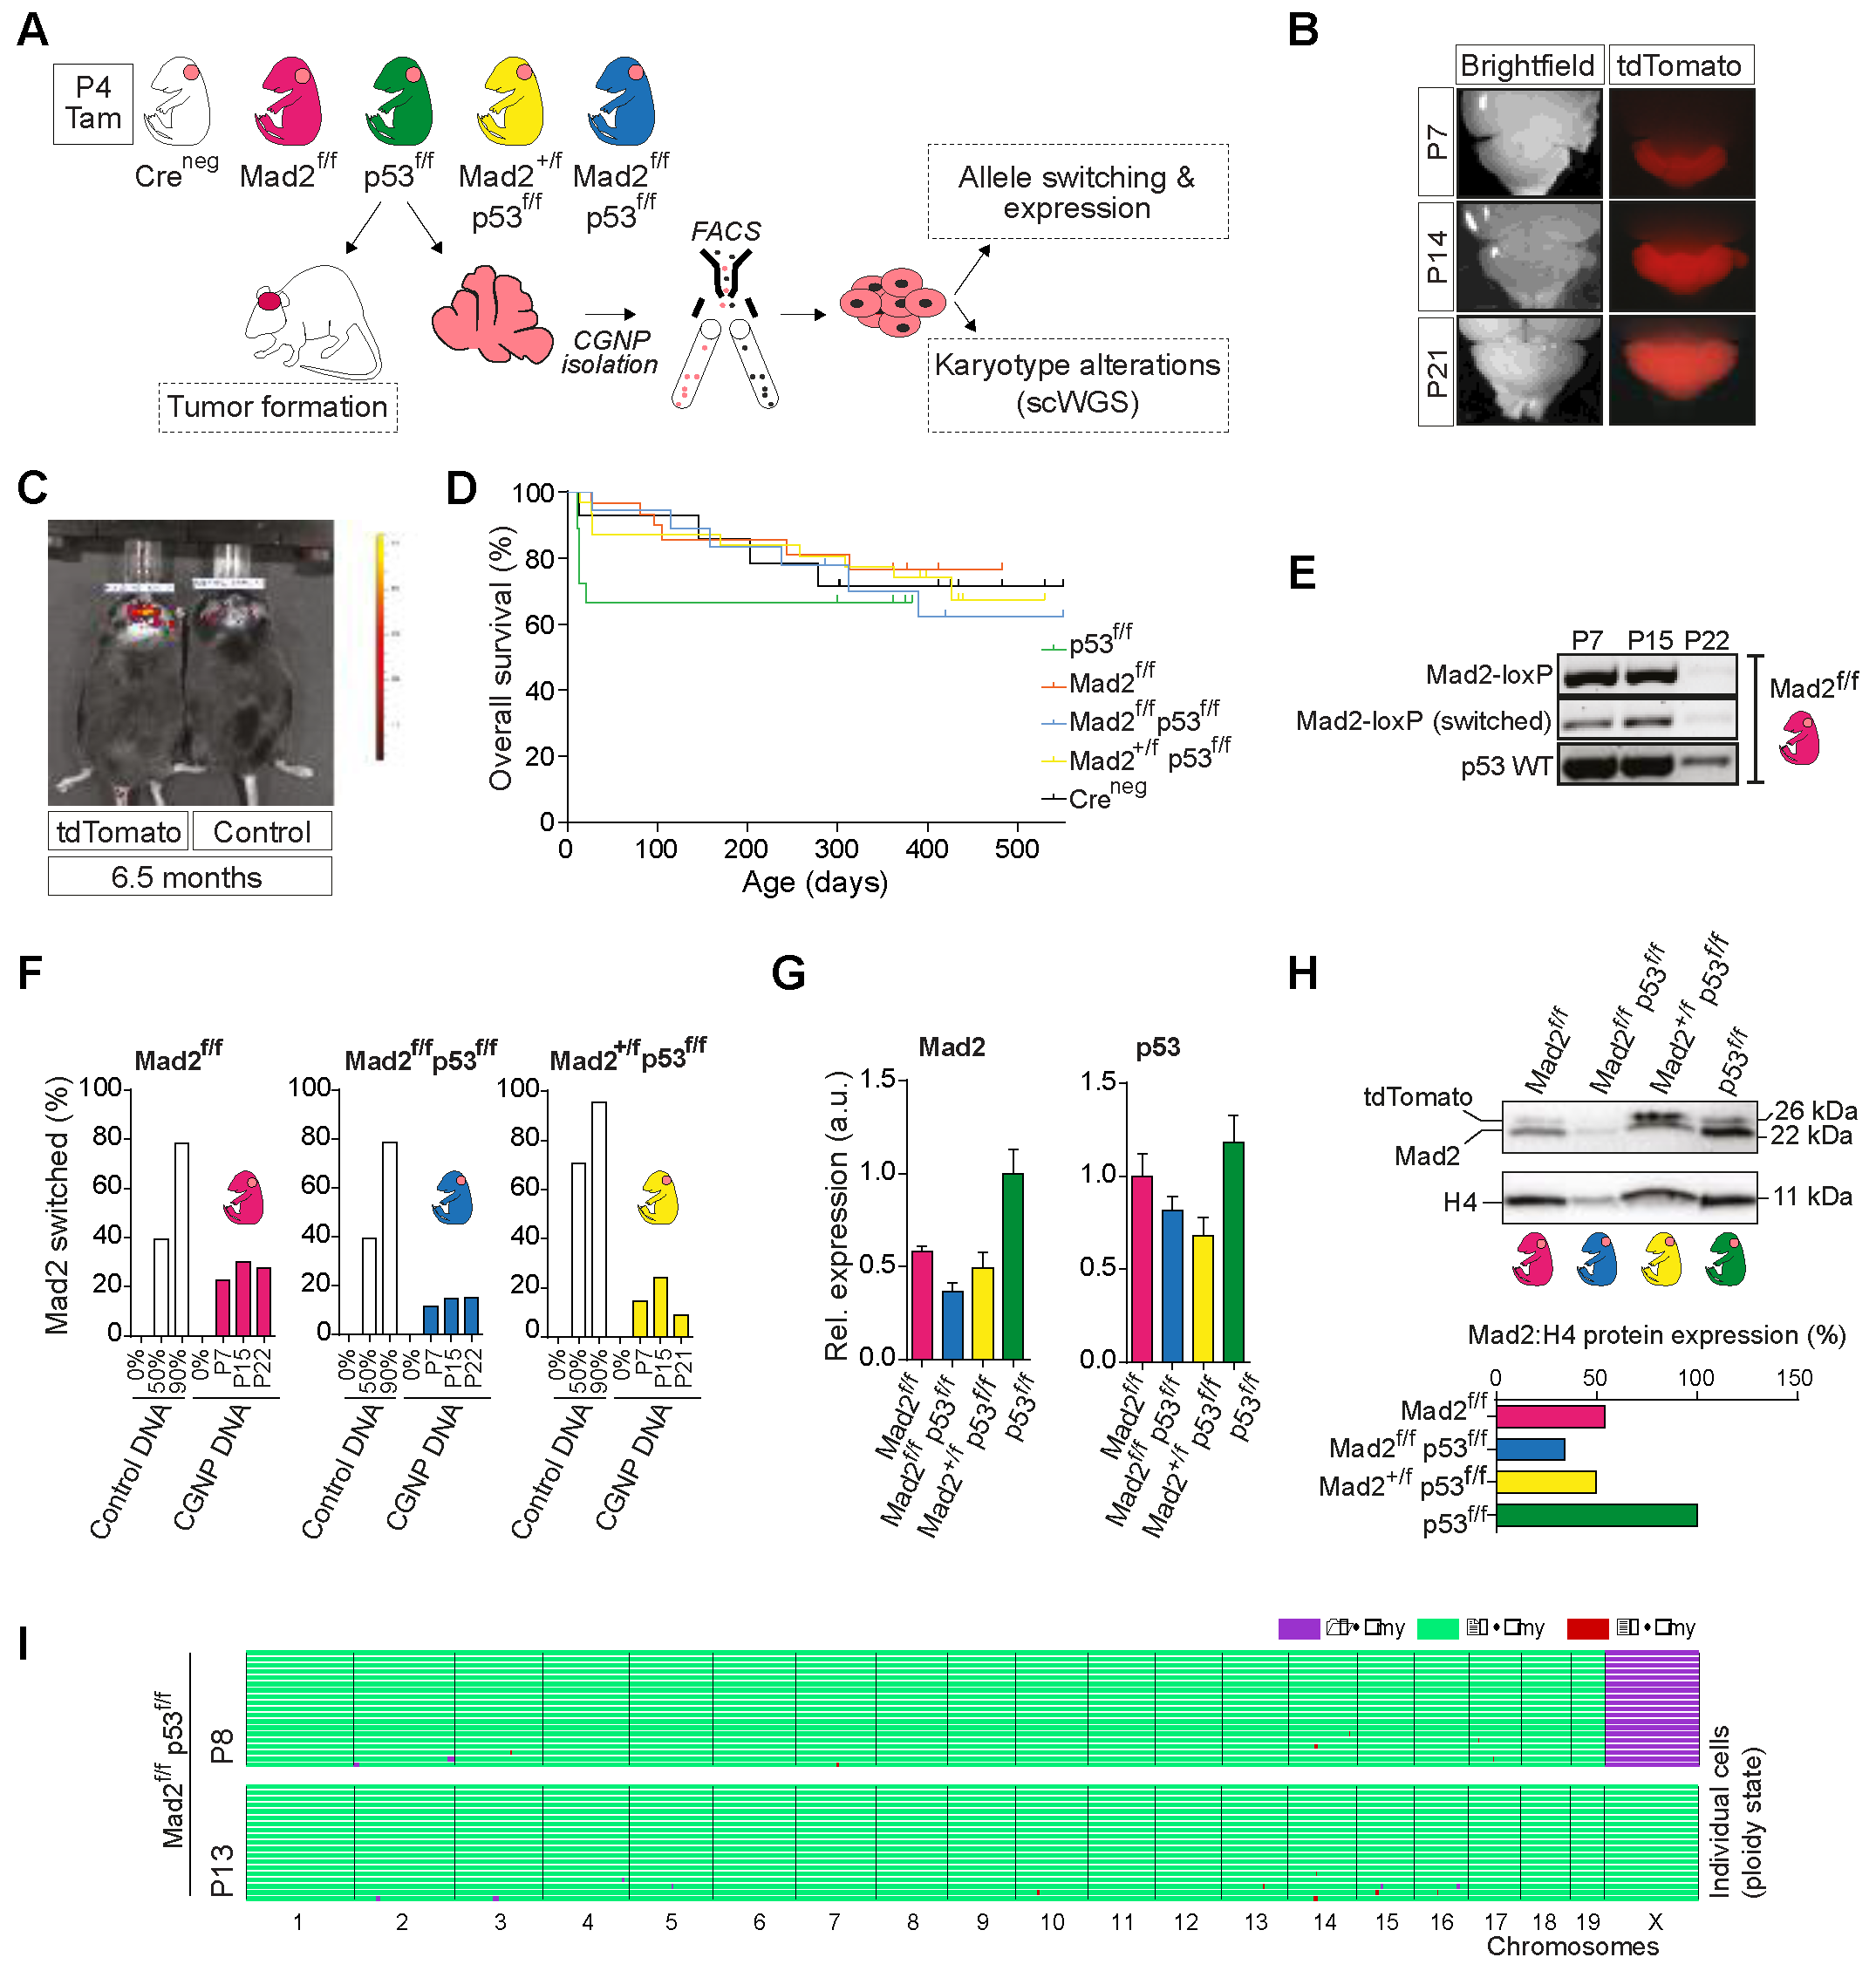
2.4. Cerebellum-Specific Deletion of Mitotic Checkpoint Protein Mad2l1 and Tumor Suppressor Trp53 in Neonatal Mice Does Not Lead to Medulloblastoma Formation
2.5. The Developing Cerebellum Does Not Appear to Tolerate Aneuploidy
3. Discussion
3.1. Tolerance of CIN and Aneuploidy in the Developing Cerebellum
3.2. Overcoming Intolerance to CIN and Medulloblastoma Formation
4. Materials and Methods
4.1. Experimental Animals and Treatments
4.2. Hierarchical Clustering Analysis and Gene Ontology
4.3. Isolation, Culturing and Sorting of Cerebellar Granule Neuron Progenitors
4.4. Immunofluorescence
4.5. Genomic PCR and Quantitative RT-PCR
4.6. Western Blot Analysis
4.7. Single Cell Whole Genome Sequencing
Supplementary Materials
Author Contributions
Funding
Institutional Review Board Statement
Informed Consent Statement
Data Availability Statement
Acknowledgments
Conflicts of Interest
References
- Hanahan, D.; Weinberg, R.A. Hallmarks of Cancer: The Next Generation. Cell 2011, 144, 646–674. [Google Scholar] [CrossRef] [PubMed]
- Gröbner, S.N.; Worst, B.C.; Weischenfeldt, J.; Buchhalter, I.; Kleinheinz, K.; Rudneva, V.A.; Johann, P.D.; Balasubramanian, G.P.; Segura-Wang, M.; Brabetz, S.; et al. The Landscape of Genomic Alterations across Childhood Cancers. Nature 2018, 555, 321–327. [Google Scholar] [CrossRef] [PubMed]
- Udaka, Y.T.; Packer, R.J. Pediatric Brain Tumors. Neurol. Clin. 2018, 36, 533–556. [Google Scholar] [CrossRef] [PubMed]
- Desandes, E.; Guissou, S.; Chastagner, P.; Lacour, B. Incidence and Survival of Children with Central Nervous System Primitive Tumors in the French National Registry of Childhood Solid Tumors. Neuro. Oncol. 2014, 16, 975–983. [Google Scholar] [CrossRef]
- Kool, M.; Korshunov, A.; Remke, M.; Jones, D.T.W.; Schlanstein, M.; Northcott, P.A.; Cho, Y.-J.; Koster, J.; Schouten-van Meeteren, A.; van Vuurden, D.; et al. Molecular Subgroups of Medulloblastoma: An International Meta-Analysis of Transcriptome, Genetic Aberrations, and Clinical Data of WNT, SHH, Group 3, and Group 4 Medulloblastomas. Acta Neuropathol. 2012, 123, 473–484. [Google Scholar] [CrossRef]
- Cavalli, F.M.G.; Remke, M.; Rampasek, L.; Peacock, J.; Shih, D.J.H.; Luu, B.; Garzia, L.; Torchia, J.; Nor, C.; Morrissy, A.S.; et al. Intertumoral Heterogeneity within Medulloblastoma Subgroups. Cancer Cell 2017, 31, 737–754.e6. [Google Scholar] [CrossRef]
- Northcott, P.A.; Buchhalter, I.; Morrissy, A.S.; Hovestadt, V.; Weischenfeldt, J.; Ehrenberger, T.; Gröbner, S.; Segura-Wang, M.; Zichner, T.; Rudneva, V.A.; et al. The Whole-Genome Landscape of Medulloblastoma Subtypes. Nature 2017, 547, 311–317. [Google Scholar] [CrossRef]
- Northcott, P.A.; Shih, D.J.H.; Peacock, J.; Garzia, L.; Sorana Morrissy, A.; Zichner, T.; Stütz, A.M.; Korshunov, A.; Reimand, J.; Schumacher, S.E.; et al. Subgroup-Specific Structural Variation across 1000 Medulloblastoma Genomes. Nature 2012, 488, 49–56. [Google Scholar] [CrossRef]
- De Smaele, E.; Di Marcotullio, L.; Ferretti, E.; Screpanti, I.; Alesse, E.; Gulino, A. Chromosome 17p Deletion in Human Medulloblastoma: A Missing Checkpoint in the Hedgehog Pathway. Cell Cycle 2004, 3, 1263–1266. [Google Scholar] [CrossRef]
- Menyhárt, O.; Győrffy, B. Principles of Tumorigenesis and Emerging Molecular Drivers of SHH-Activated Medulloblastomas. Ann. Clin. Transl. Neurol. 2019, 6, 990–1005. [Google Scholar] [CrossRef] [Green Version]
- Rausch, T.; Jones, D.T.W.; Zapatka, M.; Stütz, A.M.; Weischenfeldt, J.; Jäger, N.; Remke, M.; Shih, D.; Paul, A.; Pfaff, E.; et al. Genome Sequencing of Pediatric Medulloblastoma Links Catastrophic DNA Rearrangements with TP53 Mutations. Genome 2013, 148, 59–71. [Google Scholar] [CrossRef] [PubMed]
- Selvadurai, H.J.; Luis, E.; Desai, K.; Lan, X.; Vladoiu, M.C.; Whitley, O.; Galvin, C.; Vanner, R.J.; Lee, L.; Whetstone, H.; et al. Medulloblastoma Arises from the Persistence of a Rare and Transient Sox2+ Granule Neuron Precursor. Cell Rep. 2020, 31, 107511. [Google Scholar] [CrossRef] [PubMed]
- Yang, Z.J.; Ellis, T.; Markant, S.L.; Read, T.A.; Kessler, J.D.; Bourboulas, M.; Schüller, U.; Machold, R.; Fishell, G.; Rowitch, D.H.; et al. Medulloblastoma Can Be Initiated by Deletion of Patched in Lineage-Restricted Progenitors or Stem Cells. Cancer Cell 2008, 14, 135–145. [Google Scholar] [CrossRef] [PubMed]
- Gibson, P.; Tong, Y.; Robinson, G.; Thompson, M.C.; Currle, D.S.; Eden, C.; Kranenburg, T.A.; Hogg, T.; Poppleton, H.; Martin, J.; et al. Subtypes of Medulloblastoma Have Distinct Developmental Origins. Nature 2010, 468, 1095–1099. [Google Scholar] [CrossRef]
- Schüller, U.; Heine, V.M.; Mao, J.; Kho, A.T.; Dillon, A.K.; Han, Y.G.; Huillard, E.; Sun, T.; Ligon, A.H.; Qian, Y.; et al. Acquisition of Granule Neuron Precursor Identity Is a Critical Determinant of Progenitor Cell Competence to Form Shh-Induced Medulloblastoma. Cancer Cell 2008, 14, 123–134. [Google Scholar] [CrossRef]
- Hovestadt, V.; Smith, K.S.; Bihannic, L.; Filbin, M.G.; Shaw, M.L.; Baumgartner, A.; DeWitt, J.C.; Groves, A.; Mayr, L.; Weisman, H.R.; et al. Resolving Medulloblastoma Cellular Architecture by Single-Cell Genomics. Nature 2019, 572, 74–79. [Google Scholar] [CrossRef]
- Vladoiu, M.C.; El-Hamamy, I.; Donovan, L.K.; Farooq, H.; Holgado, B.L.; Sundaravadanam, Y.; Ramaswamy, V.; Hendrikse, L.D.; Kumar, S.; Mack, S.C.; et al. Childhood Cerebellar Tumours Mirror Conserved Fetal Transcriptional Programs. Nature 2019, 572, 67–73. [Google Scholar] [CrossRef]
- Smit, M.J.; Martini, T.E.I.; Armandari, I.; Bočkaj, I.; Zomerman, W.W.; de Camargo Magalhães, E.S.; Siragna, Z.; Meeuwsen, T.G.J.; Scherpen, F.J.G.; Schoots, M.H.; et al. The Developmental Stage of the Medulloblastoma Cell-of-Origin Restricts Sonic Hedgehog Pathway Usage and Drug Sensitivity. J. Cell Sci. 2022, 135, jeb258608. [Google Scholar] [CrossRef]
- Kawauchi, D.; Robinson, G.; Uziel, T.; Gibson, P.; Rehg, J.; Gao, C.; Finkelstein, D.; Qu, C.; Pounds, S.; Ellison, D.W.; et al. A Mouse Model of the Most Aggressive Subgroup of Human Medulloblastoma. Cancer Cell 2012, 21, 168–180. [Google Scholar] [CrossRef]
- Miale, I.L.; Sidman, R.L. An Autoradiographic Analysis of Histogenesis in the Mouse Cerebellum. Exp. Neurol. 1961, 4, 277–296. [Google Scholar] [CrossRef]
- Wang, V.Y.; Rose, M.F.; Zoghbi, H.Y. Math1 Expression Redefines the Rhombic Lip Derivatives and Reveals Novel Lineages within the Brainstem and Cerebellum. Neuron 2005, 48, 31–43. [Google Scholar] [CrossRef] [PubMed]
- Leto, K.; Arancillo, M.; Becker, E.B.E.; Buffo, A.; Chiang, C.; Ding, B.; Dobyns, W.B.; Dusart, I.; Haldipur, P.; Hatten, M.E.; et al. Consensus Paper: Cerebellar Development. Cerebellum 2016, 15, 789–828. [Google Scholar] [CrossRef] [PubMed]
- MacHold, R.; Fishell, G. Math1 Is Expressed in Temporally Discrete Pools of Cerebellar Rhombic-Lip Neural Progenitors. Neuron 2005, 48, 17–24. [Google Scholar] [CrossRef] [PubMed]
- Haldipur, P.; Bharti, U.; Govindan, S.; Sarkar, C.; Iyengar, S.; Gressens, P.; Mani, S. Expression of Sonic Hedgehog During Cell Proliferation in the Human Cerebellum. Stem Cells Dev. 2012, 21, 1059–1068. [Google Scholar] [CrossRef]
- Dahmane, N.; Ruiz, A. Sonic Hedgehog Regulates the Growth and Patterning of the Cerebellum. Development 1999, 3100, 3089–3100. [Google Scholar] [CrossRef]
- Wechsler-Reya, R.J.; Scott, M.P. Control of Neuronal Precursor Proliferation in the Cerebellum by Sonic Hedgehog. Neuron 1999, 22, 103–114. [Google Scholar] [CrossRef]
- Wallace, V.A. Purkinje-Cell-Derived Sonic Hedgehog Regulates Granule Neuron Precursor Cell Proliferation in the Developing Mouse Cerebellum. Curr. Biol. 1999, 9, 445–448. [Google Scholar] [CrossRef]
- Lewis, P.M.; Gritli-Linde, A.; Smeyne, R.; Kottmann, A.; McMahon, A.P. Sonic Hedgehog Signaling Is Required for Expansion of Granule Neuron Precursors and Patterning of the Mouse Cerebellum. Dev. Biol. 2004, 270, 393–410. [Google Scholar] [CrossRef]
- Santaguida, S.; Tighe, A.; D’Alise, A.M.; Taylor, S.S.; Musacchio, A. Dissecting the Role of MPS1 in Chromosome Biorientation and the Spindle Checkpoint through the Small Molecule Inhibitor Reversine. J. Cell Biol. 2010, 190, 73–87. [Google Scholar] [CrossRef] [PubMed]
- Soto, M.; Raaijmakers, J.A.; Bakker, B.; Spierings, D.C.J.; Lansdorp, P.M.; Foijer, F.; Soto, M.; Raaijmakers, J.A.; Bakker, B.; Spierings, D.C.J.; et al. P53 Prohibits Propagation of Chromosome Segregation Errors That Produce Structural Report P53 Prohibits Propagation of Chromosome Segregation Errors That Produce Structural Aneuploidies. Cell Rep. 2017, 19, 2423–2431. [Google Scholar] [CrossRef] [Green Version]
- Musacchio, A.; Salmon, E.D. The Spindle-Assembly Checkpoint in Space and Time. Nat. Rev. Mol. Cell Biol. 2007, 8, 379–393. [Google Scholar] [CrossRef] [PubMed]
- Oliver, T.G.; Read, T.A.; Kessler, J.D.; Mehmeti, A.; Wells, J.F.; Huynh, T.T.T.; Lin, S.M.; Wechsler-Reya, R.J. Loss of Patched and Disruption of Granule Cell Development in a Pre-Neoplastic Stage of Medulloblastoma. Development 2005, 132, 2425–2439. [Google Scholar] [CrossRef] [PubMed]
- Bakker, B.; Taudt, A.; Belderbos, M.E.; Porubsky, D.; Spierings, D.C.J.; de Jong, T.V.; Halsema, N.; Kazemier, H.G.; Hoekstra-Wakker, K.; Bradley, A.; et al. Single-Cell Sequencing Reveals Karyotype Heterogeneity in Murine and Human Malignancies. Genome Biol. 2016, 17, 115. [Google Scholar] [CrossRef] [PubMed]
- Bakker, B.; van den Bos, H.; Lansdorp, P.M.; Foijer, F. How to Count Chromosomes in a Cell: An Overview of Current and Novel Technologies. BioEssays 2015, 37, 570–577. [Google Scholar] [CrossRef]
- Kool, M.; Jones, D.T.W.; Jäger, N.; Northcott, P.A.; Pugh, T.J.; Hovestadt, V.; Piro, R.M.; Esparza, L.A.; Markant, S.L.; Remke, M.; et al. Genome Sequencing of SHH Medulloblastoma Predicts Genotype-Related Response to Smoothened Inhibition. Cancer Cell 2014, 25, 393–405. [Google Scholar] [CrossRef]
- Zomerman, W.W.; Plasschaert, S.L.A.; Conroy, S.; Scherpen, F.J.; Meeuwsen-de Boer, T.G.J.; Lourens, H.J.; Guerrero Llobet, S.; Smit, M.J.; Slagter-Menkema, L.; Seitz, A.; et al. Identification of Two Protein-Signaling States Delineating Transcriptionally Heterogeneous Human Medulloblastoma. Cell Rep. 2018, 22, 3206–3216. [Google Scholar] [CrossRef]
- Simon, J.E.; Bakker, B.; Foijer, F. CINcere Modelling: What Have Mouse Models for Chromosome Instability Taught Us? Recent Results Cancer Res. 2015, 200, 39–60. [Google Scholar] [CrossRef]
- Foijer, F.; DiTommas, T.; Donati, G.; Hautaviita, K.; Xie, S.Z.; Heath, E.; Smyth, I.; Watt, F.M.; Sorger, P.K.; Bradley, A. Spindle Checkpoint Deficiency Is Tolerated by Murine Epidermal Cells but Not Hair Follicle Stem Cells. Proc. Natl. Acad. Sci. USA 2013, 110, 2928–2933. [Google Scholar] [CrossRef]
- Foijer, F.; Albacker, L.A.; Bakker, B.; Spierings, D.C.; Yue, Y.; Xie, S.Z.; Davis, S.; Lutum-Jehle, A.; Takemoto, D.; Hare, B.; et al. Deletion of the MAD2L1 Spindle Assembly Checkpoint Gene Is Tolerated in Mouse Models of Acute T-Cell Lymphoma and Hepatocellular Carcinoma. Elife 2017, 6, 1–22. [Google Scholar] [CrossRef]
- Jonkers, J.; Meuwissen, R.; Van der Gulden, H.; Peterse, H.; Van der Valk, M.; Berns, A. Synergistic Tumor Suppressor Activity of BRCA2 and P53 in a Conditional Mouse Model for Breast Cancer. Nat. Genet. 2001, 29, 418–425. [Google Scholar] [CrossRef]
- Madisen, L.; Zwingman, T.A.; Sunkin, S.M.; Oh, S.W.; Zariwala, H.A.; Gu, H.; Ng, L.L.; Palmiter, R.D.; Hawrylycz, M.J.; Jones, A.R.; et al. A Robust and High-Throughput Cre Reporting and Characterization System for the Whole Mouse Brain. Nat. Neurosci. 2010, 13, 133–140. [Google Scholar] [CrossRef] [PubMed]
- Shoshani, O.; Bakker, B.; De Haan, L.; Tijhuis, A.E.; Wang, Y.; Kim, D.H.; Maldonado, M.; Demarest, M.A.; Artates, J.; Zhengyu, O.; et al. Transient Genomic Instability Drives Tumorigenesis through Accelerated Clonal Evolution. Genes Dev. 2021, 35, 1093–1108. [Google Scholar] [CrossRef] [PubMed]
- Danilenko, M.; Zaka, M.; Keeling, C.; Crosier, S.; Lyman, S.; Finetti, M.; Williamson, D.; Hussain, R.; Coxhead, J.; Zhou, P.; et al. Single-Cell DNA Sequencing Identifies Risk-Associated Clonal Complexity and Evolutionary Trajectories in Childhood Medulloblastoma Development. Acta Neuropathol. 2022, 1, 1–14. [Google Scholar] [CrossRef] [PubMed]
- Gordon, D.J.; Resio, B.; Pellman, D. Causes and Consequences of Aneuploidy in Cancer. Nat. Rev. Genet. 2012, 13, 189–203. [Google Scholar] [CrossRef]
- Mckinnon, P.J. Maintaining Genome Stability in the Nervous System. Nat. Neurosci. 2013, 16, 1523–1529. [Google Scholar] [CrossRef]
- Orii, K.E.; Lee, Y.; Kondo, N.; McKinnon, P.J. Selective Utilization of Nonhomologous End-Joining and Homologous Recombination DNA Repair Pathways during Nervous System Development. Proc. Natl. Acad. Sci. USA 2006, 103, 10017–10022. [Google Scholar] [CrossRef]
- Roussel, M.F.; Stripay, J.L. Modeling Pediatric Medulloblastoma. Brain Pathol. 2020, 30, 703–712. [Google Scholar] [CrossRef]
- Lang, P.Y.; Nanjangud, G.J.; Sokolsky-Papkov, M.; Shaw, C.; Hwang, D.; Parker, J.S.; Kabanov, A.V.; Gershon, T.R. ATR Maintains Chromosomal Integrity during Postnatal Cerebellar Neurogenesis and Is Required for Medulloblastoma Formation. Development 2016, 143, 4038–4052. [Google Scholar] [CrossRef]
- Williams, S.E.; Garcia, I.; Crowther, A.J.; Li, S.; Stewart, A.; Liu, H.; Lough, K.J.; O’Neill, S.; Veleta, K.; Oyarzabal, E.A.; et al. Aspm Sustains Postnatal Cerebellar Neurogenesis and Medulloblastoma Growth in Mice. Development 2015, 142, 3921–3932. [Google Scholar] [CrossRef]
- Vasudevan, A.; Schukken, K.M.; Sausville, E.L.; Girish, V.; Adebambo, O.A.; Sheltzer, J.M. Aneuploidy as a Promoter and Suppressor of Malignant Growth. Nat. Rev. Cancer 2021, 21, 89–103. [Google Scholar] [CrossRef]
- Dobles, M.; Liberal, V.; Scott, M.L.; Benezra, R.; Sorger, P.K. Chromosome Missegregation and Apoptosis in Mice Lacking the Mitotic Checkpoint Protein Mad2. Cell 2000, 101, 635–645. [Google Scholar] [CrossRef]
- Huang, D.W.; Sherman, B.T.; Lempicki, R.A. Systematic and Integrative Analysis of Large Gene Lists Using DAVID Bioinformatics Resources. Nat. Protoc. 2008, 4, 44–57. [Google Scholar] [CrossRef] [PubMed]
- Merico, D.; Isserlin, R.; Stueker, O.; Emili, A.; Bader, G.D. Enrichment Map: A Network-Based Method for Gene-Set Enrichment Visualization and Interpretation. PLoS ONE 2010, 5, e13984. [Google Scholar] [CrossRef] [PubMed]
- Shannon, P.; Markiel, A.; Ozier, O.; Baliga, N.S.; Wang, J.T.; Ramage, D.; Amin, N.; Schwikowski, B.; Ideker, T. Cytoscape: A Software Environment for Integrated Models of Biomolecular Interaction Networks. Genome Res. 2003, 13, 2498–2504. [Google Scholar] [CrossRef]
- Schindelin, J.; Arganda-Carreras, I.; Frise, E.; Kaynig, V.; Longair, M.; Pietzsch, T.; Preibisch, S.; Rueden, C.; Saalfeld, S.; Schmid, B.; et al. Fiji: An Open-Source Platform for Biological-Image Analysis. Nat. Methods 2012, 9, 676–682. [Google Scholar] [CrossRef] [PubMed]
- Bočkaj, I.; Martini, T.E.I.; De Camargo Magalhães, E.S.; Bakker, P.L.; Meeuwsen-De Boer, T.G.J.; Armandari, I.; Meuleman, S.L.; Mondria, M.T.; Stok, C.; Kok, Y.P.; et al. The H3.3K27M Oncohistone Affects Replication Stress Outcome and Provokes Genomic Instability in Pediatric Glioma. PLoS Genet. 2021, 17, e1009868. [Google Scholar] [CrossRef]
- van den Bos, H.; Spierings, D.C.J.; Taudt, A.S.; Bakker, B.; Porubský, D.; Falconer, E.; Novoa, C.; Halsema, N.; Kazemier, H.G.; Hoekstra-Wakker, K.; et al. Single-Cell Whole Genome Sequencing Reveals No Evidence for Common Aneuploidy in Normal and Alzheimer’s Disease Neurons. Genome Biol. 2016, 17, 116. [Google Scholar] [CrossRef] [Green Version]

Publisher’s Note: MDPI stays neutral with regard to jurisdictional claims in published maps and institutional affiliations. |
© 2022 by the authors. Licensee MDPI, Basel, Switzerland. This article is an open access article distributed under the terms and conditions of the Creative Commons Attribution (CC BY) license (https://creativecommons.org/licenses/by/4.0/).
Share and Cite
Bočkaj, I.; Martini, T.E.I.; Smit, M.J.; Armandari, I.; Bakker, B.; Wardenaar, R.; Meeuwsen-de Boer, T.G.J.; Bakker, P.L.; Spierings, D.C.J.; Hoving, E.W.; et al. Chromosomal Instability Characterizes Pediatric Medulloblastoma but Is Not Tolerated in the Developing Cerebellum. Int. J. Mol. Sci. 2022, 23, 9852. https://doi.org/10.3390/ijms23179852
Bočkaj I, Martini TEI, Smit MJ, Armandari I, Bakker B, Wardenaar R, Meeuwsen-de Boer TGJ, Bakker PL, Spierings DCJ, Hoving EW, et al. Chromosomal Instability Characterizes Pediatric Medulloblastoma but Is Not Tolerated in the Developing Cerebellum. International Journal of Molecular Sciences. 2022; 23(17):9852. https://doi.org/10.3390/ijms23179852
Chicago/Turabian StyleBočkaj, Irena, Tosca E. I. Martini, Marlinde J. Smit, Inna Armandari, Bjorn Bakker, René Wardenaar, Tiny G. J. Meeuwsen-de Boer, Petra L. Bakker, Diana C. J. Spierings, Eelco W. Hoving, and et al. 2022. "Chromosomal Instability Characterizes Pediatric Medulloblastoma but Is Not Tolerated in the Developing Cerebellum" International Journal of Molecular Sciences 23, no. 17: 9852. https://doi.org/10.3390/ijms23179852
APA StyleBočkaj, I., Martini, T. E. I., Smit, M. J., Armandari, I., Bakker, B., Wardenaar, R., Meeuwsen-de Boer, T. G. J., Bakker, P. L., Spierings, D. C. J., Hoving, E. W., Guryev, V., Foijer, F., & Bruggeman, S. W. M. (2022). Chromosomal Instability Characterizes Pediatric Medulloblastoma but Is Not Tolerated in the Developing Cerebellum. International Journal of Molecular Sciences, 23(17), 9852. https://doi.org/10.3390/ijms23179852