
Polygenic Risk of Hypertriglyceridemia Is Modified by BMI

 , , , , ,
  and
and
Abstract
:1. Introduction
2. Results
3. Discussion
4. Materials and Methods
4.1. Population Selection
4.2. Variables Selected
4.3. Biochemical Analyses
4.4. Genetic Testing
4.5. Selecting SNPs and Development of the Genetic Risk Score
4.6. Statistical Analysis
5. Conclusions
6. Patents
Supplementary Materials
Author Contributions
Funding
Institutional Review Board Statement
Informed Consent Statement
Data Availability Statement
Acknowledgments
Conflicts of Interest
References
- Parhofer, K.G.; Laufs, U. The Diagnosis and Treatment of Hypertriglyceridemia. Dtsch. Arztebl. Int. 2019, 116, 825–832. [Google Scholar] [CrossRef] [PubMed]
- Willer, C.J.; Schmidt, E.M.; Sengupta, S.; Peloso, G.M.; Gustafsson, S.; Kanoni, S. Discovery and refinement of loci associated with lipid levels. Nat. Genet. 2013, 45, 1274–1285. [Google Scholar] [PubMed]
- Jacob, E.; Hegele, R.A. Monogenic Versus Polygenic Forms of Hypercholesterolemia and Cardiovascular Risk: Are There Any Differences? Curr. Atheroscler. Rep. 2022, 24, 419–426. [Google Scholar] [CrossRef]
- Trinder, M.; Francis, G.A.; Brunham, L.R. Association of Monogenic vs Polygenic Hypercholesterolemia With Risk of Atherosclerotic Cardiovascular Disease. JAMA Cardiol. 2020, 1, 390–399. [Google Scholar] [CrossRef] [PubMed]
- Buscot, M.-J.; Magnussen, C.G.; Juonala, M.; Pitkänen, N.; Lehtimäki, T.; Viikari, J.S.A.; Kähönen, M.; Hutri-Kähönen, N.; Schork, N.J.; Raitakari, O.T.; et al. The Combined Effect of Common Genetic Risk Variants on Circulating Lipoproteins Is Evident in Childhood: A Longitudinal Analysis of the Cardiovascular Risk in Young Finns Study. PLoS ONE 2016, 11, e0146081. [Google Scholar] [CrossRef] [PubMed]
- Latsuzbaia, A.; Jaddoe, V.W.V.; Hofman, A.; Franco, O.H.; Felix, J.F. Associations of genetic variants for adult lipid levels with lipid levels in children. The Generation R Study. J. Lipid Res. 2016, 57, 2185–2192. [Google Scholar] [CrossRef]
- Justesen, J.M.; Allin, K.; Sandholt, C.H.; Borglykke, A.; Krarup, N.T.; Grarup, N.; Linneberg, A.; Jørgensen, T.; Hansen, T.; Pedersen, O. Interactions of Lipid Genetic Risk Scores With Estimates of Metabolic Health in a Danish Population. Circ. Cardiovasc. Genet. 2015, 8, 465–472. [Google Scholar] [CrossRef]
- Medeiros, A.M.; Bourbon, M. Polygenic contribution for familial hypercholesterolemia (FH). Curr. Opin. Lipidol. 2021, 1, 392–395. [Google Scholar] [CrossRef]
- Martín-Campos, J.M.; Ruiz-Nogales, S.; Ibarretxe, D.; Ortega, E.; Sánchez-Pujol, E.; Royuela-Juncadella, M.; Vila, À.; Guerrero, C.; Zamora, A.; Ferrer, C.S.I.; et al. Polygenic Markers in Patients Diagnosed of Autosomal Dominant Hypercholesterolemia in Catalonia: Distribution of Weighted LDL-c-Raising SNP Scores and Refinement of Variant Selection. Biomedicines 2020, 15, 353. [Google Scholar] [CrossRef]
- Lewis, G.F.; Xiao, C.; Hegele, R.A. Hypertriglyceridemia in the genomic era: A new paradigm. Endocr. Rev. 2015, 36, 131–147. [Google Scholar] [CrossRef] [Green Version]
- Liu, D.J.; Peloso, G.M.; Yu, H.; Butterworth, A.S.; Wang, X.; Mahajan, A.; Saleheen, D.; Emdin, C.; Alam, D.; Alves, A.C.; et al. Exome-wide association study of plasma lipids in >300,000 individuals. Nat. Genet. 2017, 49, 1758–1766. [Google Scholar] [CrossRef]
- Mathieson, I. The omnigenic model and polygenic prediction of complex traits. Am. J. Hum. Genet. 2021, 108, 1558–1563. [Google Scholar] [CrossRef] [PubMed]
- Hegele, R.A. Plasma lipoproteins: Genetic influences and clinical implications. Nat. Rev. Genet. 2009, 10, 109–121. [Google Scholar] [CrossRef]
- Yuan, G.; Al-Shali, K.Z.; Hegele, R.A. Hypertriglyceridemia: Its etiology, effects and treatment. Can. Med. Assoc. J. 2007, 176, 1113–1120. [Google Scholar] [CrossRef] [PubMed]
- Zubair, N.; Mayer-Davis, E.J.; Mendez, M.A.; Mohlke, K.L.; North, K.E.; Adair, L.S. Genetic risk score and adiposity interact to influence triglyceride levels in a cohort of Filipino women. Nutr. Diabetes 2014, 4, e118. [Google Scholar] [CrossRef] [PubMed]
- Park, S.-J.; Kim, M.-S.; Choi, S.-W.; Lee, H.-J. The Relationship of Dietary Pattern and Genetic Risk Score with the Incidence Dyslipidemia: 14-Year Follow-Up Cohort Study. Nutrients 2020, 12, 3840. [Google Scholar] [CrossRef] [PubMed]
- Pérez-Jiménez, F.; Ros, E.; Solà, R.; Godàs, G.; Pérez-Heras, A.; Serra, M.; Mostaza, J.; Pintó, X. Consejos para ayudar a controlar el colesterol con una alimentación saludable. Clin. Invest. Arterioscler. 2006, 18, 104–110. [Google Scholar] [CrossRef]
- Yamamoto, T.; Gotoda, T. Polygenic Architecture of Common Severe Hypertriglyceridemia. J. Atheroscler. Thromb. 2020, 1, 1255–1256. [Google Scholar] [CrossRef] [PubMed]
- Dron, J.S.; Wang, J.; Cao, H.; McIntyre, A.D.; Iacocca, M.A.; Menard, J.R.; Movsesyan, I.; Malloy, M.J.; Pullinger, C.R.; Kane, J.P.; et al. Severe hypertriglyceridemia is primarily polygenic. J. Clin. Lipidol. 2019, 13, 80–88. [Google Scholar] [CrossRef]
- Teslovich, T.M.; Musunuru, K.; Smith, A.V.; Edmondson, A.C.; Stylianou, I.M.; Koseki, M.; Pirruccello, J.P.; Ripatti, S.; Chasman, D.I.; Willer, C.J.; et al. Biological, clinical and population relevance of 95 loci for blood lipids. Nature 2010, 466, 707–713. [Google Scholar] [CrossRef] [Green Version]
- Stahel, P.; Xiao, C.; Hegele, R.A.; Lewis, G.F. Polygenic Risk for Hypertriglyceridemia Can Mimic a Major Monogenic Mutation. Ann. Intern. Med. 2017, 167, 360–361. [Google Scholar] [CrossRef] [PubMed]
- Oh, B.; Sung, J.; Chun, S. Potentially modifiable blood triglyceride levels by the control of conventional risk factors. Lipids Health Dis. 2019, 18, 1–9. [Google Scholar] [CrossRef] [PubMed]
- Viñals, C.; Zambón, D.; Yago, G.; Domenech, M.; Ortega, E. Secondary hypertriglyceridemia. Clin. Investig. Arterioscler. 2021, 33, 29–36, (In English, Spanish). [Google Scholar] [CrossRef] [PubMed]
- Zhou, F.; Ren, J.; Lu, X.; Ma, S.; Wu, C. Gene-Environment Interaction: A Variable Selection Perspective. Methods Mol. Biol. 2021, 2212, 191–223. [Google Scholar] [CrossRef]
- Mohan, V.; Sudha, V.; Radhika, G.; Radha, V.; Rema, M.; Deepa, R. Gene-environment interactions and the diabetes epidemic in India. Forum Nutr. 2007, 60, 118–126. [Google Scholar] [CrossRef]
- Beer, N.L.; Tribble, N.D.; McCulloch, L.J.; Roos, C.; Johnson, P.R.; Orho-Melander, M.; Gloyn, A.L. The P446L variant in GCKR associated with fasting plasma glucose and triglyceride levels exerts its effect through increased glucokinase activity in liver. Hum. Mol. Genet. 2009, 18, 4081–4088. [Google Scholar] [CrossRef]
- Cui, G.; Li, Z.; Li, R.; Huang, J.; Wang, H.; Zhang, L.; Ding, H.; Wang, D.W. A Functional Variant in APOA5/A4/C3/A1 Gene Cluster Contributes to Elevated Triglycerides and Severity of CAD by Interfering With MicroRNA 3201 Binding Efficiency. J. Am. Coll. Cardiol. 2014, 64, 267–277. [Google Scholar] [CrossRef]
- Grosskopf, I.; Baroukh, N.; Lee, S.-J.; Kamari, Y.; Harats, D.; Rubin, E.M.; Pennacchio, L.A.; Cooper, A.D. Apolipoprotein A-V deficiency results in marked hypertriglyceridemia attributable to decreased lipolysis of triglyceride-rich lipoproteins and removal of their remnants. Arterioscler. Thromb. Vasc. Biol. 2005, 25, 2573–2579. [Google Scholar] [CrossRef]
- Wu, Y.; Marvelle, A.F.; Li, J.; Croteau-Chonka, D.C.; Feranil, A.B.; Kuzawa, C.W.; Li, Y.; Adair, L.S.; Mohlke, K.L. Genetic association with lipids in Filipinos: Waist circumference modifies an APOA5 effect on triglyceride levels. J. Lipid Res. 2013, 54, 3198–3205. [Google Scholar] [CrossRef]
- Kluger, M.; Heeren, J.; Merkel, M. Apoprotein A-V: An important regulator of triglyceride metabolism. J. Inherit. Metab. Dis. 2008, 31, 281–288. [Google Scholar] [CrossRef]
- Li, T.; Guo, W.; Zhou, Z. Adipose Triglyceride Lipase in Hepatic Physiology and Pathophysiology. Biomolecules 2021, 31, 57. [Google Scholar] [CrossRef]
- Morigny, P.; Boucher, J.; Arner, P.; Langin, D. Lipid and glucose metabolism in white adipocytes: Pathways, dysfunction and therapeutics. Nat. Rev. Endocrinol. 2021, 17, 276–295. [Google Scholar] [CrossRef] [PubMed]
- Chan, D.C.; Watts, G.F.; Redgrave, T.G.; Mori, T.A.; Barrett, P.R. Apolipoprotein B-100 kinetics in visceral obesity: Associations with plasma apolipoprotein C-III concentration. Metabolism 2002, 51, 1041–1046. [Google Scholar] [CrossRef] [PubMed]
- Pollin, T.I.; Jablonski, K.A.; McAteer, J.B.; Saxena, R.; Kathiresan, S.; Kahn, S.E.; Goldberg, R.B.; Altshuler, D.; Florez, J.C.; Diabetes Prevention Program Research Group. Triglyceride response to an intensive lifestyle intervention is enhanced in carriers of the GCKR Pro446Leu polymorphism. J. Clin. Endocrinol. Metab. 2011, 96, E1142–E1147. [Google Scholar] [CrossRef] [PubMed]
- Hannon, B.A.; Edwards, C.G.; Thompson, S.V.; Reeser, G.E.; Burd, N.A.; Holscher, H.D.; Teran-Garcia, M.; Khan, N.A. Single Nucleotide Polymorphisms Related to Lipoprotein Metabolism Are Associated with Blood Lipid Changes following Regular Avocado Intake in a Randomized Control Trial among Adults with Overweight and Obesity. J. Nutr. 2020, 150, 1379–1387. [Google Scholar] [CrossRef]
- Tikkanen, E.; Tuovinen, T.; Widén, E.; Lehtimäki, T.; Viikari, J.; Kähönen, M.; Peltonen, L.; Raitakari, O.T.; Ripatti, S. Association of Known Loci With Lipid Levels Among Children and Prediction of Dyslipidemia in Adults. Circ. Cardiovasc. Genet. 2011, 4, 673–680. [Google Scholar] [CrossRef]
- Tagtow, A.; Rahavi, E.; Bard, S.; Stoody, E.E.; Casavale, K.; Mosher, A. Coming Together to Communicate the 2015-2020 Dietary Guidelines for Americans. J. Acad. Nutr. Diet. 2016, 116, 209–212. [Google Scholar] [CrossRef] [Green Version]

| CLINICAL VARIABLES | Total | GRS | p | |
|---|---|---|---|---|
| n = 276 | ≤6 n = 113 | >6 n = 163 | ||
| Sex (male) (%) | 204 (73.9%) | 85 (75.2%) | 119 (73%) | 0.680 |
| Age (years) | 52.1 (10.5) | 51.2 (9.5) | 52.7 (11.1) | 0.260 |
| BMI (kg/m2) | 28.7 (3.8) | 28.3 (4.2) | 28.9 (3.5) | 0.265 |
| Waist circumference (cm) | 100.4 (12.5) | 102 (15.9) | 99.3 (9.8) | 0.137 |
| Current or former smoker (%) | 169 (61.2%) | 72 (63.7%) | 97 (59.5%) | 0.481 |
| Alcohol consumption (units/w) | 1.2 (2.7) | 1.5 (3.4) | 0.9 (2.0) | 0.069 |
| Diet score (*) | 7.5 (3.3) | 7.3 (3.4) | 7.6 (3.3) | 0.440 |
| Physical activity (hours/week) | 2.6 (3.0) | 2.5 (3.2) | 2.7 (2.9) | 0.558 |
| HTA (%) | 94 (34.1%) | 40 (35.4%) | 54 (33.1%) | 0.696 |
| DM (%) | 49 (17.8) | 18 (15.9%) | 31 (19%) | 0.509 |
| Chronic renal disease (%) | 19 (6.9) | 6 (5.3%) | 13 (8%) | 0.390 |
| Atherothrombotic cardiovascular disease | 75 (27.2%) | 30 (26.5%) | 45 (27.6%) | 0.846 |
| Pancreatitis (%) | 2 (0.7%) | 0 (0%) | 2 (1.2%) | 0.515 |
| Total cholesterol (mmol/L) * | 6.7 (1.8) | 6.4 (1.8) | 6.9 (1.8) | 0.029 |
| HDL-c (mmol/L) * | 0.98 (0.32) | 1.0 (0.33) | 0.96 (0.31) | 0.269 |
| LDL-c (mmol/L) * | 3.6 (1.5) | 3.7 (1.6) | 3.4 (1.4) | 0.272 |
| non-HDL-c (mmol/L) * | 5.7 (1.8) | 5.4 (1.8) | 6.0 (1.8) | 0.018 |
| TG (mmol/) | 5.3 (3.4 to 9.6) | 4.6 (3.0 to 6.9) | 5.8 (3.9 to 11.6) | <0.001 |
| ApoB (mg/dL) | 1.2 (0.4) | 1.2 (0.4) | 1.2 (0.4) | 0.624 |
| HbA1c (%) | 5.87 (0.71) | 5.88 (0.76) | 5.85 (0.67) | 0.764 |
| Regression Coefficient (95% CI) | Standardized Coefficient | p | R2 | |
|---|---|---|---|---|
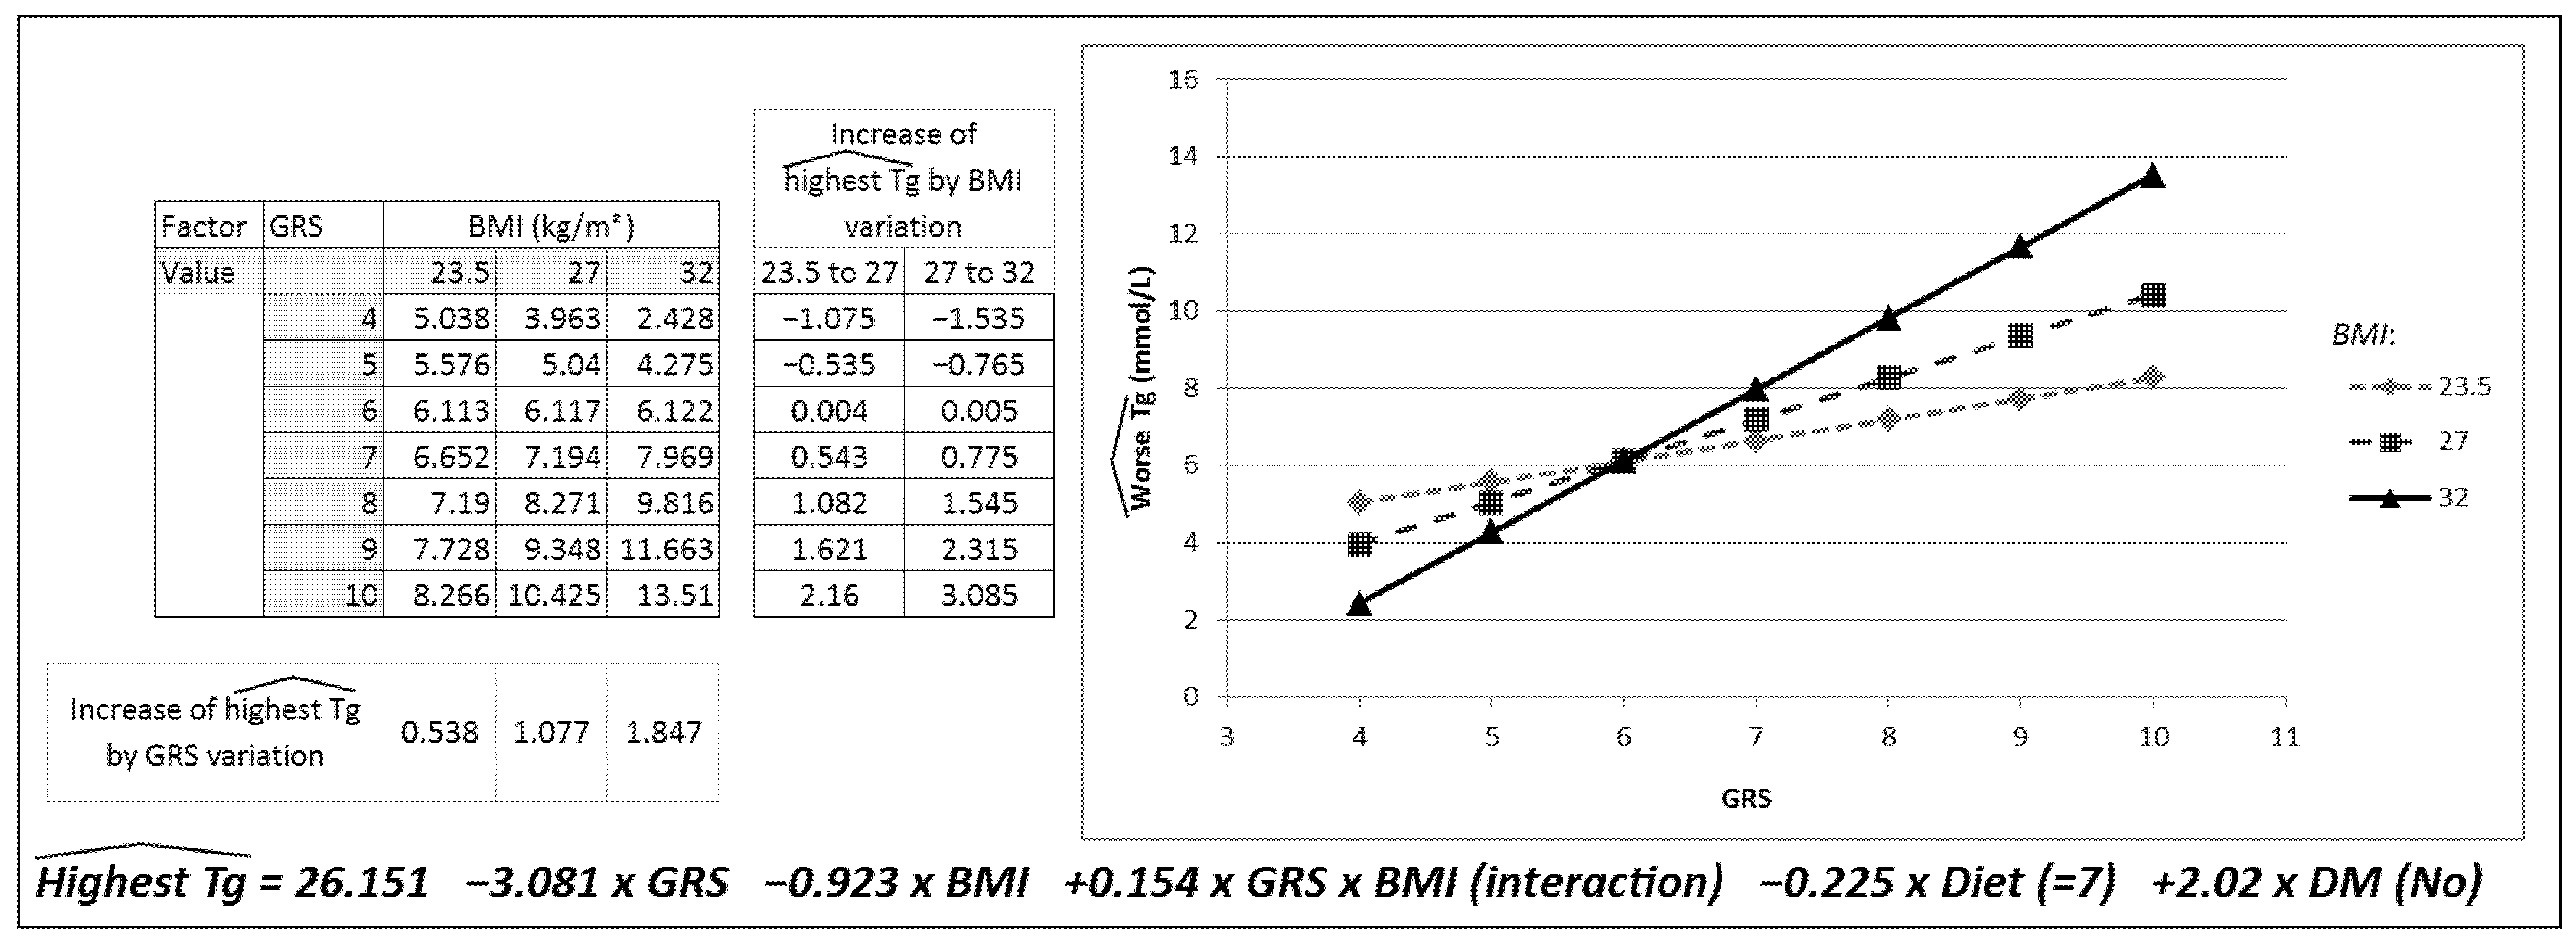
| Constant | 26.151 (0.28 to 52.02) | 0.048 | 0.131 | |
| GRS | −3.08 (−6.80 to 0.64) | −0.70 | 0.104 | |
| BMI (kg/m2) | −0.923 (−1.83 to −0.20) | −0.53 | 0.045 | |
| GRS * BMI interaction | 0.15 (0.03 to 0.28) | 0.07 | 0.020 | |
| Diet | −0.23 (−0.46 to 0.01) | −0.11 | 0.056 | |
| DM | 2.02 (0.01 to 4.03) | 0.12 | 0.049 |
Publisher’s Note: MDPI stays neutral with regard to jurisdictional claims in published maps and institutional affiliations. |
© 2022 by the authors. Licensee MDPI, Basel, Switzerland. This article is an open access article distributed under the terms and conditions of the Creative Commons Attribution (CC BY) license (https://creativecommons.org/licenses/by/4.0/).
Share and Cite
Esteve-Luque, V.; Fanlo-Maresma, M.; Padró-Miquel, A.; Corbella, E.; Rivas-Regaira, M.; Pintó, X.; Candás-Estébanez, B. Polygenic Risk of Hypertriglyceridemia Is Modified by BMI. Int. J. Mol. Sci. 2022, 23, 9837. https://doi.org/10.3390/ijms23179837
Esteve-Luque V, Fanlo-Maresma M, Padró-Miquel A, Corbella E, Rivas-Regaira M, Pintó X, Candás-Estébanez B. Polygenic Risk of Hypertriglyceridemia Is Modified by BMI. International Journal of Molecular Sciences. 2022; 23(17):9837. https://doi.org/10.3390/ijms23179837
Chicago/Turabian StyleEsteve-Luque, Virginia, Marta Fanlo-Maresma, Ariadna Padró-Miquel, Emili Corbella, Maite Rivas-Regaira, Xavier Pintó, and Beatriz Candás-Estébanez. 2022. "Polygenic Risk of Hypertriglyceridemia Is Modified by BMI" International Journal of Molecular Sciences 23, no. 17: 9837. https://doi.org/10.3390/ijms23179837
APA StyleEsteve-Luque, V., Fanlo-Maresma, M., Padró-Miquel, A., Corbella, E., Rivas-Regaira, M., Pintó, X., & Candás-Estébanez, B. (2022). Polygenic Risk of Hypertriglyceridemia Is Modified by BMI. International Journal of Molecular Sciences, 23(17), 9837. https://doi.org/10.3390/ijms23179837