
The Diurnal Blood Metabolome and Effects of Vitamin D Supplementation: A Randomised Crossover Trial in Postmenopausal Women

 , ,
, , 
Abstract
1. Introduction
2. Results
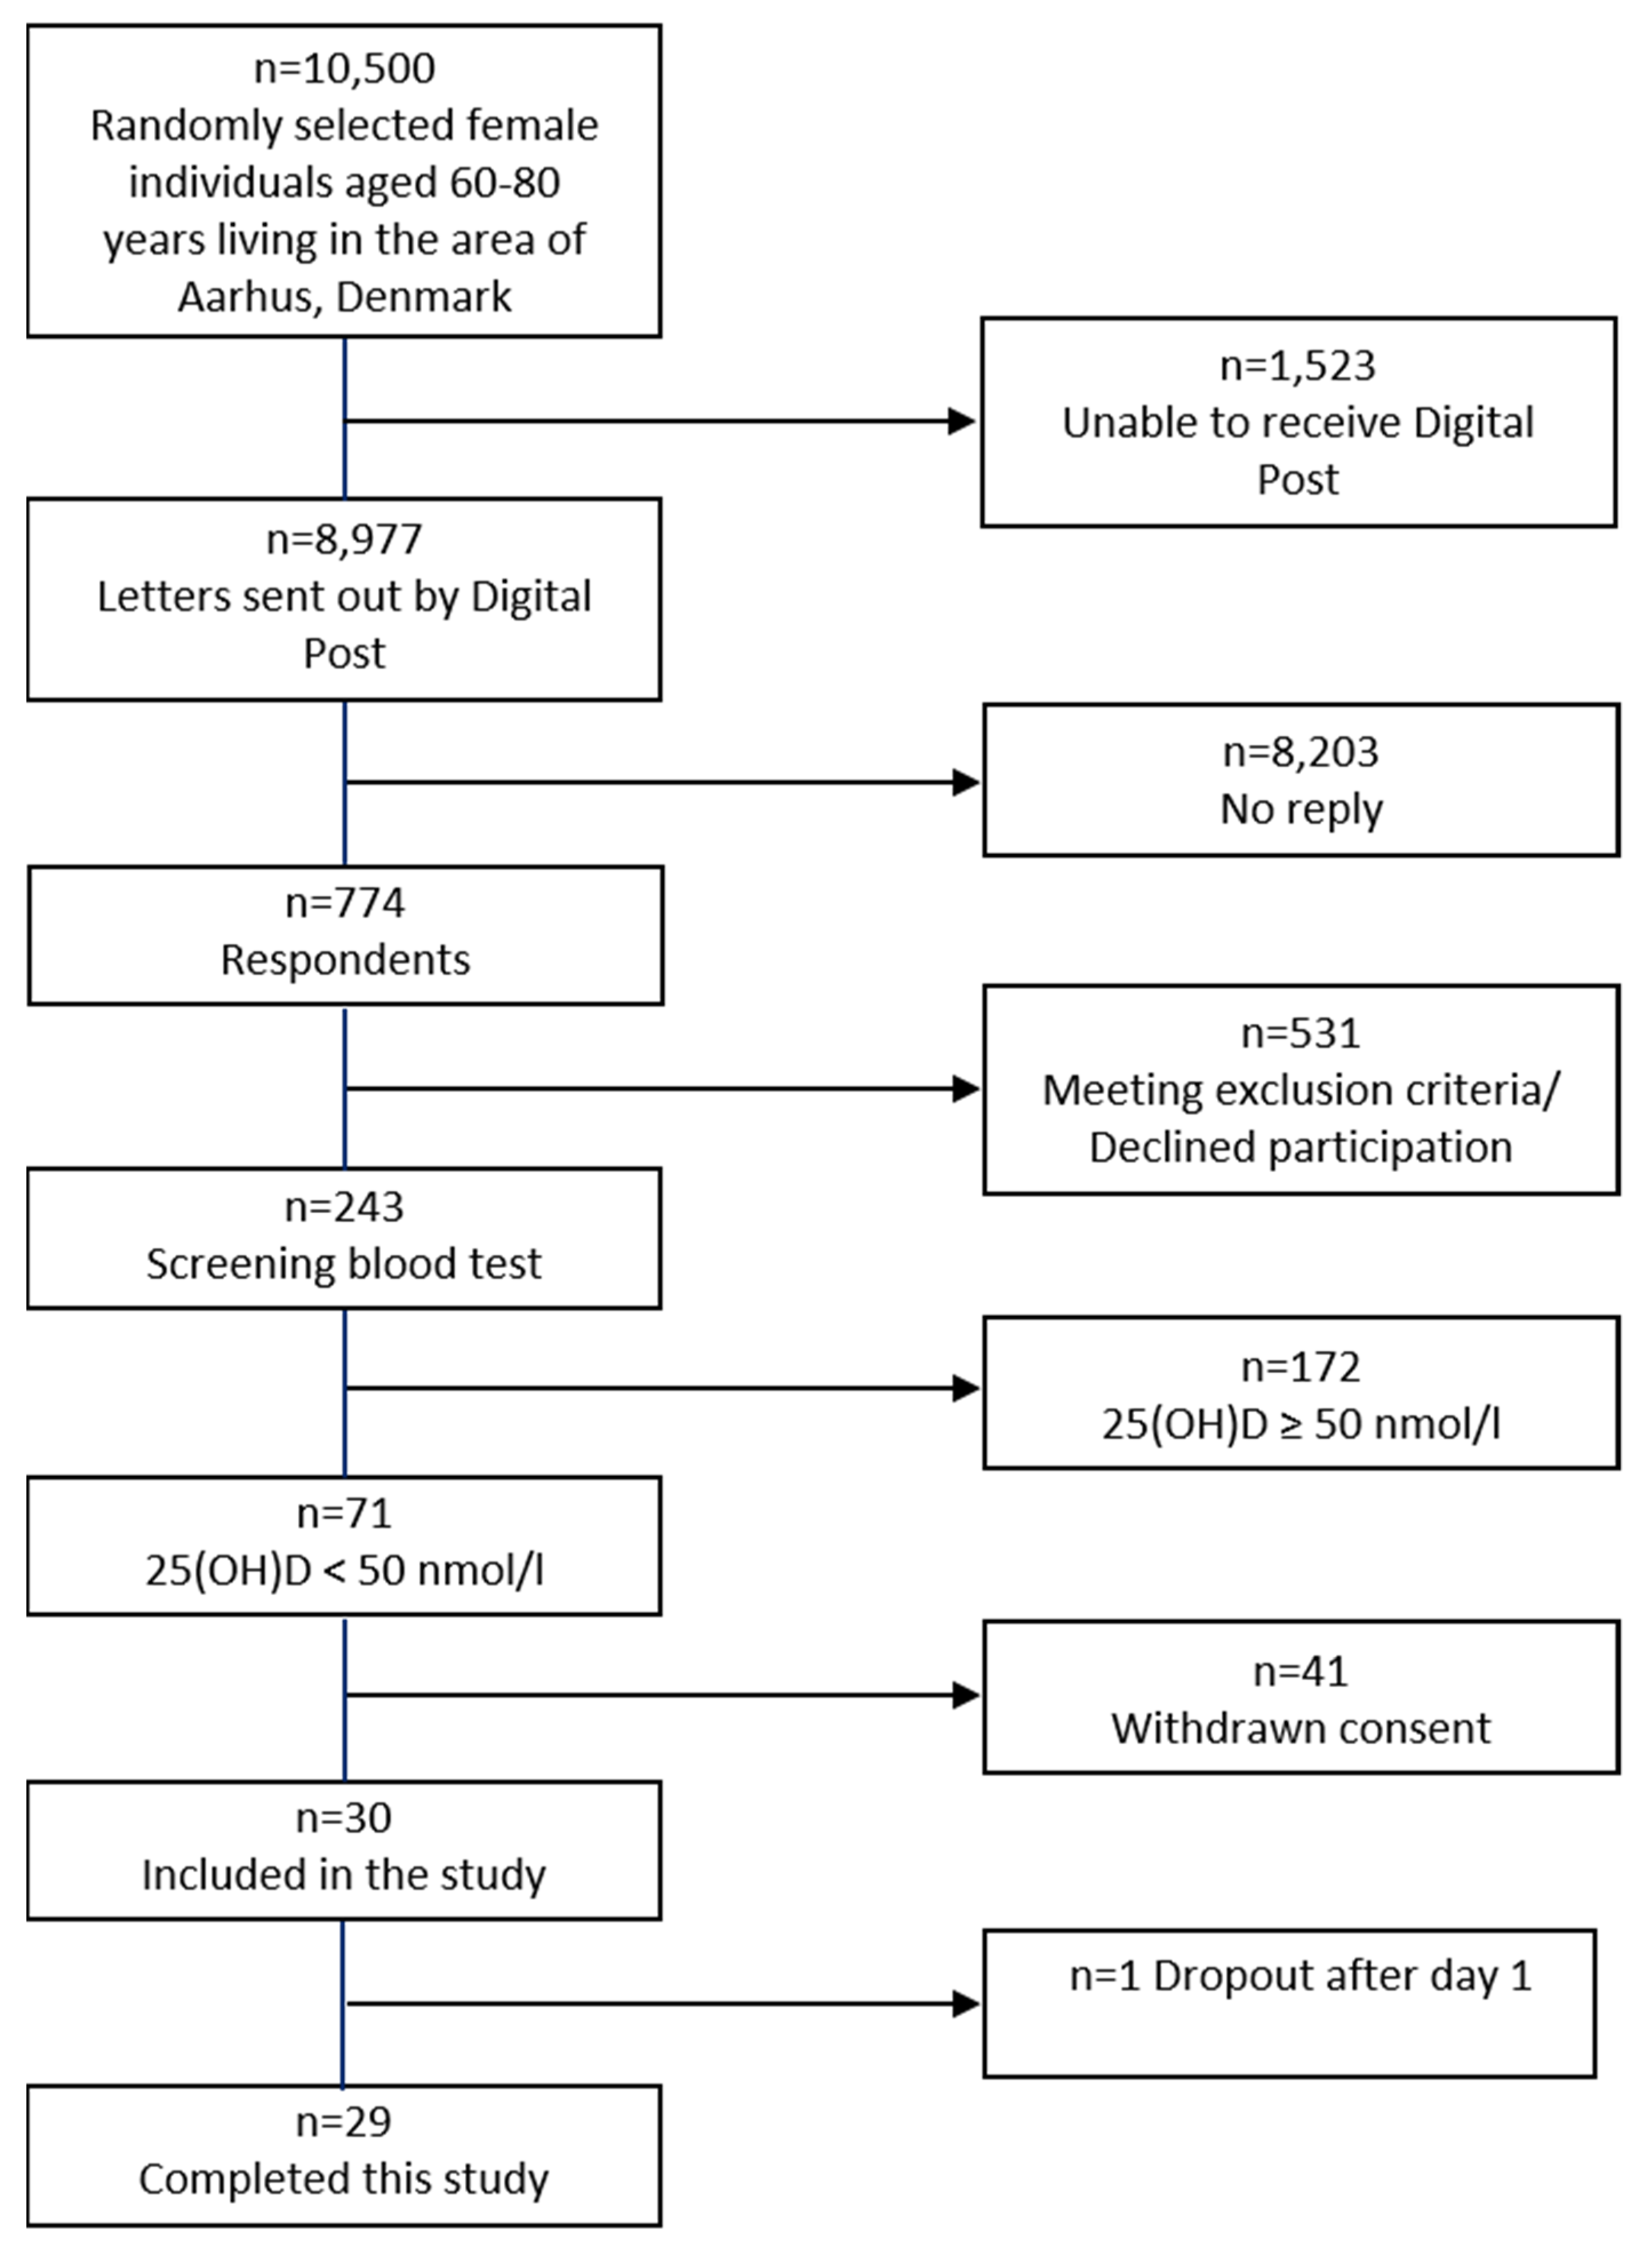
2.1. Demography
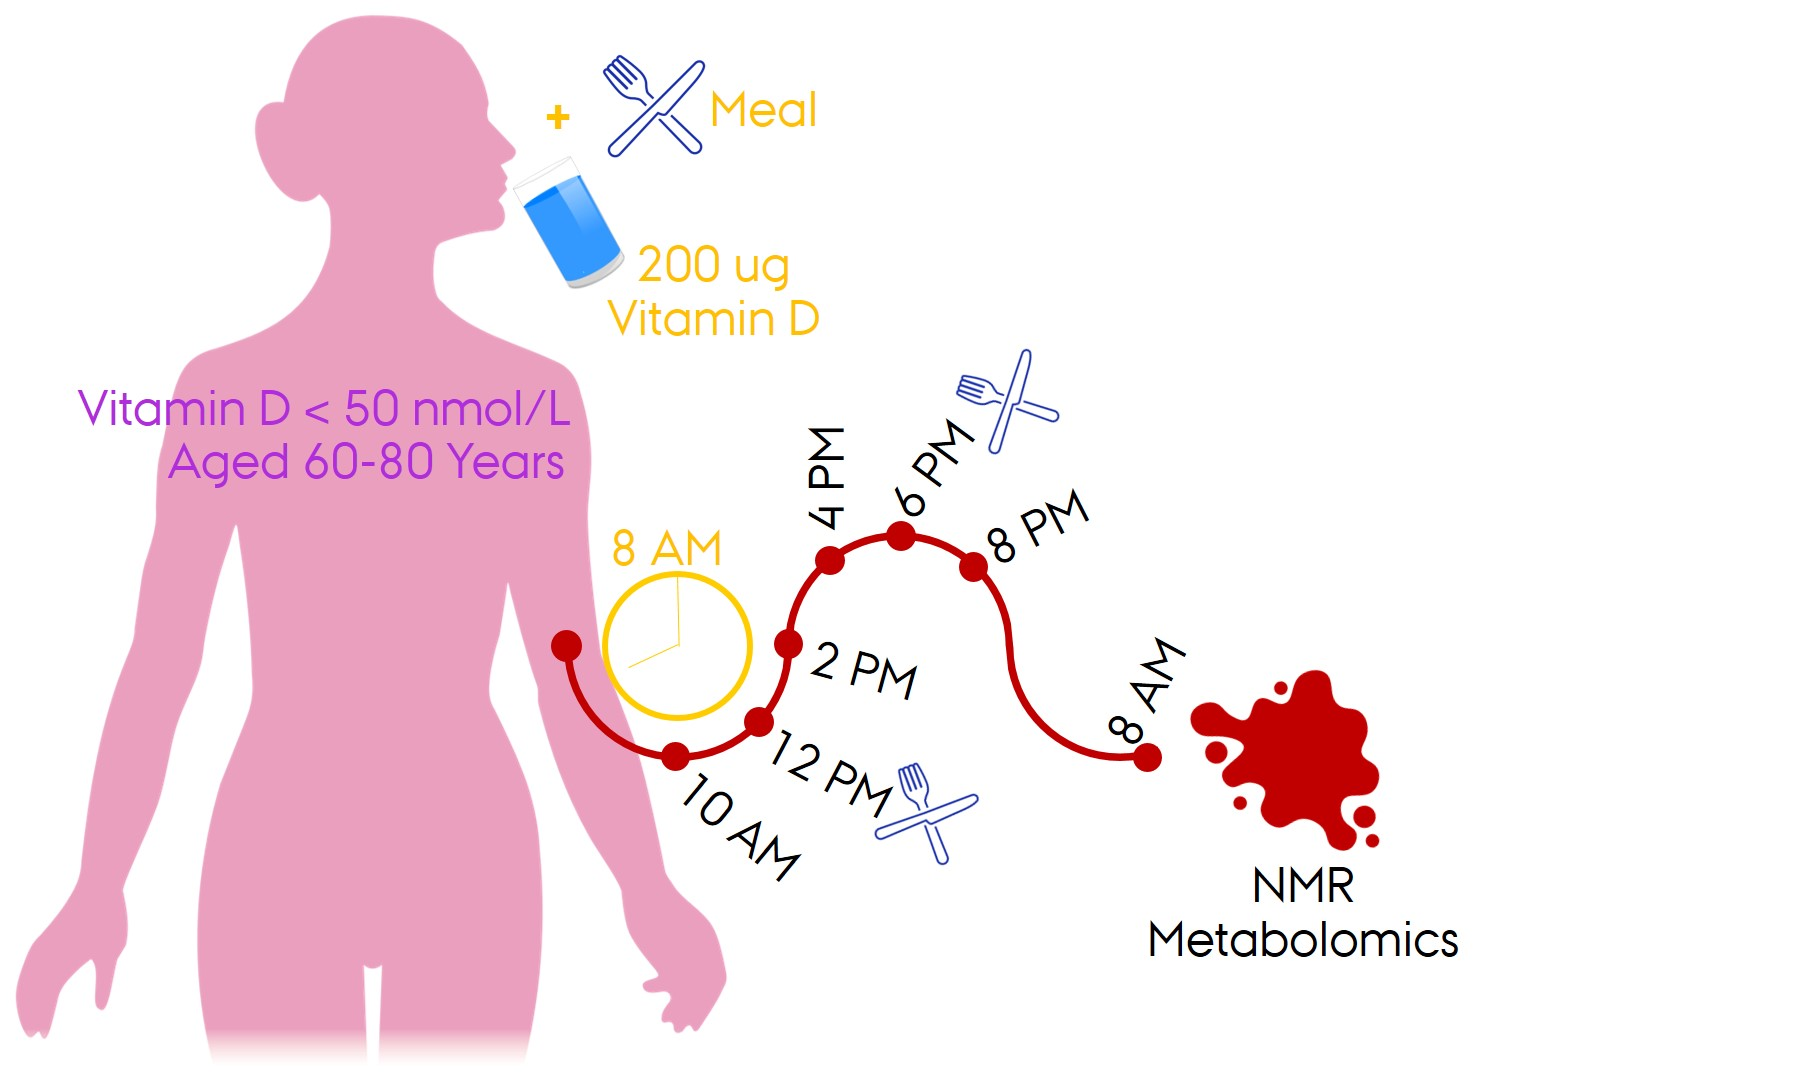
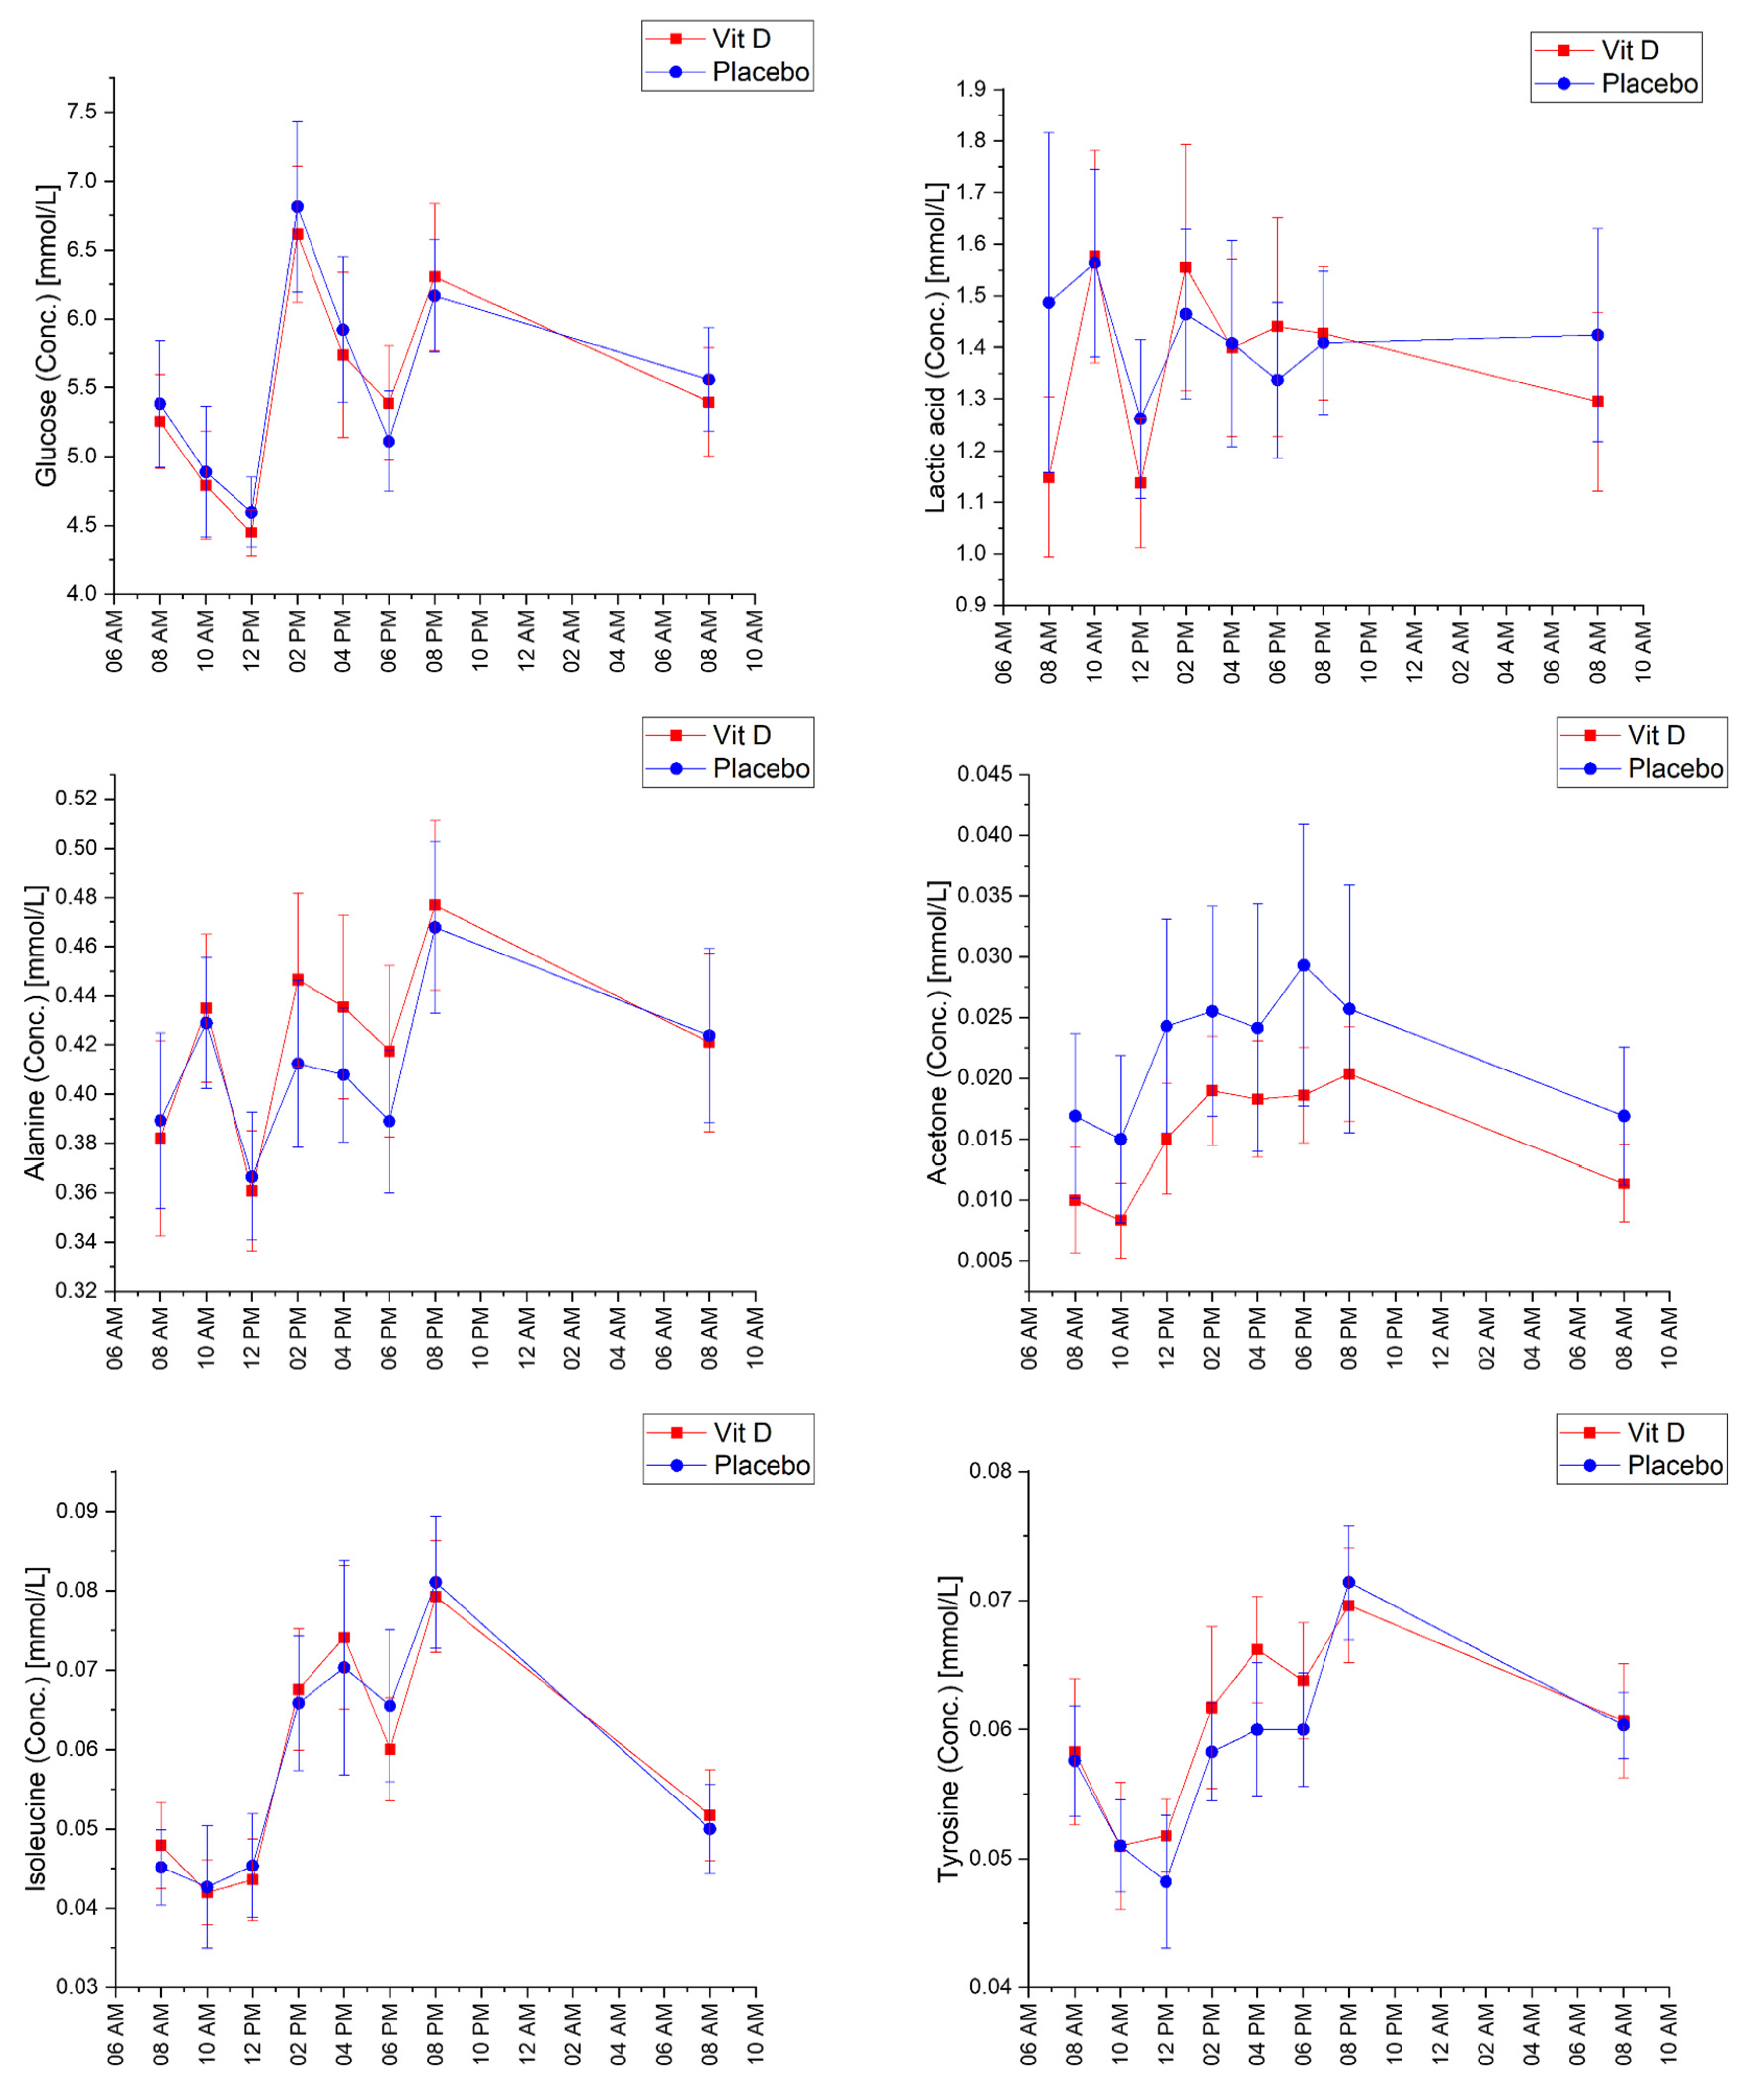
2.2. Diurnal Effects
2.3. Vitamin D3 vs. Placebo
3. Discussion
4. Materials and Methods
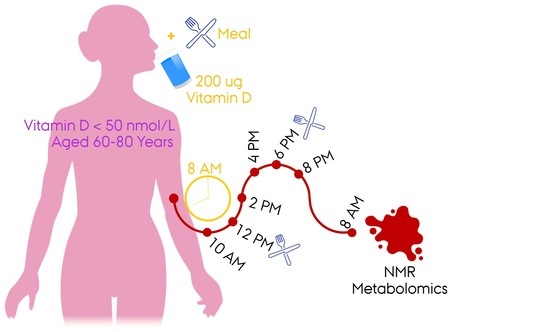
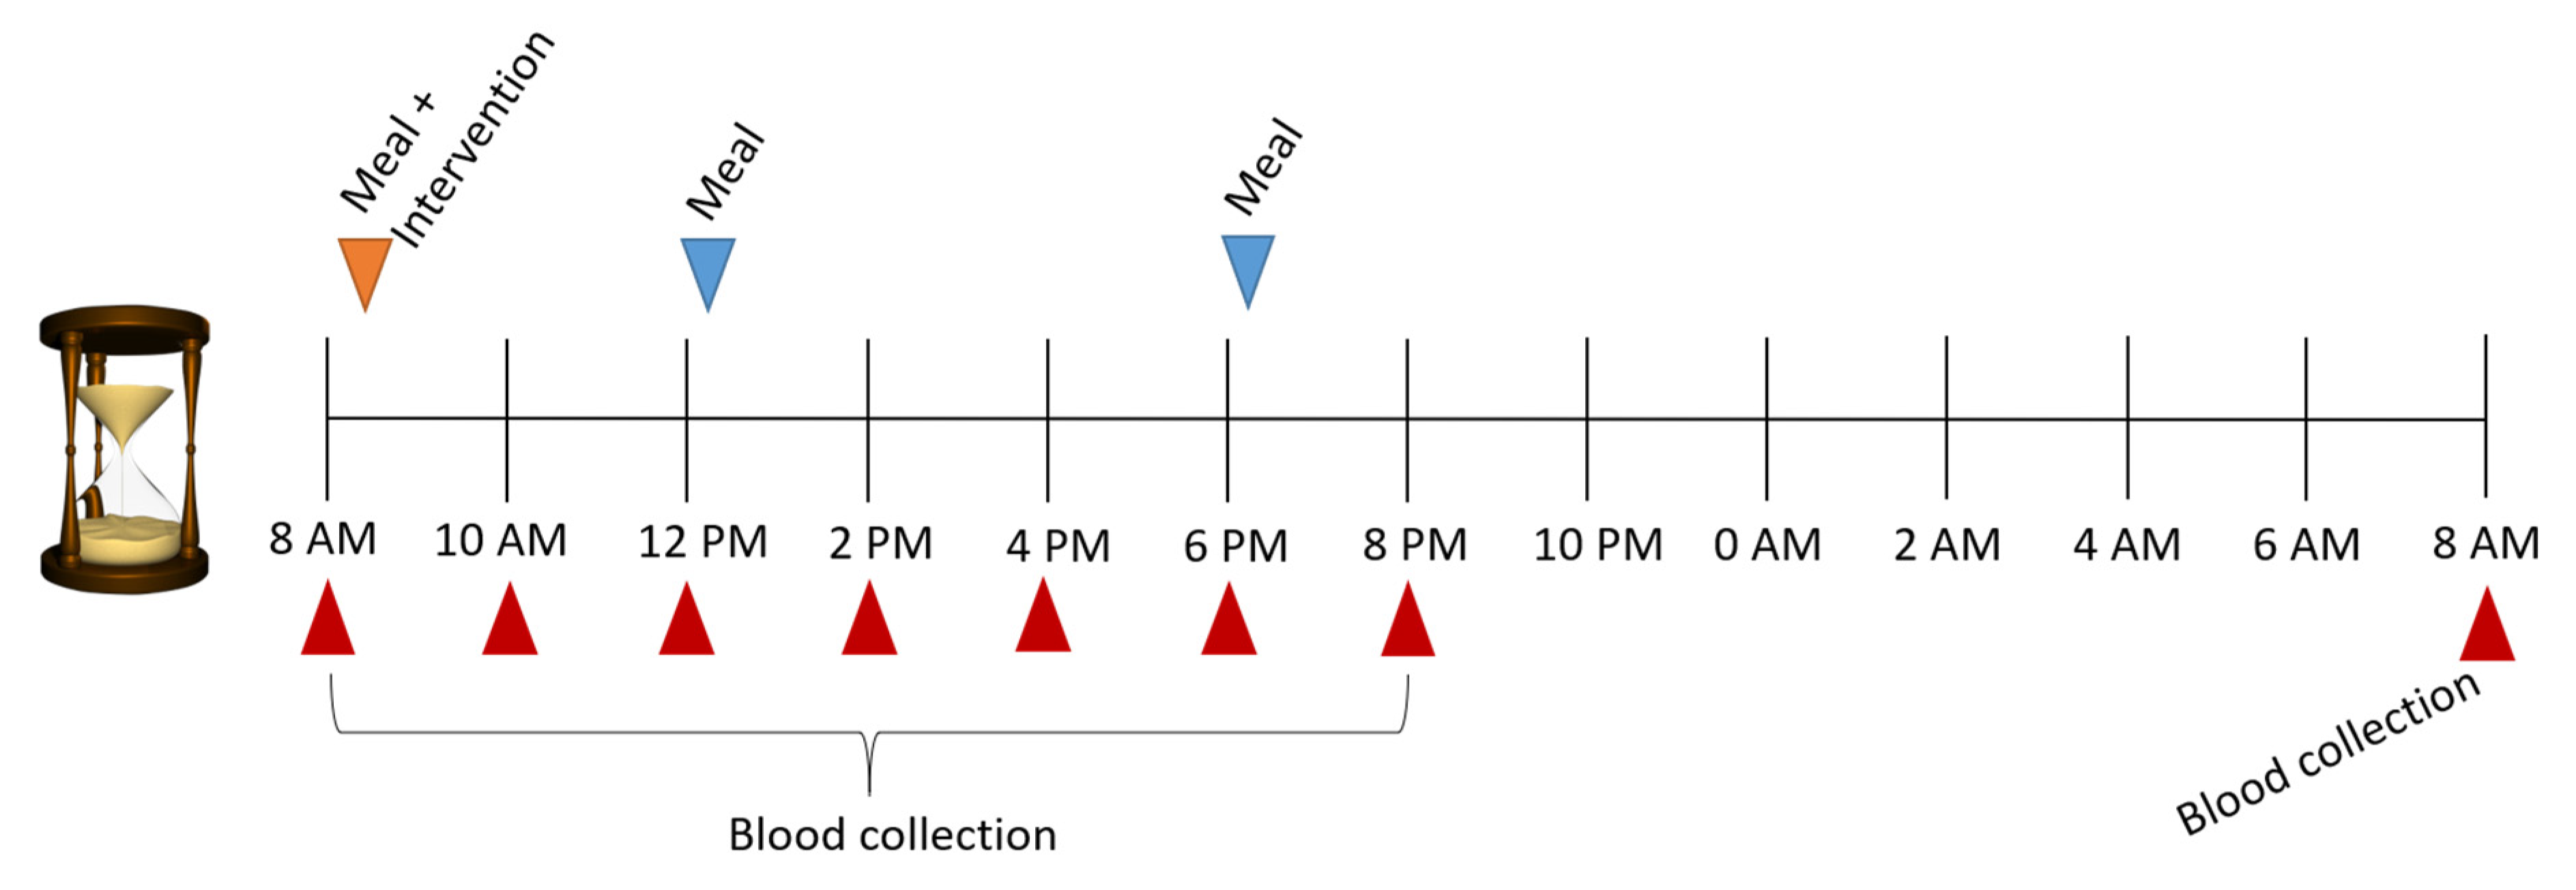
4.1. Study Design
4.2. Measurements
4.3. NMR Analyses
4.4. Statistics
Supplementary Materials
Author Contributions
Funding
Institutional Review Board Statement
Informed Consent Statement
Data Availability Statement
Acknowledgments
Conflicts of Interest
References
- Bouillon, R.; Carmeliet, G.; Daci, E.; Segaert, S.; Verstuyf, A. Vitamin D Metabolism and Action. Osteoporos. Int. 1998, 8, S13–S19. [Google Scholar] [CrossRef] [PubMed]
- Kimlin, M.G. Geographic location and vitamin D synthesis. Mol. Asp. Med. 2008, 29, 453–461. [Google Scholar] [CrossRef] [PubMed]
- Cashman, K.D. Vitamin D Deficiency: Defining, Prevalence, Causes, and Strategies of Addressing. Calcif. Tissue Int. 2020, 106, 14–29. [Google Scholar] [CrossRef] [PubMed]
- O’Neill, C.M.; Kazantzidis, A.; Ryan, M.J.; Barber, N.; Sempos, C.T.; Durazo-Arvizu, R.A.; Jorde, R.; Grimnes, G.; Eiriksdottir, G.; Gudnason, V.; et al. Seasonal Changes in Vitamin D-Effective UVB Availability in Europe and Associations with Population Serum 25-Hydroxyvitamin D. Nutrients 2016, 8, 533. [Google Scholar] [CrossRef] [PubMed]
- Hansen, L.; Tjonneland, A.; Koster, B.; Brot, C.; Andersen, R.; Cohen, A.S.; Frederiksen, K.; Olsen, A. Vitamin D Status and Seasonal Variation among Danish Children and Adults: A Descriptive Study. Nutrients 2018, 10, 1801. [Google Scholar] [CrossRef]
- Rejnmark, L.; Lauridsen, A.L.; Vestergaard, P.; Heickendorff, L.; Andreasen, F.; Mosekilde, L. Diurnal rhythm of plasma 1,25-dihydroxyvitamin D and vitamin D-binding protein in postmenopausal women: Relationship to plasma parathyroid hormone and calcium and phosphate metabolism. Eur. J. Endocrinol. 2002, 146, 635–642. [Google Scholar] [CrossRef]
- French, C.B.; McDonnell, S.L.; Vieth, R. 25-Hydroxyvitamin D variability within-person due to diurnal rhythm and illness: A case report. J. Med. Case Rep. 2019, 13, 29. [Google Scholar] [CrossRef]
- Tokarz, J.; Haid, M.; Cecil, A.; Prehn, C.; Artati, A.; Moller, G.; Adamski, J. Endocrinology Meets Metabolomics: Achievements, Pitfalls, and Challenges. Trends Endocrinol. Metab. 2017, 28, 705–721. [Google Scholar] [CrossRef]
- Kaddurah-Daouk, R.; Weinshilboum, R.M.; Pharmacometabolomics Research Network. Pharmacometabolomics: Implications for clinical pharmacology and systems pharmacology. Clin. Pharmacol. Ther. 2014, 95, 154–167. [Google Scholar] [CrossRef]
- Park, Y.; Kim, S.B.; Wang, B.; Blanco, R.A.; Le, N.A.; Wu, S.; Accardi, C.J.; Alexander, R.W.; Ziegler, T.R.; Jones, D.P. Individual variation in macronutrient regulation measured by proton magnetic resonance spectroscopy of human plasma. Am. J. Physiol. Regul. Integr. Comp. Physiol. 2009, 297, R202–R209. [Google Scholar] [CrossRef]
- Nagana Gowda, G.; Raftery, D. Overview of NMR Spectroscopy-Based Metabolomics: Opportunities and Challenges. In NMR-Based Metabolomics Methods and Protocols; Nagana Gowda, G., Raftery, D., Eds.; Humana Press: Totova, NJ, USA, 2019; pp. 3–14. [Google Scholar]
- Beckonert, O.; Keun, H.C.; Ebbels, T.M.; Bundy, J.; Holmes, E.; Lindon, J.C.; Nicholson, J.K. Metabolic profiling, metabolomic and metabonomic procedures for NMR spectroscopy of urine, plasma, serum and tissue extracts. Nat. Protoc. 2007, 2, 2692–2703. [Google Scholar] [CrossRef] [PubMed]
- Dona, A.C.; Jiménez, B.; Schäfer, H.; Humpfer, E.; Spraul, M.; Lewis, M.R.; Pearce, J.T.; Holmes, E.; Lindon, J.C.; Nicholson, J.K. Precision high-throughput proton NMR spectroscopy of human urine, serum, and plasma for large-scale metabolic phenotyping. Anal. Chem. 2014, 86, 9887–9894. [Google Scholar] [CrossRef] [PubMed]
- Hancox, T.P.M.; Skene, D.J.; Dallmann, R.; Dunn, W.B. Tick-Tock Consider the Clock: The Influence of Circadian and External Cycles on Time of Day Variation in the Human Metabolome—A Review. Metabolites 2021, 11, 328. [Google Scholar] [CrossRef] [PubMed]
- Ang, J.E.; Revell, V.; Mann, A.; Mantele, S.; Otway, D.T.; Johnston, J.D.; Thumser, A.E.; Skene, D.J.; Raynaud, F. Identification of human plasma metabolites exhibiting time-of-day variation using an untargeted liquid chromatography-mass spectrometry metabolomic approach. Chronobiol. Int. 2012, 29, 868–881. [Google Scholar] [CrossRef] [PubMed]
- Minamo, Y.; Kasukawa, T.; Kakazu, Y.; Iigo, M.; Sugimoto, M.; Ikeda, S.; Yasui, A.; van der Horst, G.T.J.; Soga, T.; Ueda, H.R. Measurement of internal body time by blood metabolomics. PNAS 2009, 106, 9890–9895. [Google Scholar] [CrossRef]
- Kasukawa, T.; Sugimoto, M.; Hida, A.; Minami, Y.; Mori, M.; Honma, S.; Honma, K.; Mishima, K.; Soga, T.; Ueda, H.R. Human blood metabolite timetable indicates internal body time. Proc. Natl. Acad. Sci. USA 2012, 109, 15036–15041. [Google Scholar] [CrossRef]
- Dallmann, R.; Viola, A.U.; Tarokh, L.; Cajochen, C.; Brown, S.A. The human circadian metabolome. Proc. Natl. Acad. Sci. USA 2012, 109, 2625–2629. [Google Scholar] [CrossRef]
- Isherwood, C.M.; Van der Veen, D.R.; Johnston, J.D.; Skene, D.J. Twenty-four-hour rhythmicity of circulating metabolites: Effect of body mass and type 2 diabetes. FASEB J. 2017, 31, 5557–5567. [Google Scholar] [CrossRef]
- Krug, S.; Kastenmuller, G.; Stuckler, F.; Rist, M.J.; Skurk, T.; Sailer, M.; Raffler, J.; Romisch-Margl, W.; Adamski, J.; Prehn, C.; et al. The dynamic range of the human metabolome revealed by challenges. FASEB J. 2012, 26, 2607–2619. [Google Scholar] [CrossRef]
- Clayton, T.A.; Lindon, J.C.; Cloarec, O.; Antti, H.; Charuel, C.; Hanton, G.; Provost, J.P.; Le Net, J.L.; Baker, D.; Walley, R.J.; et al. Pharmaco-metabonomic phenotyping and personalized drug treatment. Nature 2006, 440, 1073–1077. [Google Scholar] [CrossRef]
- Kaddurah-Daouk, R.; Weinshilboum, R.; Pharmacometabolomics Research Network. Metabolomic Signatures for Drug Response Phenotypes: Pharmacometabolomics Enables Precision Medicine. Clin. Pharmacol. Ther. 2015, 98, 71–75. [Google Scholar] [CrossRef] [PubMed]
- Amrein, K.; Lasky-Su, J.A.; Dobnig, H.; Christopher, K.B. Metabolomic basis for response to high dose vitamin D in critical illness. Clin. Nutr. 2021, 40, 2053–2060. [Google Scholar] [CrossRef] [PubMed]
- Shirvani, A.; Kalajian, T.A.; Song, A.; Allen, R.; Charoenngam, N.; Lewanczuk, R.; Holick, M.F. Variable Genomic and Metabolomic Responses to Varying Doses of Vitamin D Supplementation. Anticancer Res. 2020, 40, 535–543. [Google Scholar] [CrossRef] [PubMed]
- Nelson, S.M.; Panagiotou, O.A.; Anic, G.M.; Mondul, A.M.; Mannisto, S.; Weinstein, S.J.; Albanes, D. Metabolomics analysis of serum 25-hydroxy-vitamin D in the Alpha-Tocopherol, Beta-Carotene Cancer Prevention (ATBC) Study. Int. J. Epidemiol. 2016, 45, 1458–1468. [Google Scholar] [CrossRef]
- Leung, R.Y.H.; Li, G.H.Y.; Cheung, B.M.Y.; Tan, K.C.B.; Kung, A.W.C.; Cheung, C.L. Serum metabolomic profiling and its association with 25-hydroxyvitamin D. Clin. Nutr. 2020, 39, 1179–1187. [Google Scholar] [CrossRef]
- Bislev, L.S.; Sundekilde, U.K.; Kilic, E.; Dalsgaard, T.K.; Rejnmark, L.; Bertram, H.C. Circulating Levels of Muscle-Related Metabolites Increase in Response to a Daily Moderately High Dose of a Vitamin D3 Supplement in Women with Vitamin D Insufficiency—Secondary Analysis of a Randomized Placebo-Controlled Trial. Nutrients 2020, 12, 1310. [Google Scholar] [CrossRef]
- Bislev, L.S.; Langagergaard Rodbro, L.; Rolighed, L.; Sikjaer, T.; Rejnmark, L. Effects of Vitamin D3 Supplementation on Muscle Strength, Mass, and Physical Performance in Women with Vitamin D Insufficiency: A Randomized Placebo-Controlled Trial. Calcif. Tissue Int. 2018, 103, 483–493. [Google Scholar] [CrossRef]
- Itkonen, S.T.; Andersen, R.; Bjork, A.K.; Brugard Konde, A.; Eneroth, H.; Erkkola, M.; Holvik, K.; Madar, A.A.; Meyer, H.E.; Tetens, I.; et al. Vitamin D status and current policies to achieve adequate vitamin D intake in the Nordic countries. Scand. J. Public Health 2021, 49, 616–627. [Google Scholar] [CrossRef]
- Xia, J.; Wishart, D.S. Web-based inference of biological patterns, functions and pathways from metabolomic data using MetaboAnalyst. Nat. Protoc. 2011, 6, 743–760. [Google Scholar] [CrossRef]
- Dabek, A.; Wojtala, M.; Pirola, L.; Balcerczyk, A. Modulation of Cellular Biochemistry, Epigenetics and Metabolomics by Ketone Bodies. Implications of the Ketogenic Diet in the Physiology of the Organism and Pathological States. Nutrients 2020, 12, 788. [Google Scholar] [CrossRef]
- Åkerblom, H.K.; Hiekkala, H. Diurnal Blood and Urine Glucose and Acetone Bodies in Labile Juvenile Diabetics on One- and Two-Injection Insulin Therapy. Diabetologia 1970, 6, 130–134. [Google Scholar] [CrossRef] [PubMed][Green Version]
- Mendoza, A.; Takemoto, Y.; Cruzado, K.T.; Masoud, S.S.; Nagata, A.; Tantipanjaporn, A.; Okuda, S.; Kawagoe, F.; Sakamoto, R.; Odagi, M.; et al. Controlled lipid beta-oxidation and carnitine biosynthesis by a vitamin D metabolite. Cell Chem. Biol. 2022, 29, 660–669.e12. [Google Scholar] [CrossRef] [PubMed]
- Ayyar, V.S.; Sukumaran, S. Circadian rhythms: Influence on physiology, pharmacology, and therapeutic interventions. J. Pharmacokinet. Pharmacodyn. 2021, 48, 321–338. [Google Scholar] [CrossRef]
- Holecek, M. Why Are Branched-Chain Amino Acids Increased in Starvation and Diabetes? Nutrients 2020, 12, 3087. [Google Scholar] [CrossRef] [PubMed]
- Bertram, H.C.; Malmendal, A.; Petersen, B.O.; Madsen, J.C.; Pedersen, H.; Nielsen, N.C.; Hoppe, C.; Mølgaard, C.; Michaelsen, K.F.; Duus, J.Ø. Effect of magnetic field strength on NMR-based metabonomic human urine data—A comparative study of 250, 400, 500 and 800 MHz. Anal. Chem. 2007, 79, 7110–7115. [Google Scholar] [CrossRef] [PubMed]
- Letertre, M.P.M.; Giraudeau, P.; de Tullio, P. Nuclear Magnetic Resonance Spectroscopy in Clinical Metabolomics and Personalized Medicine: Current Challenges and Perspectives. Front. Mol. Biosci. 2021, 8, 698337. [Google Scholar] [CrossRef] [PubMed]
- Harris, P.; Taylor, R.; Thielke, R.; Payne, J.; Gonzalez, N.; Conde, J. Research electronic data capture (REDCap)—A metadata-driven methodology and workflow process for providing translational research informatics support. J. Biomed. Inform. 2009, 42, 377–381. [Google Scholar] [CrossRef]
- Harris, P.; Taylor, R.; Minor, B.; Elliott, V.; Fernandez, M.; O’Neal, L.; McLeod, L.; Delacqua, G.; Delacqua, F.; Kirby, J.; et al. REDCap Consortium, The REDCap consortium: Building an international community of software partners. J. Biomed. Inform. 2019, 95, 103208i. [Google Scholar] [CrossRef]


| N | Mean (SD) | Reference Interval | ||
| Age, years | 29 | 69 (4.11) | 60–80 | |
| a BMI, kg/m2 | 29 | 28 (6.93) | 18.5–24.9 | |
| Plasma | ||||
| Screening | Creatinine, µmol/L | 29 | 58 (10.54) | 45–90 |
| Screening | b eGFR/1.73 m2, mL/min | 29 | 88 (10.42) | >60 |
| Screening | 25-hydroxy vitamin D, nmol/L | 29 | 39 (7.67) | >50 |
| Day 1 | 25-hydroxy vitamin D, nmol/L | 29 | 45 (11.36) | >50 |
| Day 2 | 25-hydroxy vitamin D, nmol/L | 29 | 50 (11.05) | >50 |
| Metabolite | Test of Same Time Effect p-Value | Mean Difference (95% CI) between Vitamin D and Placebo, mmol/L |
|---|---|---|
| Acetic acid | 0.50 | 0.003 (0.000; 0.005), p = 0.02 |
| Acetone | 0.57 | 0.003 (0.002; 0.005), p < 0.001 |
| Alanine | 0.91 | −0.002 (−0.017; 0.014), p = 0.84 |
| Citric acid | 0.98 | −0.007 (−0.017; 0.003), p = 0.17 |
| Creatine | 0.28 | 0.000 (−0.005; 0.005), p = 0.96 |
| Creatinine | 0.29 | −0.001 (−0.004; 0.002), p = 0.43 |
| Dimethyl-sulfone | 0.88 | 0.000 (−0.001; 0.000), p = 0.12 |
| Formic acid | 0.87 | 0.001 (−0.001; 0.004), p = 0.36 |
| Glucose | 0.91 | −0.043 (−0.264; 0.179), p = 0.71 |
| Glycine | 0.93 | −0.001 (−0.009; 0.008), p = 0.90 |
| Histidine | 0.96 | −0.004 (−0.007; 0.000), p = 0.04 |
| Isoleucine | 0.62 | 0.001 (−0.003; 0.004), p = 0.69 |
| Lactic acid | 0.44 | 0.094 (0.006; 0.182), p = 0.04 |
| Leucine | 0.70 | 0.002 (−0.003; 0.006), p = 0.53 |
| Phenylalanine | 0.80 | 0.002 (−0.002; 0.006), p = 0.26 |
| Pyruvic acid | 0.76 | 0.005 (0.000; 0.010) p = 0.07 |
| Succinic acid | 0.67 | 0.000 (0.000;0.001), p = 0.27 |
| Trimethyl-amine-N-oxide | 0.68 | 0.008 (0.001; 0.014), p = 0.02 |
| Tyrosine | 0.42 | 0.000 (−0.002; 0.003) p = 0.89 |
| Valine | 0.16 | −0.005 (−0.012; 0.002) p = 0.18 |
Publisher’s Note: MDPI stays neutral with regard to jurisdictional claims in published maps and institutional affiliations. |
© 2022 by the authors. Licensee MDPI, Basel, Switzerland. This article is an open access article distributed under the terms and conditions of the Creative Commons Attribution (CC BY) license (https://creativecommons.org/licenses/by/4.0/).
Share and Cite
Espersen, R.; Correia, B.S.B.; Rejnmark, L.; Bertram, H.C. The Diurnal Blood Metabolome and Effects of Vitamin D Supplementation: A Randomised Crossover Trial in Postmenopausal Women. Int. J. Mol. Sci. 2022, 23, 9748. https://doi.org/10.3390/ijms23179748
Espersen R, Correia BSB, Rejnmark L, Bertram HC. The Diurnal Blood Metabolome and Effects of Vitamin D Supplementation: A Randomised Crossover Trial in Postmenopausal Women. International Journal of Molecular Sciences. 2022; 23(17):9748. https://doi.org/10.3390/ijms23179748
Chicago/Turabian StyleEspersen, Rasmus, Banny Silva Barbosa Correia, Lars Rejnmark, and Hanne Christine Bertram. 2022. "The Diurnal Blood Metabolome and Effects of Vitamin D Supplementation: A Randomised Crossover Trial in Postmenopausal Women" International Journal of Molecular Sciences 23, no. 17: 9748. https://doi.org/10.3390/ijms23179748
APA StyleEspersen, R., Correia, B. S. B., Rejnmark, L., & Bertram, H. C. (2022). The Diurnal Blood Metabolome and Effects of Vitamin D Supplementation: A Randomised Crossover Trial in Postmenopausal Women. International Journal of Molecular Sciences, 23(17), 9748. https://doi.org/10.3390/ijms23179748