
Neurospecific Molecules Measured in Periphery in Humans: How Do They Correlate with the Brain Levels? A Systematic Review

 ,
, 

Abstract
:1. Introduction
1.1. Neurospecific Proteins
1.2. Blood–Brain Barrier (BBB)
1.3. Post-Mortem versus In Vivo
1.4. Measurements
1.5. CSF—Not Considered
1.6. Study Objectives
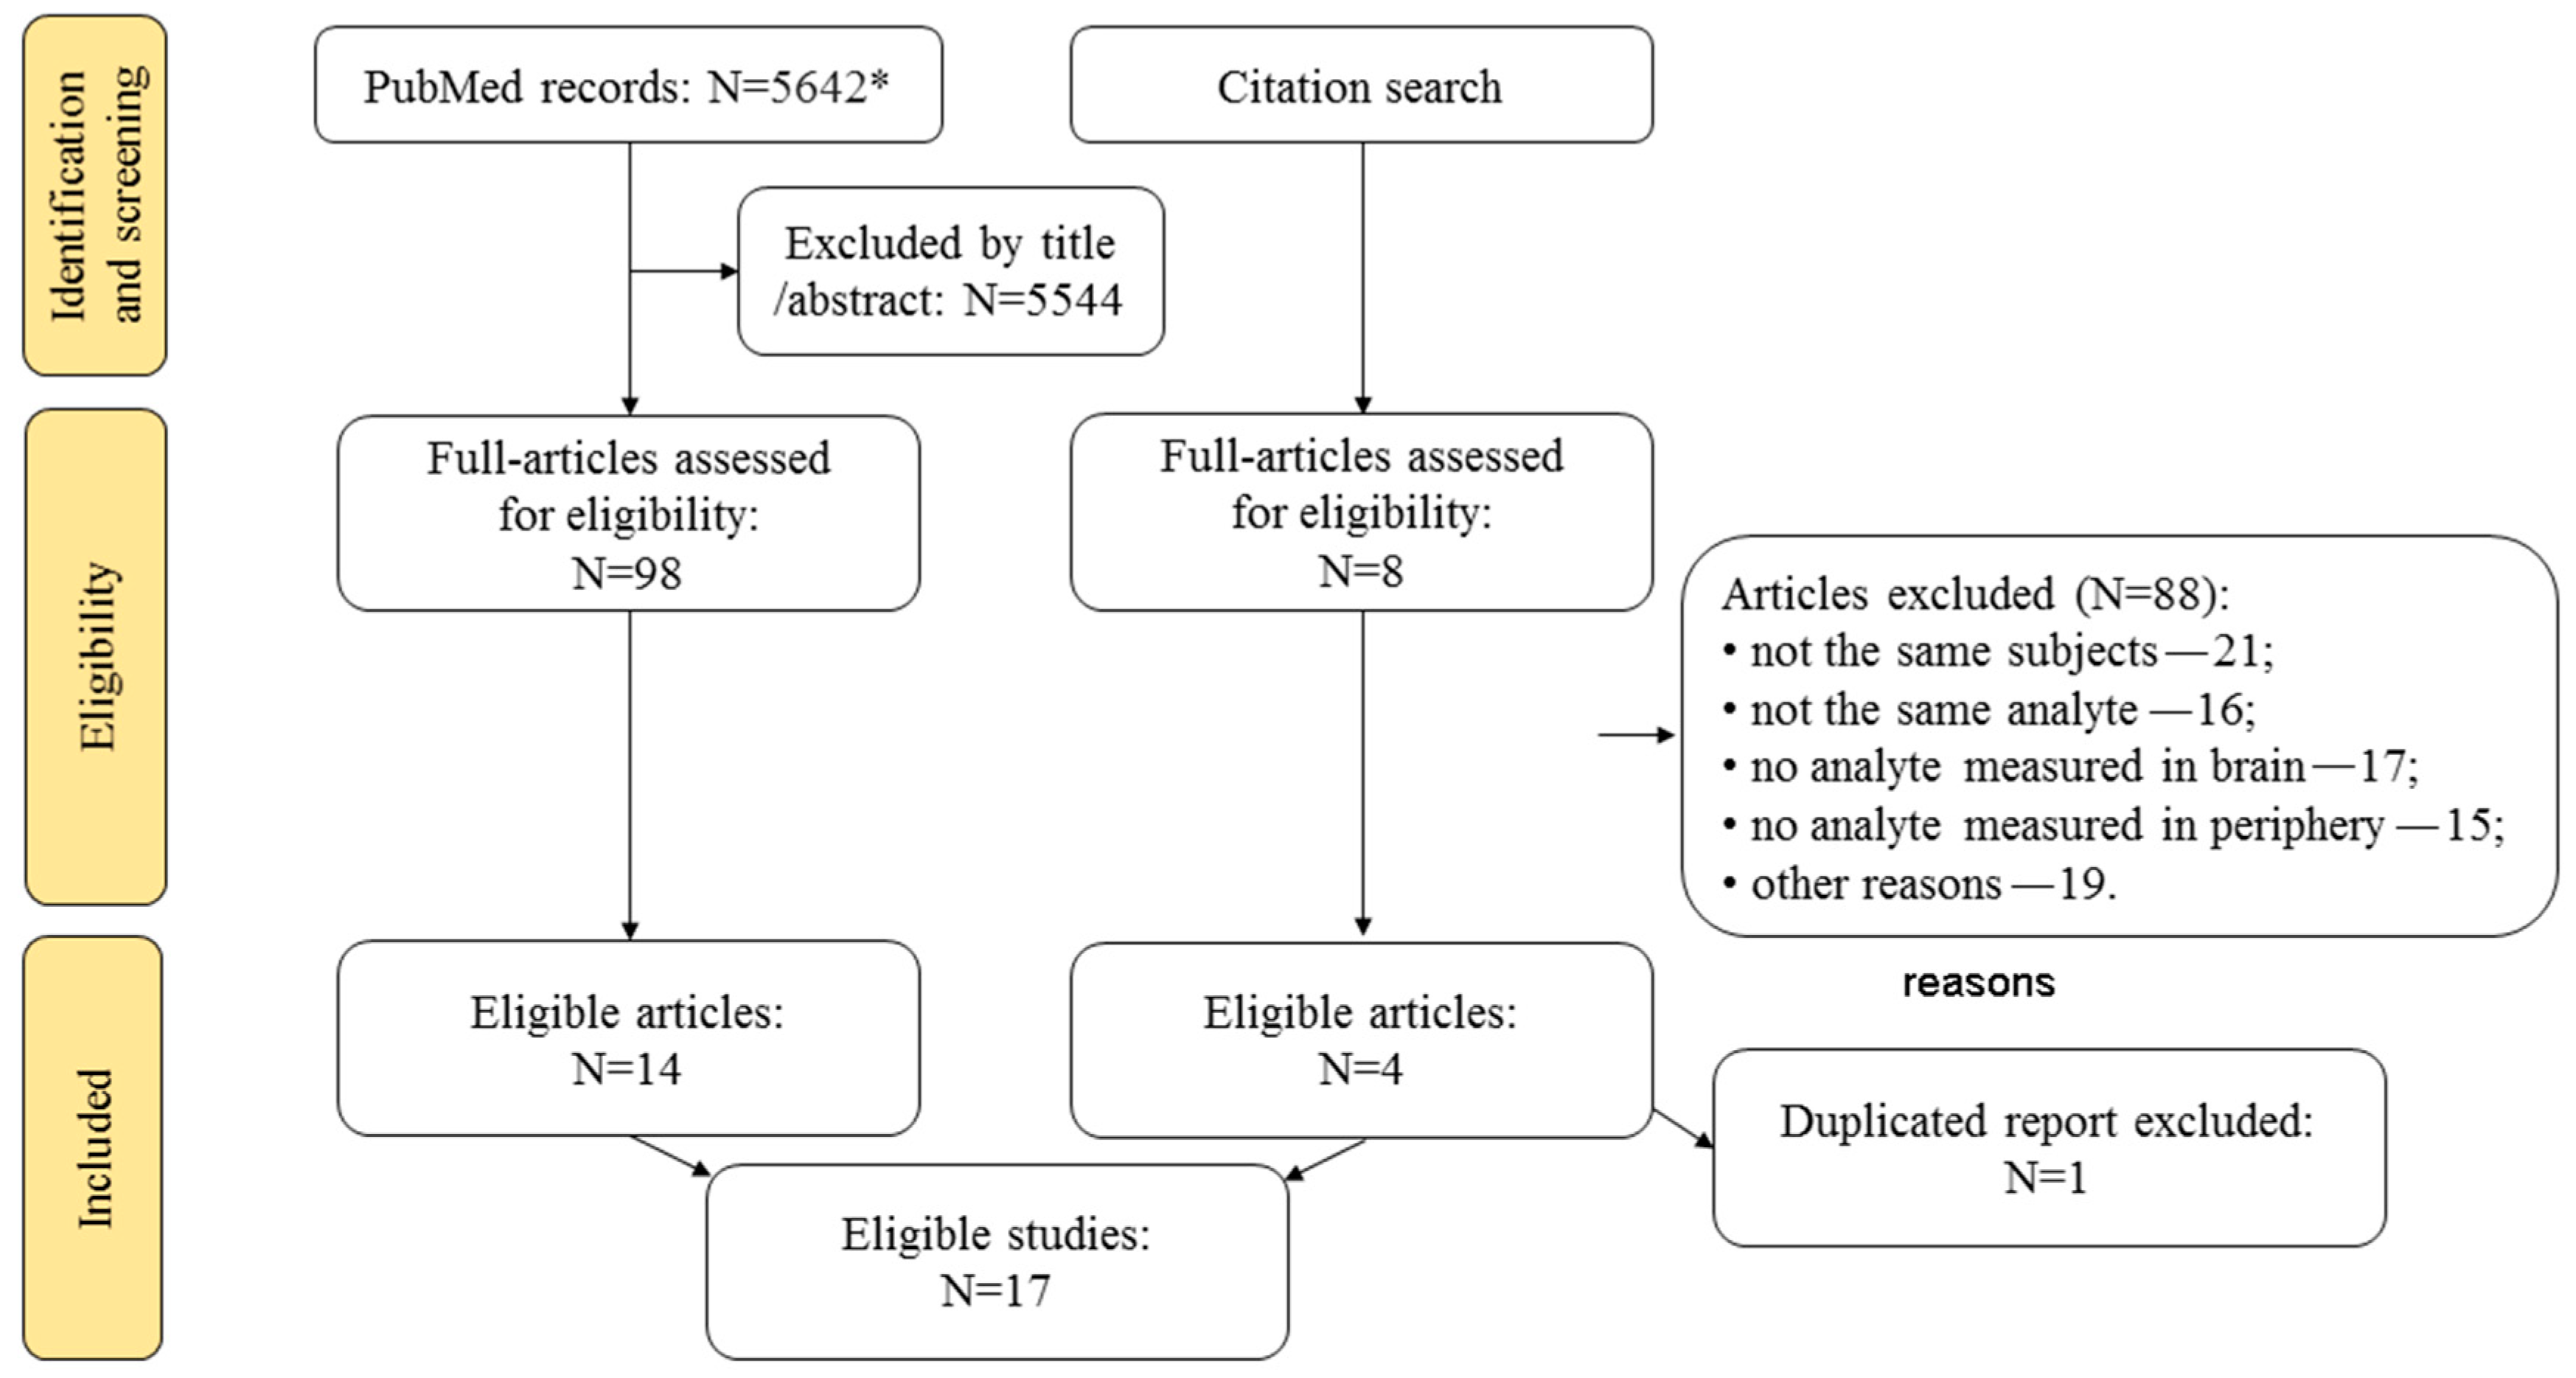
2. Methods
3. Results and Discussion
3.1. Small Molecules
3.2. Peptides

| Study | Subjects in Correlation Analysis | Conditions ^ | Measures, Specimens and Techniques | Results |
|---|---|---|---|---|
| Small Molecules | ||||
| Heyes et al., 1998 [40] | 16 AIDS (acquired immunodeficiency syndrome) patients | p-m + | Quinolinic acid: brain (basal ganglia, cortical white matter, cortical gray matter) vs. serum (and CSF), by chemical ionization-gas chromatography | No significant brain-serum (and brain-CSF) correlations |
| Basile et al., 1995 [41] | 58 patients with liver failure and encephalopathy, 18 normal subjects | p-m − | Quinolinic acid: brain vs. plasma (taken before death), by MS | No report on correlation |
| Gillman et al., either 1980 or 1981 [42,43] | 5 psychiatric patients during tractotomy (who were not tryptophan-infused) | i-v + | Total and free tryptophan: brain cortex, by high performance liquid chromatography vs. plasma (and CSF), using “Chromaspek amino acid analyser” | Prominent cortex-plasma correlations: for total tryptophan r = 0.58 (ns), for free tryptophan r = 0.97 (p < 0.01) |
| Honig et al., 1988 [44] | 14 patients with refractory depression during tractotomy | i-v + | 17 amino acids (taurine, asparagine, threonine, serine, glutamic acid, glutamine, glycine, alanine, valine, methionine, isoleucine, leucine, tyrosine, phenylalanine, histidine, lysine, arginine): brain cortex vs. plasma (and CSF), using “Chromaspek amino acid analyser” | No significant brain-plasma (or brain-CSF) correlations for all amino acids (except for gamma-aminobutyric acid GABA, which was undetectable in plasma and CSF) |
| Koch et al., 2000 [45] | 4 subjects with phenylketonuria and 5 healthy controls | i-v + | Phenylalanine: brain (by MRI/MRS) vs. blood (by amino acid analyzer) | Significant brain-blood correlation rho = 0.51 (p < 0.05) |
| Takado et al., 2019 [30] | 19 healthy subjects | i-v + | Glutamine and glutamate: brain posterior cingulate cortex (PCC) and cerebellum, by photon magnetic resonance spectroscopy (MRI/MRS; twice within 1 h) vs. plasma (taken once between the two MRS sessions), by LC/MS) | Significant brain PCC-plasma correlation for glutamine (mean of two measurements) rho = 0.72 (p < 0.01). No other correlations significant |
| Shulman et al., 2006 [39] | 17 healthy subjects | i-v − | Glutamate: brain medial prefrontal cortex, by photon magnetic resonance spectroscopy (MRI/MRS) vs. plasma (taken within 1 week), by HPLC/MS | No brain-plasma correlation |
| Huo et al., 2020 [46] | Subjects with and without Alzheimer’s disease (at time of death; N = 31 and 61, respectively) | p-m − | 143 metabolites from five compound classes (amino acids, biogenic amines, acylcarnitines, glycerophospholipids, and sphingolipids): brain vs. serum, by ultra-high-pressure liquid chromatography (UPLC) tandem MS | No report on correlation |
| Wang et al., 2020 [47] | Alzheimer’s disease, mild cognitively impaired patients and unimpaired subjects (N = 92 total *, of whom AD N = 11) | p-m − | 129 metabolites (the majority are not neurospecific): brain vs. serum, by gas chromatography time-of-flight mass spectrometry (GC-TOFMS) | No report on correlation |
| Peptides | ||||
| Chiaretti et al., 2004 [54] | 9 children operated on for epilepsy | i-v + | BDNF, GDNF, NGF: brain (tissue surrounding epileptic lesions) vs. plasma, by ELISA | No report on correlation |
| Bharani et al., 2019 [48] | Subjects with Alzheimer’s disease and healthy controls (N = 22 total *) | p-m + | BDNF and pro-BDNF: brain (cortex Brodmann area 46, entorhinal cortex, hippocampus), by Emax ImmunoAssay and Western blot, respectively vs. serum, by ELISA and Western blot, respectively. | Significant hippocampus-serum correlation for pro-BDNF (rho = −0.43, p = 0.040). No other correlations significant |
| Gadad et al., 2021 [6] | Subjects with mood disorder and healthy controls (N = 28 total *) | p-m + | BDNF, GDNF (and also IL-1b, IL-6): brain (Brodmann area 10) vs. plasma, by multiplex assay | Brain-plasma correlation: for IL-6 rho = 0.44 (p = 0.031), for GDNF rho = 0.37 (p = 0.05, a trend), other—ns. |
| Ashton et al., 2019 [49] | Subjects with Alzheimer’s disease and healthy controls (N = 23 total *) | p-m − | NfL: brain (medial temporal gyrus), % density by immunostaining vs. plasma concentration measured serially (three times during 1–8 years prior to death), by Simoa method | Significant brain-blood correlation for NfL in blood sampled at the closest time to death (rho = −0.47, p < 0.05) |
| Bartolotti et al., 2016 [50] | 32 subjects with Alzheimer’s disease and 33 cognitively unimpaired controls | p-m − | CREB, pCREB, and transcription cofactors—CREB-binding protein (CBP), p300: brain vs. PBMCs taken once within 5 years to death, by Western blot | Significant brain-PBMCs correlation for pCREB in a subgroup of AD patients whose blood was taken <3 years before death (r not reported, p = 0.002, N = 11). Other correlations—ns. |
| Buttarelli et al., 2009 [51] | 11 subjects with Parkinson’s disease naive of dopaminergic drugs | i-v + | Dopamine transporter: brain (caudate and putamen nuclei of the striatum), by SPECT (123I-fluopane binding) vs. peripheral blood lymphocytes, by immunocytochemistry | No significant correlations |
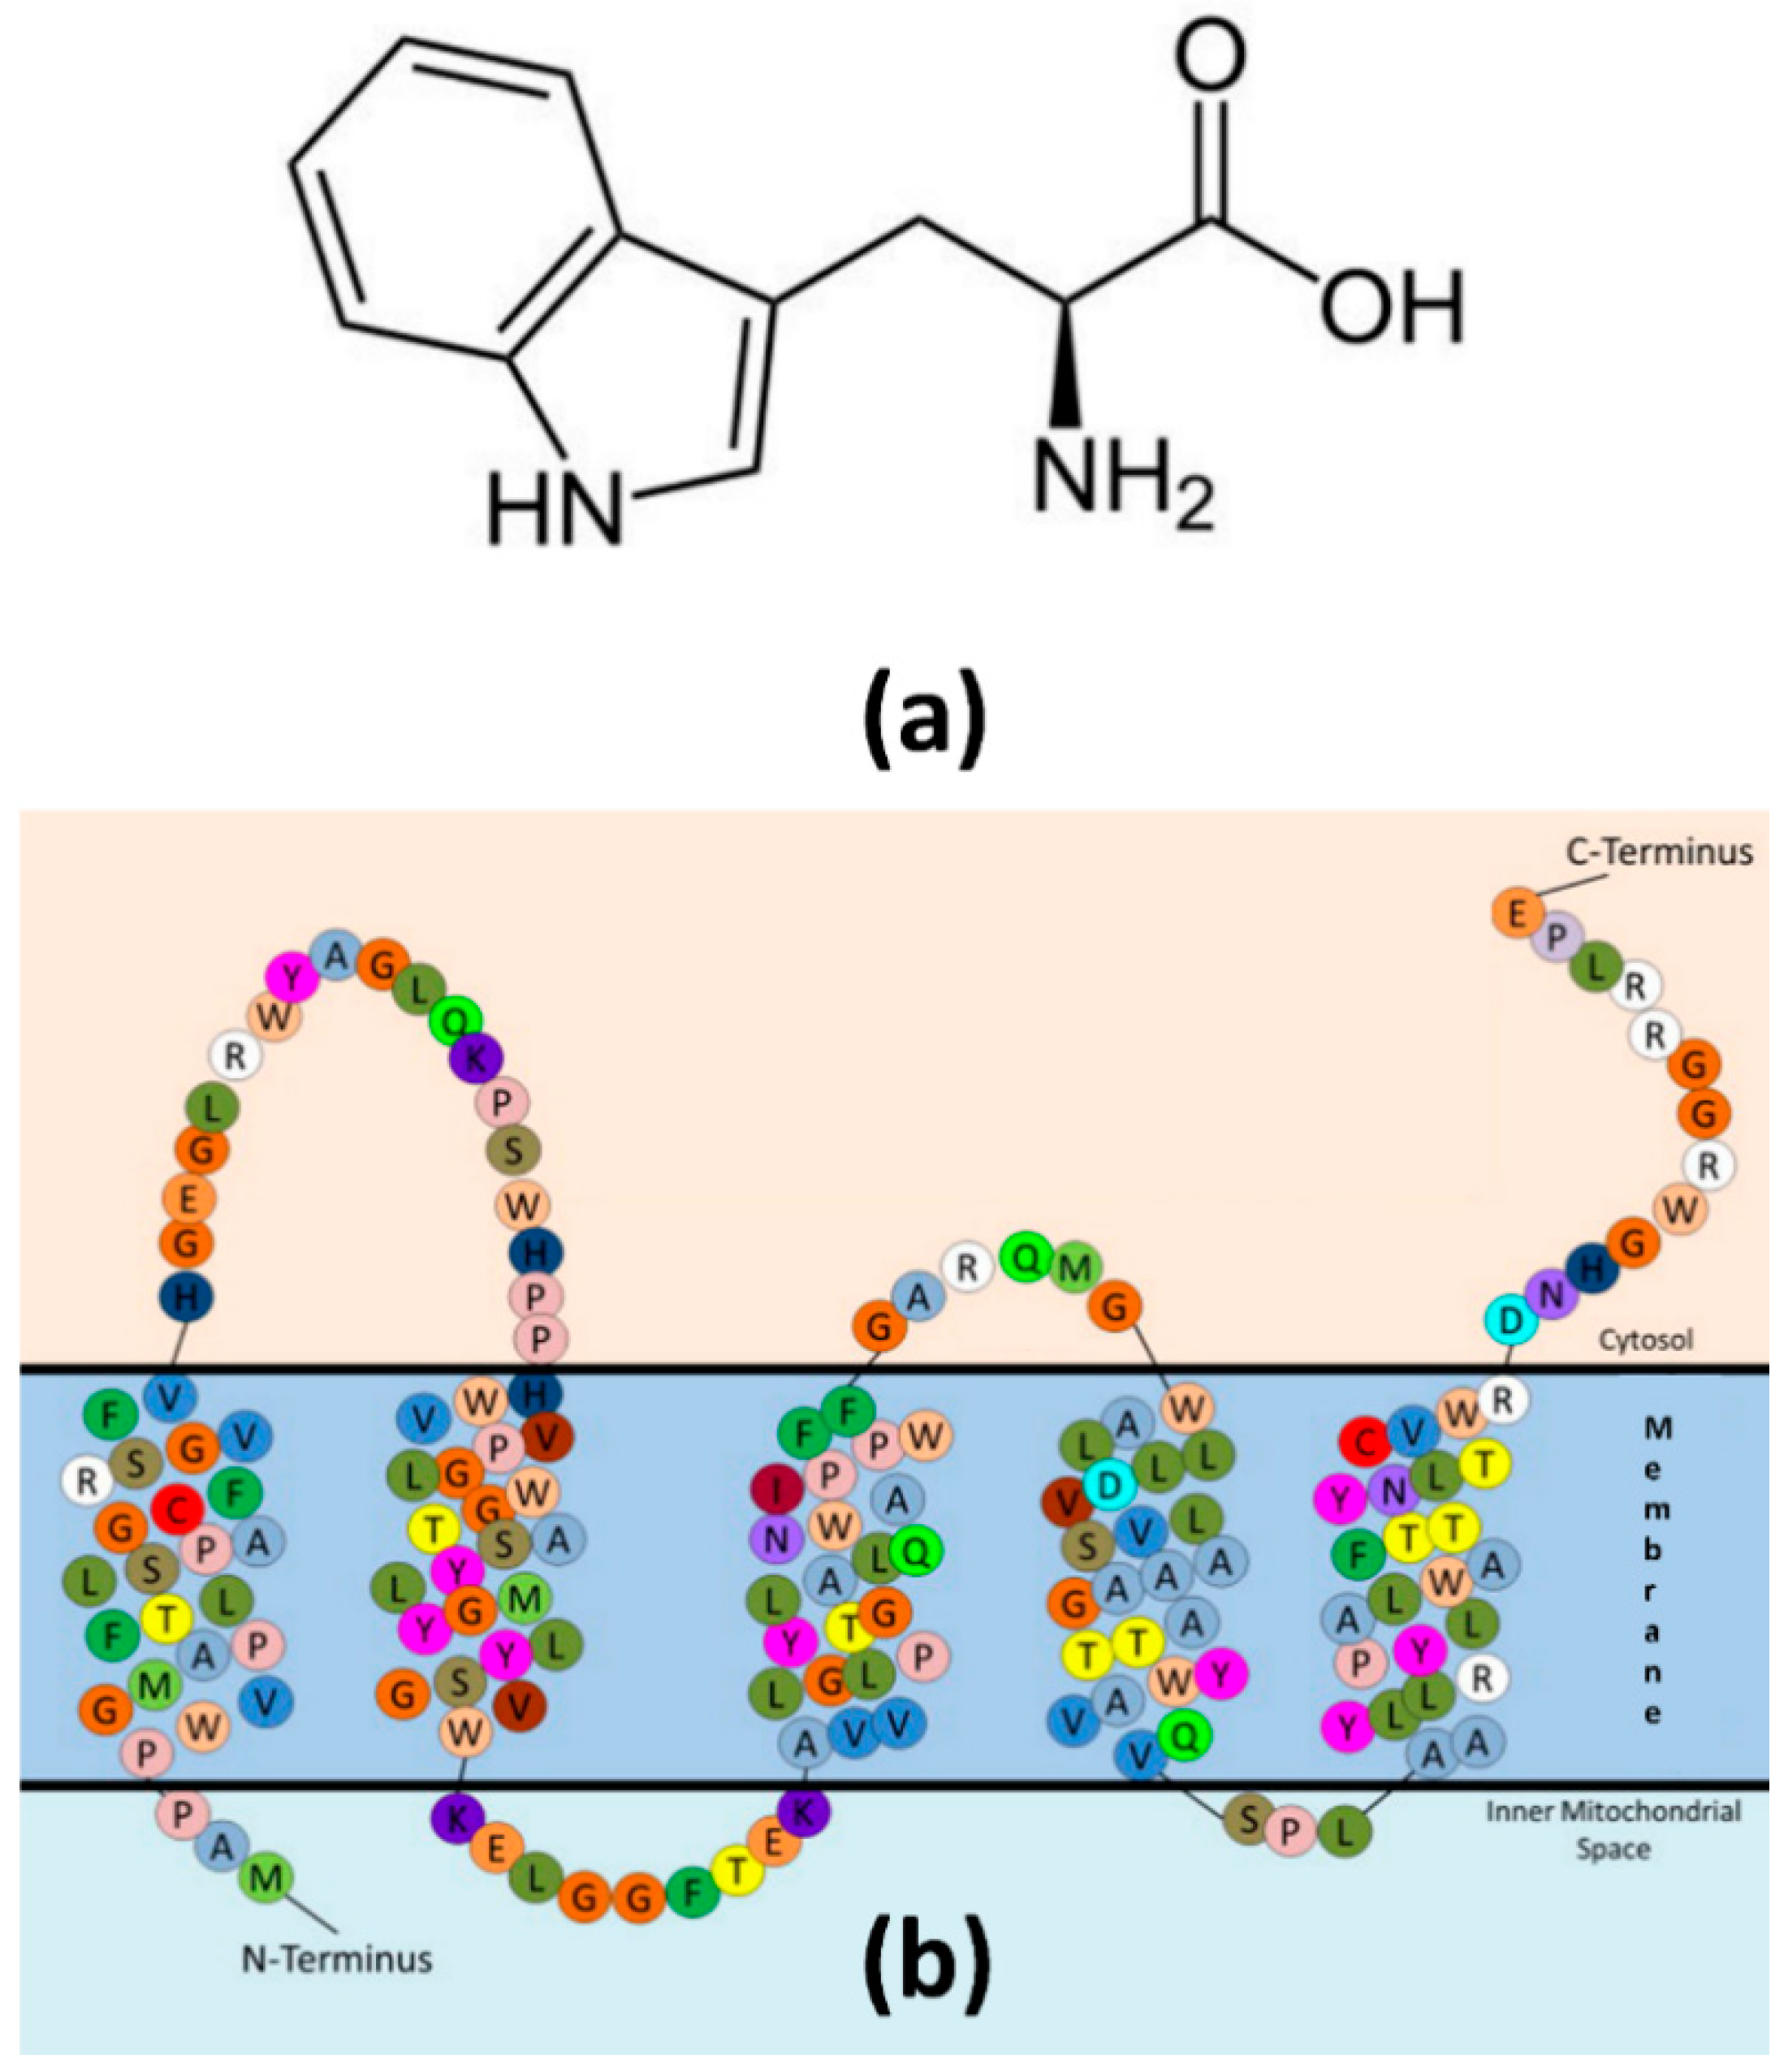
| Kanegawa et al., 2016 [52] | 31 healthy subjects | i-v + | TPRO: brain (highly expressed in microglia and macrophages) vs. circulating blood cells, by PET [11C]PBR28 binding, twice within a year | Significant brain-blood correlation at both first (r = 0.85, N = 31) and second (r = 0.90, N = 25) measurements (p < 1 × 10⁸) and for the changes (r = 0.60, p = 0.002). |
| Obukhova et al., 2021 [53] | 28 patients with glioma | i-v + | Acetylcholinesterase: glioma tissue (per 1 g of protein) vs. whole blood (per 0.1 g of hemoglobin), by photo colorimetric analysis | “Highly” significant brain-blood correlation rho = 0.63 |
3.3. Discussion
4. Conclusions
Author Contributions
Funding
Institutional Review Board Statement
Informed Consent Statement
Data Availability Statement
Acknowledgments
Conflicts of Interest
Abbreviations
References
- Leuzy, A.; Mattsson-Carlgren, N.; Palmqvist, S.; Janelidze, S.; Dage, J.L.; Hansson, O. Blood-based biomarkers for Alzheimer’s disease. EMBO Mol. Med. 2022, 14, e14408. [Google Scholar] [CrossRef] [PubMed]
- Harms, V.; Elias, L. Brain, Tissue. In Encyclopedia of Behavioral Medicine; Gellman, M.D., Turner, J.R., Eds.; Springer: New York, NY, USA, 2013; pp. 262–263. [Google Scholar] [CrossRef]
- Ginhoux, F.; Lim, S.; Hoeffel, G.; Low, D.; Huber, T. Origin and differentiation of microglia. Front. Cell Neurosci. 2013, 7, 45. [Google Scholar] [CrossRef] [PubMed]
- Obermeier, B.; Verma, A.; Ransohoff, R.M. The blood-brain barrier. Handb. Clin. Neurol. 2016, 133, 39–59. [Google Scholar] [CrossRef] [PubMed]
- Swissa, E.; Serlin, Y.; Vazana, U.; Prager, O.; Friedman, A. Blood–brain barrier dysfunction in status epileptics: Mechanisms and role in epileptogenesis. Epilepsy Behav. 2019, 101, 106285. [Google Scholar] [CrossRef] [PubMed]
- Gadad, B.S.; Vargas-Medrano, J.; Ramos, E.I.; Najera, K.; Fagan, M.; Forero, A.; Thompson, P.M. Altered levels of interleukins and neurotrophic growth factors in mood disorders and suicidality: An analysis from periphery to central nervous system. Transl. Psychiatry 2021, 11, 341. [Google Scholar] [CrossRef]
- Kealy, J.; Greene, C.; Campbell, M. Blood-brain barrier regulation in psychiatric disorders. Neurosci. Lett. 2020, 726, 133664. [Google Scholar] [CrossRef] [PubMed]
- Marchi, N.; Rasmussen, P.; Kapural, M.; Fazio, V.; Kight, K.; Mayberg, M.R.; Kanner, A.; Ayumar, B.; Albensi, B.; Cavaglia, M.; et al. Peripheral markers of brain damage and blood-brain barrier dysfunction. Restor. Neurol. Neurosci. 2003, 21, 109–121. [Google Scholar]
- Pilozzi, A.; Carro, C.; Whalen, M.; Huang, X. Blood–Brain Barrier Degradation and the Implication of SPARC Protein as a Potential Therapeutic Target for Alzheimer’s Disease. In Alzheimer’s Disease: Drug Discovery; Huang, X., Ed.; Exon Publications: Brisbane, Australia, 2020; pp. 135–149. [Google Scholar] [CrossRef]
- Chen, M.; Soosaipillai, A.; Fraser, D.D.; Diamandis, E.P. Discovery of novel plasma biomarker ratios to discriminate traumatic brain injury. F1000Research 2019, 8, 1695. [Google Scholar] [CrossRef]
- Park, S.-H.; Hwang, S.-K. Prognostic Value of Serum Levels of S100 Calcium-Binding Protein B, Neuron-Specific Enolase, and Interleukin-6 in Pediatric Patients with Traumatic Brain Injury. World Neurosurg. 2018, 118, e534–e542. [Google Scholar] [CrossRef]
- Whitehouse, D.P.; Monteiro, M.; Czeiter, E.; Vyvere, T.V.; Valerio, F.; Ye, Z.; Amrein, K.; Kamnitsas, K.; Xu, H.; Yang, Z.; et al. Relationship of admission blood proteomic biomarkers levels to lesion type and lesion burden in traumatic brain injury: A CENTER-TBI study. eBioMedicine 2022, 75, 103777. [Google Scholar] [CrossRef]
- Shvaikovskaya, A.; Zhanaeva, S.; Evsyukova, A.; Tikhonova, M.; Danilenko, K.; Aftanas, L. Brain neurotrophic factor (bdnf) and its diagnostic significance when measured in blood: Analytical review. Yakut Med. J. 2020, 71, 102–107. [Google Scholar] [CrossRef]
- Pellicano, C.; Pontieri, F.E.; Fanciulli, A.; Buttarelli, F.R. The Dopaminergic System in Peripheral Blood Lymphocytes: From Physiology to Pharmacology and Potential Applications to Neuropsychiatric Disorders. Curr. Neuropharmacol. 2011, 9, 278–288. [Google Scholar] [CrossRef]
- Gladkevich, A.; Kauffman, H.F.; Korf, J. Lymphocytes as a neural probe: Potential for studying psychiatric disorders. Prog. Neuro-Psychopharmacol. Biol. Psychiatry 2004, 28, 559–576. [Google Scholar] [CrossRef]
- Lago, S.G.; Tomasik, J.; van Rees, G.F.; Steeb, H.; Cox, D.A.; Rustogi, N.; Ramsey, J.M.; Bishop, J.A.; Petryshen, T.; Haggarty, S.J.; et al. Drug discovery for psychiatric disorders using high-content single-cell screening of signaling network responses ex vivo. Sci. Adv. 2019, 5, eaau9093. [Google Scholar] [CrossRef]
- Sian-Hülsmann, J.; Monoranu, C.-M.; Grünblatt, E.; Riederer, P. Neurochemical markers as potential indicators of postmortem tissue quality. Handb. Clin. Neurol. 2018, 150, 119–127. [Google Scholar] [CrossRef]
- Barker, R.; Wellington, D.; Esiri, M.M.; Love, S. Assessing White Matter Ischemic Damage in Dementia Patients by Measurement of Myelin Proteins. J. Cereb. Blood Flow Metab. 2013, 33, 1050–1057. [Google Scholar] [CrossRef]
- Khalil, M.; Teunissen, C.E.; Otto, M.; Piehl, F.; Sormani, M.P.; Gattringer, T.; Barro, C.; Kappos, L.; Comabella, M.; Fazekas, F.; et al. Neurofilaments as biomarkers in neurological disorders. Nat. Rev. Neurol. 2018, 14, 577–589. [Google Scholar] [CrossRef]
- Kuhle, J.; Barro, C.; Andreasson, U.; Derfuss, T.; Lindberg, R.; Sandelius, Å.; Liman, V.; Norgren, N.; Blennow, K.; Zetterberg, H. Comparison of three analytical platforms for quantification of the neurofilament light chain in blood samples: ELISA, electrochemiluminescence immunoassay and Simoa. Clin. Chem. Lab. Med. 2016, 54, 1655–1661. [Google Scholar] [CrossRef]
- Rissin, D.M.; Fournier, D.R.; Piech, T.; Kan, C.W.; Campbell, T.G.; Song, L.; Chang, L.; Rivnak, A.J.; Patel, P.P.; Provuncher, G.K.; et al. Simultaneous Detection of Single Molecules and Singulated Ensembles of Molecules Enables Immunoassays with Broad Dynamic Range. Anal. Chem. 2011, 83, 2279–2285. [Google Scholar] [CrossRef]
- Rissin, D.M.; Kan, C.W.; Campbell, T.G.; Howes, S.C.; Fournier, D.R.; Song, L.; Piech, T.; Patel, P.P.; Chang, L.; Rivnak, A.J.; et al. Single-molecule enzyme-linked immunosorbent assay detects serum proteins at subfemtomolar concentrations. Nat. Biotechnol. 2010, 28, 595–599. [Google Scholar] [CrossRef]
- Gade, A.; Sharma, A.; Srivastava, N.; Flora, S. Surface plasmon resonance: A promising approach for label-free early cancer diagnosis. Clin. Chim. Acta 2022, 527, 79–88. [Google Scholar] [CrossRef]
- Hu, S.; Yang, C.; Luo, H. Current trends in blood biomarker detection and imaging for Alzheimer’s disease. Biosens. Bioelectron. 2022, 210, 114278. [Google Scholar] [CrossRef]
- Brooks, S.A. Basic Immunocytochemistry for Light Microscopy. Methods Mol. Biol. 2012, 878, 1–30. [Google Scholar] [CrossRef]
- Ramos-Vara, J.A. Principles and Methods of Immunohistochemistry. Methods Mol. Biol. 2017, 1641, 115–128. [Google Scholar] [CrossRef]
- Alseekh, S.; Aharoni, A.; Brotman, Y.; Contrepois, K.; D’Auria, J.; Ewald, J.; Ewald, J.C.; Fraser, P.D.; Giavalisco, P.; Hall, R.D.; et al. Mass spectrometry-based metabolomics: A guide for annotation, quantification and best reporting practices. Nat. Methods 2021, 18, 747–756. [Google Scholar] [CrossRef]
- García-Gutiérrez, M.S.; Navarrete, F.; Sala, F.; Gasparyan, A.; Austrich-Olivares, A.; Manzanares, J. Biomarkers in Psychiatry: Concept, Definition, Types and Relevance to the Clinical Reality. Front. Psychiatry 2020, 11, 432. [Google Scholar] [CrossRef]
- Schumacher-Schuh, A.; Bieger, A.; Borelli, W.V.; Portley, M.K.; Awad, P.S.; Bandres-Ciga, S. Advances in Proteomic and Metabolomic Profiling of Neurodegenerative Diseases. Front. Neurol. 2021, 12, 792227. [Google Scholar] [CrossRef] [PubMed]
- Takado, Y.; Sato, N.; Kanbe, Y.; Tomiyasu, M.; Xin, L.; Near, J.; Yoshikawa, K.; Sahara, N.; Higashi, T.; Suhara, T.; et al. Association between Brain and Plasma Glutamine Levels in Healthy Young Subjects Investigated by MRS and LC/MS. Nutrients 2019, 11, 1649. [Google Scholar] [CrossRef] [PubMed]
- Crișan, G.; Moldovean-Cioroianu, N.S.; Timaru, D.-G.; Andrieș, G.; Căinap, C.; Chiș, V. Radiopharmaceuticals for PET and SPECT Imaging: A Literature Review over the Last Decade. Int. J. Mol. Sci. 2022, 23, 5023. [Google Scholar] [CrossRef] [PubMed]
- Gunn, R.N.; Slifstein, M.; Searle, G.E.; Price, J.C. Quantitative imaging of protein targets in the human brain with PET. Phys. Med. Biol. 2015, 60, R363–R411. [Google Scholar] [CrossRef] [PubMed]
- Rizzo, G.; Veronese, M.; Heckemann, R.A.; Selvaraj, S.; Howes, O.D.; Hammers, A.; Turkheimer, F.E.; Bertoldo, A. The Predictive Power of Brain mRNA Mappings for in vivo Protein Density: A Positron Emission Tomography Correlation Study. J. Cereb. Blood Flow Metab. 2014, 34, 827–835. [Google Scholar] [CrossRef]
- Hannon, E.; Lunnon, K.; Schalkwyk, L.; Mill, J. Interindividual methylomic variation across blood, cortex, and cerebellum: Implications for epigenetic studies of neurological and neuropsychiatric phenotypes. Epigenetics 2015, 10, 1024–1032. [Google Scholar] [CrossRef]
- Rogachev, A.; Alemasov, N.; Ivanisenko, V.; Ivanisenko, N.; Gaisler, E.; Oleshko, O.; Cheresiz, S.; Mishinov, S.; Stupak, V.; Pokrovsky, A. Correlation of Metabolic Profiles of Plasma and Cerebrospinal Fluid of High-Grade Glioma Patients. Metabolites 2021, 11, 133. [Google Scholar] [CrossRef]
- Benedet, A.L.; Milà-Alomà, M.; Vrillon, A.; Ashton, N.J.; Pascoal, T.A.; Lussier, F.; Karikari, T.K.; Hourregue, C.; Cognat, E.; Dumurgier, J.; et al. Differences Between Plasma and Cerebrospinal Fluid Glial Fibrillary Acidic Protein Levels Across the Alzheimer Disease Continuum. JAMA Neurol. 2021, 78, 1471–1483. [Google Scholar] [CrossRef]
- Skorobogatov, K.; De Picker, L.; Verkerk, R.; Coppens, V.; Leboyer, M.; Müller, N.; Morrens, M. Brain versus Blood: A Systematic Review on the Concordance between Peripheral and Central Kynurenine Pathway Measures in Psychiatric Disorders. Front. Immunol. 2021, 12, 716980. [Google Scholar] [CrossRef]
- Page, M.J.; McKenzie, J.E.; Bossuyt, P.M.; Boutron, I.; Hoffmann, T.C.; Mulrow, C.D.; Shamseer, L.; Tetzlaff, J.M.; Akl, E.A.; Brennan, S.E.; et al. The PRISMA 2020 statement: An updated guideline for reporting systematic reviews. BMJ 2021, 372, n71. [Google Scholar] [CrossRef]
- Shulman, Y.; Grant, S.; Seres, P.; Hanstock, C.; Baker, G.; Tibbo, P. The relation between peripheral and central glutamate and glutamine in healthy male volunteers. J. Psychiatry Neurosci. 2006, 31, 406–410. [Google Scholar]
- Heyes, M.P.; Saito, K.; Lackner, A.; Wiley, C.A.; Achim, C.L.; Markey, S.P. Sources of the neurotoxin quinolinic acid in the brain of HIV-1-infected patients and retrovirus-infected macaques. FASEB J. 1998, 12, 881–896. [Google Scholar] [CrossRef]
- Basile, A.S.; Saito, K.; Al-Mardini, H.; Record, C.O.; Hughes, R.D.; Harrison, P.; Williams, R.; Li, Y.; Heyes, M.P. The relationship between plasma and brain quinolinic acid levels and the severity of hepatic encephalopathy. Gastroenterology 1995, 108, 818–823. [Google Scholar] [CrossRef]
- Gillman, P.K.; Bartlett, J.R.; Bridges, P.K.; Hunt, A.; Patel, A.J.; Kantamaneni, B.D.; Curzon, G. Indolic Substances in Plasma, Cerebrospinal Fluid, and Frontal Cortex of Human Subjects Infused with Saline or Tryptophan. J. Neurochem. 1981, 37, 410–417. [Google Scholar] [CrossRef]
- Gillman, P.; Bartlett, J.; Bridges, P.; Kantamaneni, B.; Curzon, G. Relationships between tryptophan concentrations in human plasma, cerebrospinal fluid and cerebral cortex following tryptophan infusion. Neuropharmacology 1980, 19, 1241–1242. [Google Scholar] [CrossRef]
- Honig, A.; Bartlett, J.; Bouras, N.; Bridges, P. Amino acid levels in depression: A preliminary investigation. J. Psychiatr. Res. 1988, 22, 159–164. [Google Scholar] [CrossRef]
- Koch, R.; Moats, R.; Guttler, F.; Guldberg, P.; Nelson, M., Jr. Blood–Brain Phenylalanine Relationships in Persons with Phenylketonuria. Pediatrics 2000, 106, 1093–1096. [Google Scholar] [CrossRef]
- Huo, Z.; Yu, L.; Yang, J.; Zhu, Y.; Bennett, D.A.; Zhao, J. Brain and blood metabolome for Alzheimer’s dementia: Findings from a targeted metabolomics analysis. Neurobiol. Aging 2020, 86, 123–133. [Google Scholar] [CrossRef]
- Wang, J.; Wei, R.; Xie, G.; Arnold, M.; Kueider-Paisley, A.; Louie, G.; Dehkordi, S.M.; Blach, C.; Baillie, R.; Han, X.; et al. Peripheral serum metabolomic profiles inform central cognitive impairment. Sci. Rep. 2020, 10, 14059. [Google Scholar] [CrossRef]
- Bharani, K.L.; Ledreux, A.; Gilmore, A.; Carroll, S.L.; Granholm, A.-C. Serum pro-BDNF levels correlate with phospho-tau staining in Alzheimer’s disease. Neurobiol. Aging 2020, 87, 49–59. [Google Scholar] [CrossRef] [PubMed]
- Ashton, N.J.; Leuzy, A.; Lim, Y.M.; Troakes, C.; Hortobágyi, T.; Höglund, K.; Aarsland, D.; Lovestone, S.; Schöll, M.; Blennow, K.; et al. Increased plasma neurofilament light chain concentration correlates with severity of post-mortem neurofibrillary tangle pathology and neurodegeneration. Acta Neuropathol. Commun. 2019, 7, 5. [Google Scholar] [CrossRef] [PubMed]
- Bartolotti, N.; A Bennett, D.; Lazarov, O. Reduced pCREB in Alzheimer’s disease prefrontal cortex is reflected in peripheral blood mononuclear cells. Mol. Psychiatry 2016, 21, 1158–1166. [Google Scholar] [CrossRef] [PubMed]
- Buttarelli, F.R.; Capriotti, G.; Pellicano, C.; Prosperi, D.; Circella, A.; Festa, A.; Giovannelli, M.; Tofani, A.; Pontieri, F.E.; Scopinaro, F. Central and peripheral dopamine transporter reduction in Parkinson’s disease. Neurol. Res. 2009, 31, 687–691. [Google Scholar] [CrossRef] [PubMed]
- Kanegawa, N.; Collste, K.; Forsberg, A.; Schain, M.; Arakawa, R.; Jucaite, A.; Lekander, M.; Höglund, C.O.; Kosek, E.; Lampa, J.; et al. In vivo evidence of a functional association between immune cells in blood and brain in healthy human subjects. Brain Behav. Immun. 2016, 54, 149–157. [Google Scholar] [CrossRef] [PubMed]
- Obukhova, L.M.; Medyanik, I.A.; Kontorshchikova, K.N.; Simagina, S.A.; Musaelyan, L.T.; Kontorshchikov, M.M.; Veselova, A.S. Clinical significance of acetylcholinesterase activity in brain tumors. Russ. Clin. Lab. Diagn. 2021, 66, 718–721. [Google Scholar] [CrossRef]
- Chiaretti, A.; Aloe, L.; Antonelli, A.; Ruggiero, A.; Piastra, M.; Riccardi, R.; Tamburrini, G.; Di Rocco, C. Neurotrophic factor expression in childhood low-grade astrocytomas and ependymomas. Child’s Nerv. Syst. 2004, 20, 412–419. [Google Scholar] [CrossRef]
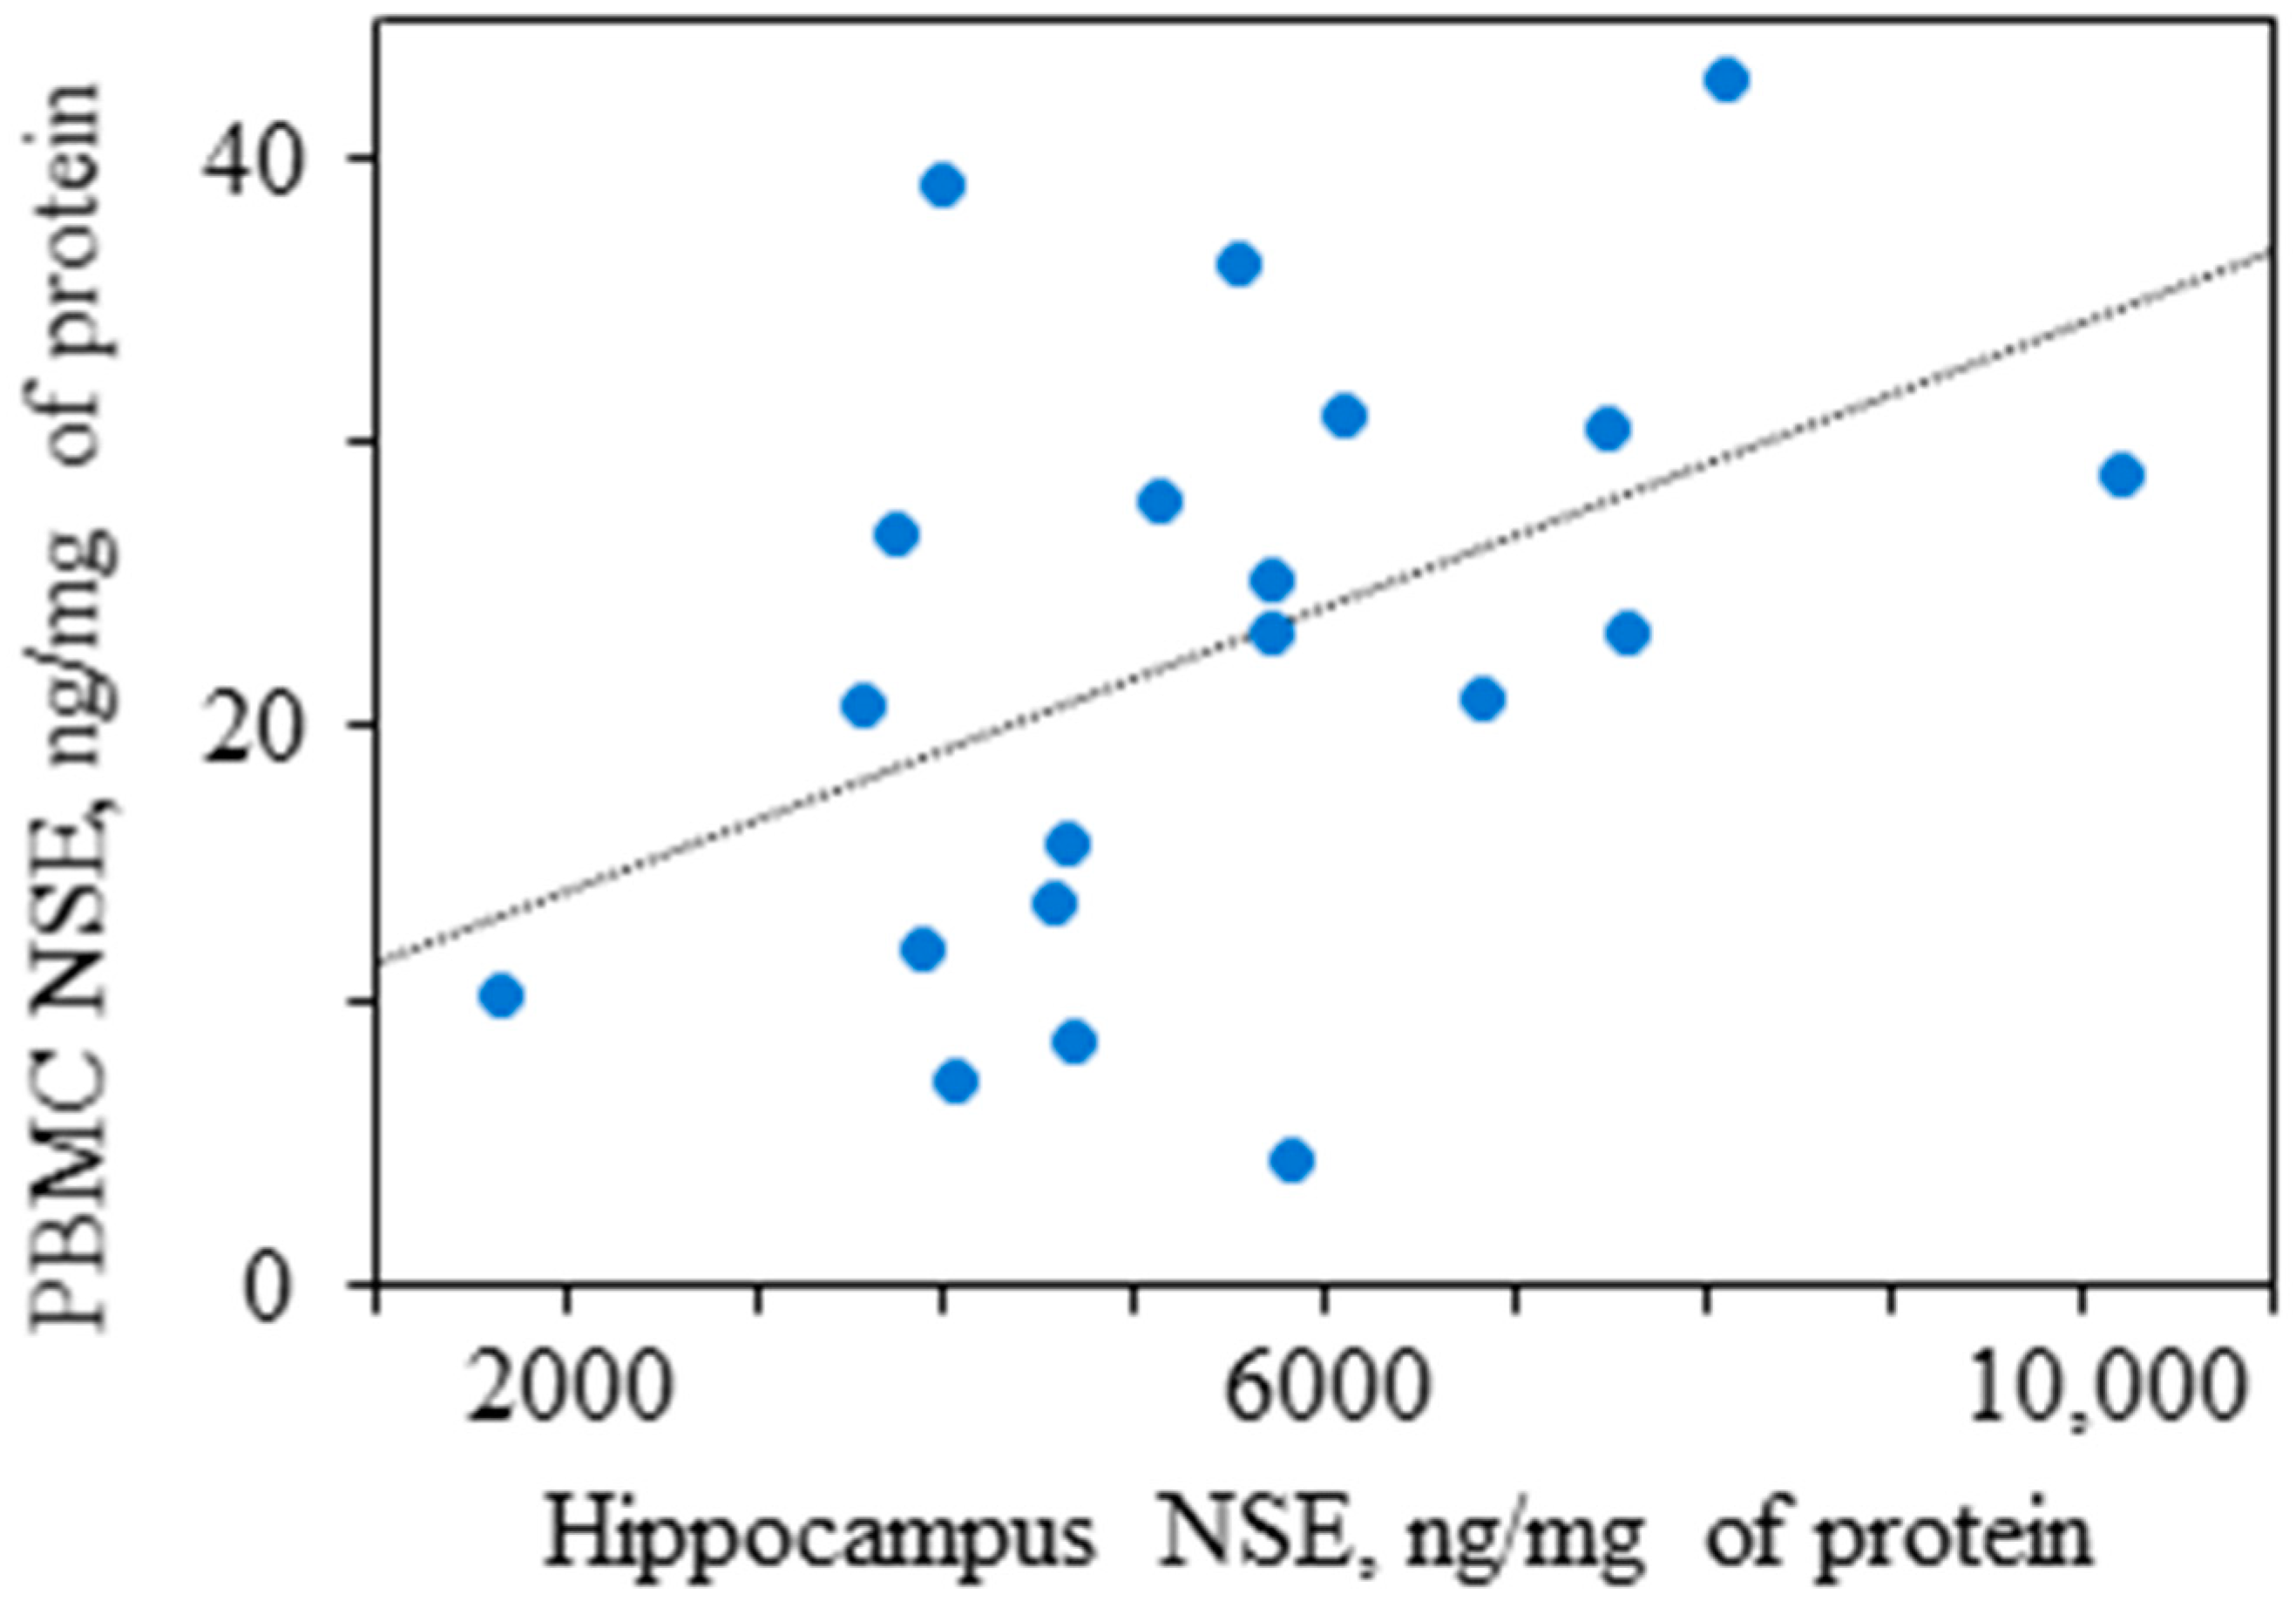
- Shvaikovskaya, A.A.; Zhanaeva, S.Y.; Olkov, N.M.; Moysak, G.I.; Danilenko, K.V.; Aftanas, L.I.; Tikhonova, M.A. Concordance between the in vivo concentrations of neurospecific proteins (BDNF, NSE) in the brain and blood in patients with epilepsy. In Proceedings of the Bioinformatics of Genome Regulation and Structure/Systems Biology (BGRS/SB-2022): The Thirteenth International Multiconference, Novosibirsk, Russia, 4–8 July 2022; p. 961. [Google Scholar]
- Rugg-Gunn, F.; Miserocchi, A.; McEvoy, A. Epilepsy surgery. Pract. Neurol. 2020, 20, 4–14. [Google Scholar] [CrossRef]
- Moresi, F.; Rossetti, D.V.; Vincenzoni, F.; Simboli, G.A.; La Rocca, G.; Olivi, A.; Urbani, A.; Sabatino, G.; Desiderio, C. Investigating Glioblastoma Multiforme Sub-Proteomes: A Computational Study of CUSA Fluid Proteomic Data. Int. J. Mol. Sci. 2022, 23, 2058. [Google Scholar] [CrossRef]
- Austin, C.J.; Kahlert, J.; Kassiou, M.; Rendina, L.M. The translocator protein (TSPO): A novel target for cancer chemotherapy. Int. J. Biochem. Cell Biol. 2013, 45, 1212–1216. [Google Scholar] [CrossRef]
- Korkhov, V.M.; Sachse, C.; Short, J.M.; Tate, C.G. Three-dimensional structure of TspO by electron cryomicroscopy of helical crystals. Structure 2010, 18, 677–687. [Google Scholar] [CrossRef]
- Cecil, C.A.M.; Walton, E.; Pingault, J.-B.; Provençal, N.; Pappa, I.; Vitaro, F.; Côté, S.; Szyf, M.; Tremblay, R.E.; Tiemeier, H.; et al. DRD4methylation as a potential biomarker for physical aggression: An epigenome-wide, cross-tissue investigation. Am. J. Med. Genet. Part B Neuropsychiatr. Genet. 2018, 177, 746–764. [Google Scholar] [CrossRef]
- Docherty, S.J.; Davis, O.S.; Haworth, C.M.; Plomin, R.; D’Souza, U.; Mill, J. A genetic association study of DNA methylation levels in the DRD4 gene region finds associations with nearby SNPs. Behav. Brain Funct. 2012, 8, 31. [Google Scholar] [CrossRef]
- Wiers, C.E.; Lohoff, F.W.; Lee, J.; Muench, C.; Freeman, C.; Zehra, A.; Marenco, S.; Lipska, B.K.; Auluck, P.K.; Feng, N.; et al. Methylation of the dopamine transporter gene in blood is associated with striatal dopamine transporter availability in ADHD: A preliminary study. Eur. J. Neurosci. 2018, 48, 1884–1895. [Google Scholar] [CrossRef]
- Shumay, E.; Logan, J.; Volkow, N.D.; Fowler, J.S. Evidence that the methylation state of the monoamine oxidase A (MAOA) gene predicts brain activity of MAO A enzyme in healthy men. Epigenetics 2012, 7, 1151–1160. [Google Scholar] [CrossRef]
- Meldolesi, J. Extracellular vesicles (exosomes and ectosomes) play key roles in the pathology of brain diseases. Mol. Biomed. 2021, 2, 18. [Google Scholar] [CrossRef]
- Kumari, M.; Anji, A. Small but Mighty—Exosomes, Novel Intercellular Messengers in Neurodegeneration. Biology 2022, 11, 413. [Google Scholar] [CrossRef]
- Zhang, P.; Rasheed, M.; Liang, J.; Wang, C.; Feng, L.; Chen, Z. Emerging Potential of Exosomal Non-coding RNA in Parkinson’s Disease: A Review. Front. Aging Neurosci. 2022, 14, 819836. [Google Scholar] [CrossRef]
- Younas, N.; Flores, L.C.F.; Hopfner, F.; Höglinger, G.U.; Zerr, I. A new paradigm for diagnosis of neurodegenerative diseases: Peripheral exosomes of brain origin. Transl. Neurodegener. 2022, 11, 28. [Google Scholar] [CrossRef] [PubMed]
- Ghaith, H.S.; Nawar, A.A.; Gabra, M.D.; Abdelrahman, M.E.; Nafady, M.H.; Bahbah, E.I.; Ebada, M.A.; Ashraf, G.M.; Negida, A.; Barreto, G.E. A Literature Review of Traumatic Brain Injury Biomarkers. Mol. Neurobiol. 2022, 59, 4141–4158. [Google Scholar] [CrossRef] [PubMed]
- Lim, C.Z.J.; Natalia, A.; Sundah, N.R.; Shao, H. Biomarker Organization in Circulating Extracellular Vesicles: New Applications in Detecting Neurodegenerative Diseases. Adv. Biosyst. 2020, 4, e1900309. [Google Scholar] [CrossRef] [PubMed]
Publisher’s Note: MDPI stays neutral with regard to jurisdictional claims in published maps and institutional affiliations. |
© 2022 by the authors. Licensee MDPI, Basel, Switzerland. This article is an open access article distributed under the terms and conditions of the Creative Commons Attribution (CC BY) license (https://creativecommons.org/licenses/by/4.0/).
Share and Cite
Tikhonova, M.A.; Zhanaeva, S.Y.; Shvaikovskaya, A.A.; Olkov, N.M.; Aftanas, L.I.; Danilenko, K.V. Neurospecific Molecules Measured in Periphery in Humans: How Do They Correlate with the Brain Levels? A Systematic Review. Int. J. Mol. Sci. 2022, 23, 9193. https://doi.org/10.3390/ijms23169193
Tikhonova MA, Zhanaeva SY, Shvaikovskaya AA, Olkov NM, Aftanas LI, Danilenko KV. Neurospecific Molecules Measured in Periphery in Humans: How Do They Correlate with the Brain Levels? A Systematic Review. International Journal of Molecular Sciences. 2022; 23(16):9193. https://doi.org/10.3390/ijms23169193
Chicago/Turabian StyleTikhonova, Maria A., Svetlana Y. Zhanaeva, Anna A. Shvaikovskaya, Nikita M. Olkov, Lyubomir I. Aftanas, and Konstantin V. Danilenko. 2022. "Neurospecific Molecules Measured in Periphery in Humans: How Do They Correlate with the Brain Levels? A Systematic Review" International Journal of Molecular Sciences 23, no. 16: 9193. https://doi.org/10.3390/ijms23169193
APA StyleTikhonova, M. A., Zhanaeva, S. Y., Shvaikovskaya, A. A., Olkov, N. M., Aftanas, L. I., & Danilenko, K. V. (2022). Neurospecific Molecules Measured in Periphery in Humans: How Do They Correlate with the Brain Levels? A Systematic Review. International Journal of Molecular Sciences, 23(16), 9193. https://doi.org/10.3390/ijms23169193