
Identification of Myocardial Insulin Resistance by Using Liver Tests: A Simple Approach for Clinical Practice

 , , , , ,
  ,
, 
Abstract
:1. Introduction
2. Results
2.1. General Characteristics of T2D Patients
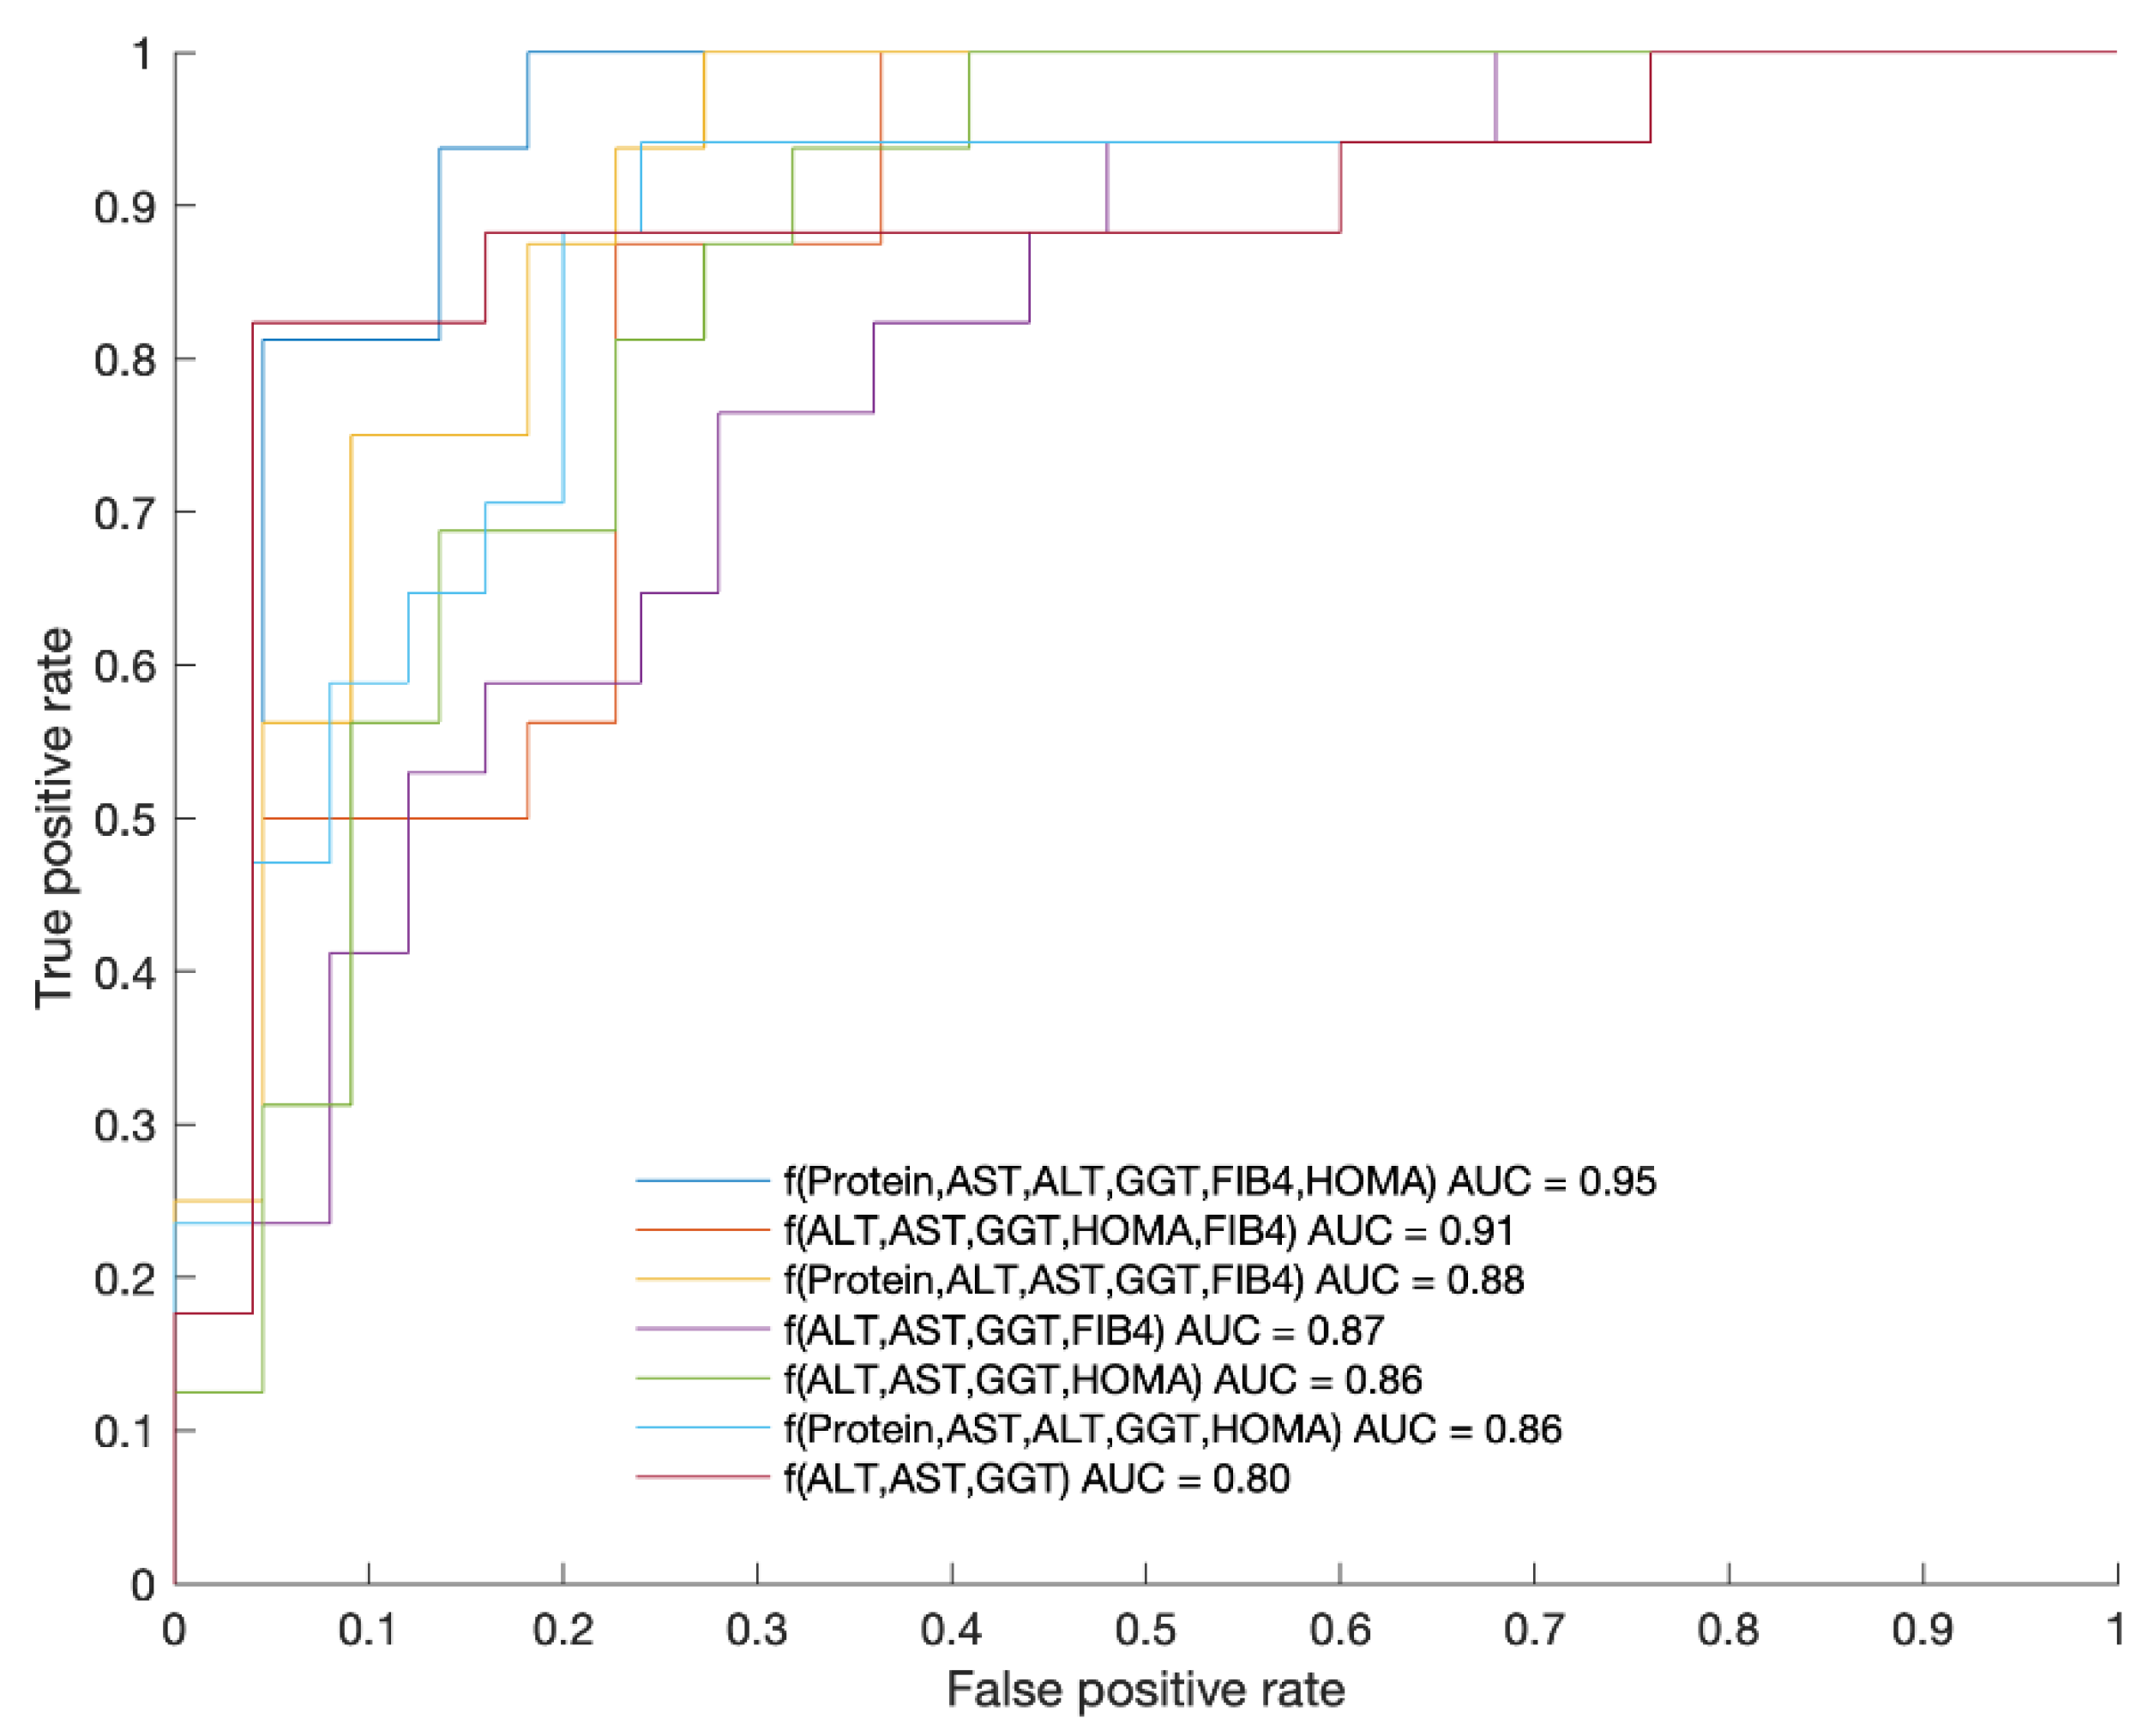
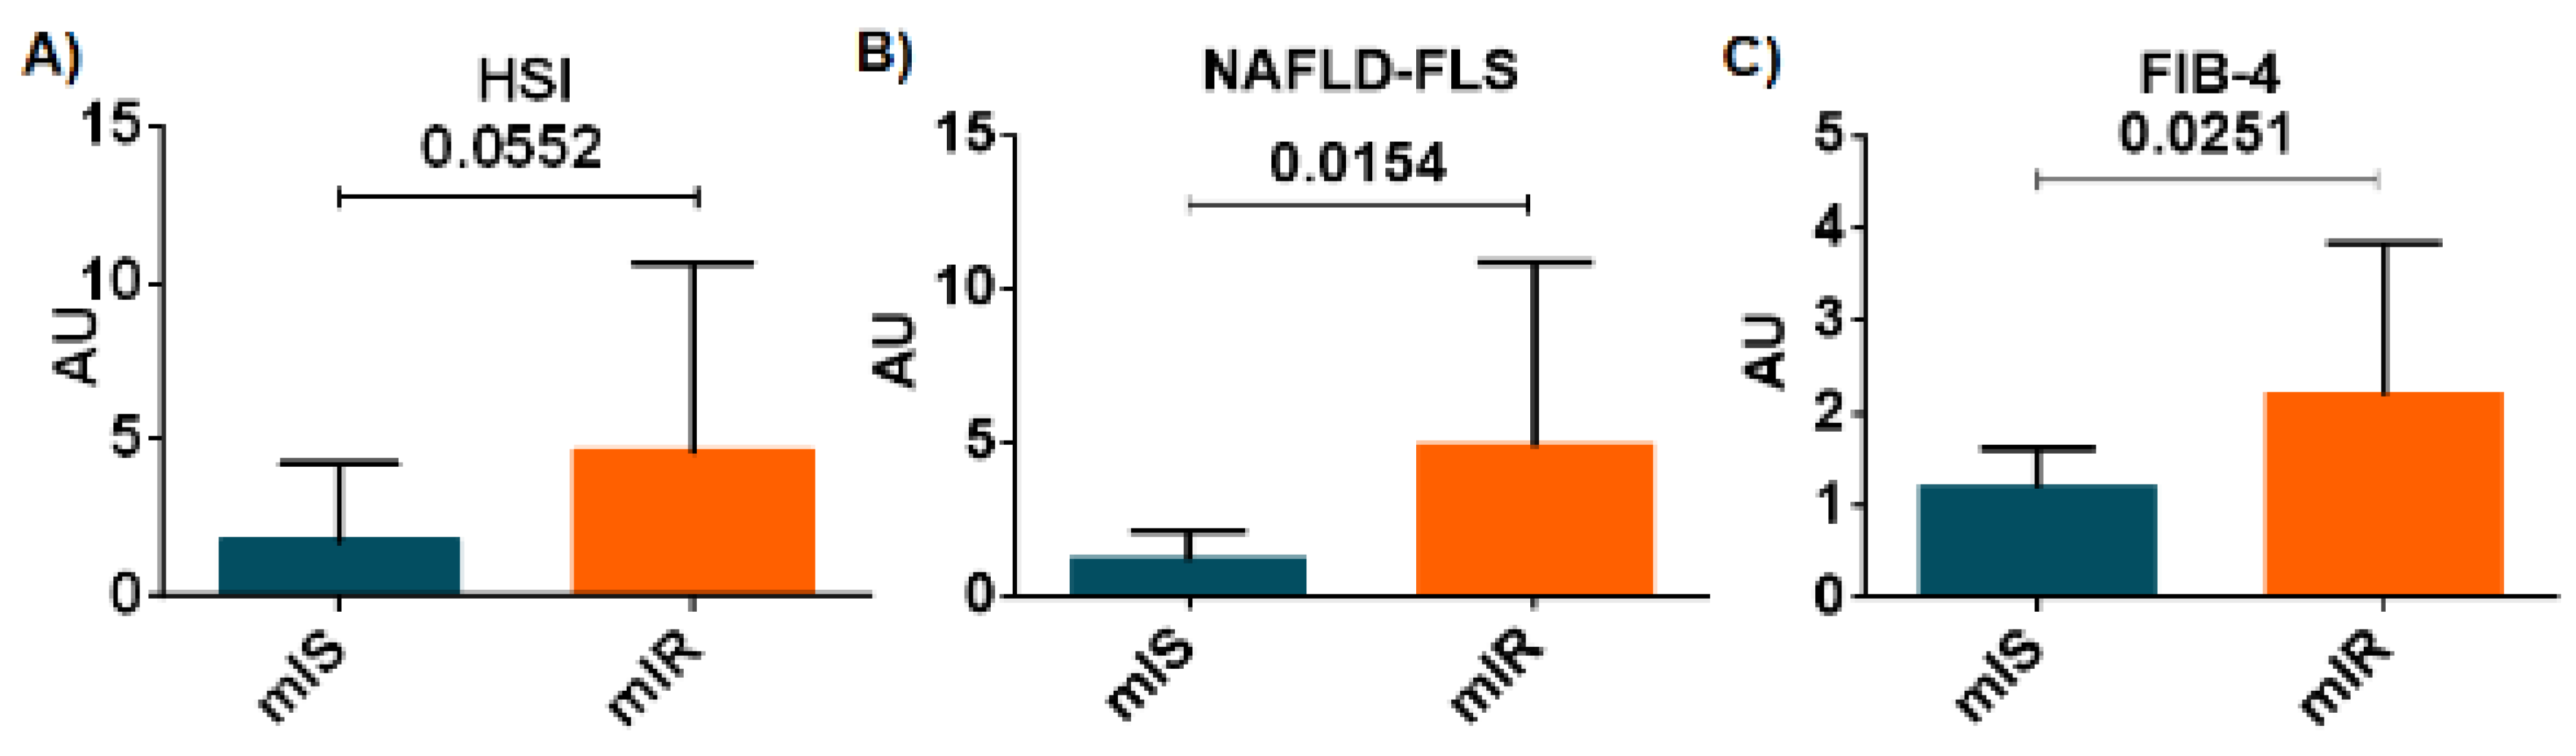
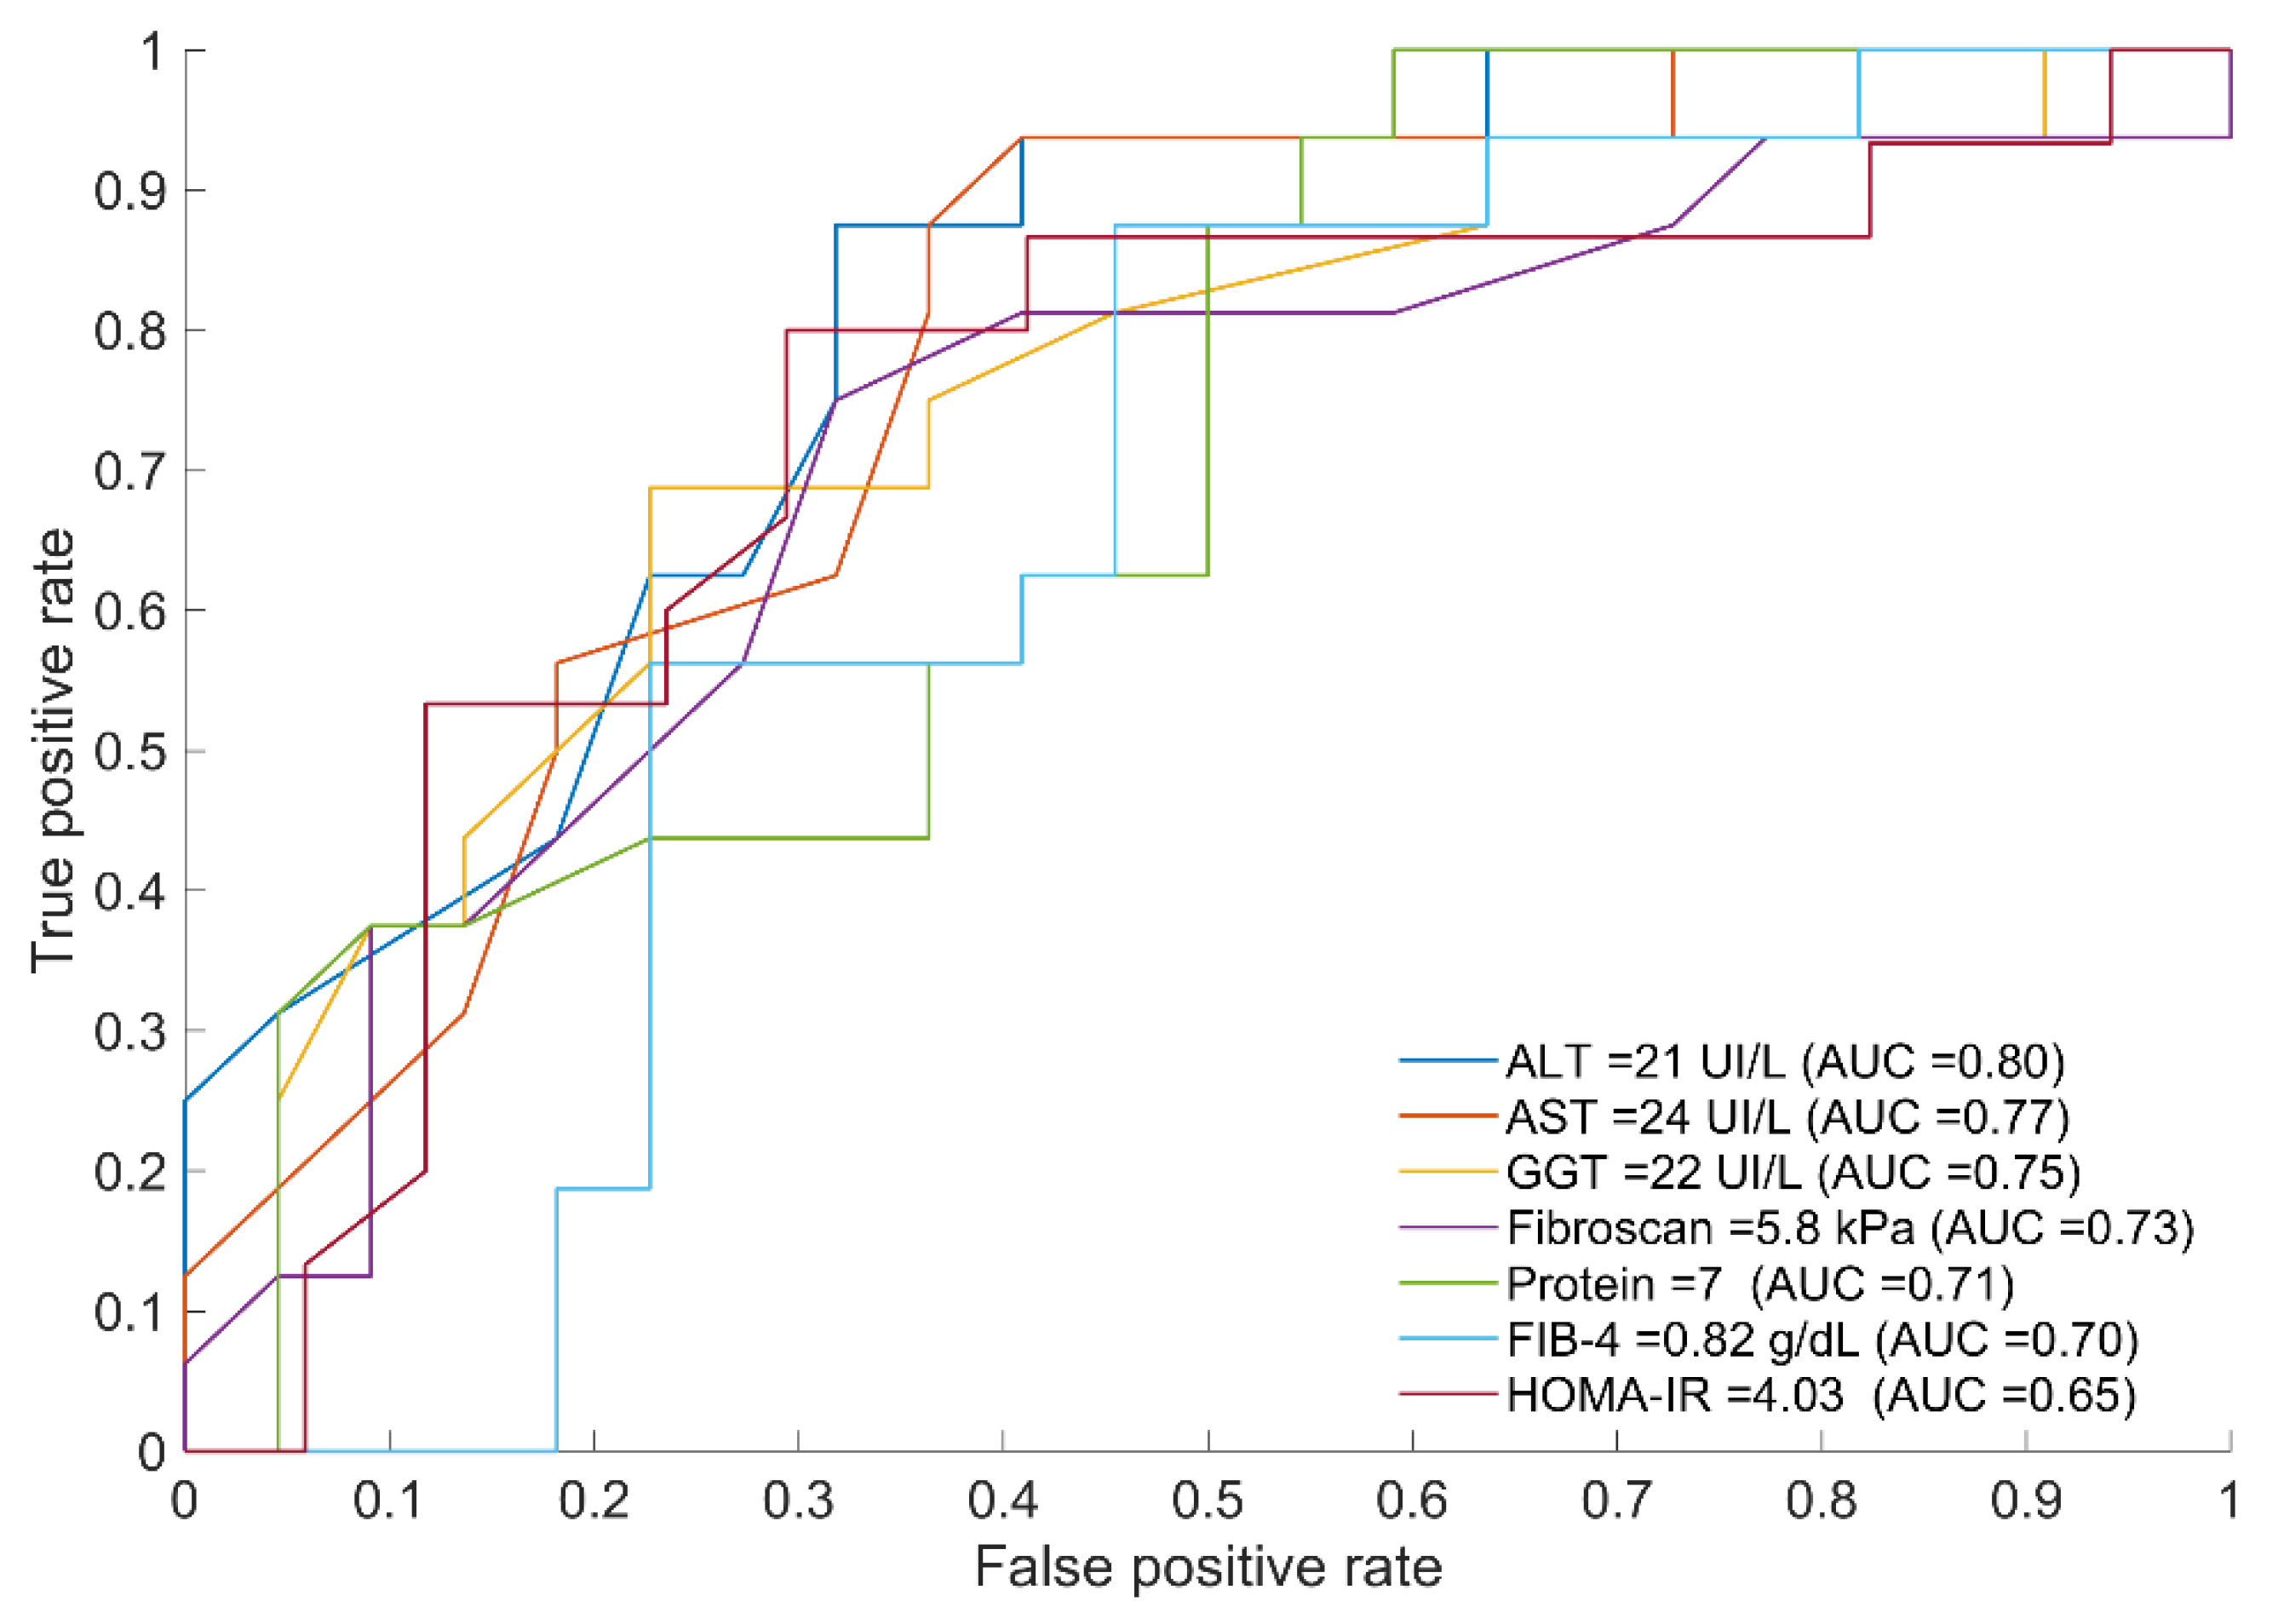
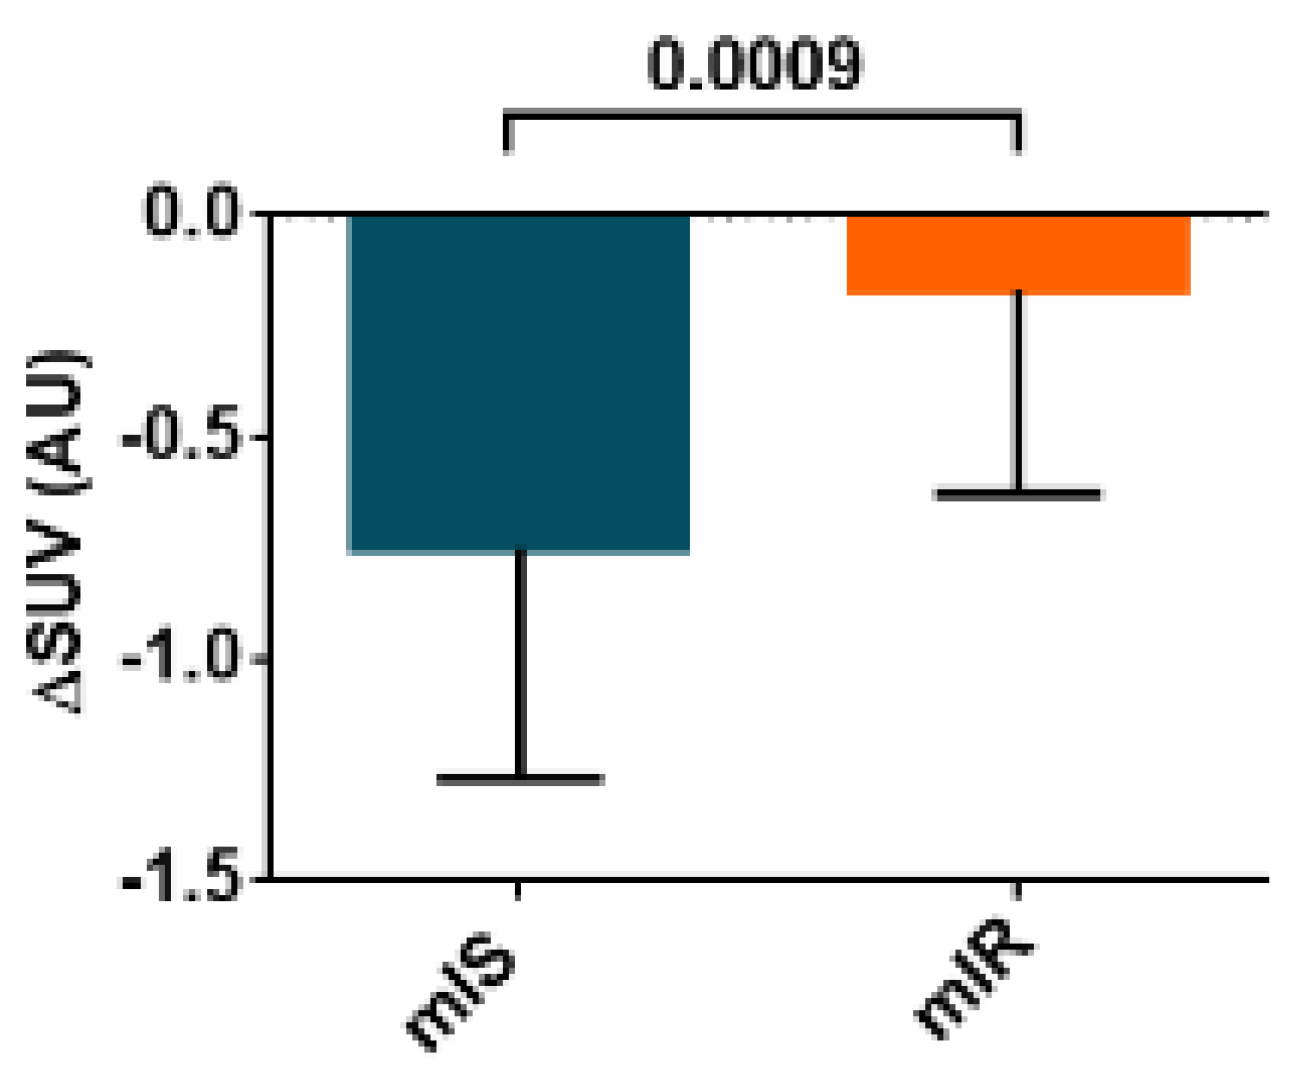
2.2. Biomarkers Discriminating between mIR and mIS
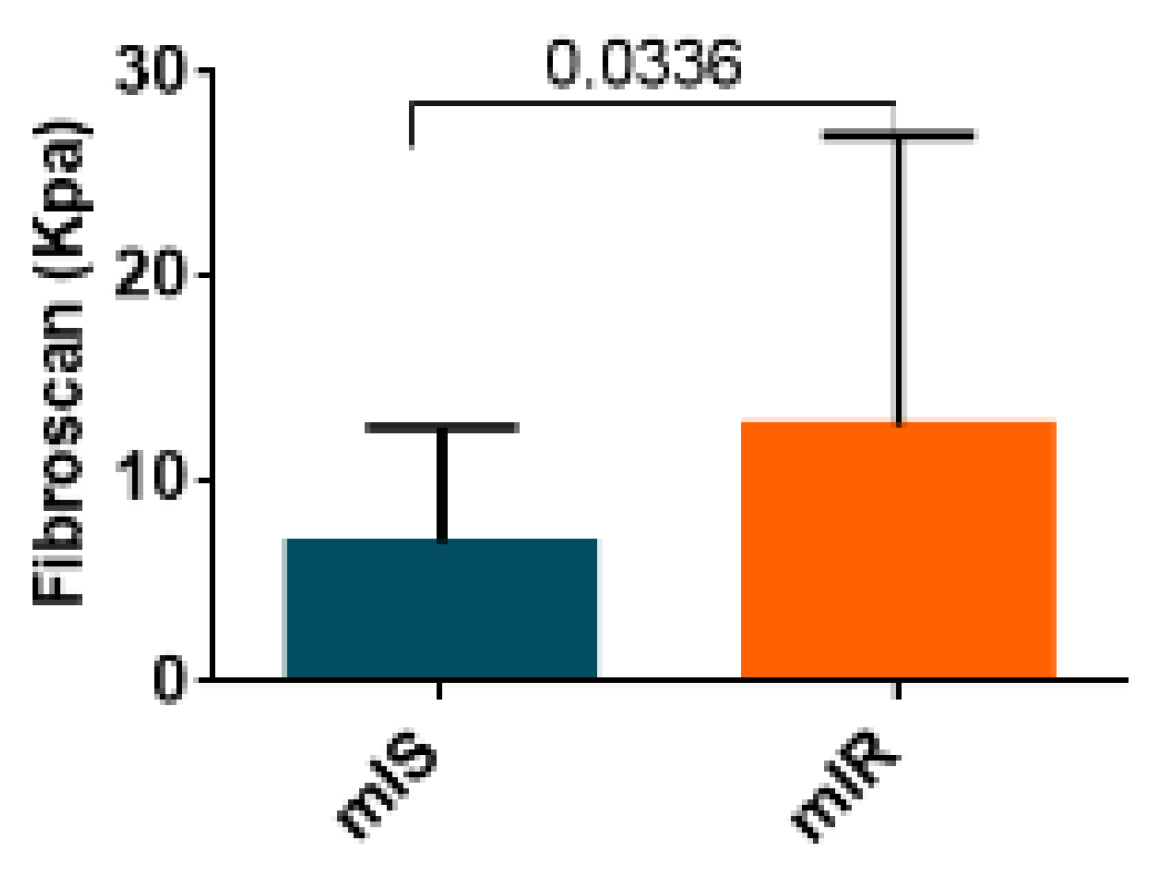
2.3. Hepatic Fibrosis Measured by Fibroscan
3. Discussion
4. Material and Methods
4.1. Subjects
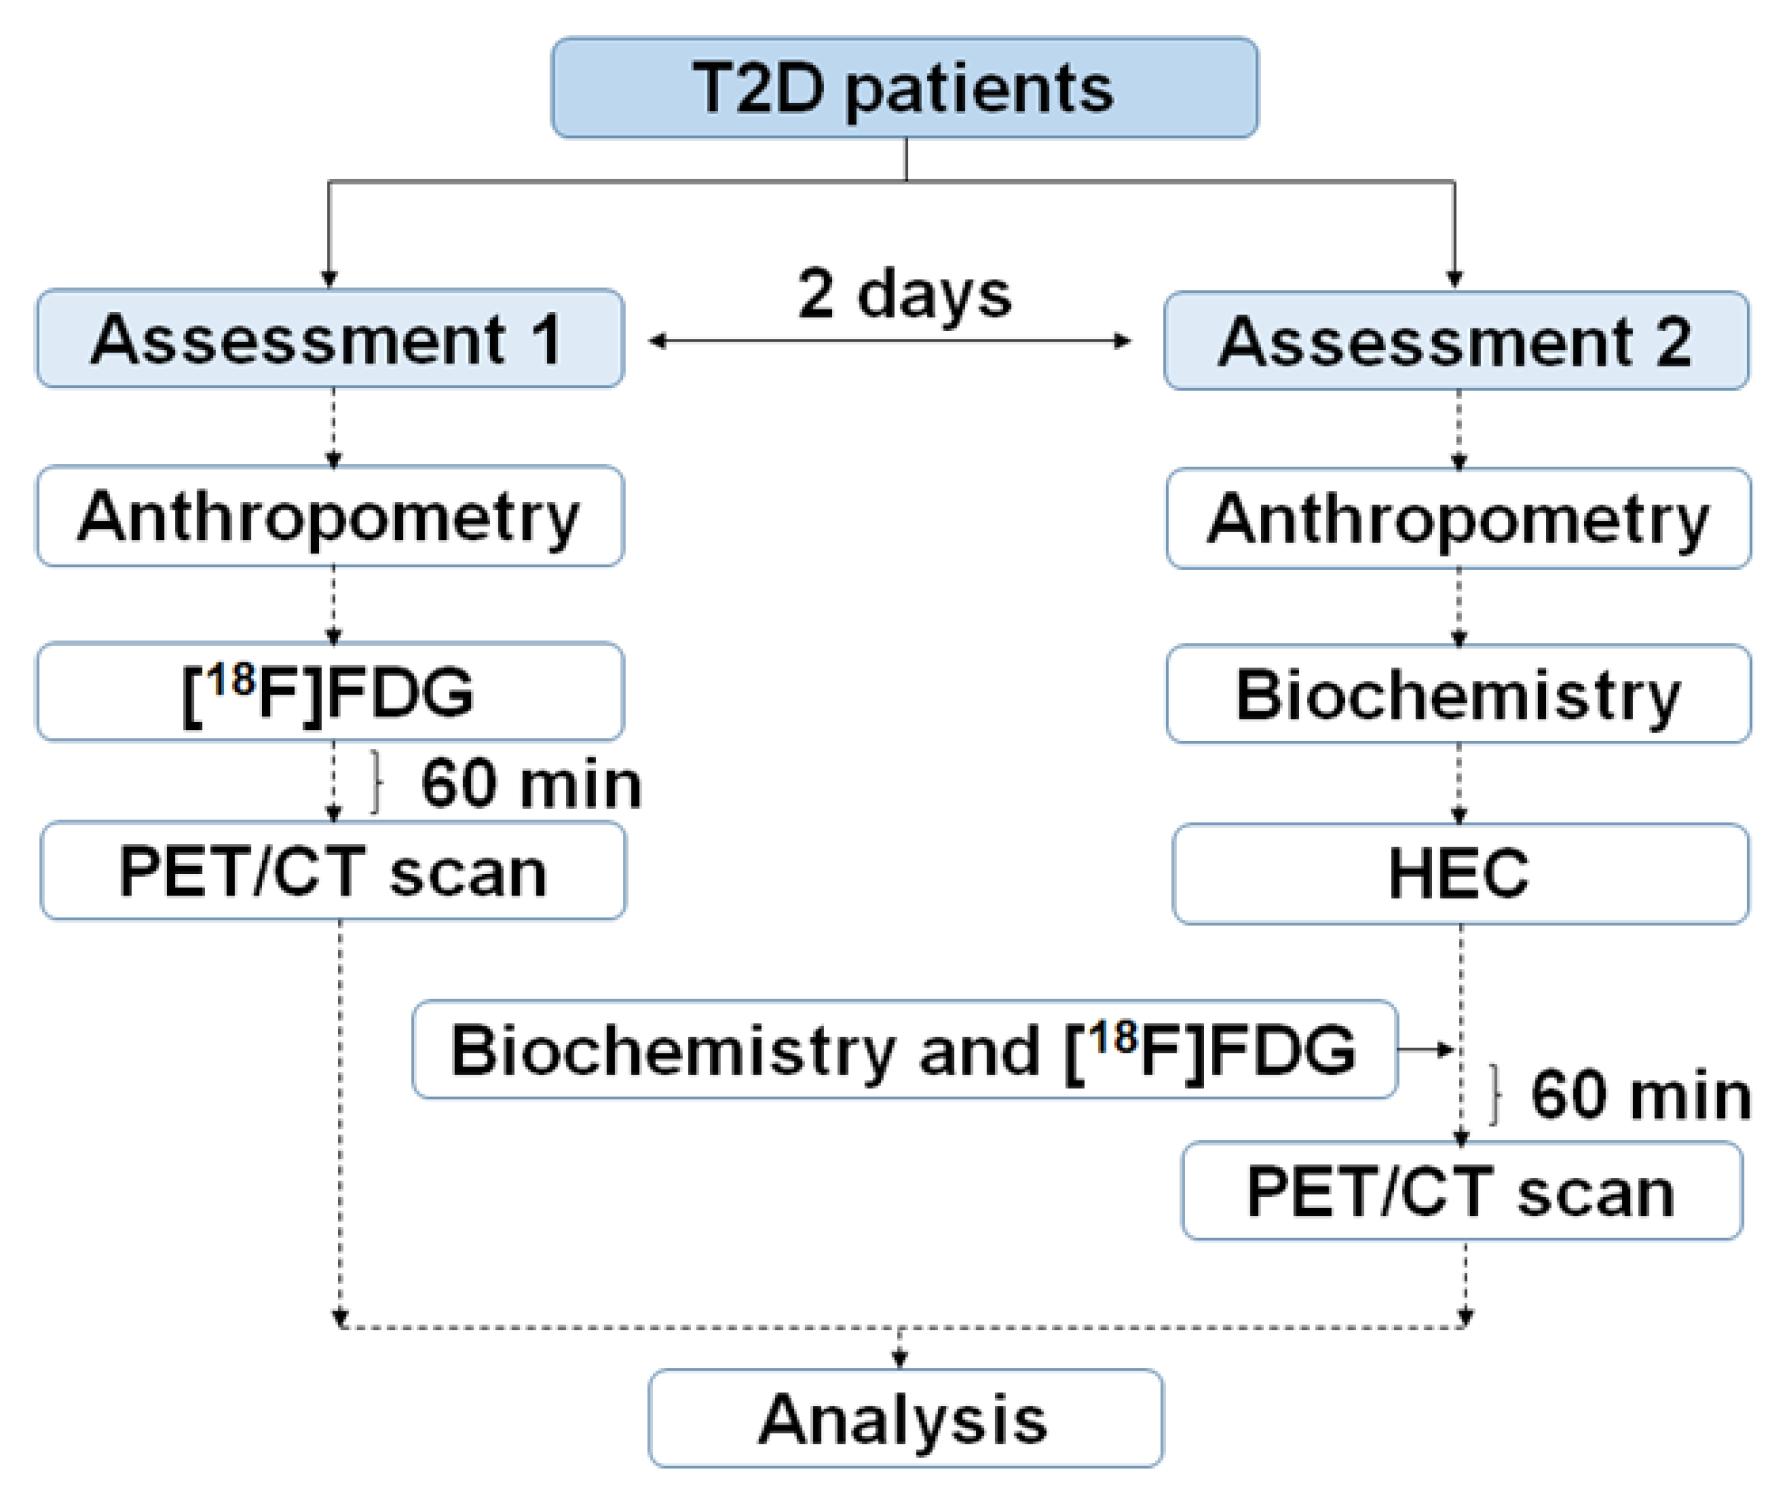
4.2. Study Design
4.3. Biochemical Analysis
4.4. Fibroscan
4.5. Statistical Analysis
Author Contributions
Funding
Institutional Review Board Statement
Informed Consent Statement
Data Availability Statement
Acknowledgments
Conflicts of Interest
References
- DeFronzo, R.A.; Ferrannini, E.; Groop, L.; Henry, R.R.; Herman, W.H.; Holst, J.J.; Hu, F.B.; Kahn, C.R.; Raz, I.; Shulman, G.I.; et al. Type 2 diabetes mellitus. Nat. Rev. Dis. Primers 2015, 1, 15019. [Google Scholar] [CrossRef]
- Ginter, E.; Simko, V. Type 2 diabetes mellitus, pandemic in 21st century. Adv. Exp. Med. Biol. 2013, 771, 42–50. [Google Scholar]
- Nolan, C.J.; Damm, P.; Prentki, M. Type 2 diabetes across generations: From pathophysiology to prevention and management. Lancet 2011, 378, 169–181. [Google Scholar] [CrossRef]
- Paul, S.; Ali, A.; Katare, R. Molecular complexities underlying the vascular complications of diabetes mellitus-A comprehensive review. J. Diabetes Complicat. 2020, 34, 107613. [Google Scholar] [CrossRef] [PubMed]
- Orasanu, G.; Plutzky, J. The Pathologic Continuum of Diabetic Vascular Disease. J. Am. Coll. Cardiol. 2009, 53, S35–S42. [Google Scholar] [CrossRef] [Green Version]
- Di Pino, A.; DeFronzo, R.A. Insulin Resistance and Atherosclerosis: Implications for Insulin-Sensitizing Agents. Endocr. Rev. 2019, 40, 1447–1467. [Google Scholar] [CrossRef] [PubMed] [Green Version]
- Taylor, R. Insulin resistance and type 2 diabetes. Diabetes 2012, 61, 778–779. [Google Scholar] [CrossRef] [Green Version]
- Giri, B.; Dey, S.; Das, T.; Sarkar, M.; Banerjee, J.; Dash, S.K. Chronic hyperglycemia mediated physiological alteration and metabolic distortion leads to organ dysfunction, infection, cancer progression and other pathophysiological consequences: An update on glucose toxicity. Biomed. Pharm. 2018, 107, 306–328. [Google Scholar] [CrossRef]
- Einarson, T.R.; Acs, A.; Ludwig, C.; Panton, U.H. Prevalence of cardiovascular disease in type 2 diabetes: A systematic literature review of scientific evidence from across the world in 2007–2017. Cardiovasc. Diabetol. 2018, 17, 83. [Google Scholar] [CrossRef] [Green Version]
- Abel, E.D.; O’Shea, K.M.; Ramasamy, R. Insulin resistance: Metabolic mechanisms and consequences in the heart. Arter. Thromb. Vasc. Biol. 2012, 32, 2068–2076. [Google Scholar] [CrossRef] [Green Version]
- Muir, W.W.; Hamlin, R.L. Myocardial Contractility: Historical and Contemporary Considerations. Front. Physiol. 2020, 11, 222. [Google Scholar] [CrossRef] [PubMed]
- Godsland, I.R.; Lecamwasam, K.; Johnston, D.G. A systematic evaluation of the insulin resistance syndrome as an independent risk factor for cardiovascular disease mortality and derivation of a clinical index. Metabolism 2011, 60, 1442–1448. [Google Scholar] [CrossRef] [PubMed]
- Witteles, R.M.; Fowler, M.B. Insulin-Resistant Cardiomyopathy. Clinical Evidence, Mechanisms, and Treatment Options. J. Am. Coll. Cardiol. 2008, 51, 93–102. [Google Scholar] [CrossRef] [PubMed]
- Qi, Y.; Xu, Z.; Zhu, Q.; Thomas, C.; Kumar, R.; Feng, H.; Dostal, D.E.; White, M.F.; Baker, K.M.; Guo, S. Myocardial loss of IRS1 and IRS2 causes heart failure and is controlled by p38α MAPK during insulin resistance. Diabetes 2013, 62, 3887–3900. [Google Scholar] [CrossRef] [Green Version]
- Fu, F.; Zhao, K.; Li, J.; Xu, J.; Zhang, Y.; Liu, C.; Yang, W.; Gao, C.; Li, J.; Zhang, H.; et al. Direct Evidence that Myocardial Insulin Resistance following Myocardial Ischemia Contributes to Post-Ischemic Heart Failure. Sci. Rep. 2015, 5, 17927. [Google Scholar] [CrossRef]
- Zheng, L.; Li, B.; Lin, S.; Chen, L.; Li, H. Role and mechanism of cardiac insulin resistance in occurrence of heart failure caused by myocardial hypertrophy. Aging 2019, 11, 6584–6590. [Google Scholar] [CrossRef]
- Herance, J.R.; Simó, R.; Velasquez, M.A.; Paun, B.; García-Leon, D.; Aparicio, C.; Marés, R.; Simó-Servat, O.; Castell-Conesa, J.; Hernández, C.; et al. Phenotyping Type 2 Diabetes in Terms of Myocardial Insulin Resistance and Its Potential Cardiovascular Consequences: A New Strategy Based on 18F-FDG PET/CT. J. Pers. Med. 2022, 12, 30. [Google Scholar] [CrossRef]
- Lee, J.H.; Kim, D.; Kim, H.J.; Lee, C.H.; Yang, J.I.; Kim, W.; Kim, Y.J.; Yoon, J.H.; Cho, S.H.; Sung, M.W.; et al. Hepatic steatosis index: A simple acreening tool reflecting non-alcoholic fatty liver disease. Dig. Liver Dis. 2010, 42, 503–508. [Google Scholar] [CrossRef]
- Kotronen, A.; Peltonen, M.; Hakkarainen, A.; Sevastianova, K.; Bergholm, R.; Johansson, L.M.; Lundbom, N.; Rissanen, A.; Ridderstråle, M.; Groop, L. Prediction of non-alcoholic fatty liver disease and liver fat using metabolic and genetic factors. Gastroenterology 2009, 137, 865–872. [Google Scholar] [CrossRef]
- Sumida, Y.; Yoneda, M.; Tokushige, K.; Kawanaka, M.; Fujii, H.; Yoneda, M.; Imajo, K.; Takahashi, H.; Eguchi, Y.; Ono, M.; et al. FIB-4 First in the Diagnostic Algorithm of Metabolic-Dysfunction-Associated Fatty Liver Disease in the Era of the Global Metabodemic. Life 2021, 11, 143. [Google Scholar] [CrossRef]
- Jia, G.; Hill, M.A.; Sowers, J.R. Diabetic cardiomyopathy: An update of mechanisms contributing to this clinical entity. Circ. Res. 2018, 122, 624–638. [Google Scholar] [CrossRef] [PubMed]
- Kobayashi, Y.; Kumita, S.; Fukushima, Y.; Ishihara, K.; Suda, M.; Sakurai, M. Significant suppression of myocardial 18F-fluorodeoxyglucose uptake using 24-h carbohydrate restriction and a low-carbohydrate, high-fat diet. J. Cardiol. 2013, 62, 314–319. [Google Scholar] [CrossRef] [PubMed] [Green Version]
- Camici, P.; Ferrannini, E.; Opie, L.H. Myocardial metabolism in ischemic heart disease: Basic principles and application to imaging by positron emission tomography. Prog. Cardiovasc. Dis. 1989, 32, 217–238. [Google Scholar] [CrossRef]
- Knuuti, M.J.; Mäki, M.; Yki-Järvinen, H.; Voipio-Pulkki, L.M.; Härkönen, R.; Haaparanta, M.; Nuutila, P. The effect of insulin and FFA on myocardial glucose uptake. J. Mol. Cell Cardiol. 1995, 27, 1359–1367. [Google Scholar] [CrossRef] [PubMed]
- Nuutila, P.; Knuuti, M.J.; Raitakari, M.; Ruotsalainen, U.; Teras, M.; Voipio- Pulkki, L.M.; Haaparanta, M.; Solin, O.; Wegelius, U.; Yki-Järvinen, H. Effect of antilipolysis on heart and skeletal muscle glucose uptake in overnight fasted humans. Am. J. Physiol. 1994, 267, E941–E946. [Google Scholar] [CrossRef] [PubMed]
- El Hadi, H.; Di Vincenzo, A.; Vettor, R.; Rossato, M. Relationship between Heart Disease and Liver Disease: A Two-Way Street. Cells 2020, 9, 567. [Google Scholar] [CrossRef] [Green Version]
- Zhang, Y.; Fang, X.M. Hepatocardiac or Cardiohepatic Interaction: From Traditional Chinese Medicine to Western Medicine. Evid Based Complement. Altern. Med. 2021, 2021, 6655335. [Google Scholar] [CrossRef]
- Vita, T.; Murphy, D.J.; Osborne, M.T.; Bajaj, N.S.; Keraliya, A.; Jacob, S.; Diaz, A.J.; Nodoushani, A.; Bravo, P.; Hainer, J.; et al. Association between Nonalcoholic Fatty Liver Disease at CT and Coronary Microvascular Dysfunction at Myocardial Perfusion PET/CT. Radiology 2019, 291, 330–337. [Google Scholar] [CrossRef]
- Yan, W.; Tao, L.; Ma, X. The Liver and Heart: How the Two Most Beloved “Babies” in the Human Body Communicate. Cardiol. Discov. 2021, 1, 211–213. [Google Scholar] [CrossRef]
- Petäjä, E.M.; Yki-Järvinen, H. Definitions of Normal Liver Fat and the Association of Insulin Sensitivity with Acquired and Genetic NAFLD—A Systematic Review. Int. J. Mol. Sci. 2016, 17, 633. [Google Scholar] [CrossRef] [Green Version]
- Cai, J.; Zhang, X.J.; Ji, Y.X.; Zhang, P.; She, Z.G.; Li, H. Nonalcoholic Fatty Liver Disease Pandemic Fuels the Upsurge in Cardiovascular Diseases. Circ. Res. 2020, 126, 679–704. [Google Scholar] [CrossRef] [PubMed]
- Zhou, J.; Bai, L.; Zhang, X.J.; Li, H.; Cai, J. Nonalcoholic Fatty Liver Disease and Cardiac Remodeling Risk: Pathophysiological Mechanisms and Clinical Implications. Hepatology 2021, 74, 2839–2847. [Google Scholar] [CrossRef] [PubMed]
- Eslam, M.; Sanyal, A.J.; George, J.; Sanyal, A.; Neuschwander-Tetri, B.; Tiribelli, C.; Kleiner, D.E.; Brunt, E.; Bugianesi, E.; Yki-Järvinen, H.; et al. MAFLD: A Consensus-Driven Proposed Nomenclature for Metabolic Associated Fatty Liver Disease. Gastroenterology 2020, 158, 1999–2014. [Google Scholar] [CrossRef]
- Jensen-Cody, S.O.; Potthoff, M.J. Hepatokines and metabolism: Deciphering communication from the liver. Mol. Metab. 2021, 44, 101138. [Google Scholar] [CrossRef] [PubMed]
- Meex, R.C.R.; Watt, M.J. Hepatokines: Linking nonalcoholic fatty liver disease and insulin resistance. Nat. Rev. Endocrinol. 2017, 13, 509–520. [Google Scholar] [CrossRef] [PubMed]
- Watt, M.J.; Miotto, P.M.; De Nardo, W.; Montgomery, M.K. The Liver as an Endocrine Organ—Linking NAFLD and Insulin Resistance. Endocr. Rev. 2019, 40, 1367–1393. [Google Scholar] [CrossRef]
- Lautamäki, R.; Borra, R.; Iozzo, P.; Komu, M.; Lehtimäki, T.; Salmi, M.; Jalkanen, S.; Juhani Airaksinen, K.E.; Knuuti, J.; Parkkola, R.; et al. Liver steatosis coexists with myocardial insulin resistance and coronary dysfunction in patients with type 2 diabetes. Am. J. Physiol. Endocrinol. Metab. 2006, 291, E282–E290. [Google Scholar] [CrossRef]
- Ostovaneh, M.R.; Ambale-Venkatesh, B.; Fuji, T.; Bakhshi, H.; Shah, R.; Murthy, V.L.; Tracy, R.P.; Guallar, E.; Wu, C.O.; Bluemke, D.A.; et al. Association of Liver Fibrosis with Cardiovascular Diseases in the General Population: The Multi-Ethnic Study of Atherosclerosis (MESA). Circ. Cardiovasc. Imaging 2018, 11, e007241. [Google Scholar] [CrossRef] [Green Version]
- Henson, J.B.; Simon, T.G.; Kaplan, A.; Osganian, S.; Masia, R.; Corey, K.E. Advanced fibrosis is associated with incident cardiovascular disease in patients with non-alcoholic fatty liver disease. Aliment. Pharm. 2020, 51, 728–736. [Google Scholar] [CrossRef] [Green Version]
- Baratta, F.; Pastori, D.; Angelico, F.; Balla, A.; Paganini, A.M.; Cocomello, N.; Ferro, D.; Violi, F.; Sanyal, A.J.; Ben, M.D. Nonalcoholic Fatty Liver Disease and Fibrosis Associated With Increased Risk of Cardiovascular Events in a Prospective Study. Clin. Gastroenterol. Hepatol. 2020, 18, 2324–2331. [Google Scholar] [CrossRef]
- Yilmaz, Y.; Kurt, R.; Yonal, O.; Polat, N.; Celikel, C.A.; Gurdal, A.; Oflaz, H.; Ozdogan, O.; Imeryuz, N.; Kalayci, C.; et al. Coronary flow reserve is impaired in patients with nonalcoholic fatty liver disease: Association with liver fibrosis. Atherosclerosis 2010, 211, 182–186. [Google Scholar] [CrossRef] [PubMed]
- Liu, H.; Cao, Y.; Jin, J.; Guo, Y.; Zhu, C.; Wu, N.; Hua, Q.; Li, Y.; Hong, L.; Dong, Q.; et al. Liver Fibrosis Scoring Systems as Novel Tools for Predicting Recurrent Cardiovascular Events in Patients with a Prior Cardiovascular Event. Cardiol. Discov. Ovid. Technol. 2021, 1, 214–222. [Google Scholar] [CrossRef]
- Musso, G.; Gambino, R.; Cassader, M. Non-alcoholic fatty liver disease from pathogenesis to management: An update. Obes. Rev. 2010, 11, 430–445. [Google Scholar] [CrossRef]
- Yamaguchi, K.; Yang, L.; McCall, S.; Huang, J.; Xing, X.Y.; Pandey, S.K.; Bhanot, S.; Monia, B.P.; Li, Y.X.; Diehl, A.M. Inhibiting triglyceride synthesis improves hepatic steatosis but exacerbates liver damage and fibrosis in obese mice with nonalcoholic steatohepatitis. Hepatology 2007, 45, 1366–1374. [Google Scholar] [CrossRef]
- Makker, J.; Tariq, H.; Kumar, K.; Ravi, M.; Shaikh, D.H.; Leung, V.; Hayat, U.; Hassan, M.T.; Patel, H.; Nayudu, S.; et al. Prevalence of advanced liver fibrosis and steatosis in type-2 diabetics with normal transaminases: A prospective cohort study. World J. Gastroenterol. 2021, 27, 523–533. [Google Scholar] [CrossRef] [PubMed]
- Fracanzani, A.L.; Valenti, L.; Bugianesi, E.; Andreoletti, M.; Colli, A.; Vanni, E.; Bertelli, C.; Fatta, E.; Bignamini, D.; Marchesini, G.; et al. Risk of severe liver disease in nonalcoholic fatty liver disease with normal aminotransferase levels: A role for insulin resistance and diabetes. Hepatology 2008, 48, 792–798. [Google Scholar] [CrossRef] [PubMed]
- Kwok, R.; Choi, K.C.; Wong, G.L.H.; Zhang, Y.; Chan, H.L.Y.; Luk, A.O.; Shu, S.S.; Chan, A.W.; Yeung, M.W.; Chan, J.C.; et al. Screening diabetic patients for non-alcoholic fatty liver disease with controlled attenuation parameter and liver stiffness measurements: A prospective cohort study. Gut 2016, 65, 1359–1368. [Google Scholar] [CrossRef] [PubMed]
- Knuuti, M.J.; Nuutila, P.; Ruotsalainen, U.; Saraste, M.; Häkönen, R.; Ahonen, A.; Teräs, M.; Haaparanta, M.; Wegelius, U.; Haapanen, A.; et al. Euglycemic Hyperinsulinemic Clamp and Oral Glucose Load in Stimulating Myocardial Glucose Utilization During Positron Emission Tomography. J. Nucl. Med. 1992, 33, 1255–1262. [Google Scholar]
- Dilsizian, V.; Bacharach, S.L.; Beanlands, R.S.; Bergmann, S.R.; Delbeke, D.; Dorbala, S.; Gropler, R.J.; Knuuti, J.; Schelbert, H.R.; Travin, M.I. ASNC imaging guidelines/SNMMI procedure standard for positron emission tomography (PET) nuclear cardiology procedures. J. Nucl. Cardiol. 2016, 23, 1187–1226. [Google Scholar] [CrossRef] [Green Version]
- Palomino-Schätzlein, M.; Lamas-Domingo, R.; Ciudin, A.; Gutiérrez-Carcedo, P.; Marés, R.; Aparicio-Gómez, C.; Hernández, C.; Simó, R.; Herance, J.R. A Translational In Vivo and In Vitro Metabolomic Study Reveals Altered Metabolic Pathways in Red Blood Cells of Type 2 Diabetes. J. Clin. Med. 2020, 9, 1619. [Google Scholar] [CrossRef]
- Castera, L.; Yuen Chan, H.L.; Arrese, M.; Afdhal, N.; Bedossa, P.; Friedrich-Rust, M.; Han, K.H.; Pinzani, M. EASL-ALEH Clinical Practice Guidelines: Non-invasive tests for evaluation of liver disease severity and prognosis. J. Hepatol. 2015, 63, 237–264. [Google Scholar]


| mIS | mIR | p | |
|---|---|---|---|
| Age (years) | 69 ± 2 | 66 ± 1 | 0.1837 |
| Gender (M:F) | 11:10 (21) | 13:13 (26) | >0.9999 |
| Glucose (mg/dL) | 118 [109:142] | 122 [114:147] | 0.8893 |
| BMI | 30.46 [27.83:37.22] | 31.16 [29.27:34.87] | 0.5010 |
| Cholesterol (C) (mg/dL) | 161 [141:171] | 176 [16:207] | 0.1757 |
| C-HDL (mg/dL) | 48 [38:52] | 43 [38:50] | 0.3097 |
| C-LDL (mg/dL) | 84 [76:102] | 105 [82:122] | 0.3012 |
| HbA1c (%) | 7.05 [6.48:7.40] | 7.40 [6.80:7.70] | 0.3537 |
| HOMA-IR | 3.88 [3.21:5.26] | 5.51 [4.39:9.98] | 0.0335 |
| ALT (IU/L) | 21 [18:23] | 30 [22:41] | 0.0054 |
| AST (IU/L) | 17 [15:21] | 29 [18:39] | 0.0084 |
| GGT (IU/L) | 19 [14:27] | 29 [23:48] | 0.0285 |
| Triglycerides (mg/dL) | 109 [73:166] | 124 [100:193] | 0.2537 |
| FFA (mmol/L) | 0.62 [0.58:0.77] | 0.75 [0.60:0.85] | 0.2292 |
| Protein (g/dL) | 6.80 [7.00:6.80] | 7.20 [6.93:7.48] | 0.0273 |
| Albumin (g/dL) | 4.10 [3.90:4.20] | 4.35 [4.10:4.50] | 0.1814 |
| mIS | mIR | |
|---|---|---|
| Metformin, n (%) | 4 (23.53) | 3 (11.54) |
| Metformin and/or other OA *, n (%) | 3 (17.65) | 9 (34.60%) |
| OA + GLP1-Ras, n (%) | 2 (11.76) | 2 (7.69%) |
| Insulin, n (%) | 1 (5.88) | - |
| Insulin + OA, n (%) | 3 (17.65) | 8 (30.76) |
| Insulin + GLP1-RAs, n (%) | 1 (5.88) | - |
| Insulin + OA + GLP1-RAs, n (%) | 3 (17.65) | 4 (15.38) |
Publisher’s Note: MDPI stays neutral with regard to jurisdictional claims in published maps and institutional affiliations. |
© 2022 by the authors. Licensee MDPI, Basel, Switzerland. This article is an open access article distributed under the terms and conditions of the Creative Commons Attribution (CC BY) license (https://creativecommons.org/licenses/by/4.0/).
Share and Cite
Herance, J.R.; Martín-Saladich, Q.; Velásquez, M.A.; Hernandez, C.; Aparicio, C.; Ramirez-Serra, C.; Ferrer, R.; Giralt-Arnaiz, M.; González-Ballester, M.Á.; Pericàs, J.M.; et al. Identification of Myocardial Insulin Resistance by Using Liver Tests: A Simple Approach for Clinical Practice. Int. J. Mol. Sci. 2022, 23, 8783. https://doi.org/10.3390/ijms23158783
Herance JR, Martín-Saladich Q, Velásquez MA, Hernandez C, Aparicio C, Ramirez-Serra C, Ferrer R, Giralt-Arnaiz M, González-Ballester MÁ, Pericàs JM, et al. Identification of Myocardial Insulin Resistance by Using Liver Tests: A Simple Approach for Clinical Practice. International Journal of Molecular Sciences. 2022; 23(15):8783. https://doi.org/10.3390/ijms23158783
Chicago/Turabian StyleHerance, José Raúl, Queralt Martín-Saladich, Mayra Alejandra Velásquez, Cristina Hernandez, Carolina Aparicio, Clara Ramirez-Serra, Roser Ferrer, Marina Giralt-Arnaiz, Miguel Ángel González-Ballester, Juan M. Pericàs, and et al. 2022. "Identification of Myocardial Insulin Resistance by Using Liver Tests: A Simple Approach for Clinical Practice" International Journal of Molecular Sciences 23, no. 15: 8783. https://doi.org/10.3390/ijms23158783
APA StyleHerance, J. R., Martín-Saladich, Q., Velásquez, M. A., Hernandez, C., Aparicio, C., Ramirez-Serra, C., Ferrer, R., Giralt-Arnaiz, M., González-Ballester, M. Á., Pericàs, J. M., Castell-Conesa, J., Aguadé-Bruix, S., & Simó, R. (2022). Identification of Myocardial Insulin Resistance by Using Liver Tests: A Simple Approach for Clinical Practice. International Journal of Molecular Sciences, 23(15), 8783. https://doi.org/10.3390/ijms23158783