Article

Downregulation of IL-8 and IL-10 by the Activation of Ca2+-Activated K+ Channel KCa3.1 in THP-1-Derived M2 Macrophages

Department of Pharmacology, Graduate School of Medical Sciences, Nagoya City University, Nagoya 467-8601, Japan
*
Author to whom correspondence should be addressed.
Int. J. Mol. Sci. 2022, 23(15), 8603; https://doi.org/10.3390/ijms23158603
Submission received: 21 July 2022 / Accepted: 26 July 2022 / Published: 3 August 2022
(This article belongs to the Special Issue Recent Developments in Ion Channel and Ion-Related Signaling)

Abstract

:
THP-1-differentiated macrophages are useful for investigating the physiological significance of tumor-associated macrophages (TAMs). In the tumor microenvironment (TME), TAMs with the M2-like phenotype play a critical role in promoting cancer progression and metastasis by inhibiting the immune surveillance system. We examined the involvement of Ca2+-activated K+ channel KCa3.1 in TAMs in expressing pro-tumorigenic cytokines and angiogenic growth factors. In THP-1-derived M2 macrophages, the expression levels of IL-8 and IL-10 were significantly decreased by treatment with the selective KCa3.1 activator, SKA-121, without changes in those of VEGF and TGF-β1. Furthermore, under in vitro experimental conditions that mimic extracellular K+ levels in the TME, IL-8 and IL-10 levels were both significantly elevated, and these increases were reversed by combined treatment with SKA-121. Among several signaling pathways potentially involved in the transcriptional regulation of IL-8 and IL-10, respective treatments with ERK and JNK inhibitors significantly repressed their transcriptions, and treatment with SKA-121 significantly reduced the phosphorylated ERK, JNK, c-Jun, and CREB levels. These results strongly suggest that the KCa3.1 activator may suppress IL-10-induced tumor immune surveillance escape and IL-8-induced tumorigenicity and metastasis by inhibiting their production from TAMs through ERK-CREB and JNK-c-Jun cascades.

Graphical Abstract

1. Introduction

Tumor-associated macrophages (TAMs), mainly derived from monocytes, abundantly infiltrate solid tumors. They promote tumorigenesis, cancer metastasis, and the acquisition of anti-cancer drug resistance [1]. The localization of TAMs in the tumor microenvironment (TME) correlates with poor clinical outcomes in solid tumors [1]. Most TAMs have M2-like characteristics in the TME (up to 50% of the tumor mass in solid tumors) and secrete pro-inflammatory and anti-inflammatory cytokines/chemokines (i.e., IL-8/CXCL8 and IL-10) and angiogenic growth factors (i.e., transforming growth factor (TGF)-β1 and vascular endothelial growth factor (VEGF)) during tumor progression [2]. IL-10 promotes tumor immune surveillance escape and IL-8 is a key mediator of angiogenesis, tumorigenicity, and metastasis. Macrophages differentiated from human monocytic leukemia THP-1 cells are used as human in vitro models to study M1- and M2-polarized macrophages [3]. The manipulation of TAM functions is a useful clinical therapeutic approach to prevent tumor metastasis [4].
The intermediate-conductance Ca2+-activated K+ channel, KCa3.1, decreases intracellular K+ concentrations ([K+]i) by facilitating K+ efflux, and the resulting membrane hyperpolarization increases the driving force for Ca2+ influx, leading to a sustained increase in intracellular Ca2+ concentrations ([Ca2+]i) in immune cells such as macrophages. KCa3.1-mediated [Ca2+]i increases are essential for proliferation, differentiation, apoptosis, and gene expression in immune cells and represent attractive therapeutic targets for autoimmune and inflammatory diseases [5,6]. KCa3.1 indirectly regulates the production of pro- and anti-inflammatory cytokines/chemokines and macrophage polarization [7,8].
Hypoxic TME-induced death in tumor cells induces an isotonic elevation in extracellular K+ concentrations ([K+]e) of up to approximately 50 mM, and elevated [K+]e within tumor interstitial fluid contributes to immunosuppression by inhibiting the functions of cytotoxic CD8+ T cells [9]. K+-driven cancer immunotherapy with a focus on K+ homeostasis is a potential therapeutic strategy for cancer [9,10]; however, the mechanisms underlying intracellular K+-driven cytokine/chemokine regulation in tumor-infiltrating immunosuppressive cells such as TAMs have not yet been elucidated.
IL-8 plays a critical role in (1) the recruitment and accumulation of TAMs and the other immunosuppressive cells, such as regulatory T (Treg) cells, into the TME [2,11] and (2) neovascularization/tumor angiogenesis, accelerating tumor proliferation and metastasis in the TME [12]. Increased numbers of IL-8-expressing TAMs at high levels have been detected in higher clinical stage tumors and were associated with an increased risk of a poor prognosis in cancer patients [13,14]. Bidirectional communication between M2 macrophages and tumor cells pathologically promotes M2 macrophages to secrete IL-8 into the TME. Like IL-8, the immunosuppressive cytokine IL-10 is abundantly expressed in TAMs, promoting cancer cell proliferation and metastasis [15]. Previous studies demonstrated that the transcription of IL-8 and IL-10 was critically regulated by the ERK (extracellular signal-regulated kinase) and JNK (c-Jun N-terminal kinase) signaling pathways in epithelial cells, monocytes, and fibroblasts [16,17,18]. Furthermore, several transcription factors (i.e., CREB, AP-1, and/or NF–κB) that bind to the promoters of the IL-8 and IL-10 genes have been identified [19,20].
We examined the effects of the selective KCa3.1 activator, SKA-121, on the expression and secretion of IL-8 and IL-10 in THP-1-derived M2 macrophages. We also investigated the effects of SKA-121 on high K+-induced increases in IL-10/IL-8 expression and secretion in THP-1-derived M2 macrophages under in vitro experimental conditions mimicking the TME of solid tumors. The obtained results provide emerging mechanistic insights into the therapeutic potential of KCa3.1 activators in cancer immunotherapy.

2. Results

2.1. In Vitro Differentiation of Human Monocytic THP-1 Cells into M2-like Macrophages

We initially confirmed the increased transcriptional expression of M2 macrophage markers in THP-1-derived M2-like macrophages. As reported by Javasingam et al. (2020) [21], the expression levels of CD163 and Arg1, which are widely used as markers for human M2 macrophages, were increased by the IL-4/IL-13-induced differentiation of M0 macrophages into the M2 phenotype (Figure 1A,B). The expression levels of the anti-inflammatory cytokine, IL-10, the pro-inflammatory chemokine, IL-8, and the angiogenic growth factor, VEGF-A, were higher in THP-1-derived M2 macrophages (‘M2’) (Figure 1C,D,E) than in native, undifferentiated THP-1 (‘native’) and PMA-differentiated M0 macrophages (‘M0’) (n = 4 for each, p < 0.01). The C-C motif chemokine ligands, CCL17, CCL18, and CCL22, which are secreted from activated TAMs, are associated with the enlargement of tumor size and the promotion of tumor metastasis, and the recruitment of Treg cells [22]. Among these CCLs, CCL22 transcripts were highly expressed in THP-1-derived M2 macrophages (Figure 1F); however, the expression levels of the other CCLs were less than 0.001 in arbitrary units normalized by β-actin (ACTB) expression. TGF-β1 transcripts were highly expressed in both THP-derived ‘M0’ and ‘M2’ macrophages (Figure 1G).

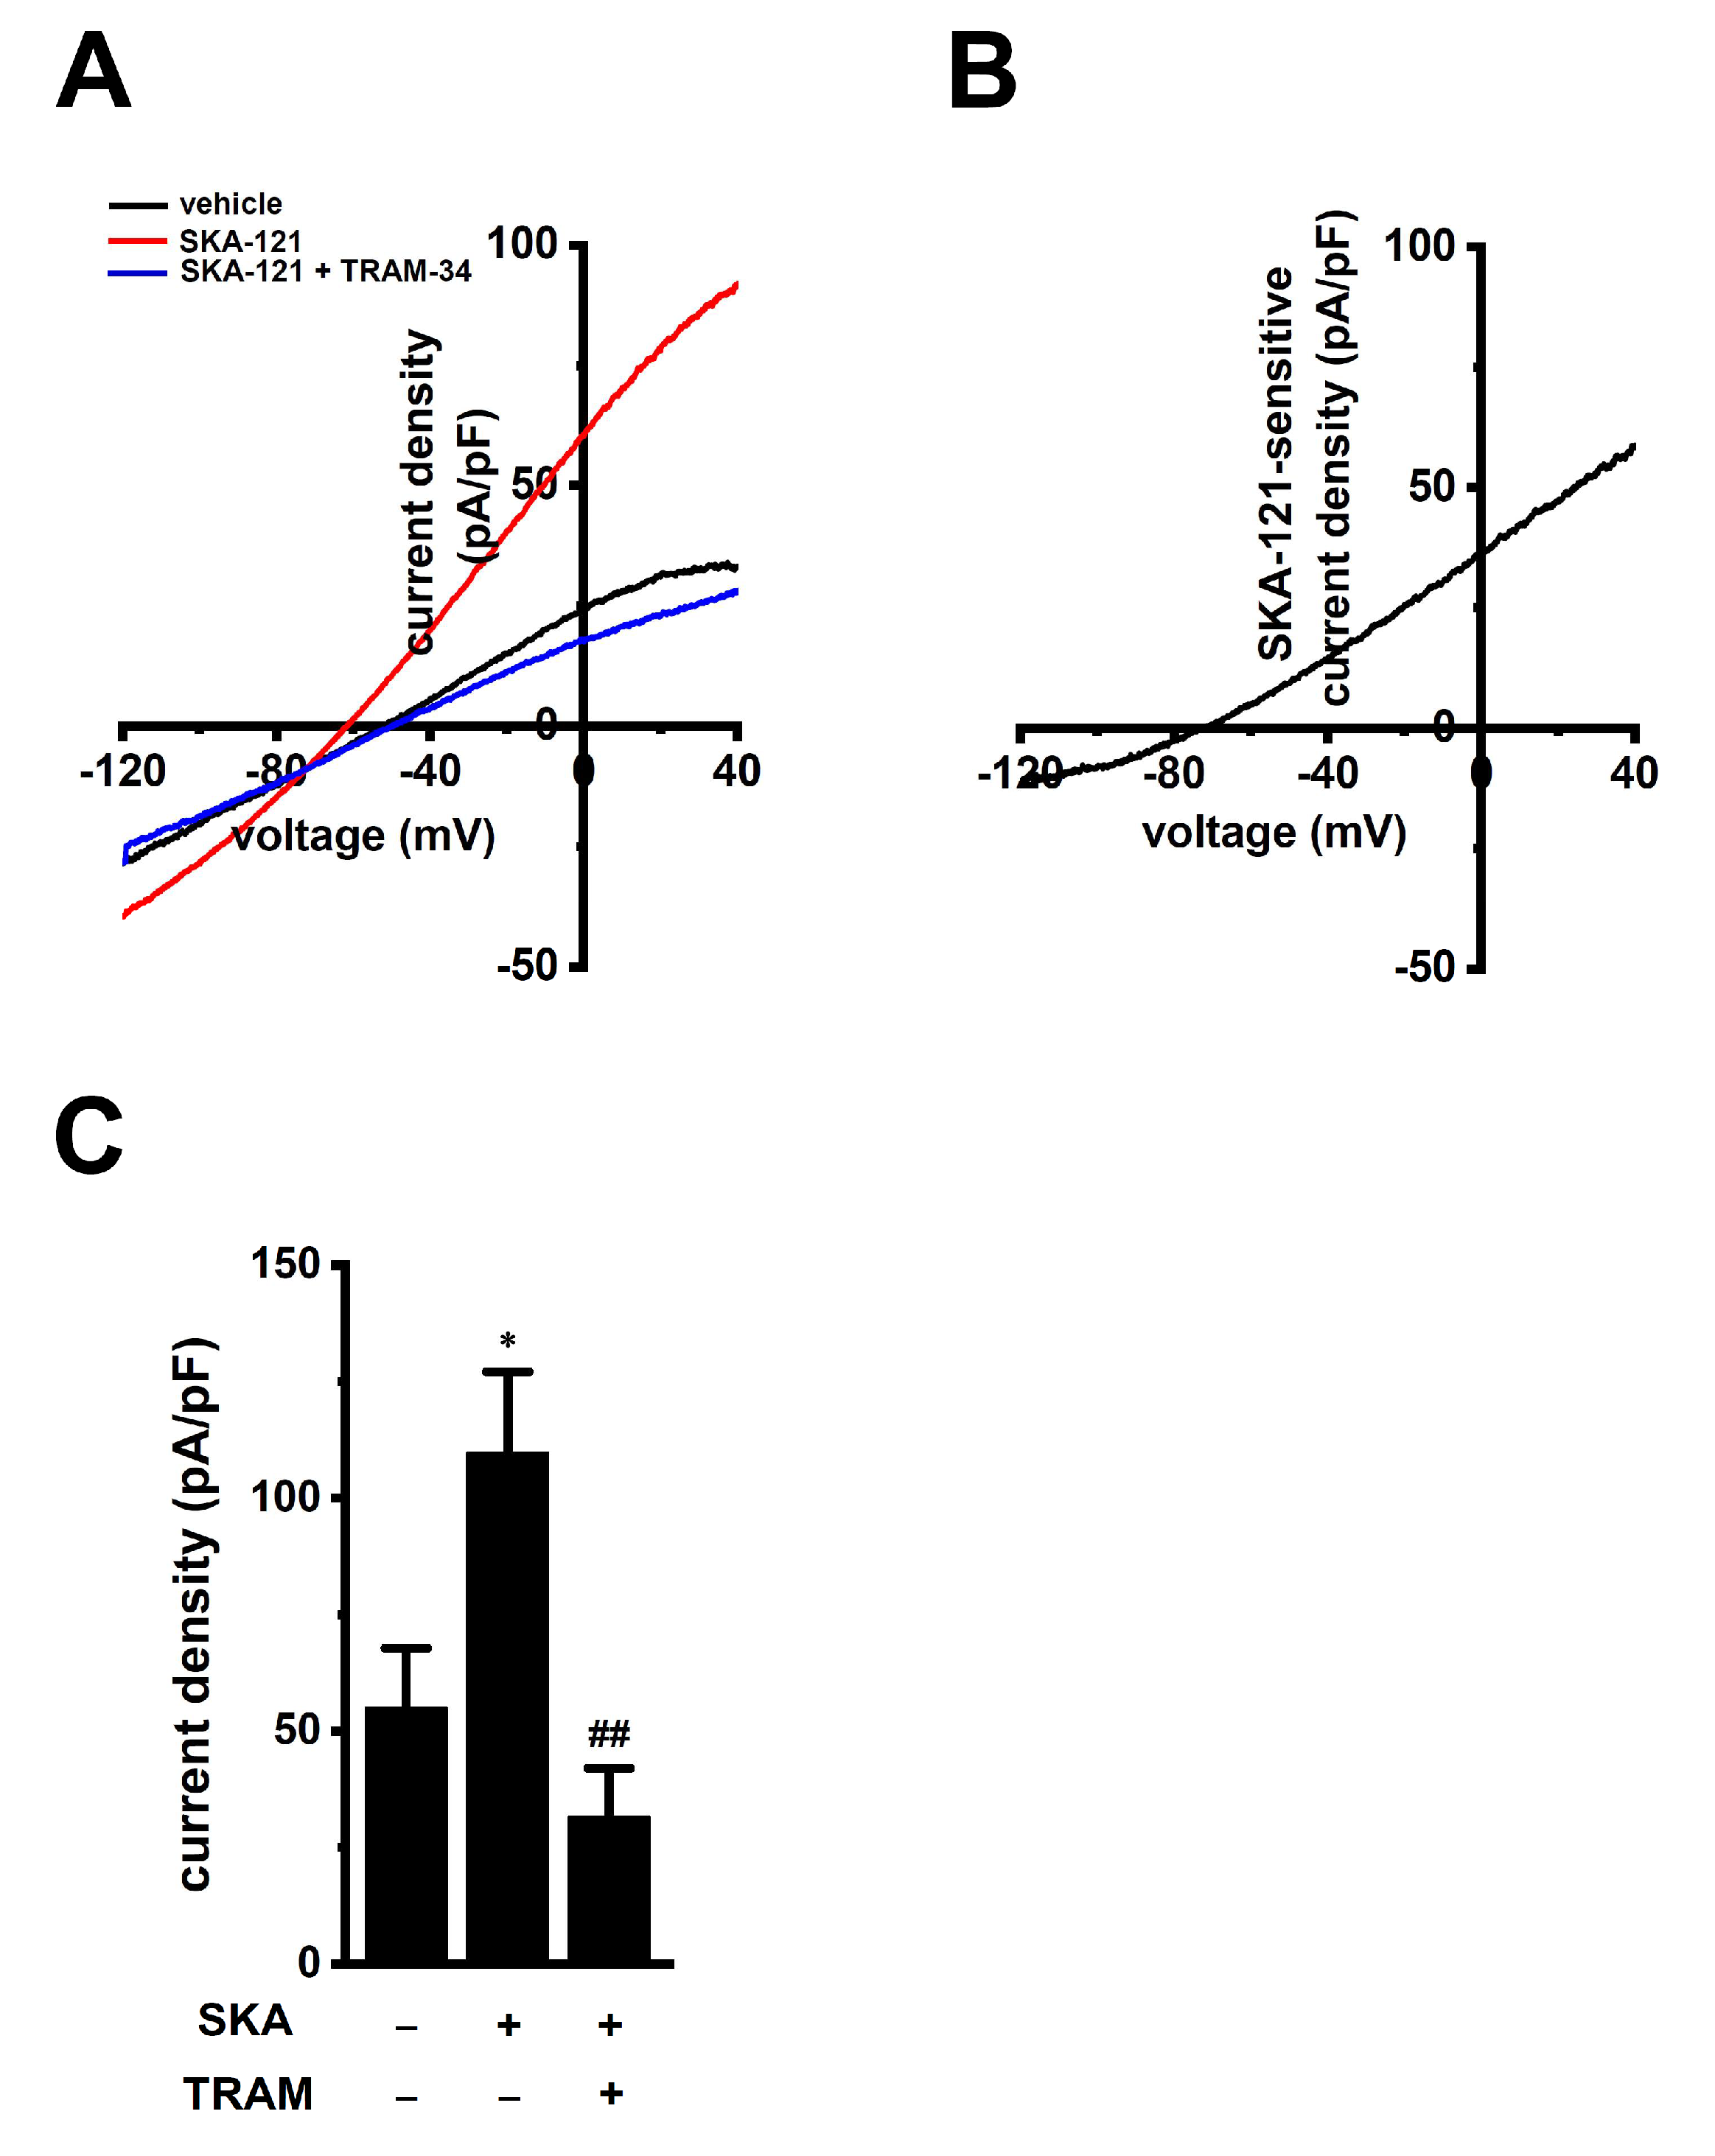
2.2. Functional Expression of KCa3.1 in THP-1-Derived M2 Macrophages

To perform functional analyses of KCa3.1 in THP-1-derived M2 macrophages, we measured selective KCa3.1 activator (1 μM SKA-121)-induced hyperpolarizing responses and increases in [Ca2+]i by simultaneously monitoring DiBAC4(3) and Fura 2 signals, and representative time-course plots of the three different cells are shown in Figure 2A,B. In the presence of SKA-121, the selective KCa3.1 blocker, TRAM-34 (1 µM), almost completely suppressed them (Figure 2A,B). SKA-121-induced hyperpolarization responses positively correlated with increase in [Ca2+]i (correlation coefficient, R = 0.81, n = 14). The application of TRAM-34 alone did not elicit any significant changes in the membrane potential in THP-1-derived M2 macrophages, compared with the vehicle control (Figure S1A). Additionally, SKA-121-induced [Ca2+]i increases almost disappeared with the removal of extracellular Ca2+ (Figure S1B). Of the several candidates of Ca2+-permeable channels in macrophages [5,23,24,25], the expression levels of the Orai1, TRPM2, and TRPM7 transcripts were high (Figure S1C).
To examine whether KCa3.1 expression levels are modified during the differentiation of M0 into M2 macrophages, the expression levels of KCa3.1 in THP-1-derived M0 and M2 macrophages were measured using real-time PCR and Western blot assays. Those KCa3.1 transcripts and proteins were almost the same between both groups (n = 4 for each, p > 0.05) (Figure 2C–E). Correspondingly, no significant difference in SKA-121-induced hyperpolarizing responses was found between both groups (p > 0.05) (Figure 2F). In addition, we measured 1 μM SKA-121-activated KCa3.1 currents in THP-1-derived M2 macrophages by whole-cell patch-clamp recordings [26]. Cells were held at −80 mV and 200 msec ramps from −120 to +40 mV were delivered every 10 sec with a rate of 0.8 mV/ms. Figure 3A represents plots of current density versus voltage after the addition of vehicle (black), 1 μM SKA-121 (red), and 1 μM SKA-121 plus 1 μM TRAM-34 (blue). As shown in Figure 3B, SKA-121-sensitive KCa3.1current components showed typical voltage independence and reversal potential of −71.9 ± 5.8 mV (n = 9). Outward currents at +40 mV were significantly increased by the addition of 1 μM SKA-121 (n = 9, p < 0.05 vs. vehicle control), and SKA-121-activated current components were reduced by the application of 1 μM TRAM-34 (n = 9, p < 0.01 vs. SKA-121-treated group) (Figure 3C).

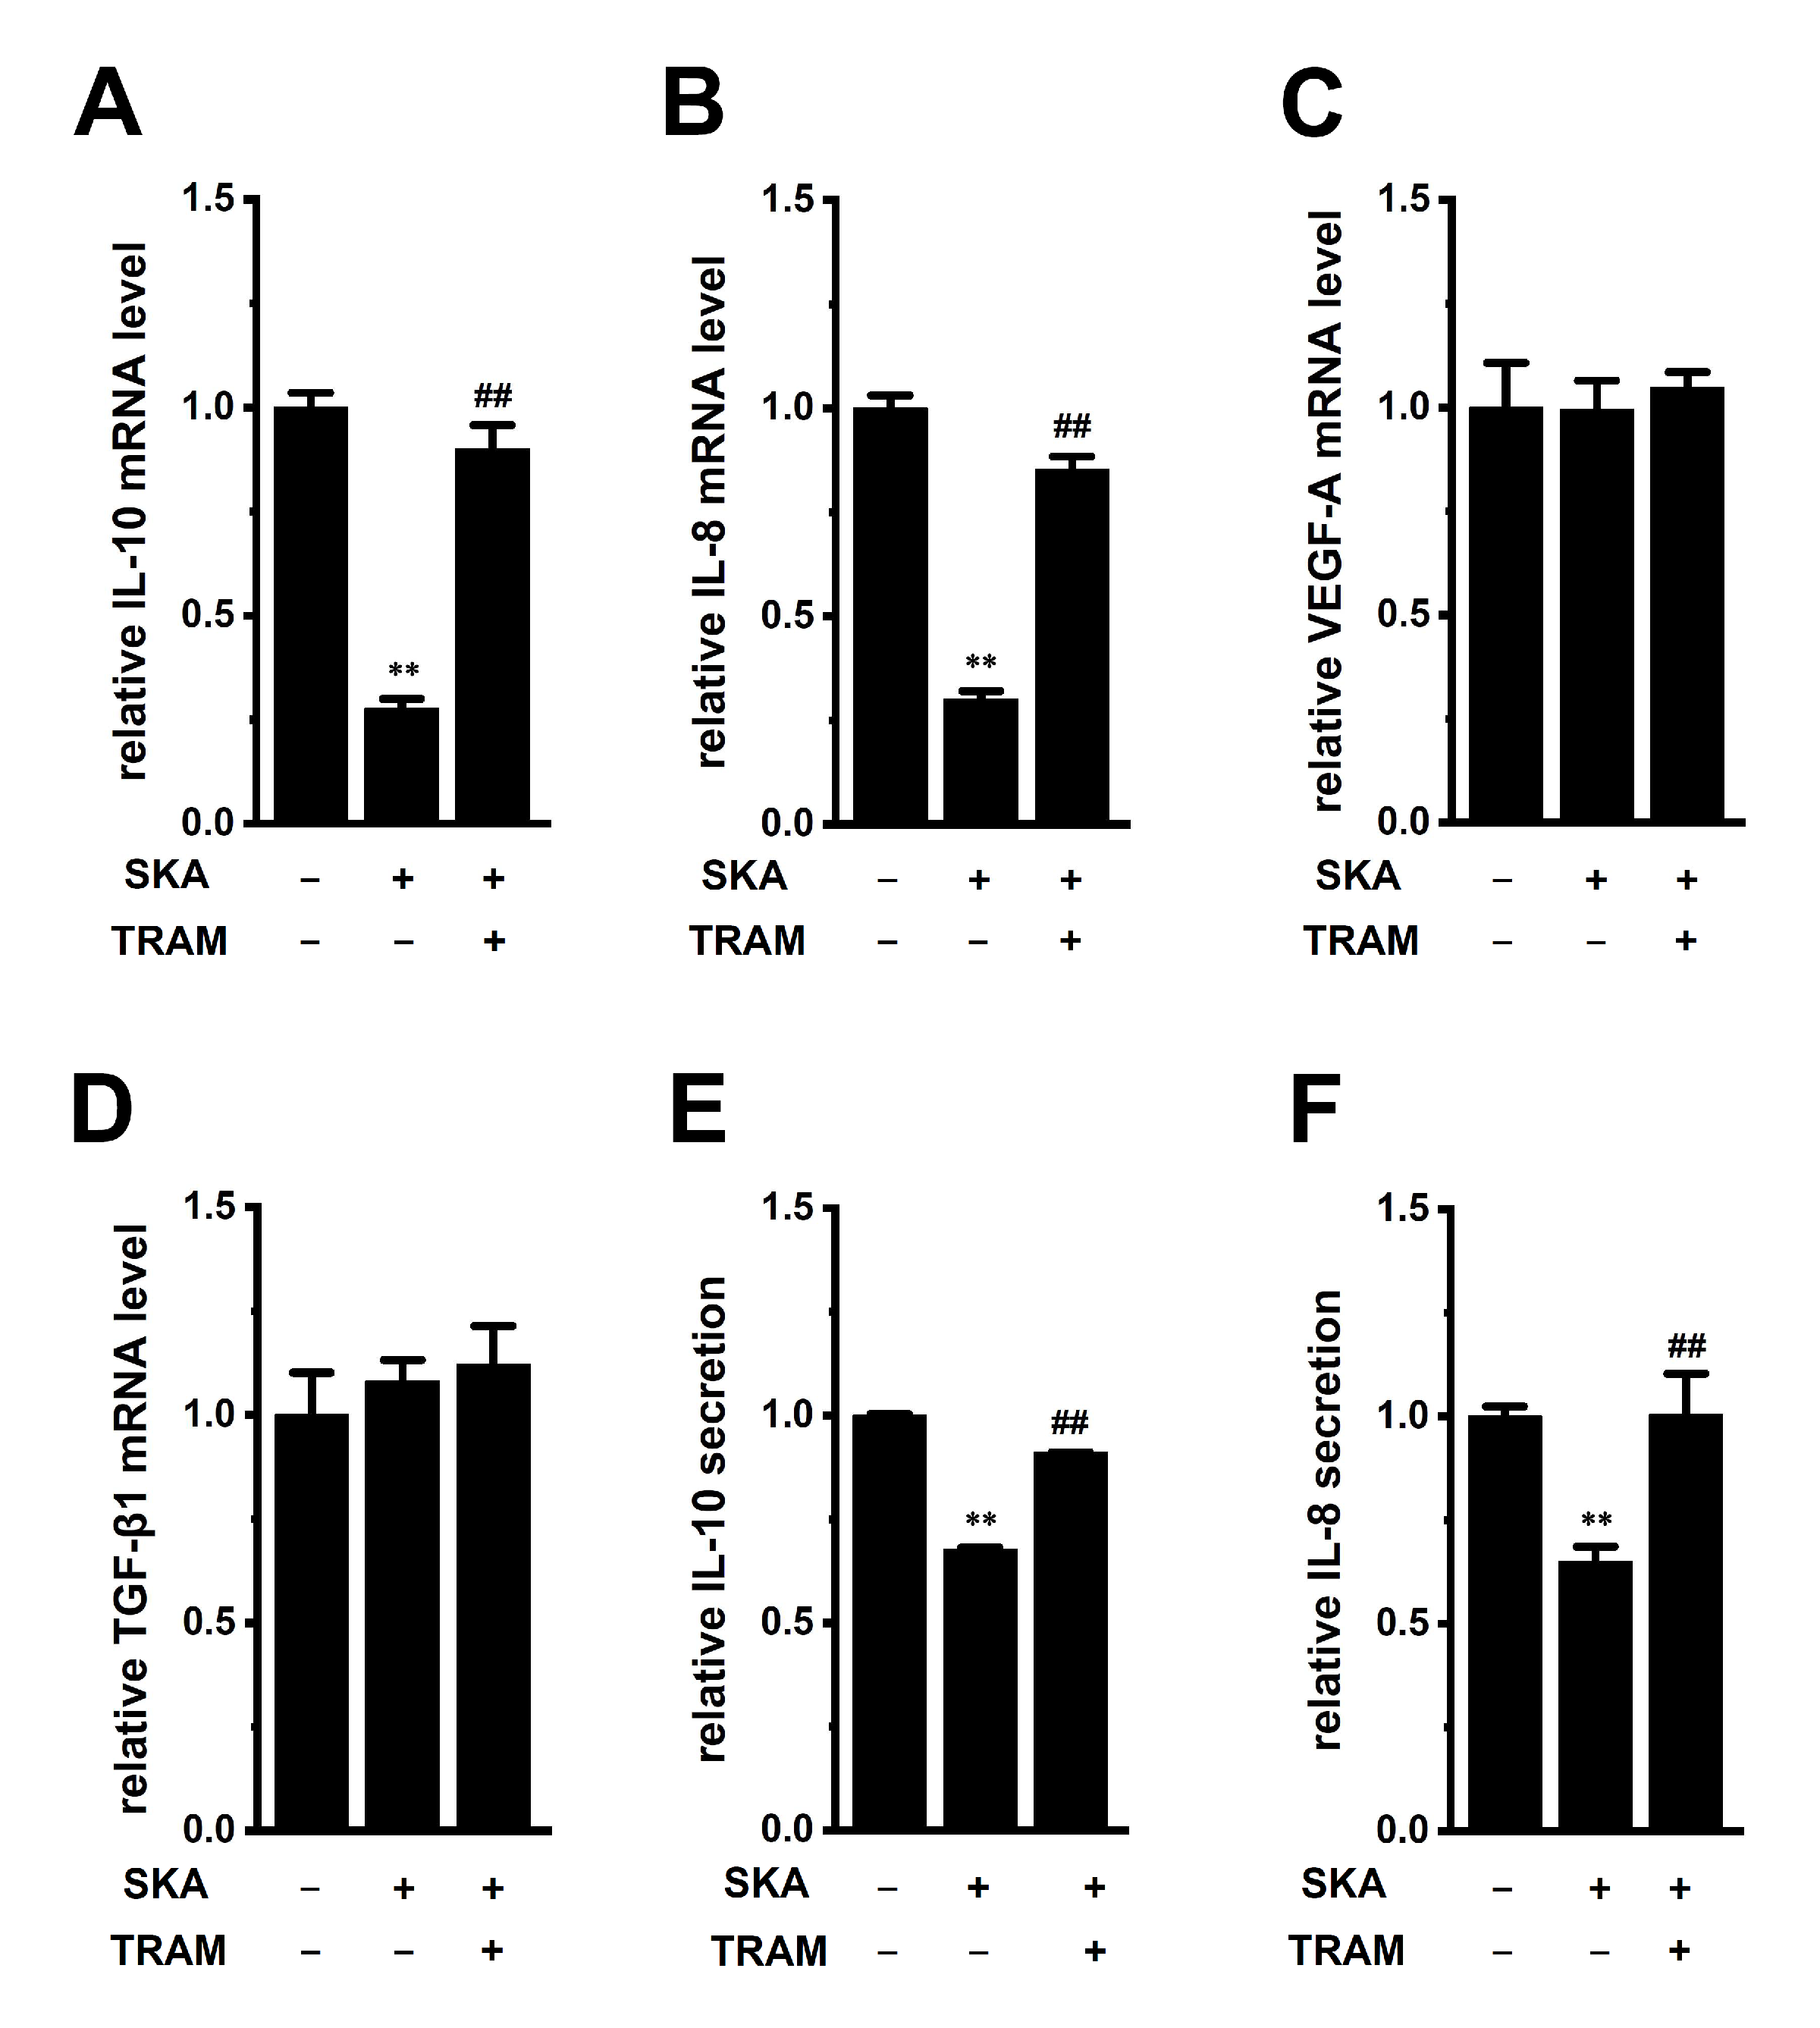
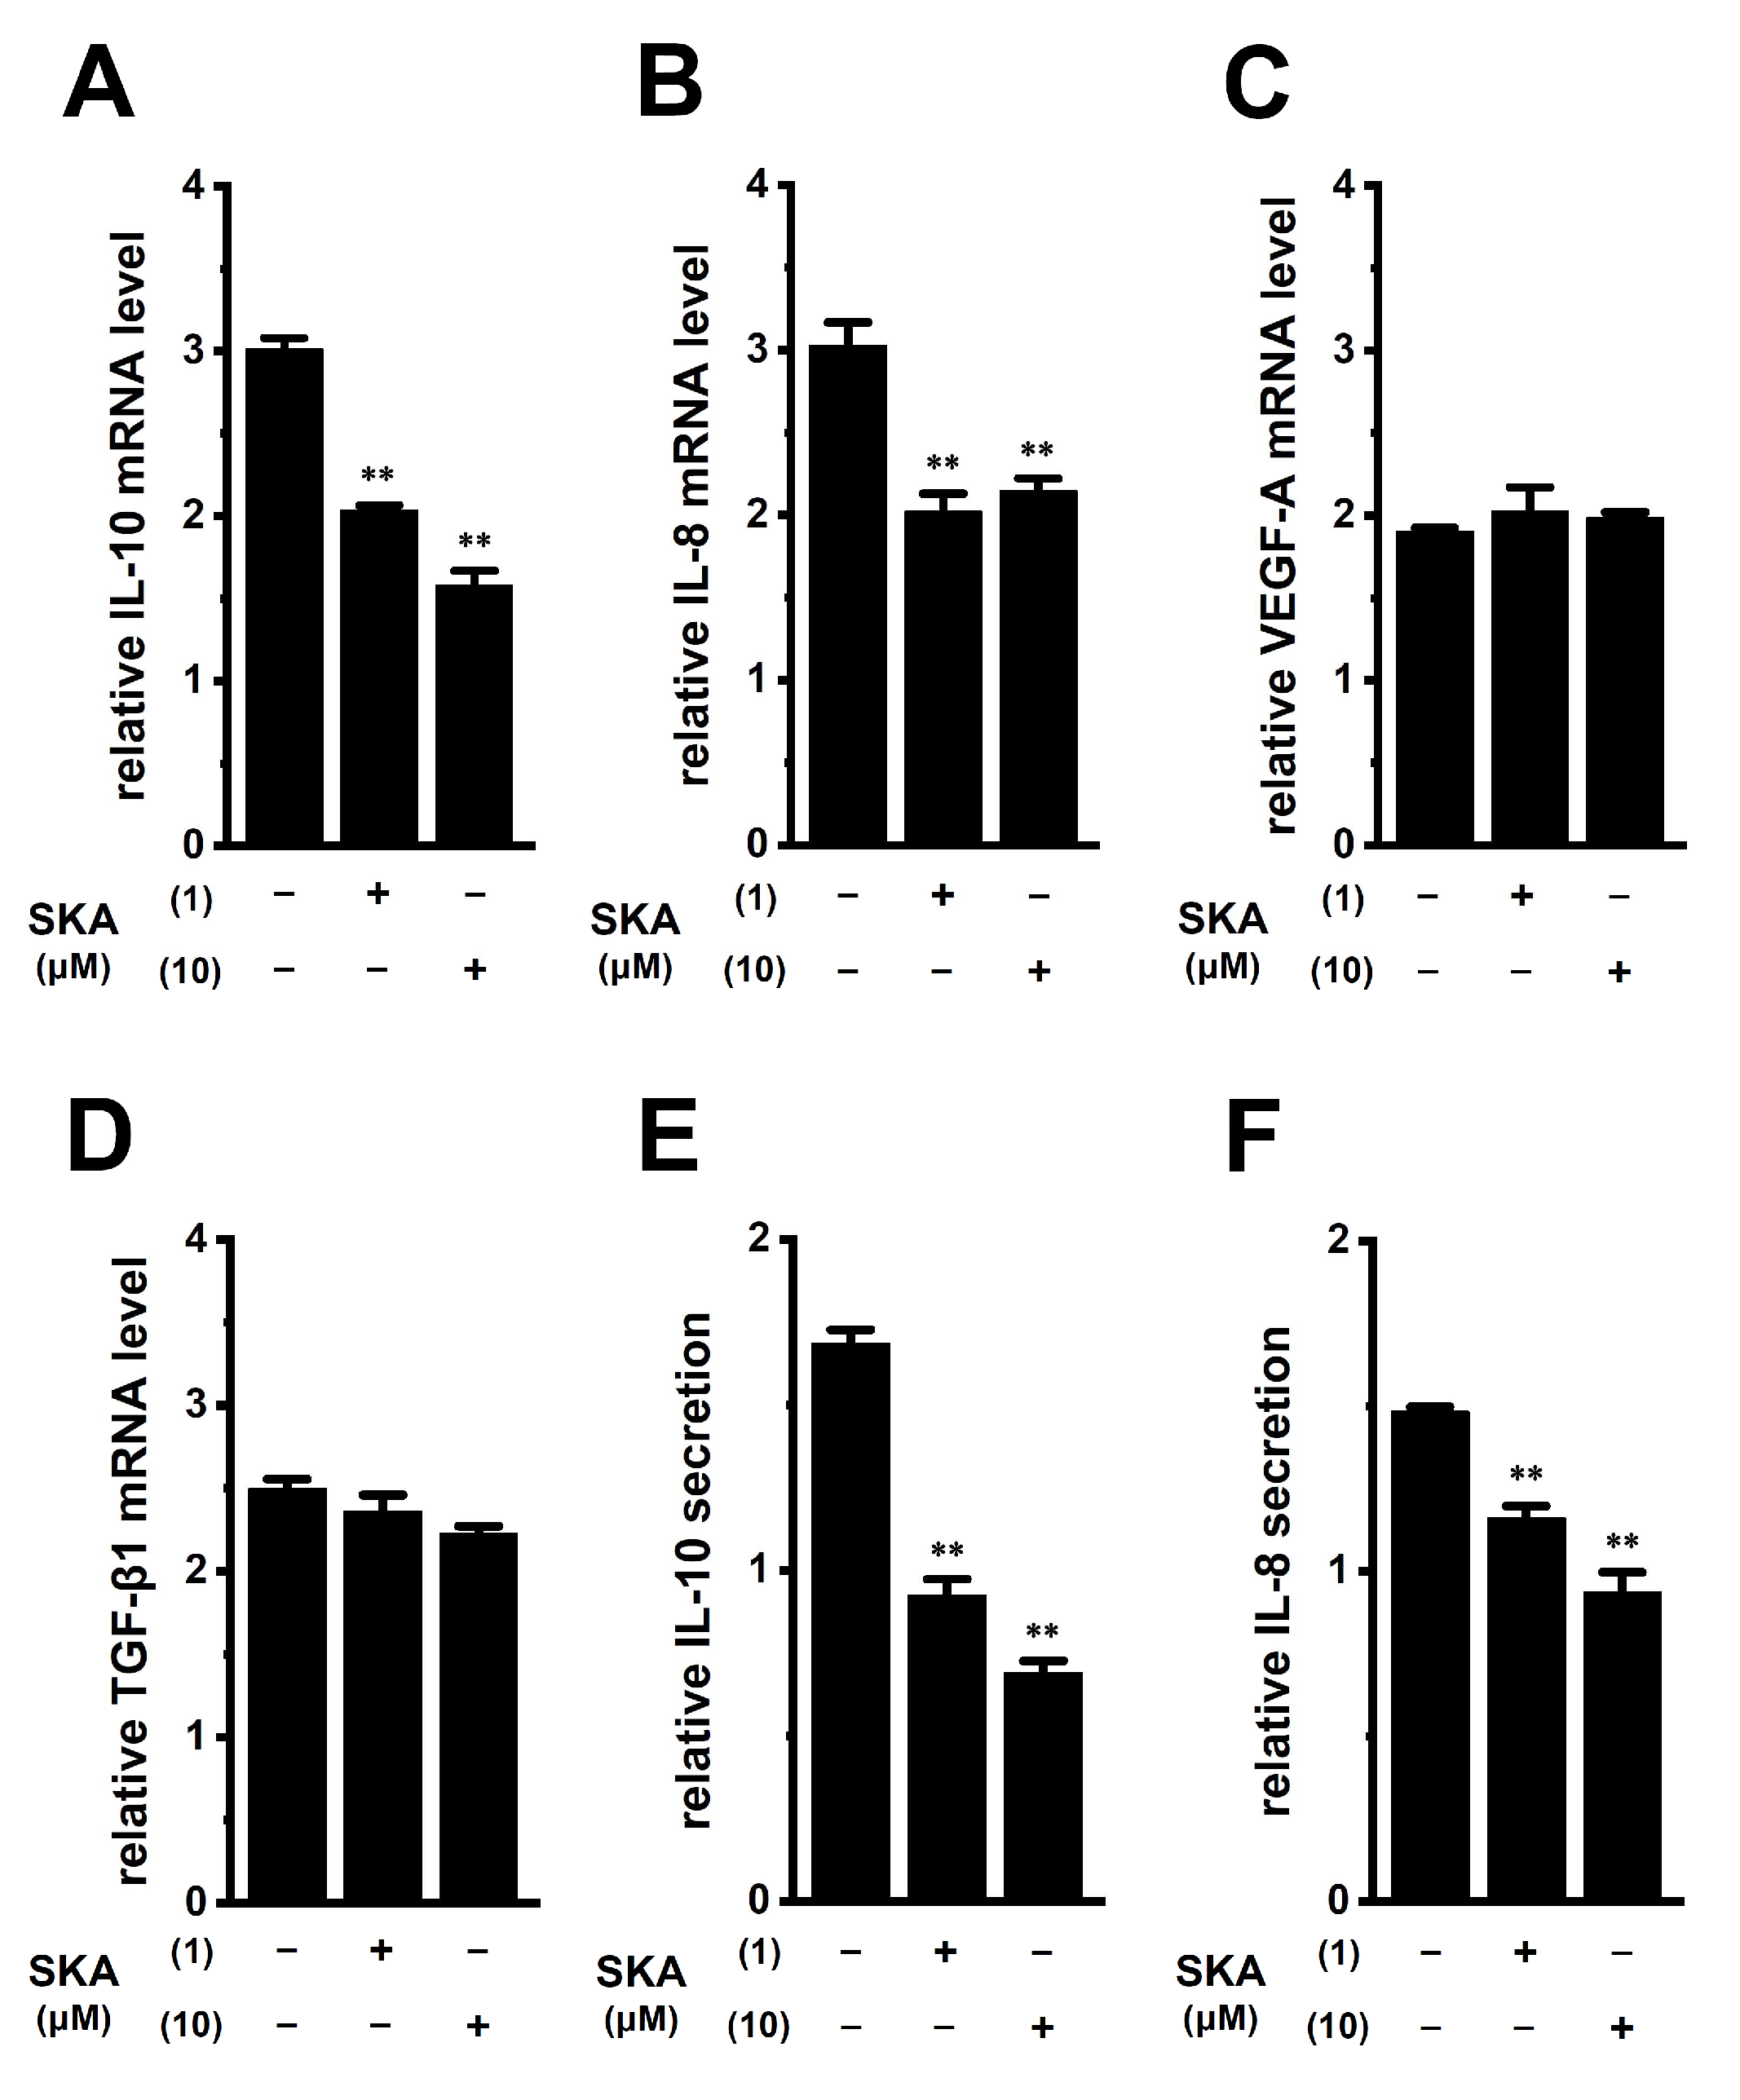
2.3. Downregulation of IL-10 and IL-8 by the Treatment with SKA-121 in THP-1-Derived M2 Macrophages

We previously reported that the activation of KCa3.1 with SKA-31 suppressed IL-10 expression and production in human T-cell lymphoma HuT-78 cells [27]. In this study, we examined the effects of treatment with SKA-121 (1 μM) for 24 h on the expression of IL-10, IL-8, VEGF-A, and TGF-β1 in THP-1-derived M2 macrophages (Figure 4). The expression levels of IL-10 and IL-8 transcripts were significantly suppressed by the SKA-121 treatment (n = 4 for each, p < 0.01), and simultaneous treatment with the KCa3.1 blocker, TRAM-34 (10 μM), reversed this downregulation (Figure 4A,B). TRAM-34 alone did not elicit significant changes in the transcription of IL-10 and IL-8 (Figure S1D,E). On the other hand, the expression of VEGF-A and TGF-β1 was not affected by the SKA-121 treatment (n = 4 for each, p > 0.05) (Figure 4C,D). Consistent with the results shown in Figure 4A,B, the secretion of IL-10 and IL-8 was decreased by the SKA-121 treatment (n = 4 for each, p < 0.01) (Figure 4E,F). These suggest that the KCa3.1 activator suppressed the immunosuppressive and pro-tumorigenic functions of TAMs by repressing the transcription of IL-10 and IL-8.

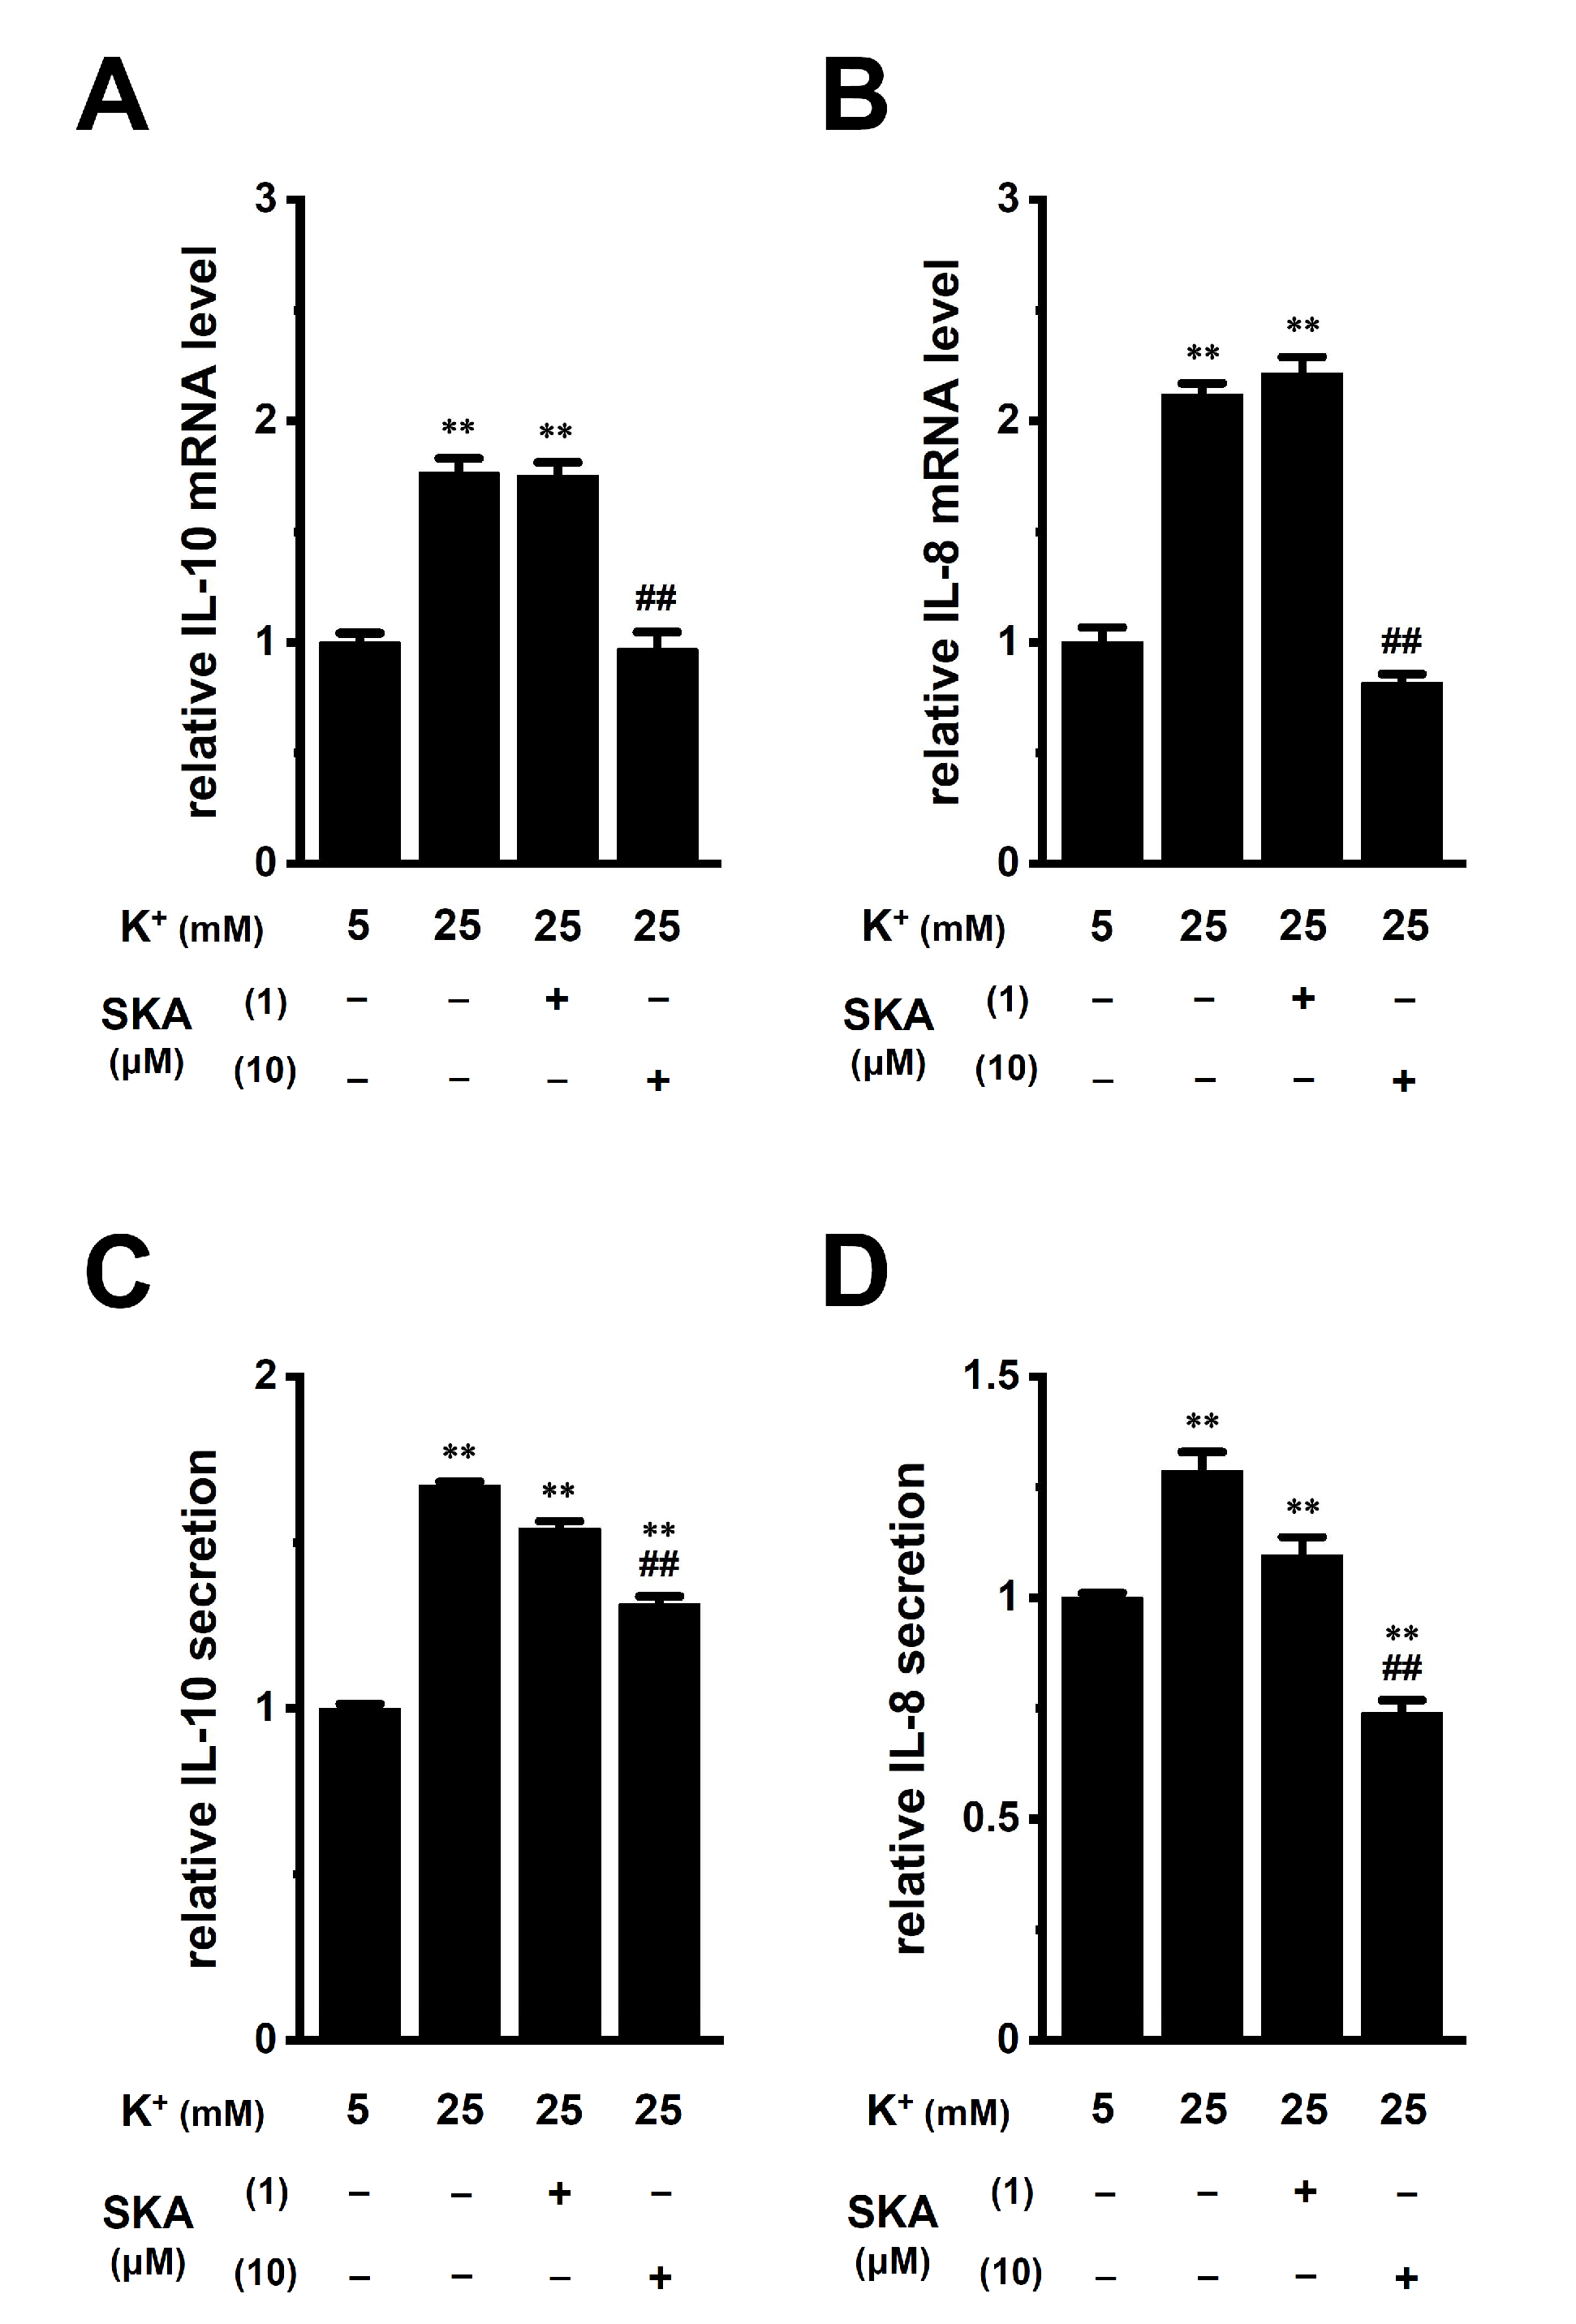
2.4. Reversal Effects of Treatment with SKA-121 on High K+ Level-Induced Increases in IL-10 and IL-8 in THP-1-Derived M2 Macrophages

In a hypoxic TME, K+ released from necrotic cancer cells accumulates in the extracellular compartments [9]. An in vivo K+ imaging analysis by Tan et al. (2020) showed that K+ levels were elevated in the TME, with an average concentration of approximately 29 mM [28]. The concentration of K+ was 5 mM in the RPMI 1640 medium used in this study. Media with high K+ (final concentration: 25 mM) were prepared by KCl supplementation. Real-time PCR and ELISA assays showed the increased transcriptional expression (n = 4 for each, p < 0.01) (Figure 5A,B) and secretion (n = 4 for each, p < 0.01) (Figure 5C,D) of IL-10 and IL-8 in THP-1-derived M2 macrophages exposed to high [K+]e (25 mM). Supplementation with 20 mM NaCl instead of 20 mM KCl did not affect their expression (n = 4 for each, p > 0.05); however, 10 mM K2HPO4 showed a similar effect to 20 mM KCl supplementation (n = 4 for each, p < 0.01) (Figure S2A,B).
We then investigated the effects of a 24 h treatment with SKA-121 on high [K+]e-induced increases in IL-8 and IL-10 in THP-1-derived M2 macrophages. High [K+]e-induced increases in the expression (Figure 5A,B) and secretion (Figure 5C,D) of IL-8 and IL-10 were not affected by simultaneous treatment with 1 μM SKA-121 (n = 4 for each, p > 0.05); however, was significantly reduced by simultaneous treatment with 10 μM SKA-121 (n = 4 for each, p < 0.01) (Figure 5). Neither the 24 h treatment with SKA-121 nor the exposure to high [K+]e altered the viability of THP-1-derived M2 macrophages (n = 5 for each, p > 0.05) (Figure S2C,D). These results demonstrated that the KCa3.1 activator might suppress the overexpression of IL-10 and IL-8 in TAMs caused by increases in [K+]e in the TME.

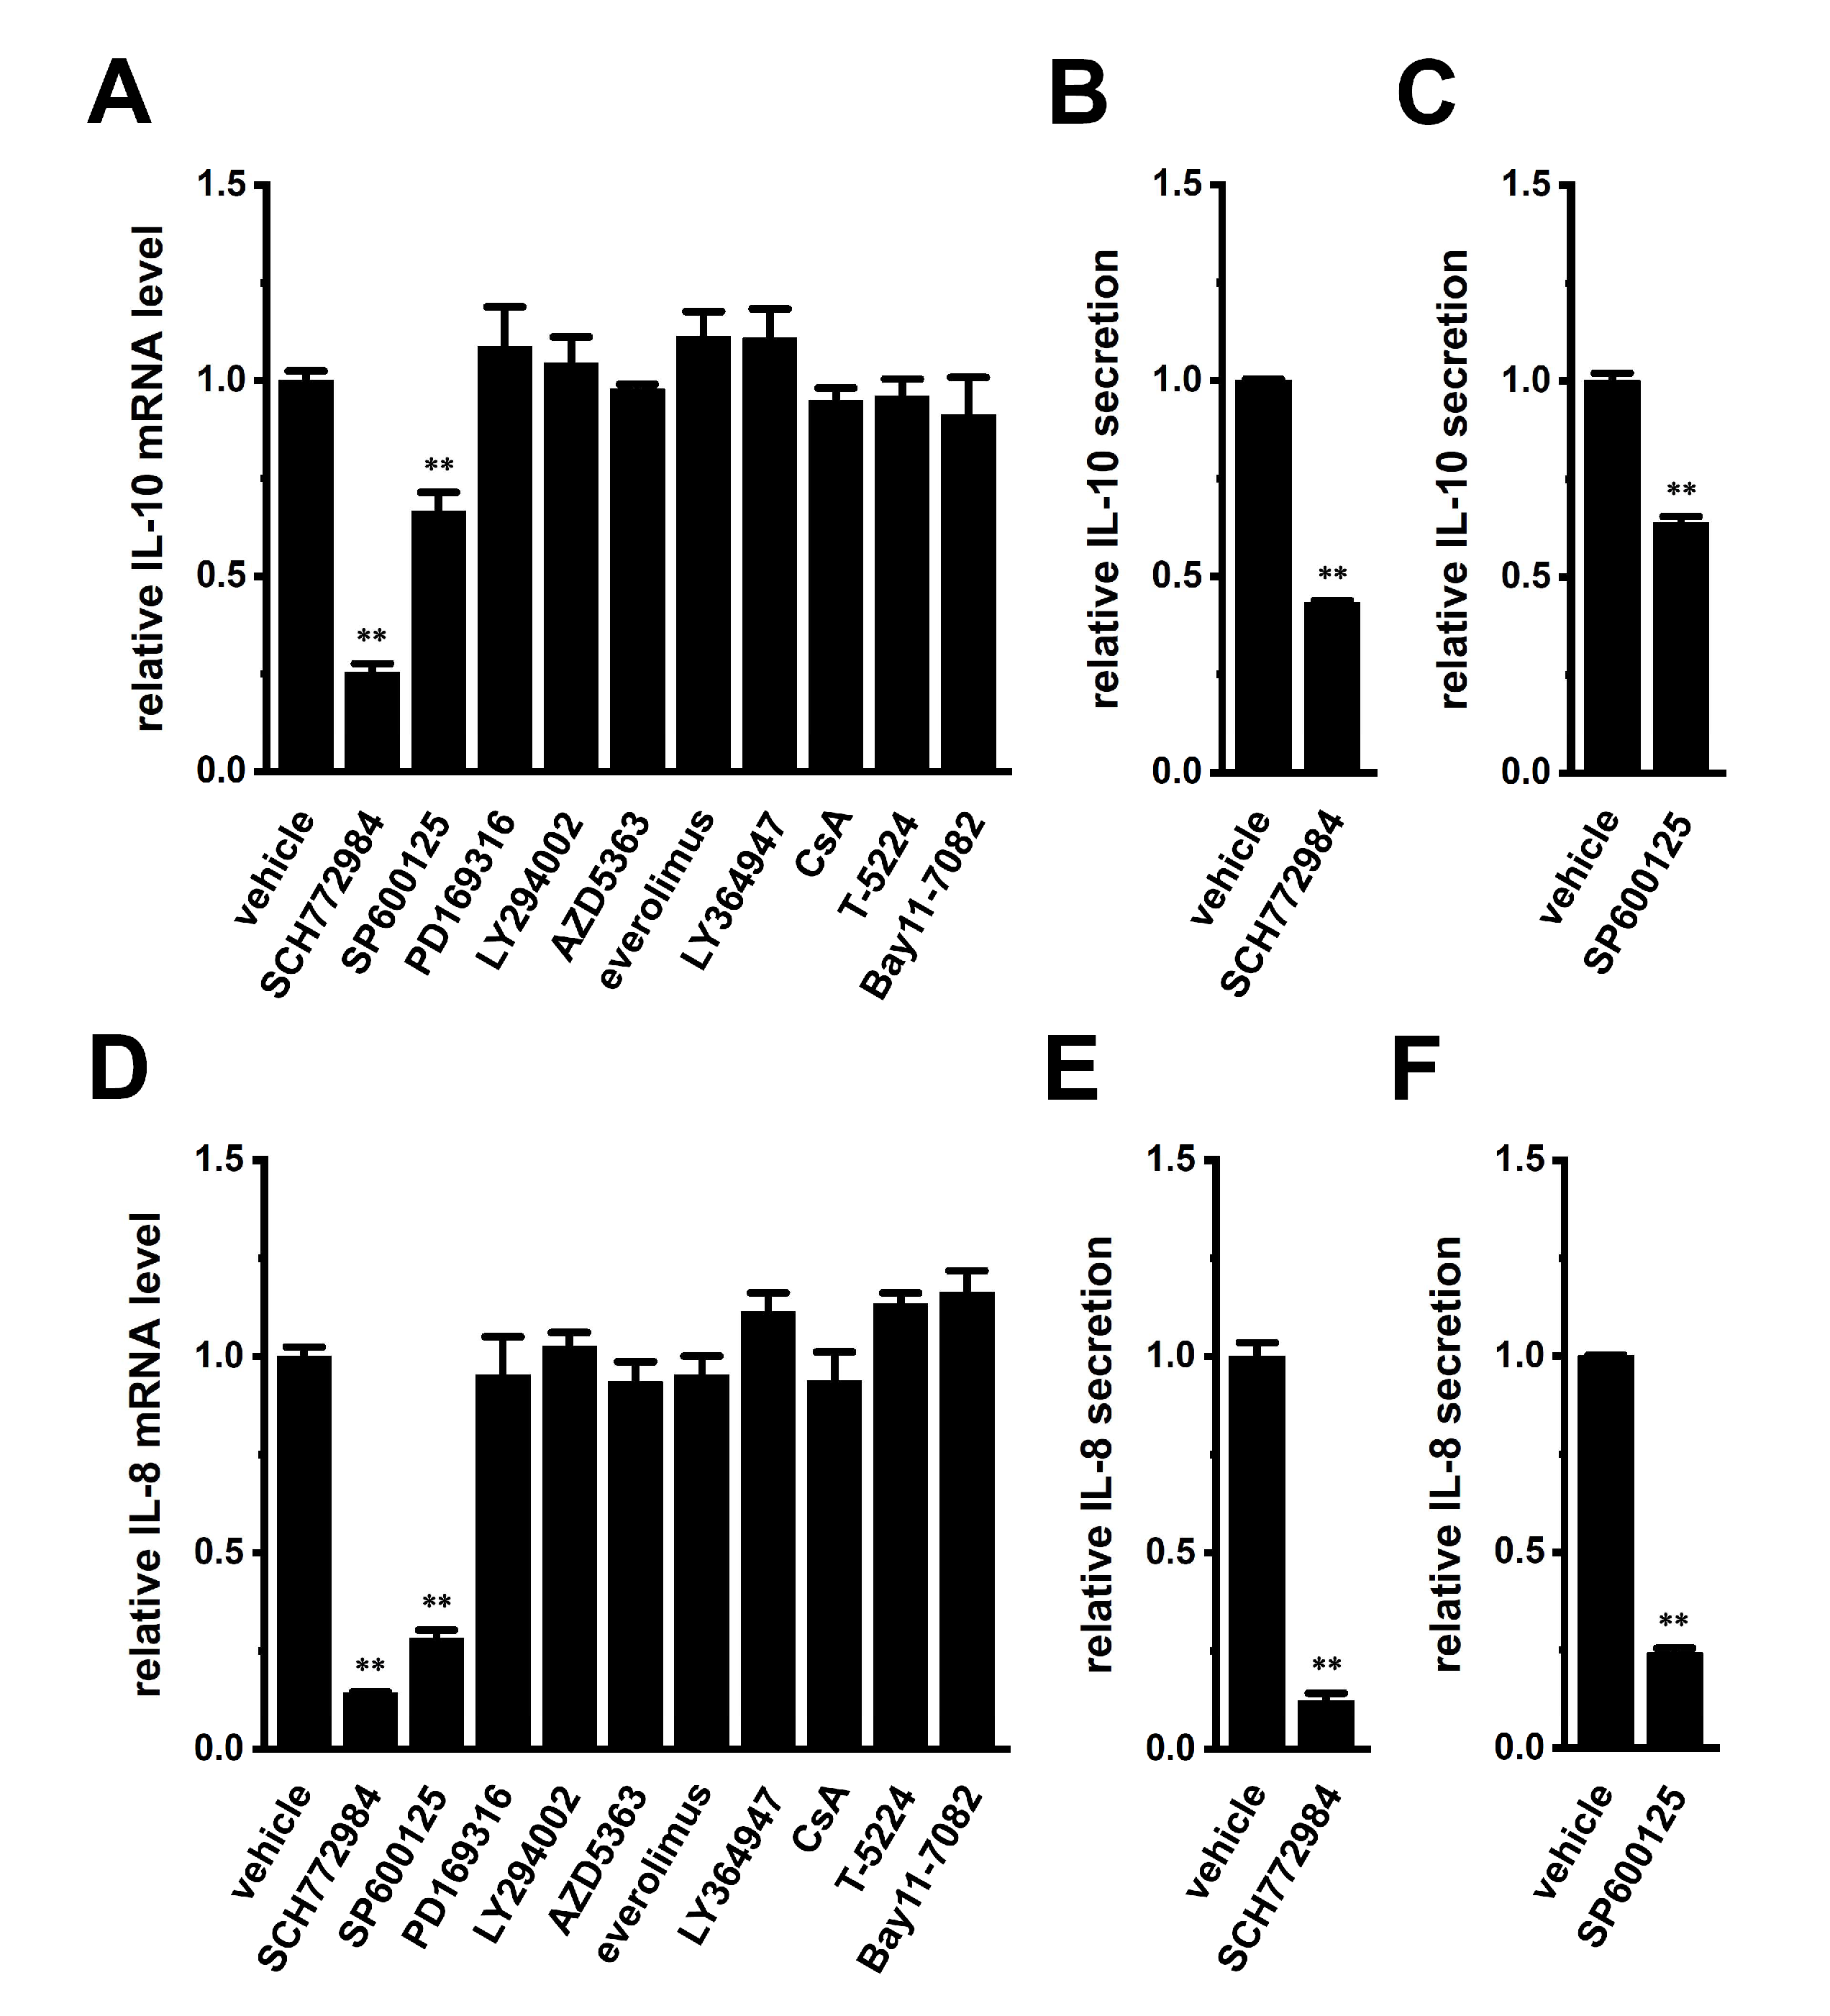
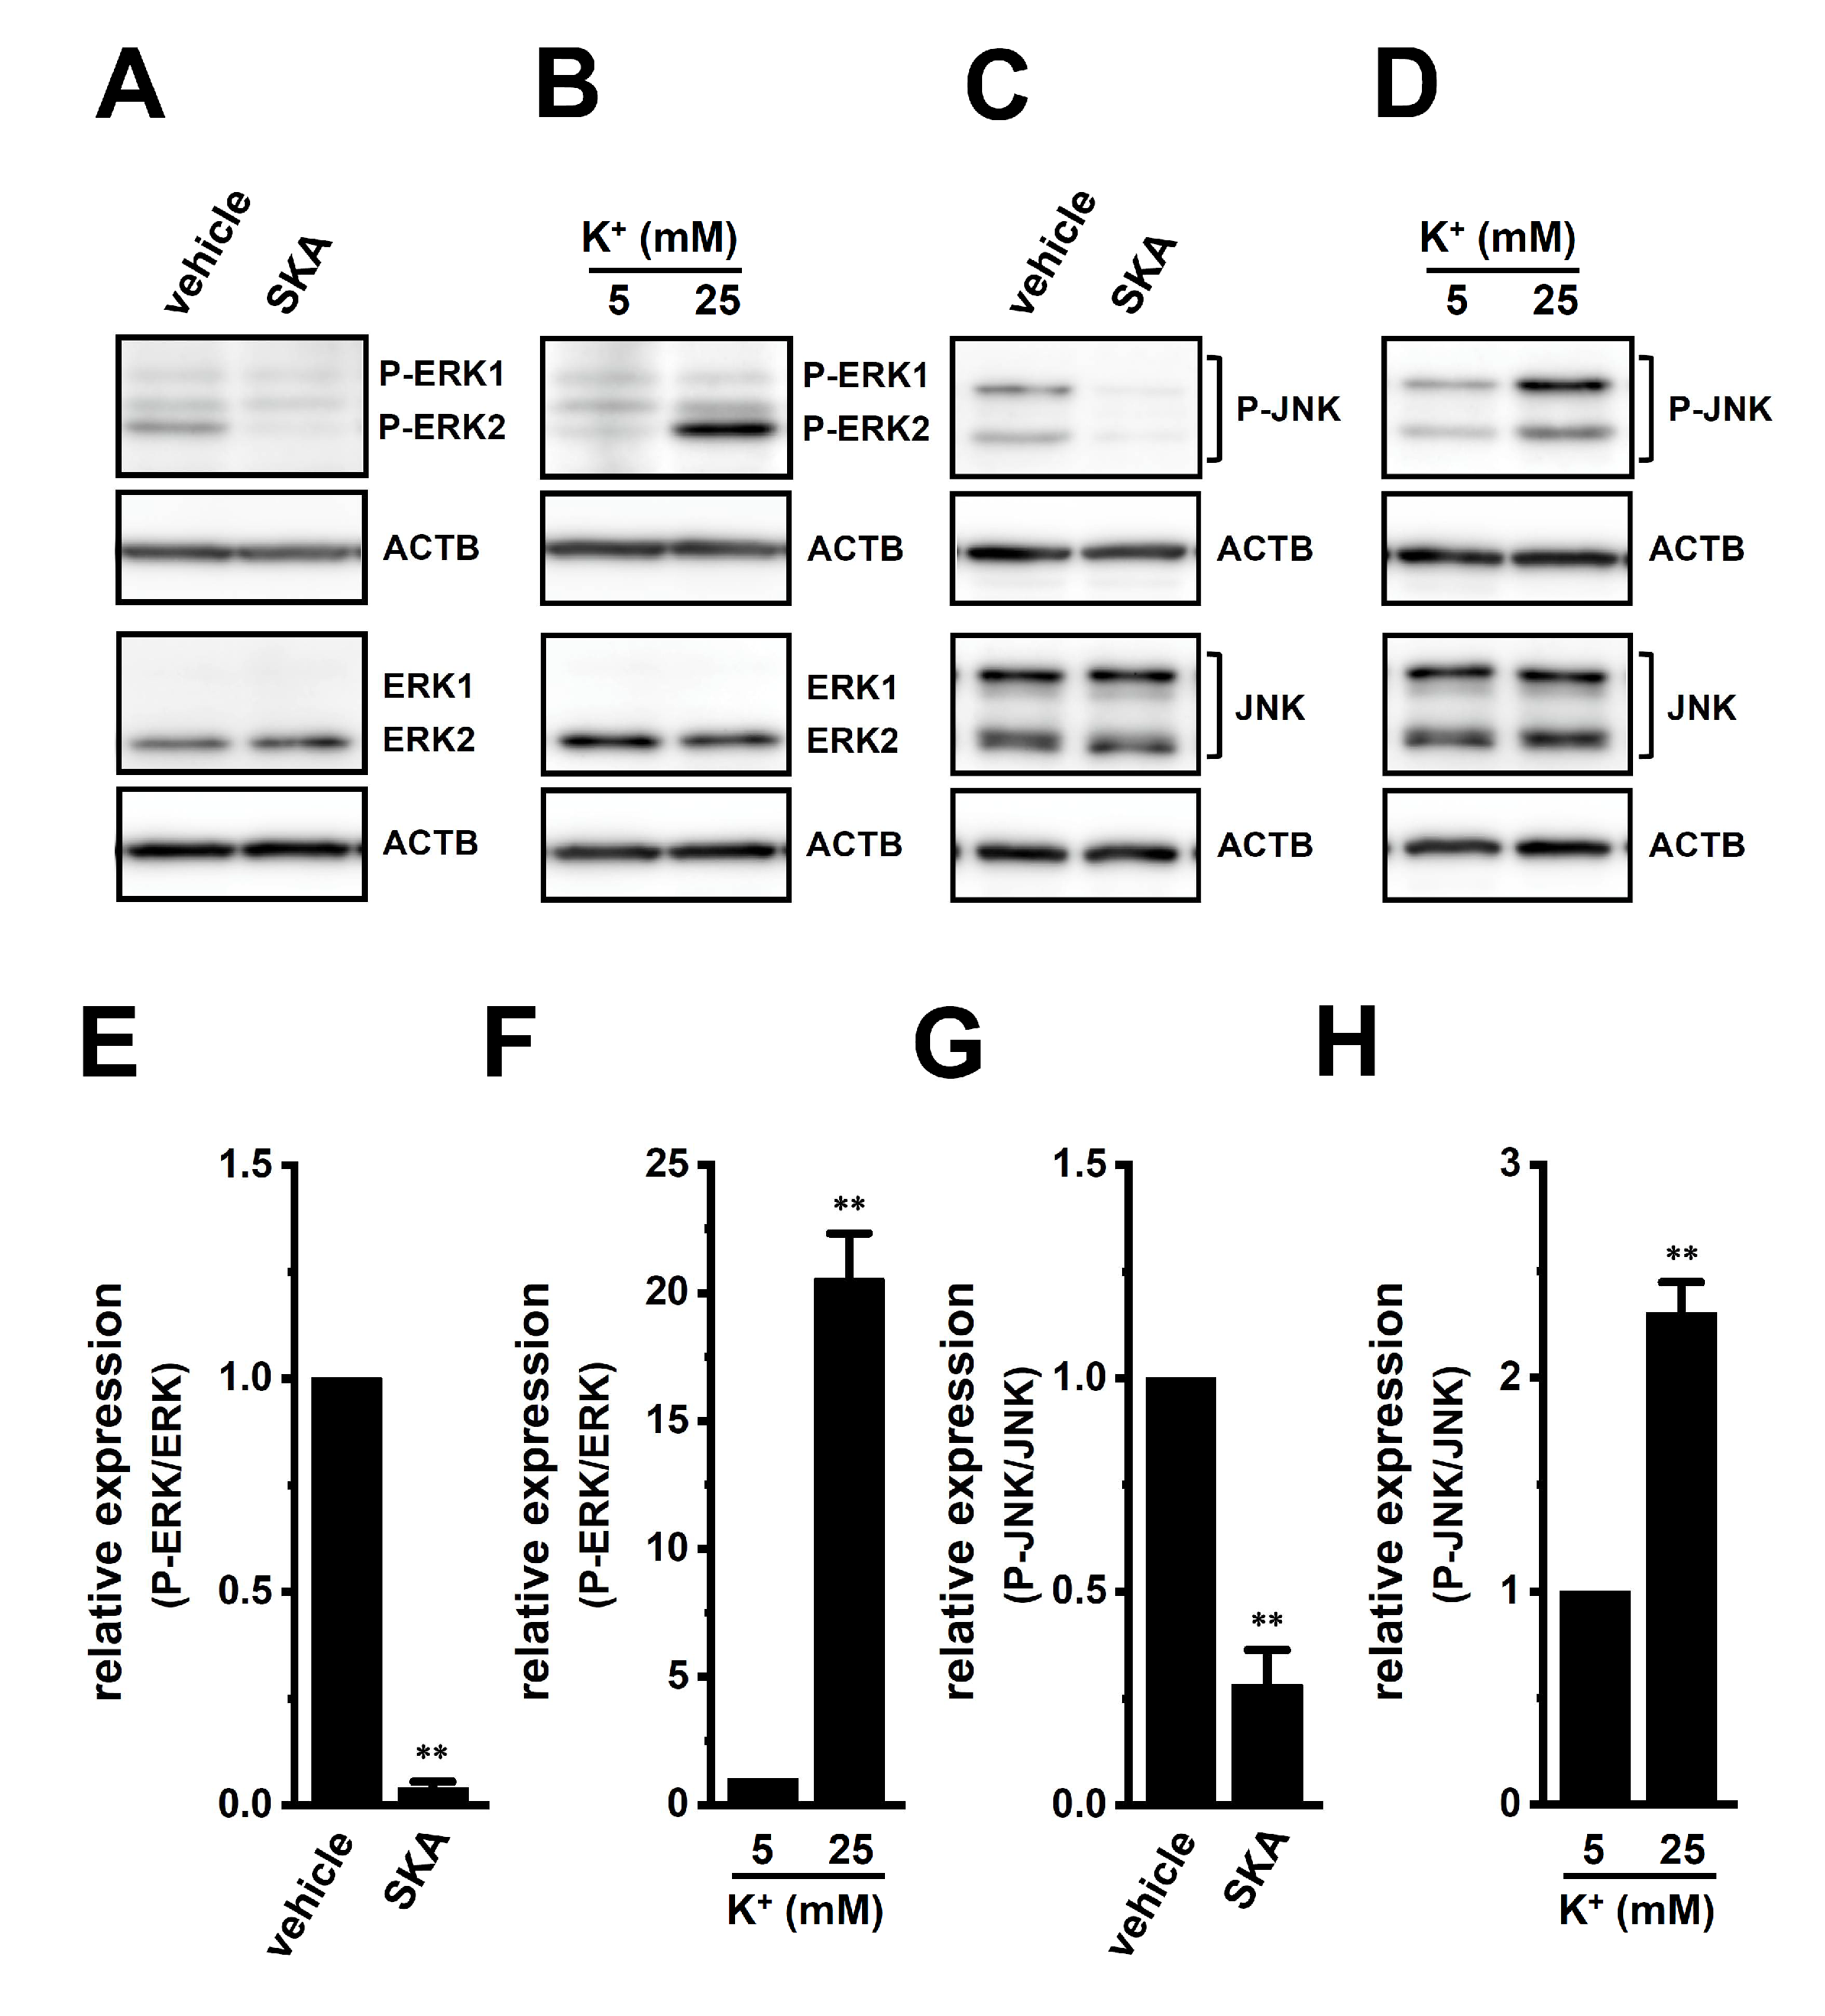
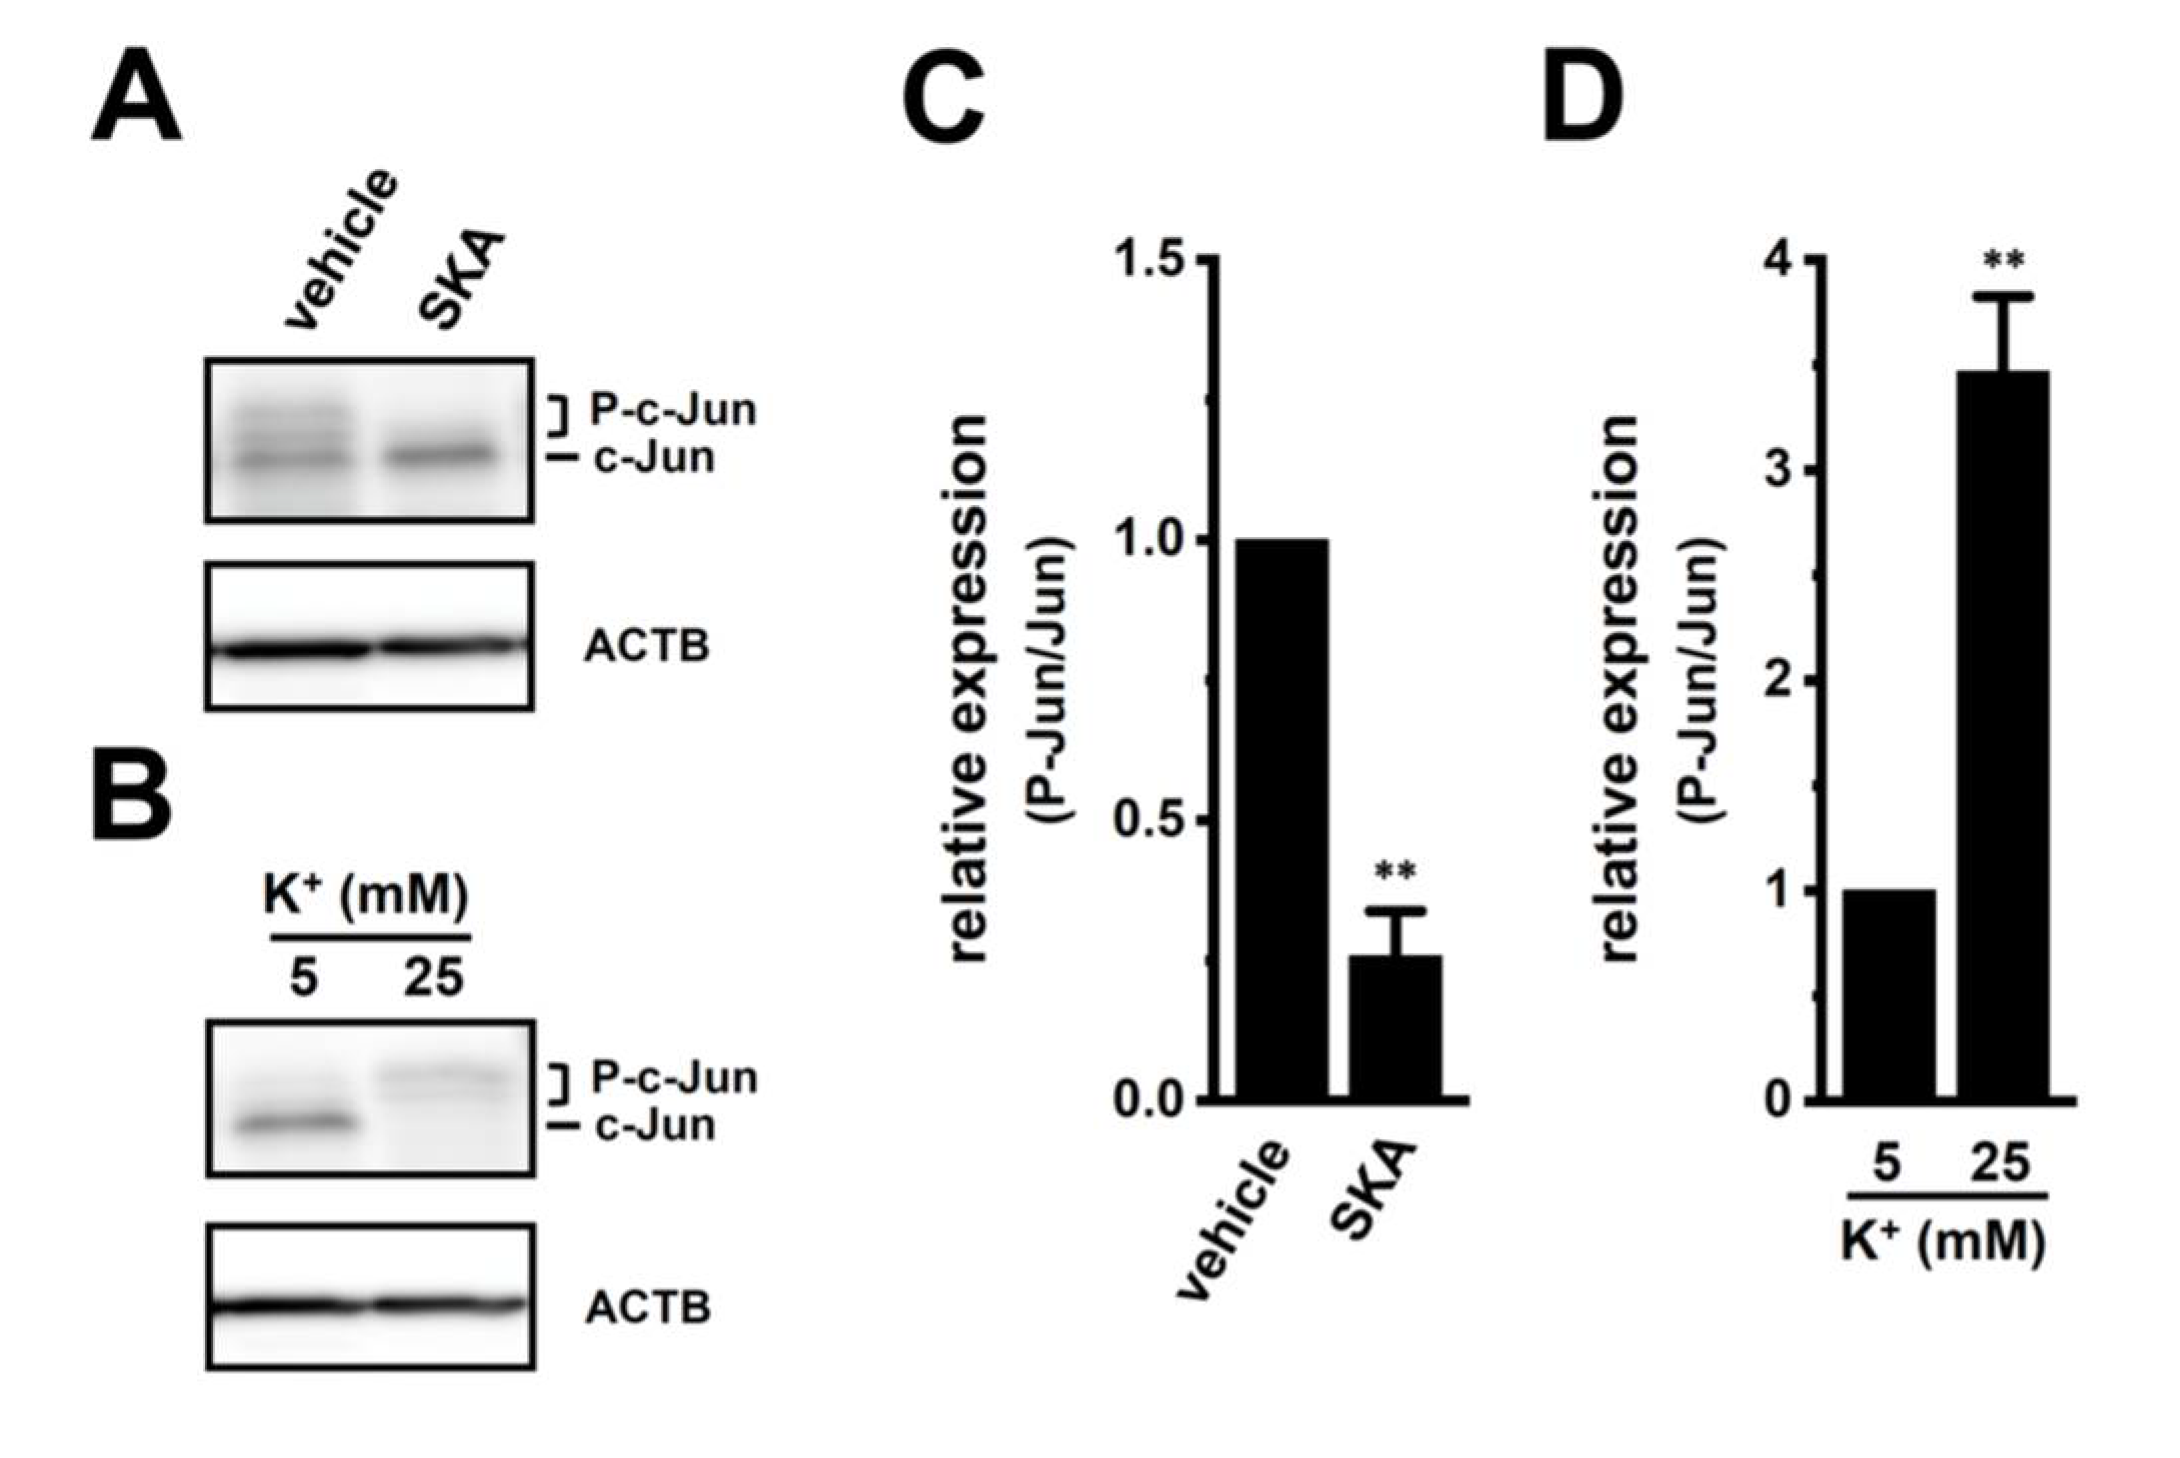
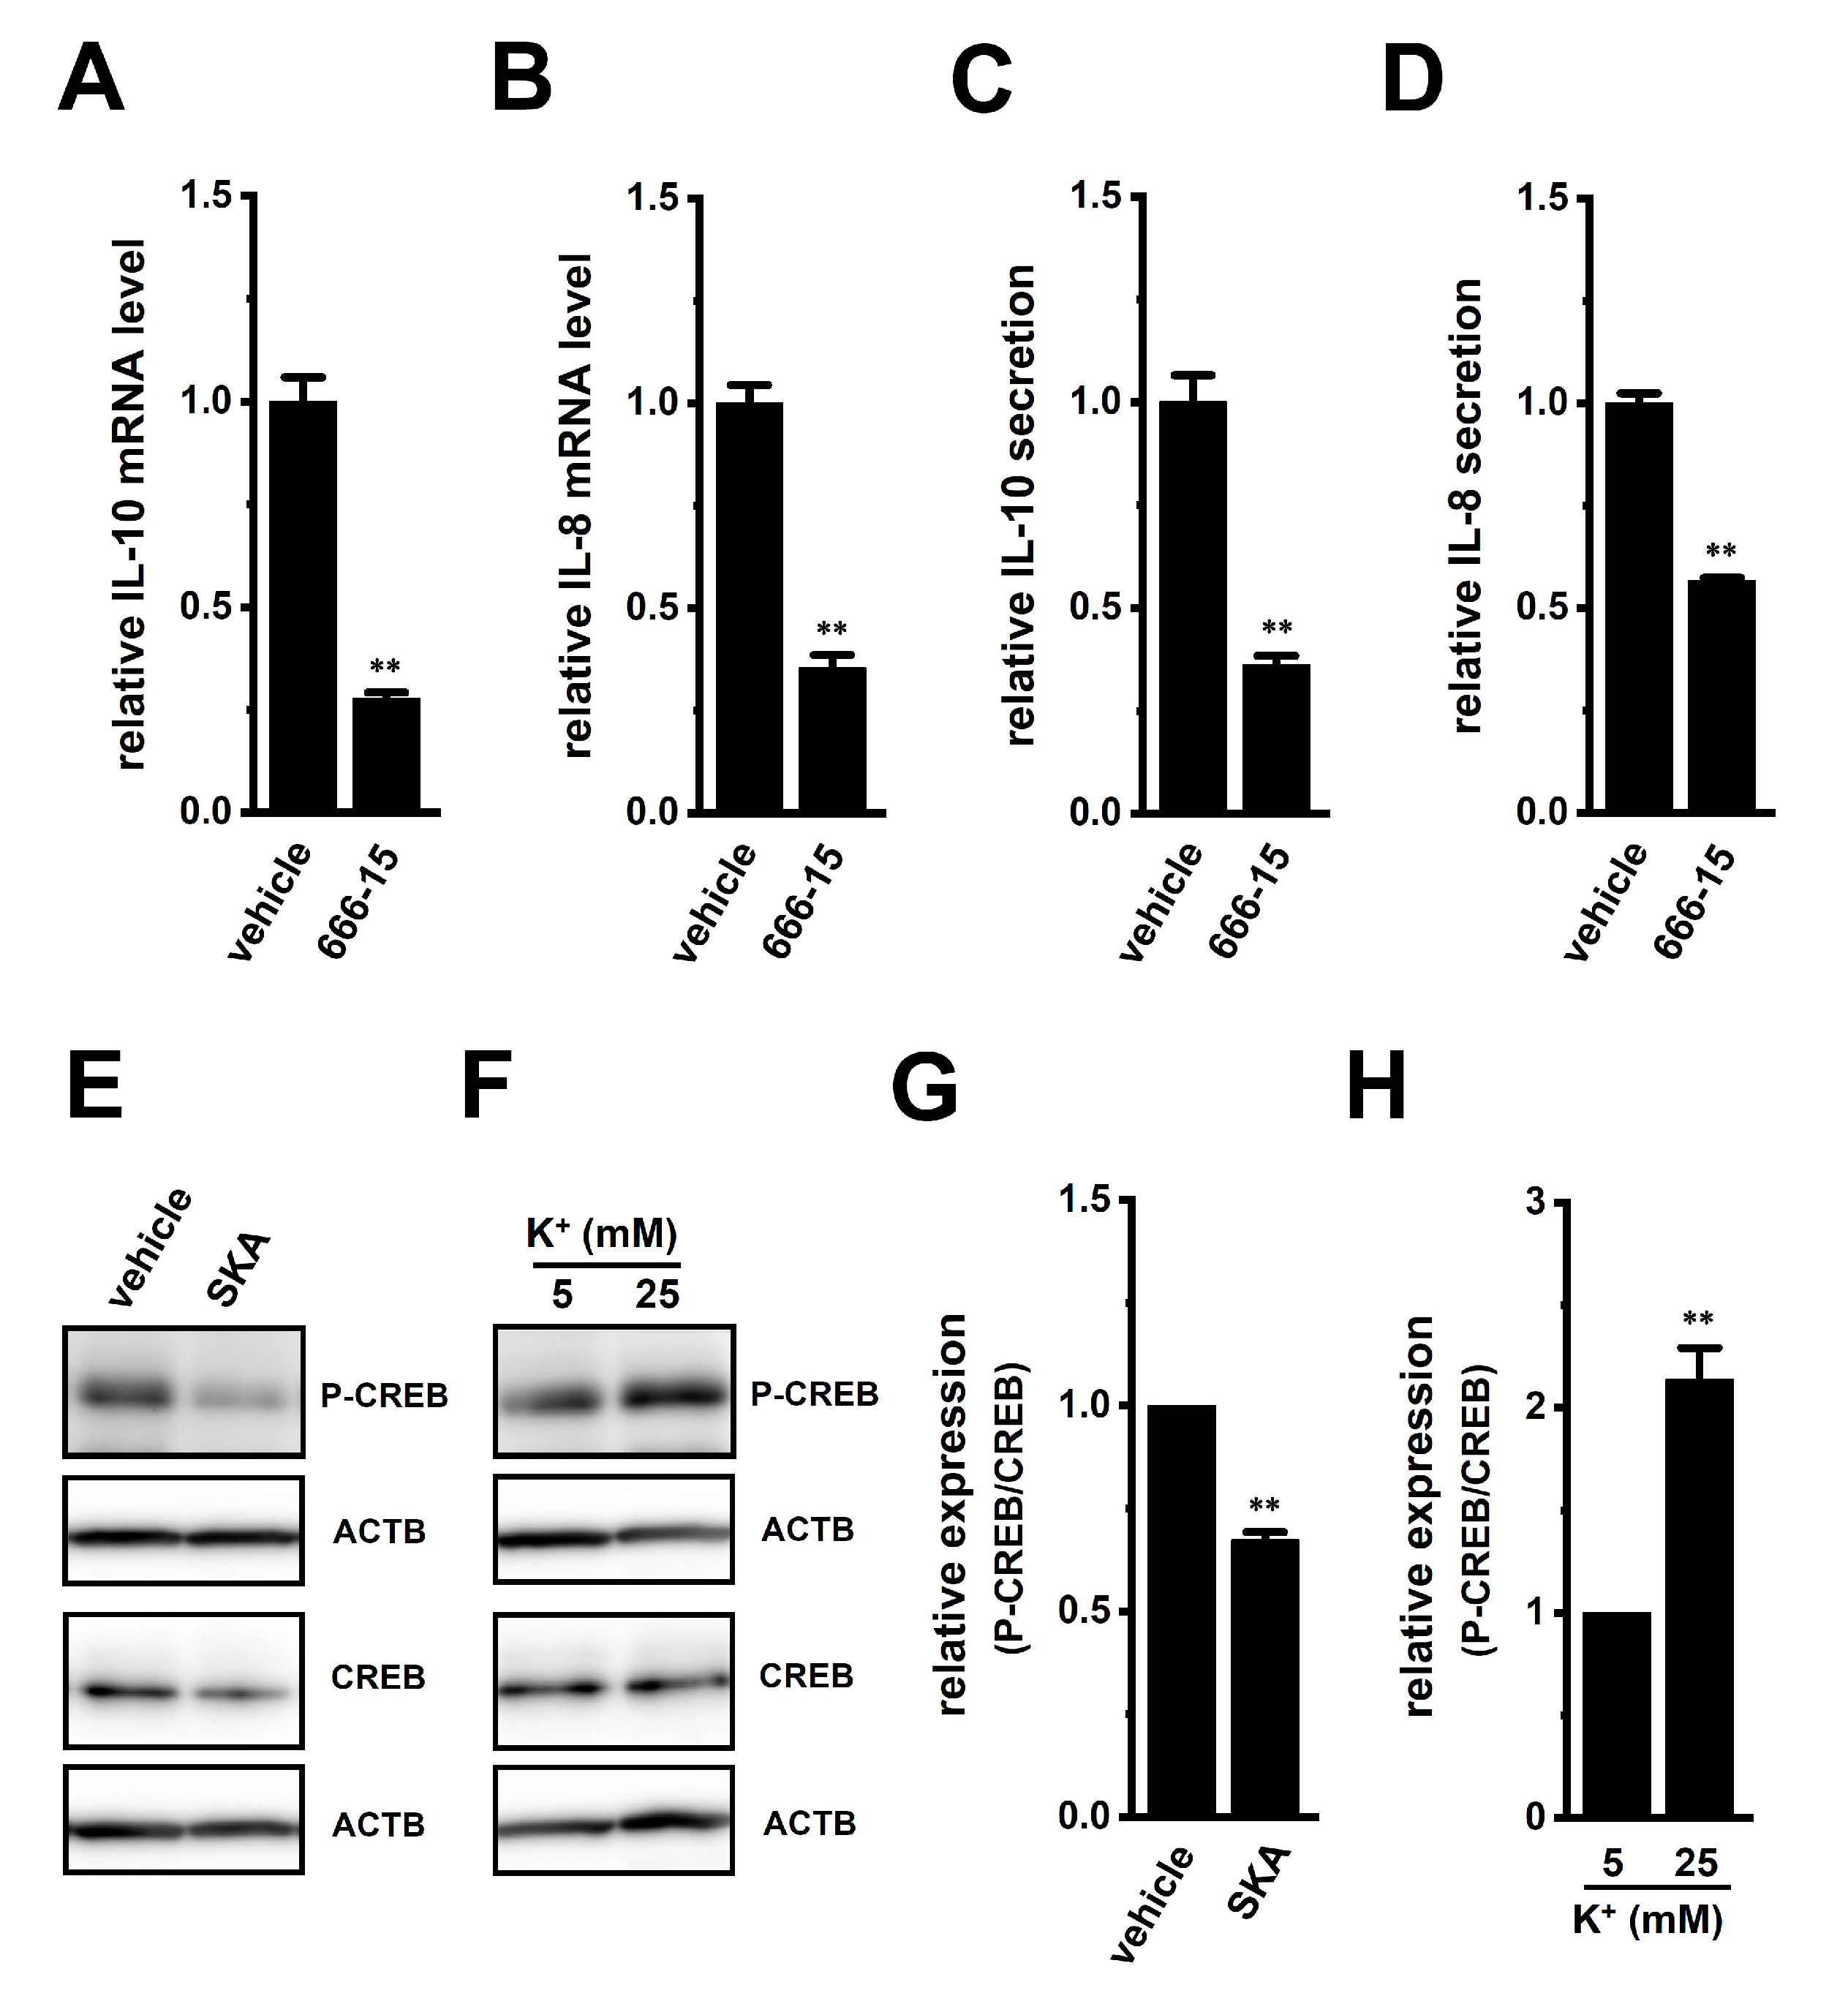
2.5. Involvement of ERK-CREB and/or JNK-c-Jun Cascades in the Transcriptional Repression of IL-10 and IL-8 in THP-1-Derived M2 Macrophages

Previous studies demonstrated that the following signaling pathways regulated the expression of IL-8 and IL-10: ERK/JNK/p38 mitogen-activated protein kinase (MAPK), PI3K/AKT/mTOR (mammalian target of rapamycin), NF–κB, and calcineurin/NFAT [29,30,31,32]. Among the 10 signaling pathway inhibitors examined, a 24 h treatment with the ERK1/2 inhibitor, SCH772984 (1 μM) markedly suppressed the expression levels of both IL-10 and IL-8 transcripts in THP-1-derived M2 macrophages (Figure 6A,D), which corresponded to reductions in their secretion by SCH772984 (Figure 6B,E). Additionally, treatment with the JNK inhibitor, SP600125 (10 μM), repressed the expression levels of both IL-10 and IL-8 transcripts (Figure 6A,D), which corresponded to decreases in their secretion by SP600125 (Figure 6C,F).
We then examined the effects of treatment with SKA-121 and exposure to high [K+]e on phosphorylated ERK1/2 (P-ERK1/2), phosphorylated JNK (P-JNK), and phosphorylated c-Jun (P-c-Jun) levels in THP-1-derived M2 macrophages by Western blotting (Figure 7 and Figure 8). The ratio of P-ERK2 to total ERK2 in THP-1-derived M2 macrophages was decreased by the treatment with 1 μM SKA-121 (n = 4, p < 0.01) (Figure 7A,E), but was increased by the exposure to high [K+]e (25 mM) (n = 4, p < 0.01) (Figure 7B,F). The very low intensity of the weak band signals for P-ERK1 and total ERK1 was observed. Additionally, the ratio of P-JNK to total JNK in THP-1-derived M2 macrophages was decreased by the SKA-121 treatment (n = 4, p < 0.01) (Figure 7C,G), but was increased by the exposure to high [K+]e (n = 4, p < 0.01) (Figure 7D,H). Similarly, the ratio of P-c-Jun to total c-Jun was decreased by the SKA-121 treatment (n = 4, p < 0.01) (Figure 8A,C), but was increased by the exposure to high [K+]e (n = 4, p < 0.01) (Figure 8B,D). These results suggested that the ERK and JNK-c-Jun signaling pathways might be, at least partly, mediated by the KCa3.1 activation-induced transcriptional repression of IL-10 and/or IL-8 in THP-1-derived M2 macrophages.
Several transcription factors (i.e., CREB, AP-1, and/or NF–κB) that bind to the promoters of the IL-8 and IL-10 genes have been identified to date; however, the ERK1/2-CREB pathway is a candidate that is commonly associated with the transcription of IL-8 and IL-10 [19,20]. We, therefore, examined the effects of the potent and selective CREB inhibitor, 666-15 (1 μM), on the expression levels of IL-10 and IL-8 transcripts in THP-1-derived M2 macrophages (Figure 9). The expression and secretion of IL-10 and IL-8 were significantly decreased by the 24 h treatment with 666-15 (Figure 9A–D). The ratio of P-CREB to total CREB in THP-1-derived M2 macrophages was decreased by the treatment with 1 μM SKA-121 (n = 4, p < 0.01) (Figure 9E,G), but was increased by the exposure to high [K+]e (25 mM) (n = 4, p < 0.01) (Figure 9F,H). Therefore, ERK-CREB and JNK-c-Jun cascades may be involved in KCa3.1-regulated IL-10 and IL-8 in TAMs.

2.6. Suppressive Effects of Treatment with SKA-121 on the Up-Regulation of IL-10 and IL-8 in THP-1-Derived M2 Macrophages by the Exposure of Soluble Factors in Human Prostate Cancer PC-3 Cell-Cultured Media

Tumor-conditioned media are associated with the generation and infiltration of TAMs [33]. We examined the effects of exposure to human prostate cancer PC-3 spheroid-cultured media for 24 h on the expression levels of IL-10, IL-8, VEGF-A, and TGF-β1 in THP-1-derived M2 macrophages. Media were prepared by the 3D spheroid formation of PC-3 cells for 7 days using ultra-low attachment surface coating cultureware. As shown in Figure 10A,B (left columns), IL-10 and IL-8 expression levels in THP-1-derived M2 macrophages were increased by approximately 3-fold following the exposure to PC-3 media. Simultaneous treatment with 1 or 10 μM SKA-121 resulted in significant decreases in the expression levels of both transcripts (n = 4 for each, p < 0.01) (Figure 10A,B) without changes in those of VEGF-A or TGF-β1 (n = 4 for each, p > 0.05) (Figure 10C,D). Furthermore, elevated IL-10 and IL-8 secretion levels by approximately 1.5-fold following the exposure to PC-3 media were significantly decreased by simultaneous treatment with SKA-121 (n = 4, p < 0.01) (Figure 10E,F). The 24 h exposure to PC-3 media did not alter the viability of THP-1-derived M2 macrophages (n = 5 for each, p > 0.05) (Figure S2E).

3. Discussion

The intermediate-conductance Ca2+-activated K+ channel, KCa3.1, is a key regulator of the polarization and tumor infiltration of TAMs. In the TME, tumor-infiltrating, M2-differentiated TAMs promote escape from cancer immune surveillance, thereby enhancing invasive and metastatic potentials and angiogenesis in cancer [1,2]. The various stresses preventing antitumor immune responses in the TME, such as hypoxia, high lactate levels, and high [K+]e levels, affect TAM functions [34]. Accumulated K+ in the TME overcomes antitumor immune surveillance by inhibiting cytotoxic lymphocyte functions [9,10]. K+ channels as an ‘ionic checkpoint’ are the potential targets for cancer immunotherapy because activators of these channels, specifically expressing immune cells, may overcome the evasion of immune surveillance. In this study, we demonstrated that selective KCa3.1 activators can potentially treat increased TAM-mediated cancer metastatic potential and angiogenesis in the TME using THP-1-derived M2 macrophages. The main results of this study are as follows: (1) pro-tumorigenic IL-8 and IL-10 expression and secretion in THP-1-derived M2 macrophages were significantly decreased by treatment with a KCa3.1 activator (Figure 4), (2) high [K+]e level-induced increases in IL-8 and IL-10 levels were reversed by treatment with a KCa3.1 activator (Figure 5), (3) the transcription of IL-10 and IL-8 was promoted through the ERK-CREB and/or JNK-c-Jun cascades with increases in their phosphorylation levels (Figure 6, Figure 7, Figure 8 and Figure 9), and (4) prostate cancer cell-cultured medium-induced increases in IL-10 and IL-8 levels were reversed by treatment with a KCa3.1 activator (Figure 10). Alternatively, the treatment with a KCa3.1 activator did not affect the expression levels of VEGF-A or TGF-β1, which promote the immunosuppressive activity of Treg cells and their recruitment to the TME (Figure 4C,D). We previously reported KCa3.1 activator-induced reductions in the expression and secretion of IL-10 in IL-10-producing T-cell lymphoma, HuT-78 cells [27]. In contrast to native Treg cells naturally present in the immune system, the NF–κB signaling pathway is continuously active in HuT-78 cells, and IL-10 transcription is regulated through the TGF-β-mediated Smad2/3 signaling pathway [27]. However, as shown in Figure 6A,D, the TGF-β signaling pathway did not contribute to the transcription of IL-10 or IL-8 in THP-1-derived M2 macrophage. No changes in the expression levels of IL-10 and IL-8 were found by the treatment with 10 ng/mL TGF-β1 for 24 h [0.0342 ± 0.0002 and 0.0336 ± 0.0009 (in arbitrary units) in vehicle- and TGF-β-treated groups, respectively, n = 4 for each, p > 0.05].
TAMs play a pivotal role in impairing the functions of antitumor, cytotoxic CD8+ T cells, and natural killer cells by releasing the anti-inflammatory cytokine IL-10 [1,4]. Multiple distinct signaling pathways were found to be responsible for the transcriptional regulation of IL-10 in immune and non-immune cells [35,36]. The IL-10 promoter was activated by CREB through the ERK1/2 signaling pathway in native THP-1 cells [37]. Correspondingly, this study showed the transcriptional repression of IL-10 in THP-1-derived M2 macrophages by a single treatment with an ERK1/2 inhibitor or a CREB inhibitor (Figure 6A and Figure 9A) and the reduced phosphorylation levels of ERK1/2 and CREB in THP-1-derived M2 macrophages treated with a KCa3.1 activator (Figure 7A,E and Figure 9E,G). We recently reported that the inhibition of KCa3.1 upregulated the expression of IL-10 through the JNK/c-Jun cascade in Treg cells [38]. In this study, the JNK/c-Jun cascade was involved in the KCa3.1 activation-induced down-regulation of IL-10 (Figure 7C,G and Figure 8A,C). Collectively, the present results represent the first time that KCa3.1 activators are a possible target for overcoming IL-10-mediated escape from tumor immune surveillance in the TME, through their inhibition of the IL-10 in TAMs via the ERK-CREB and JNK-c-Jun cascades.
Similar to IL-10, IL-8 secreted from TAMs plays a critical role in promoting tumor immunosuppression [39]. IL-8 has also been shown to play a role in the establishment of cancer stemness, chemoresistance, and tumor neovascularization in the TME [39,40]. In this study, the KCa3.1 activator suppressed the production of IL-8 by repressing its transcription in THP-1-derived M2 macrophages (Figure 4B,F). Importantly, the KCa3.1 activator also suppressed high [K+]e exposure-induced IL-8 overexpression (Figure 5B,D). These results suggest that the down-regulation of IL-8 by the KCa3.1 activator in TAMs not only prevented cancer migration and metastasis but also reduced microvessel density in cancer. However, further studies will be needed to prove this hypothesis in the future. Additionally, IL-8 transcription was distinctly repressed by ERK and JNK inhibitors in THP-1-derived M2 macrophages (Figure 6D). Correspondingly, IL-8 transcription was promoted by the ERK and JNK signaling pathways with their phosphorylation in several epithelial cells and synovial fibroblasts [18,41]. As shown in Figure 7, Figure 8 and Figure 9, the treatment with SKA-121 reduced the phosphorylation levels of ERK1/2, JNK, c-Jun, and CREB in THP-1-derived M2 macrophages, while the exposure to high [K+]e exerted the opposite effects. These results suggest that the mechanisms underlying the KCa3.1 activator-induced down-regulation and high [K+]e-induced upregulation of IL-8 and IL-10 are mediated via the same signaling pathways.
Angiogenic inhibition therapy is a promising strategy for cancer. TAMs secrete angiogenic factors such as VEGF-A and TGF-β1; however, the KCa3.1 activator did not alter their expression in this study (Figure 4C,D). IL-8 cooperates with VEGF-A to promote tumor neovascularization [39]. Therefore, KCa3.1 activators may be a novel strategy to terminate/initiate tumor neovascularization by reducing IL-8 secreted from tumor-infiltrating TAMs. Intertumoral IL-8 leads to the recruitment and accumulation of TAMs in the TME [39,40,42]. Bilaterally, IL-8 secreted from TAMs contributes to the epithelial-mesenchymal transition (EMT) process with cancer stem cell properties such as chemoresistance in the TME via a paracrine pathway [42,43]. In this study, IL-8 and IL-10 mRNA expression and secretion levels in THP-1-derived M2 macrophages increased in the culture media of prostate cancer PC-3 cells (Figure 10A,B,E,F). Bidirectional crosstalk between TAMs and cancer cells promotes TAMs to secrete IL-8 and IL-10 into the TME, resulting in the tumorigenesis, metastasis, and angiogenesis of solid cancers. A recent study indicated that exosomal microRNA from cancer cells promoted the M2 polarization of TAMs [44]. miR-21 mimicked increases in IL-10 mRNA levels and a miR-21 inhibitor prevented this alternation [44]. Indeed, several studies have shown that miR-21 is highly expressed in PC-3 cells and is upregulated by the spheroid formation and EMT of PC-3 cells [45,46]. Therefore, the PC-3-medium-induced upregulation of IL-10 and IL-8 in TAMs may be attributed to microRNA(s) in cancer cells, promoting EMT in the TME.
Feng et al. (2018) reported that the activation of Nrf2 upregulated the expression of M2 markers (CD163 and Arg1) [47]. Therefore, the upregulation of IL-10 and IL-8 following the M2 differentiation of THP-1 cells may be due to the activation of Nrf2. The expression levels of Nrf2 were high in THP-1-derived M2 macrophages (Figure S3A); correspondingly, the transcriptional and secretory levels of IL-10 and IL-8 were significantly decreased by the 24 h treatment with ML385 (n = 4 for each, p < 0.01) (Figure S3B–E). These results suggest that Nrf2 is involved in the upregulation of IL-10 and IL-8 but not in the SKA-121-induced down-regulation of them in THP-1-derived M2 macrophages (Figure S3F). CCL22, which is secreted from TAMs, is responsible for the recruitment of Treg cells to tumors, and the prevention of cytotoxic CD8+ T cell activation. No significant changes were observed in the expression levels of CCL22 transcripts following the 24 h treatment with SKA-121 (Figure S3G).

4. Materials and Methods

4.1. Materials and Reagents

RPMI 1640 medium was purchased from FUJIFILM Wako Pure Chemicals (Osaka, Japan). Fetal bovine serum was from Sigma-Aldrich (St. Louis, MO, USA). ECL advanced chemiluminescence reagents were from Nacalai Tesque (Kyoto, Japan). Primary antibodies against KCa3.1 (rabbit polyclonal), ERK1/2 (rabbit polyclonal), phospho-ERK1(T202/Y204)/ERK2(T185/Y187) (rabbit monoclonal), JNK (rabbit polyclonal), phospho-JNK(Y185) (rabbit polyclonal), c-Jun (rabbit polyclonal), CREB (rabbit polyclonal), phospho-CREB(S133) (rabbit polyclonal), and β-actin (ACTB) (mouse monoclonal) were from Alomone Labs (Jerusalem, Israel), BioLegend (San Diego, CA, USA), R&D Systems (Minneapolis, MN, USA), GeneTex (Alton Pkwy Irvine, CA, USA), ProteinTech (Rosemont, IL, USA), Medical & Biological Laboratories (Nagoya, Japan), and ABclonal (Tokyo, Japan). Horseradish peroxidase (HRP)-conjugated anti-rabbit and mouse HRP-conjugated IgG secondary antibodies were from Merck (Darmstadt, Germany). Recombinant human IL-4 and IL-13 were from PeproTech (Cranbury, NJ, USA). TRAM-34 (Santa Cruz Biotechnology, Santa Cruz, CA, USA), SKA-121 [48] (MedChemExpress), Luna Universal qPCR master Mix (New England Biolabs Japan, Tokyo, Japan), the IL-10/IL-8/IL-1β Human Uncoated ELISA kits (Thermo Fisher Scientific, Waltham, MA, USA), AZD5363, LY364947, everolimus, SCH772984, Bay11-7082 (Cayman Chemical, Ann Arbor, MI, USA), LY294002 (Chem Scene, Monmouth Junction, NJ, USA), ciclosporin A (FUJIFILM Wako Pure Chemicals), T-5224 (APExBIO, Boston, MA, USA), ML385, sulforaphane, 666-15 (Selleckchem), DiBAC4(3), Fura 2-acetoxymethyl ester, WST-1, 1-methoxy PMS (Dojindo, Kumamoto, Japan), SP600125 (LC Laboratories, Woburn, MA, USA), and phorbol 12-myristrate 13-acetate (PMA) (AdipoGen, San Diego, CA, USA) were also purchased form the indicated sources. Other chemicals and reagents were from Sigma-Aldrich, FUJIFILM Wako Pure Chemicals, and Nacalai Tesque.

4.2. Cell Culture and Differentiation into M2 Macrophages

The differentiation of the human monocytic leukemia cell line, THP-1, into M0 macrophages was induced by treatment with PMA treatment (100 ng/mL) for 24 h. After removal of the medium, cells were incubated with Roswell Park Memorial Institute (RPMI) 1640 medium supplemented with IL-4 and IL-13 (20 ng/mL each) for 72 h to induce the polarization of M2 macrophages. Drug applications were performed 48 h after the incubation with IL-4/IL-13 [3].

4.3. Measurements of the Membrane Potential and [Ca2+]i

The membrane potential was measured using the fluorescent voltage-sensitive dye, DiBAC4(3), as previously reported [27]. In membrane potential imaging, cells loaded with DiBAC4(3) were illuminated at a wavelength of 490 nm. [Ca2+]i was measured using the fluorescent Ca2+ indicator dye, Fura 2-AM, and cells loaded with Fura 2 were alternatively illuminated at wavelengths of 340 and 380 nm. Before the fluorescence measurements, cells were incubated in the extracellular solution containing 100 nM DiBAC4(3) and 10 μM Fura 2-AM for 20 min. The extracellular solution was composed of (in mM) the following: 137 NaCl, 5.9 KCl, 2.2 CaCl2, 1.2 MgCl2, 14 glucose, and 10 HEPES [4-(2-hydroxyethyl)piperazine-1-ethanesulfonic acid] (pH 7.4). A Ca2+-free solution was prepared by replacing 2.2 mM CaCl2 with 1 mM EGTA [ethylene glycol bis(beta-aminoethylether)-N,N,N,N-tetraacetic acid]. Fluorescence images were recorded using the ORCA-Flash2.8 digital camera (Hamamatsu Photonics, Hamamatsu, Japan). Data collection and analyses were performed using an HCImage system (Hamamatsu Photonics). Images were obtained every 5 sec, and fluorescent intensity values were assessed using the average for 1 min (12 images). The fluorescent intensity of Fura 2 was expressed as measured 340/380 nm fluorescence ratios after background subtraction. Drug solutions (SKA-121 alone and SKA-121 plus TRAM-34) were applied by operating the three-way stopcock.

4.4. Whole-Cell Patch-Clamp Recording

Whole-cell patch-clamp recording experiments were performed as reported previously [26]. A whole-cell patch-clamp was applied to single THP-1-derived M2 macrophages using an Axopatch 200B patch-clamp amplifier under the control of pClamp 11 software (Molecular Devices, San Jose, CA, USA) (23 ± 1 °C). Data acquisition and analysis of whole-cell currents were performed using Clampfit software (Molecular Devices). The resistance of microelectrodes filled with pipette solution was 3–5 MΩ. A ramp voltage protocol from −120 mV to + 40 mV for 200 msec was applied every 10 s at a holding potential of −80 mV. The external solution was (in mM): 137 NaCl, 5.9 KCl, 2.2 CaCl2, 1.2 MgCl2, 14 glucose and 10 HEPES, pH 7.4. The pipette solution was (in mM): 140 KCl, 4 MgCl2, 3.16 CaCl2, 5 EGTA, 10 HEPES and 2 Na2ATP, pH 7.2, with an estimated free Ca2+ concentration of 300 nM (pCa 6.5) [26].

4.5. Preparation of Cancer Spheroid Models Using Ultra-Low Attachment Surface Coating-Cultureware

The human prostate cancer cell line, PC-3, was purchased from the RIKEN Cell Bank (Osaka, Japan). Cells were cultured in RPMI 1640 medium supplemented with 10% fetal bovine serum and Penicillin-Streptomycin Mixture (FUJIFILM Wako Pure Chemicals). All cells were cultured in a humidified atmosphere containing 5% CO2 at 37 °C. The PrimeSurface® system (Sumitomo Bakelite, Tokyo, Japan) was used for three-dimensional spheroid formation. Cell suspensions were seeded onto a PrimeSurface 96U plate at 104 cells/well, and then cultured for 7 days.

4.6. Real-Time PCR

As previously reported, total RNA extraction and cDNA synthesis were conducted [8]. The gene-specific primers for real-time PCR examinations were designed using Primer ExpressTM software (Ver 1.5, Thermo Fisher Scientific). Real-time PCR was performed using Luna Universal qPCR Master Mix (New England Biolabs Japan, Tokyo, Japan) on the ABI 7500 real-time PCR instrument (Applied Biosystems) [8]. The following PCR primers were used: IL-8 (GenBank accession number: BC013615, 218–337, 120 bp); IL-10 (NM_000572, 430–549, 120 bp); VEGF-A (NM_001025366, 1085–1204, 120 bp); TGF-β1 (NM_000660, 1211–1331, 120 bp); CD163 (NM_004244, 3214–3333, 120 bp); arginase 1 (Arg1) (NM_001244438, 711–820, 110 bp); CCL22 (NM_002990, 175–274, 100 bp); KCa3.1 (NM_002250, 1191–1311, 121 bp); Nrf2 (NM_006164, 1704–1823, 120 bp); Orai1 (NM_032790.3, 926–1046, 121 bp); TRPV2 (NM_016113, 1840–1959, 120 bp); TRPM2 (NM_003307, 3082–3224, 143 bp) TRPM7 (NM_017672.6, 2167–2286, 120 bp); Piezo1 (NM_001142864.4, 7510–7629, 120 bp), and ACTB (NM_001101, 411–511, 101 bp). Unknown quantities relative to the standard curve for a particular set of primers were calculated [8], yielding the transcriptional quantitation of gene products relative to ACTB.

4.7. Western Blots

Whole-cell lysates were extracted by RIPA buffer. HaltTM phosphatase inhibitor cocktail (1×) (Thermo Fisher Scientific) was added to extracts at a final concentration of 1%. Equal amounts of protein were subjected to SDS-PAGE and immunoblotting with anti-P-ERK1/2 polyclonal (rabbit) (1:1500) (42/44 kDa), anti-ERK1/2 polyclonal (rabbit) (1:3000) (42/44 kDa), anti-P-JNK polyclonal (rabbit) (1:1500) (43/50 kDa), anti-JNK polyclonal (rabbit) (1:2000) (43/50 kDa), anti-c-Jun polyclonal (rabbit) (1:2000) (42–46 kDa), anti-CREB polyclonal (rabbit) (1:2000) (45 Da), anti-P-CREB polyclonal (rabbit) (1:2000) (45 kDa), anti-KCa3.1 polyclonal (rabbit) (50 kDa), and anti-ACTB monoclonal (mouse) (1:15,000) (43 kDa) antibodies, and were then incubated with anti-rabbit or anti-mouse HRP-conjugated IgG secondary antibody. An ECL advance chemiluminescence reagent kit (Nacalai Tesque) was used to identify the bound antibody. The resulting images were analyzed using Amersham Imager 600 (GE Healthcare Japan) [38]. The optical density of the protein band signal relative to that of the ACTB signal was calculated using ImageJ software (Ver. 1.42, NIH, USA), and protein expression levels in the vehicle control were then expressed as 1.0.

4.8. Measurement of Cytokine Production by Enzyme-Linked Immunosorbent Assay (ELISA)

Human IL-10 and IL-8 levels in supernatant samples were measured with the respective IL-10/IL-8 Human Uncoated ELISA kits (Thermo Fisher Scientific), according to the manufacturer’s protocols. Standard curves were plotted using a series of cytokine/chemokine concentrations.

4.9. Statistical Analysis

Statistical analyses were performed with the statistical software XLSTAT (version 2013.1). The unpaired/paired Student’s t-test with Welch’s correction or one-way ANOVA with Tukey’s test was used to assess the significance of differences between two groups and among multiple groups. Results with a p-value < 0.05 were considered to be significant. Data are shown as means ± standard error.

5. Conclusions

In this study, elevated [K+]e by necrotic cancer and cancer-infiltrating cells in the TME increased the expression and production of IL-10 and IL-8 in THP-1-derived M2 macrophages. We showed the effectiveness of KCa3.1 activators for TME-mediated TAM dysregulation, generating the overexpression of IL-10 and IL-8. Several potent and selective KCa3.1 activators, which positively modulate channel-gating, have been developed [48]; however, their clinical and therapeutic importance remains unclear. The present results provide novel insights into recent advances in TAM targeting therapies as antitumor strategies and indicate that potent and selective KCa3.1 activators need to be considered for future therapeutic applications in cancer immunotherapy. Further studies under the TME-mimicking conditions, such as acidic pH, hypoxia, high lactate, low glucose, and so on will be needed to evaluate the clinical applications and limitations KCa3.1 activators in cancer immunotherapy.

Supplementary Materials

The following supporting information can be downloaded at: https://www.mdpi.com/article/10.3390/ijms23158603/s1.

Author Contributions

Conceptualization, S.O. and M.M.; validation, S.O. and M.M.; formal analysis, S.O., M.M., J.K., H.K. and K.E.; investigation, S.O., M.M., J.K., H.K. and K.E.; data curation, S.O., M.M., J.K., H.K. and K.E.; writing—original draft preparation, S.O., M.M. and J.K.; writing—review and editing, S.O., M.M., J.K., H.K. and K.E.; funding acquisition, S.O. and H.K. All authors have read and agreed to the published version of the manuscript.

Funding

This research was funded by a JSPS KAKENHI grant [JP20K07071] (S.O. and H.K.) and a grant from the Bristol Myers Squibb Foundation [53952417] (S.O.).

Institutional Review Board Statement

Not applicable.

Informed Consent Statement

Not applicable.

Data Availability Statement

Not applicable.

Acknowledgments

Medical English Service (Kyoto, Japan) reviewed the manuscript prior to submission.

Conflicts of Interest

The authors declare no conflict of interest.

References

  1. Boutilier, A.J.; Elsawa, S.F. Macrphage polarization states in the tumor microenvironment. Int. J. Mol. Sci. 2021, 22, 6995. [Google Scholar] [CrossRef] [PubMed]
  2. Lin, Y.; Xu, J.; Lan, H. Tumor-associted macrophages in tumor metastasis: Biological roles and clinical therapeutic applications. J. Hematol. Oncol. 2019, 12, 76. [Google Scholar] [CrossRef] [PubMed]
  3. Genin, M.; Clement, F.; Fattaccioli, A.; Raes, M.; Michiels, C. M1 and M2 macrophages derived from THP-1 cells differentially modulate the response of cancer cells to etoposide. BMC Cancer 2010, 15, 577. [Google Scholar] [CrossRef] [PubMed] [Green Version]
  4. Salmaninejad, A.; Valilou, S.F.; Soltani, A.; Ahmadi, S.; Abarghan, Y.J.; Rosengren, R.J.; Sahebkar, A. Tumor-associated macrophages: Role in cancer development and therapeutic implications. Cell. Oncol. 2019, 42, 591–608. [Google Scholar] [CrossRef] [PubMed]
  5. Vaeth, M.; Feske, S. Ion channelopathies of the immune system. Curr. Opin. Immunol. 2018, 52, 39–50. [Google Scholar] [CrossRef]
  6. Ohya, S.; Kito, H. Ca2+-activated K+ channel KCa3.1 as a therapeutic target for immune disorders. Biol. Pharm. Bull. 2018, 41, 1158–1163. [Google Scholar] [CrossRef] [Green Version]
  7. Xu, R.; Li, C.; Wu, Y.; Shen, L.; Ma, J.; Qian, J.; Ge, J. Role of KCa3.1 channels in macrophage polarization and its relevance in atherosclerotic plaque instability. Arterioscler. Thromb. Vasc. Biol. 2017, 37, 226–236. [Google Scholar] [CrossRef] [PubMed] [Green Version]
  8. Ohya, S.; Matsui, M.; Kajikuri, J.; Endo, K.; Kito, H. Increased Interleukin-10 Expression by the inhibition of Ca2+-activated K+ channel KCa3.1 in CD4+CD25+ regulatory T cells in the recovery phase in an inflammatory bowel disease mouse model. J. Pharmacol. Exp. Ther. 2021, 377, 75–85. [Google Scholar] [CrossRef]
  9. Eil, R.; Vodnala, S.K.; Clever, D.; Klebanoff, C.A.; Sukumar, M.; Pan, J.H.; Palmer, D.C.; Gros, A.; Yamamoto, T.N.; Patel, S.J.; et al. Ionic immune suppression within the tumour microenvironment limits T cell effector function. Nature 2016, 537, 539–543. [Google Scholar] [CrossRef] [Green Version]
  10. Vodnala, S.K.; Eil, R.; Kishton, R.J.; Sukumar, M.; Yamamoto, T.N.; Ha, N.H.; Lee, P.H.; Shin, M.; Patel, S.J.; Yu, Z.; et al. T cell stemness and dysfunction in tumors are triggered by a common mechanism. Science 2019, 353, eaau0135. [Google Scholar] [CrossRef]
  11. Casasanta, M.A.; Yoo, C.C.; Udayasuryan, B.; Sanders, B.E.; Umaña, A.; Zhang, Y.; Peng, H.; Duncan, A.J.; Wang, Y.; Li, L.; et al. Fusobacterium nucleatum host-cell binding and invasion induces IL-8 and CXCL1 secretion that drives colorectal cancer cell migration. Sci. Signal. 2020, 13, eaba9157. [Google Scholar] [CrossRef]
  12. Chen, Y.; Song, Y.; Du, W.; Gong, L.; Chang, H.; Zou, Z. Tumor-associated macrophages: An accomplice in solid tumor progression. J. Biomed. Sci. 2019, 26, 78. [Google Scholar] [CrossRef]
  13. Xu, H.; Lai, W.; Zhang, Y.; Liu, L.; Luo, X.; Zeng, Y.; Wu, H.; Lan, Q.; Chu, Z. Tumor-associated macrophage-derived IL-6 and IL-8 enhance invasive activity of LoVo cells induced by PRL-3 in a KCNN4 channel-dependent manner. BMC Cancer 2014, 14, 330. [Google Scholar] [CrossRef] [Green Version]
  14. Zheng, T.; Ma, G.; Tang, M.; Li, Z.; Xu, R. IL-8 secreted from M2 macrophages promoted prostate tumorigenesis via STAT3/MALAT1 pathway. Int. J. Mol. Sci. 2018, 20, 98. [Google Scholar] [CrossRef] [PubMed] [Green Version]
  15. Chen, L.; Shi, Y.; Zhu, X.; Guo, W.; Zhang, M.; Che, Y.; Tang, L.; Yang, X.; You, Q.; Liu, Z. IL-10 secreted by cancer-associated macrophages regulates proliferation and invasion in gastric cancer cells via c-Met/STAT3 signaling. Oncol. Rep. 2019, 42, 595–604. [Google Scholar] [CrossRef]
  16. Li, D.Q.; Luo, L.; Chen, Z.; Kim, H.S.; Song, X.J.; Pflugfelder, S.C. JNK and ERK MAP kinases mediate induction of IL-1β, TNF-α and IL-8 following hyperosmolar stress in human limbal epithelial cells. Exp. Eye Res. 2006, 82, 588–596. [Google Scholar] [CrossRef] [Green Version]
  17. Dobreva, Z.G.; Miteva, L.D.; Stanilova, S.A. The inhibition of JNK and p38 MAPKs downregulates IL-10 and differentially affects c-Jun gene expression in human monocytes. Immunopharmacol. Immunotoxicol. 2009, 31, 195–201. [Google Scholar] [CrossRef]
  18. Namba, S.; Nakano, R.; Kitanaka, T.; Kitanaka, N.; Nakayama, T.; Sugiya, H. ERK2 and JNK1 contribute to TNF-α-induced IL-8 expression in synovial fibroblasts. PLoS ONE 2017, 12, e0182923. [Google Scholar] [CrossRef] [Green Version]
  19. Bezzerri, V.; Borgatti, M.; Finotti, A.; Tamanini, A.; Gambari, R.; Cabrini, G. Mapping the transcriptional machinary of the IL-8 gene in human bronchial epithelial cells. J. Immunol. 2011, 187, 6069–6081. [Google Scholar] [CrossRef] [Green Version]
  20. Sanin, D.E.; Prendergast, C.T.; Mountford, A.P. IL-10 production in macrophages is regulated by a TLR-driven CREB-mediated mechanim that is linked to genes involved in cell metabolism. J. Immunol. 2015, 195, 1218–1232. [Google Scholar] [CrossRef]
  21. Javasingam, S.D.; Citartan, M.; Thang, T.H.; Mat Zin, A.A.; Ang, K.C.; Ch’ng, A.A. Evaluating the polarization of tumor-associated macrophages into M1 and M2 phenotypes in human cancer tissue: Technicalities and challenges in routine clinical practice. Front. Oncol. 2020, 9, 1512. [Google Scholar] [CrossRef] [Green Version]
  22. Cassetta, L.; Pollard, J.W. Targeting macrophages: Therapeutic approaches in cancer. Nat. Drug Discov. 2018, 17, 887–904. [Google Scholar] [CrossRef] [PubMed]
  23. Atcha, H.; Jairaman, A.; Holt, J.R.; Meli, V.S.; Nagalla, R.R.; Veerasubramanian, P.K.; Brumm, K.T.; Lim, H.E.; Othy, S.; Cahalan, M.D.; et al. Mechanically activated ion channel Piezo1 modulates macrophage polarization and stiffness sensing. Nat. Commun. 2021, 12, 3256. [Google Scholar] [CrossRef] [PubMed]
  24. Dutta, B.; Arya, R.K.; Goswami, R.; Alharbi, M.O.; Sharma, S.; Rahaman, S.O. Role of macrophage TRPV4 in inflammation. Lab. Investig. 2020, 100, 178–185. [Google Scholar] [CrossRef]
  25. Qiao, W.; Wong, K.H.M.; Shen, J.; Wang, W.; Wu, J.; Li, J.; Lin, Z.; Chen, Z.; Matinlinna, J.P.; Zheng, Y.; et al. TRPM7 kinase-mediated immunomodulation in macrophage plays a central role in magnesium ion-induced bone regeneration. Nat. Commun. 2021, 12, 2885. [Google Scholar] [CrossRef]
  26. Kito, H.; Morihiro, H.; Sakakibara, Y.; Endo, K.; Kajikuri, J.; Suzuki, T.; Ohya, S. Downregulation of the Ca2+-activated K+ channel KCa3.1 in mouse preosteoblast cells treated with vitamin D receptor agonist. Am. J. Physiol. Cell Physiol. 2020, 319, C345–C358. [Google Scholar] [CrossRef]
  27. Matsui, M.; Kajikuri, J.; Kito, H.; Endo, K.; Hasegawa, Y.; Murate, S.; Ohya, S. Inhibition of Interleukin 10 Transcription through the SMAD2/3 Signaling Pathway by Ca2+-Activated K+ Channel KCa3.1 Activation in Human T-Cell Lymphoma HuT-78 Cells. Mol. Pharmacol. 2019, 95, 294–302. [Google Scholar] [CrossRef] [Green Version]
  28. Tan, J.W.Y.; Folz, J.; Kopelman, R.; Wang, X. In vivo photoacoustic potassium imaging of the tumor microenvironment. Biomed. Opt. Express 2020, 11, 3507–3522. [Google Scholar] [CrossRef]
  29. Hayashi, R.; Yamashita, N.; Matsui, S.; Fujita, T.; Araya, J.; Sassa, K.; Arai, N.; Yoshida, Y.; Kashii, T.; Maruyama, M.; et al. Bradykinin stimulates IL-6 and IL-8 production by human lung fibroblasts through ERK- and p38 MAPK-dependent mechanisms. Eur. Respir. J. 2000, 16, 452–458. [Google Scholar] [CrossRef] [Green Version]
  30. Ye, L.; Xin, Y.; Wu, Z.Y.; Sun, H.J.; Huang, D.J.; Sun, Z.Q. A newly synthesized flavone from luteolin escapes from COMT-catalyzed methylation and inhibits lipopolysaccharide-induced inflammation in RAW264.7 macrophages via JNK, P38 and NF-κB signaling pathways. J. Microbiol. Biotechnol. 2022, 32, 15–26. [Google Scholar] [CrossRef]
  31. Wang, L.; Tang, C.; Cao, H.; Li, K.; Pang, X.; Zhong, L.; Dang, W.; Tang, H.; Huang, Y.; Wei, L.; et al. Activation of IL-8 via PI3K/Akt-dependent pathway is involved in leptin-mediated epithelial-mesenchymal transition in human breast cancer cells. Cancer Biol. Ther. 2015, 16, 1220–1230. [Google Scholar] [CrossRef] [Green Version]
  32. Maldonado-Perez, D.; Brown, P.; Morgan, K.; Miller, R.P.; Thompson, E.A.; Habbour, H.N. Prokineticin 1 modulates IL-8 expression via the calcineurin/NFAT signaling pathway. Biochim. Biophys. Acta. 2009, 1793, 1315–1324. [Google Scholar] [CrossRef] [PubMed] [Green Version]
  33. Benner, B.; Scarberry, L.; Suarez-Kelly, L.P.; Duggan, M.C.; Campbell, A.R.; Smith, E.; Lapurga, G.; Jiang, K.; Butchar, J.P.; Tridandapani, S.; et al. Generation of monocyte-derived tumor-associated macrophages using tumor-conditioned media provides a novel method to study tumor-associated macrophages in vitro. J. Immunother. Cancer 2019, 7, 140. [Google Scholar] [CrossRef] [PubMed] [Green Version]
  34. Vaupel, P.; Multhoff, G. Accomplices of the hypoxic tumor microenvironment conpromising antitumor immunity: Adenosine, lactate, acidosis, vascular endothelial growth factor, potassium ions, and phosphatydylserine. Front. Immunol. 2017, 8, 1887. [Google Scholar] [CrossRef] [PubMed] [Green Version]
  35. Nguyen, H.D.; Aljamaei, H.M.; Stadnyk, A.W. The production and function of endogenous interleukin-10 in intestinal epithelial cells and gut homeostasis. Cell. Mol. Gastroenterol. Hepatol. 2021, 12, 1343–1352. [Google Scholar] [CrossRef] [PubMed]
  36. Sarava, M.; O’Garra, A. The regulation of IL-10 production by immune cells. Nat. Rev. Immunol. 2010, 10, 170–181. [Google Scholar] [CrossRef] [PubMed] [Green Version]
  37. Gee, K.; Angel, J.B.; Ma, W.; Mishra, S.; Gajanayaka, N.; Parato, K.; Kumar, A. Intracellular HIV-Tat expression induces IL-10 synthesis by the CREB-1 transcription factor through Ser133 phosphorylation and its regulation and by the ERK1/2 MAPK in human monocytic cells. J. Biol. Chem. 2006, 281, 31647–31658. [Google Scholar] [CrossRef]
  38. Matsui, M.; Kajikuri, J.; Endo, K.; Kito, H.; Ohya, S. KCa3.1 inhibition-induced activation of the JNK/c-Jun signaling pathway enhances IL-10 expression in peripherally-induced regulatory T cells. J. Pharmacol. Sci. 2022, 148, 1–5. [Google Scholar] [CrossRef]
  39. Asokan, S.; Bandapalli, O.R. CXCR8 signaling in the tumor microenvironment. Adv. Exp. Med. Biol. 2021, 1302, 25–39. [Google Scholar] [CrossRef]
  40. Terry, S.; Engelsen, A.S.T.; Buart, S.; Elsayed, W.S.; Venkatesh, G.H.; Chouaib, S. Hypoxia-driven intratumor heterogeneity and immune evasion. Cancer Lett. 2020, 492, 1–10. [Google Scholar] [CrossRef]
  41. Bowers, E.C.; McCullough, S.D.; Morgan, D.S.; Dailey, L.A.; Diaz-Sanchez, D. ERK1/2 and p38 regulate inter-individual variability in ozone-mediated IL-8 gene expression in primary human bronchial epithelial cells. Sci. Rep. 2018, 8, 9398. [Google Scholar] [CrossRef] [PubMed]
  42. Long, X.; Ye, Y.; Zhang, L.; Liu, P.; Yu, W.; Wei, F.; Ren, X.; Yu, J. IL-8, a novel messenger to cross-link inflammation and tumor EMT via autocrine and paracrine pathways (Review). Int. J. Oncol. 2016, 48, 5–12. [Google Scholar] [CrossRef] [Green Version]
  43. Wei, C.; Yang, C.; Wang, S.; Shi, D.; Zhang, C.; Lin, X.; Liu, Q.; Dou, R.; Xiong, B. Crosstalk between cancer cells and tumor associated macrophages is required for mesenchymal circulating tumor cell-mediated colorectal cancer metastasis. Mol. Cancer 2019, 18, 64. [Google Scholar] [CrossRef]
  44. Xiao, L.; He, Y.; Peng, F.; Yang, J.; Yuan, C. Endometrial cancer cells promote M2-like macrophage polarization by delivering exosomal miRNA-21 under hypoxic condition. J. Immunol. Res. 2020, 2020, 9731049. [Google Scholar] [CrossRef] [PubMed]
  45. Arisan, E.D.; Rencuzogullari, O.; Freitas, I.L.; Radzali, S.; Keskin, B.; Kothari, A.; Warford, A.; Uysal-Onganer, P. Upregulated Wnt-11 and miR-21 expression trigger epithelial mesenchymal transition in aggressive prostate cancer cells. Biology 2020, 9, 52. [Google Scholar] [CrossRef] [PubMed] [Green Version]
  46. Zhao, W.; Ning, L.; Wang, L.; Ouyang, T.; Qi, L.; Yang, R.; Wu, Y. miR-21 inhibition reverses doxorubicin-resistance and inhibits PC3 human prostate cancer cells proliferation. Andrologia 2021, 53, e14016. [Google Scholar] [CrossRef]
  47. Feng, R.; Morine, Y.; Ikemoto, T.; Imura, S.; Iwahashi, S.; Saito, Y.; Shimada, M. Nrf2 activation drive macrophages polarization and cancer cell epithelial-mesenchymal transition during interaction. Cell. Commun. Signal. 2018, 16, 54. [Google Scholar] [CrossRef] [Green Version]
  48. Brown, B.M.; Shim, H.; Christophersen, P.; Wulff, H. Pharmacology of small-and intermediate-conductance calcium-activated potassium channels. Annu. Rev. Pharmacol. Toxicol. 2020, 60, 219–240. [Google Scholar] [CrossRef] [Green Version]
Figure 1. Gene expression of M2 markers, cytokines, chemokines, and growth factors in THP-1-derived M2-like macrophages. AG: Real-time PCR examination of CD163 (A), Arg1 (B), IL-10 (C), IL-8 (D), VEGF-A (E), CCL22 (F), and TGF-β1 (G) expression in native THP-1 (‘native’), THP-1-derived M0-like macrophages (‘M0’), and THP-1-derived M2-like macrophages (‘M2’). Expression levels are shown as a ratio to ACTB (n = 4 for each). **: p < 0.01 vs. ‘native’, ##: p < 0.01 vs. ‘M0’.
Ijms 23 08603 g001
Figure 2. Functional expression of KCa3.1 in THP-1-derived M2 macrophages. (A,B): Simultaneous measurements of changes in the membrane potential (A) and [Ca2+]i (B) in the three different cells [a (black), b (blue), and c (red)], following the application of a selective KCa3.1 activator, SKA-121 (1 μM), and/or the KCa3.1 inhibitor, TRAM-34 (1 μM) using DiBAC4(3) and Fura 2, respectively. The relative time-course changes in fluorescence intensities (1.0 at 0 s) from three different THP-1-derived M2 macrophages are shown. (C): Real-time PCR examination of KCa3.1 expression in THP-1-derived M0 macrophages (‘M0’) and M2 macrophages (‘M2’). Expression levels are shown as a ratio to ACTB (p > 0.05, n = 4 for each). (D,E): Protein expression levels of KCa3.1 in the ‘M0’ and ‘M2’ groups were determined by Western blot. Specific band signals for KCa3.1 were observed at approximately 50 kDa (D, upper panel). After compensation with the optical density of the ACTB signal (43 kDa) (D, lower panel), the expression level in the ‘M0’ group was expressed as 1.0 (p > 0.05, n = 4 for each) (E). (F): SKA-121 (1 μM)-induced relative hyperpolarizing responses in the ‘M0’ and ‘M2’ groups (p > 0.05, n = 37 and 29, respectively).
Ijms 23 08603 g002
Figure 3. Whole-cell patch-clamp recordings of SKA-121-activated K+ currents in THP-1-derived M2 macrophages. (A): Typical current density and voltage-relationships after addition of vehicle (black), 1 μM SKA-121 (red), and 1 μM SKA-121 plus 1 μM TRAM-34 (blue). Currents were elicited by ramp depolarization from −120 to +40 mV from a holding potential of −80 mV every 10 s. (B): Typical current density and voltage-relationship of SKA-121-sensitive component. (C): Summarized results of current densities (pA/pF) at +40 mV in three groups (n = 9 for each). *: p < 0.05 vs. vehicle control (−/−); ## p < 0.01 vs. SKA-121 alone (+/−).
Ijms 23 08603 g003
Figure 4. Effects of treatment with SKA-121 on IL-10, IL-8, VEGF-A, and TGF-β1 expression and on IL-10 and IL-8 secretion in THP-1-derived M2 macrophages. A–D: Real-time PCR examination of IL-10 (A), IL-8 (B), VEGF-A (C), and TGF-β1 (D) expression in THP-1-derived M2 macrophages treated (+) or untreated (−) with 1 μM SKA-121 and 10 μM TRAM-34 for 24 h. Relative mRNA expression in the vehicle control (‘−’ for SKA and ‘−’ for TRAM) is expressed as 1.0 (n = 4 for each). (E,F): Quantitative detection of IL-10 (E) and IL-8 (F) secretion by an ELISA assay in THP-1-derived M2 macrophages treated and untreated with SKA-121 and TRAM-34. Relative cytokine secretion in the vehicle control (−/−) is expressed as 1.0 (n = 4 for each). **: p < 0.01 vs. the vehicle control (−/−), ##: p < 0.01 vs. SKA-121 alone (+/−).
Ijms 23 08603 g004
Figure 5. Effects of treatment with SKA-121 on high [K+]e-enhanced IL-10 and IL-8 expression and secretion in THP-1-derived M2 macrophages. A,B: Real-time PCR examination of IL-10 (A) and IL-8 (B) expression in normal [K+]e (5 mM)- and high [K+]e (25 mM)-treated THP-1-derived M2 macrophages for 24 h in the presence (+) or absence (−) of SKA-121 (1, 10 μM). Relative mRNA expression in normal [K+]e is expressed as 1.0 (n = 4 for each). (C,D): Quantitative detection of IL-10 (C) and IL-8 (D) secretion by an ELISA assay in THP-1-derived M2 macrophages treated and untreated with SKA-121. Relative cytokine secretion in normal [K+]e is expressed as 1.0 (n = 4 for each). **: p < 0.01 vs. normal [K+]e, ##: p < 0.01 vs. the vehicle control (−/−) of high [K+]e.
Ijms 23 08603 g005
Figure 6. Effects of a 24 h treatment with various signaling pathway inhibitors on IL-10 and IL-8 expression and effects of the 24 h treatment with the ERK1/2 inhibitor, SCH772984 and JNK inhibitor, SP600125 on IL-10 and IL-8 secretion in THP-1-derived M2 macrophages. (A,D): Real-time PCR examination of IL-10 (A) and IL-8 (D) expression in SCH772964 (1 μM)-, SP600125 (10 μM)-, PD169316 (10 μM)-, LY294002 (10 μM)-, AZD5363 (2 μM)-, everolimus (10 nM)-, LY364947 (10 μM)-, ciclosporin A (CsA, 1 μM)-, T-5224 (10 μM)-, and Bay11-7082 (10 μM)-treated THP-1-derived M2 macrophages for 24 h. Relative mRNA expression in the vehicle control is expressed as 1.0 (n = 4 for each). (B,C,E,F): Quantitative detection of IL-10 (B,C) and/or IL-8 (E,F) secretion by an ELISA assay in SCH772964 (B,E)- and SP600125 (C,F)-treated THP-1-derived M2 macrophages. Relative cytokine secretion in the vehicle control is expressed as 1.0 (n = 4 for each). **: p < 0.01 vs. the vehicle control.
Ijms 23 08603 g006
Figure 7. Protein expression levels of phosphorylated ERK1/2 (P-ERK1/2) and P-JNK in THP-1-derived M2 macrophages following the SKA-121 treatment and high [K+]e exposure. AD: Western blot showing P-ERK1/2, total ERK1/2 (ERK1/2) (A,B), P-JNK, and total JNK (JNK) (C,D) in 1 μM SKA-121-treated (A,C) and high [K+]e-exposed (B,D) THP-1-derived M2 macrophages. Specific band signals were observed at 42 (P-ERK2), 42 (ERK2), 43/50 (P-JNK), and 43/50 (JNK) kDa. EH: Summarized results of the relative protein expression of P-ERK2/ERK2 (E,F) and P-JNK/JNK (G,H) in 1 μM SKA-121-treated (E,G) and high [K+]e-exposed (F,H) THP-1-derived M2 macrophages. After compensation with the optical density of the ACTB signal (43 kDa), the expression level in the vehicle control or 5 mM K+ is expressed as 1.0 (n = 4 for each). **: p < 0.01 vs. the vehicle control and 5 mM K+.
Ijms 23 08603 g007
Figure 8. Protein expression levels of phosphorylated c-Jun (P-c-Jun) following the SKA-121 treatment and high [K+]e exposure in THP-1-derived M2 macrophages. (A,B): Western blot showing P-c-Jun, and unphosphorylated c-Jun (c-Jun) in 1 μM SKA-121-treated (A) and high [K+]e-exposed (B) THP-1-derived M2 macrophages. Specific band signals were observed at 42-46 (P-c-Jun) and 40 (c-Jun) kDa. (C,D): Summarized results of the relative protein expression of P-c-Jun/c-Jun in 1 μM SKA-121-treated (C) and high [K+]e-exposed (D) THP-1-derived M2 macrophages. After compensation with the optical density of the ACTB signal (43 kDa), the expression level in the vehicle control is expressed as 1.0 (n = 4 for each). **: p < 0.01 vs. the vehicle control and 5 mM K+.
Ijms 23 08603 g008
Figure 9. Effects of treatment with a CREB inhibitor on expression levels of IL-10, IL-8, VEGF-A, and TGF-β1 transcripts and on phosphorylated P-CREB protein levels following the SKA-121 treatment and high [K+]e exposure in THP-1-derived M2 macrophages. (AD): Real-time PCR examination of IL-10 (A), IL-8 (B), VEGF-A (C), and TGF-β1 (D) expression in THP-1-derived M2 macrophages treated with vehicle and 1 μM 666-15 for 24 h. Relative mRNA expression in the vehicle control is expressed as 1.0 (n = 4 for each). E-F: Western blot showing P-CREB and total CREB (CREB) in 1 μM SKA-121-treated (E) and high [K+]e-exposed (F) THP-1-derived M2 macrophages. Specific band signals for P-CREB and CREB were observed at approximately 40 kDa. G, H: Summarized results of the relative protein expression of P-CREB/CREB in 1 μM SKA-121-treated (G) and high [K+]e-exposed (H) THP-1-derived M2 macrophages. After compensation with the optical density of the ACTB signal, the expression level in the vehicle control or 5 mM K+ is expressed as 1.0 (n = 4 for each). **: p < 0.01 vs. the vehicle control or 5 mM K+.
Ijms 23 08603 g009
Figure 10. Effects of treatment with SKA-121 on expression levels of IL-10, IL-8, VEGF-A, and TGF-β1 transcripts and IL-10 and IL-8 secretion in human prostate cancer PC-3 cell-cultured medium-treated THP-1-derived M2 macrophages. (AD): Real-time PCR examination of IL-10 (A), IL-8 (B), VEGF-A (C), and TGF-β1 (D) expression in PC-3 media-treated THP-1-derived M2 macrophages treated (+) or untreated (−) with 1 or 10 μM SKA-121 for 24 h. Relative mRNA expression in the group untreated with PC-3 medium is expressed as 1.0 (n = 4 for each). (E,F): Quantitative detection of IL-10 (E) and IL-8 (F) secretion by an ELISA assay in THP-1-derived M2 macrophages treated or untreated with SKA-121. Relative secretion in the group untreated with PC-3 medium is expressed as 1.0 (n = 4 for each). **: p < 0.01 vs. the vehicle control (−/−).
Ijms 23 08603 g010
Publisher’s Note: MDPI stays neutral with regard to jurisdictional claims in published maps and institutional affiliations.

