
Antipsychotic Drug Aripiprazole Protects Liver Cells from Oxidative Stress


Abstract
:1. Introduction
2. Results
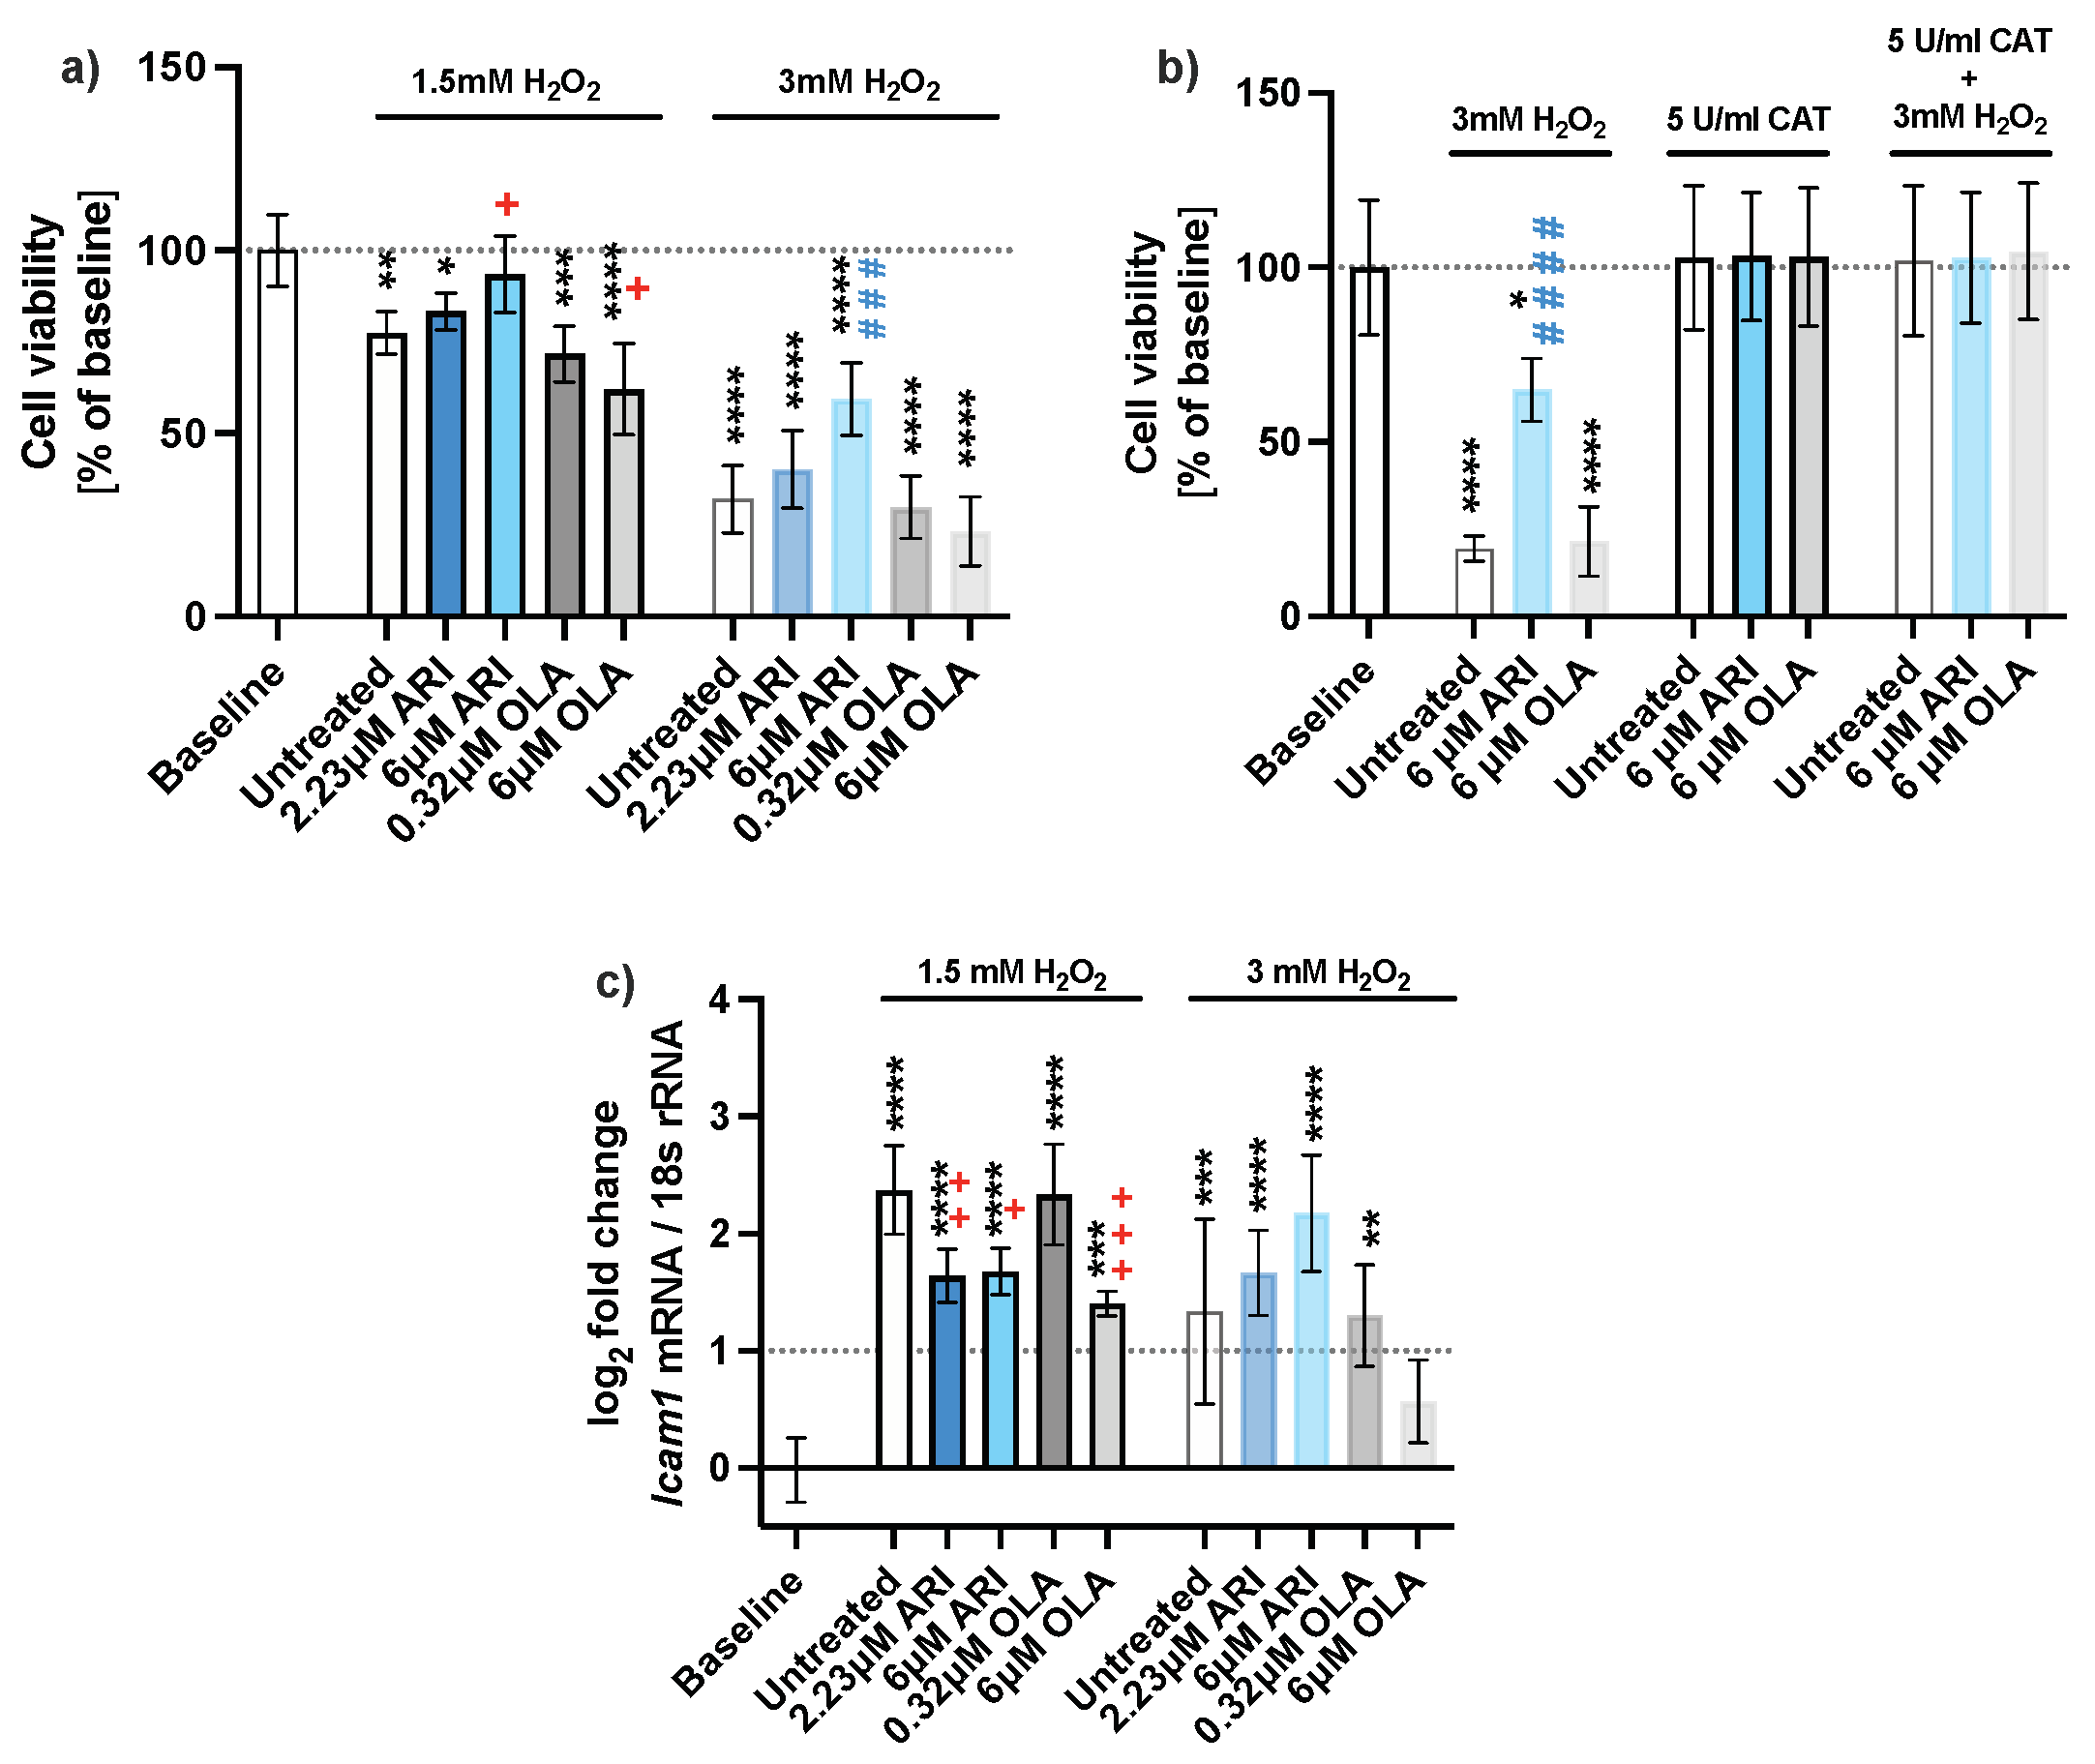
2.1. Cell Survival
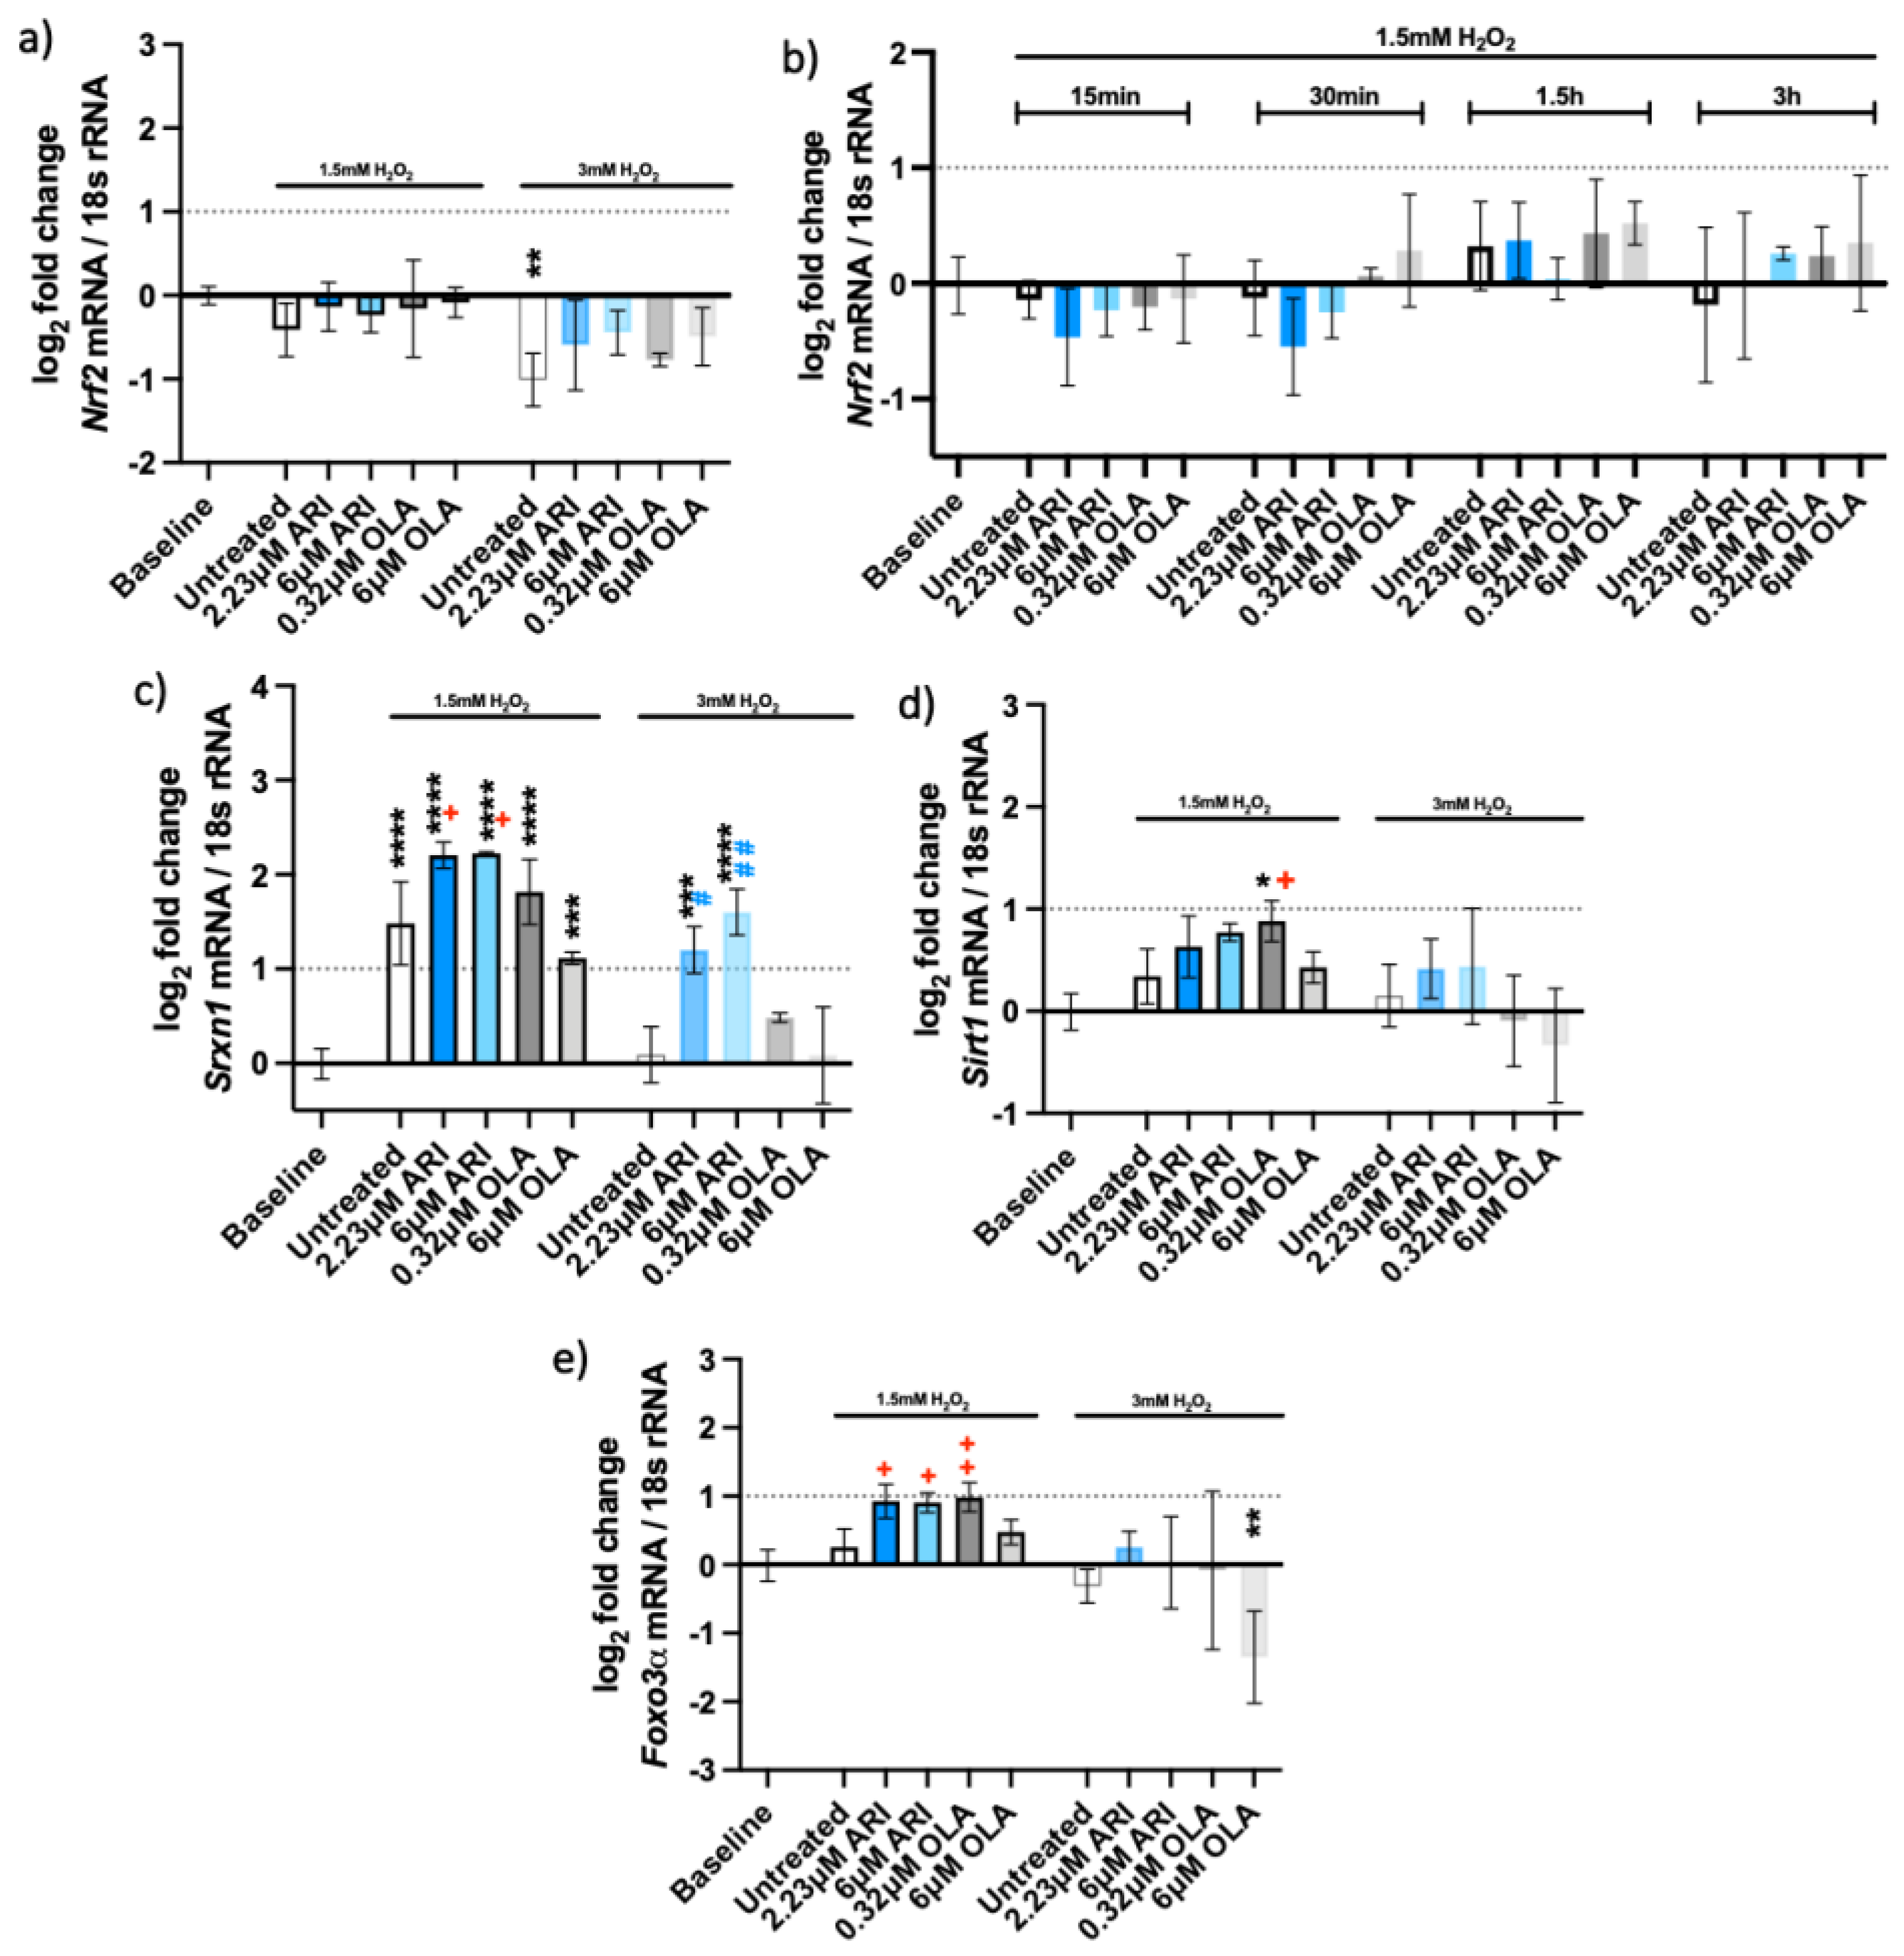
2.2. Oxidative Stress Response Pathway
2.3. DNA Damage Response Pathway
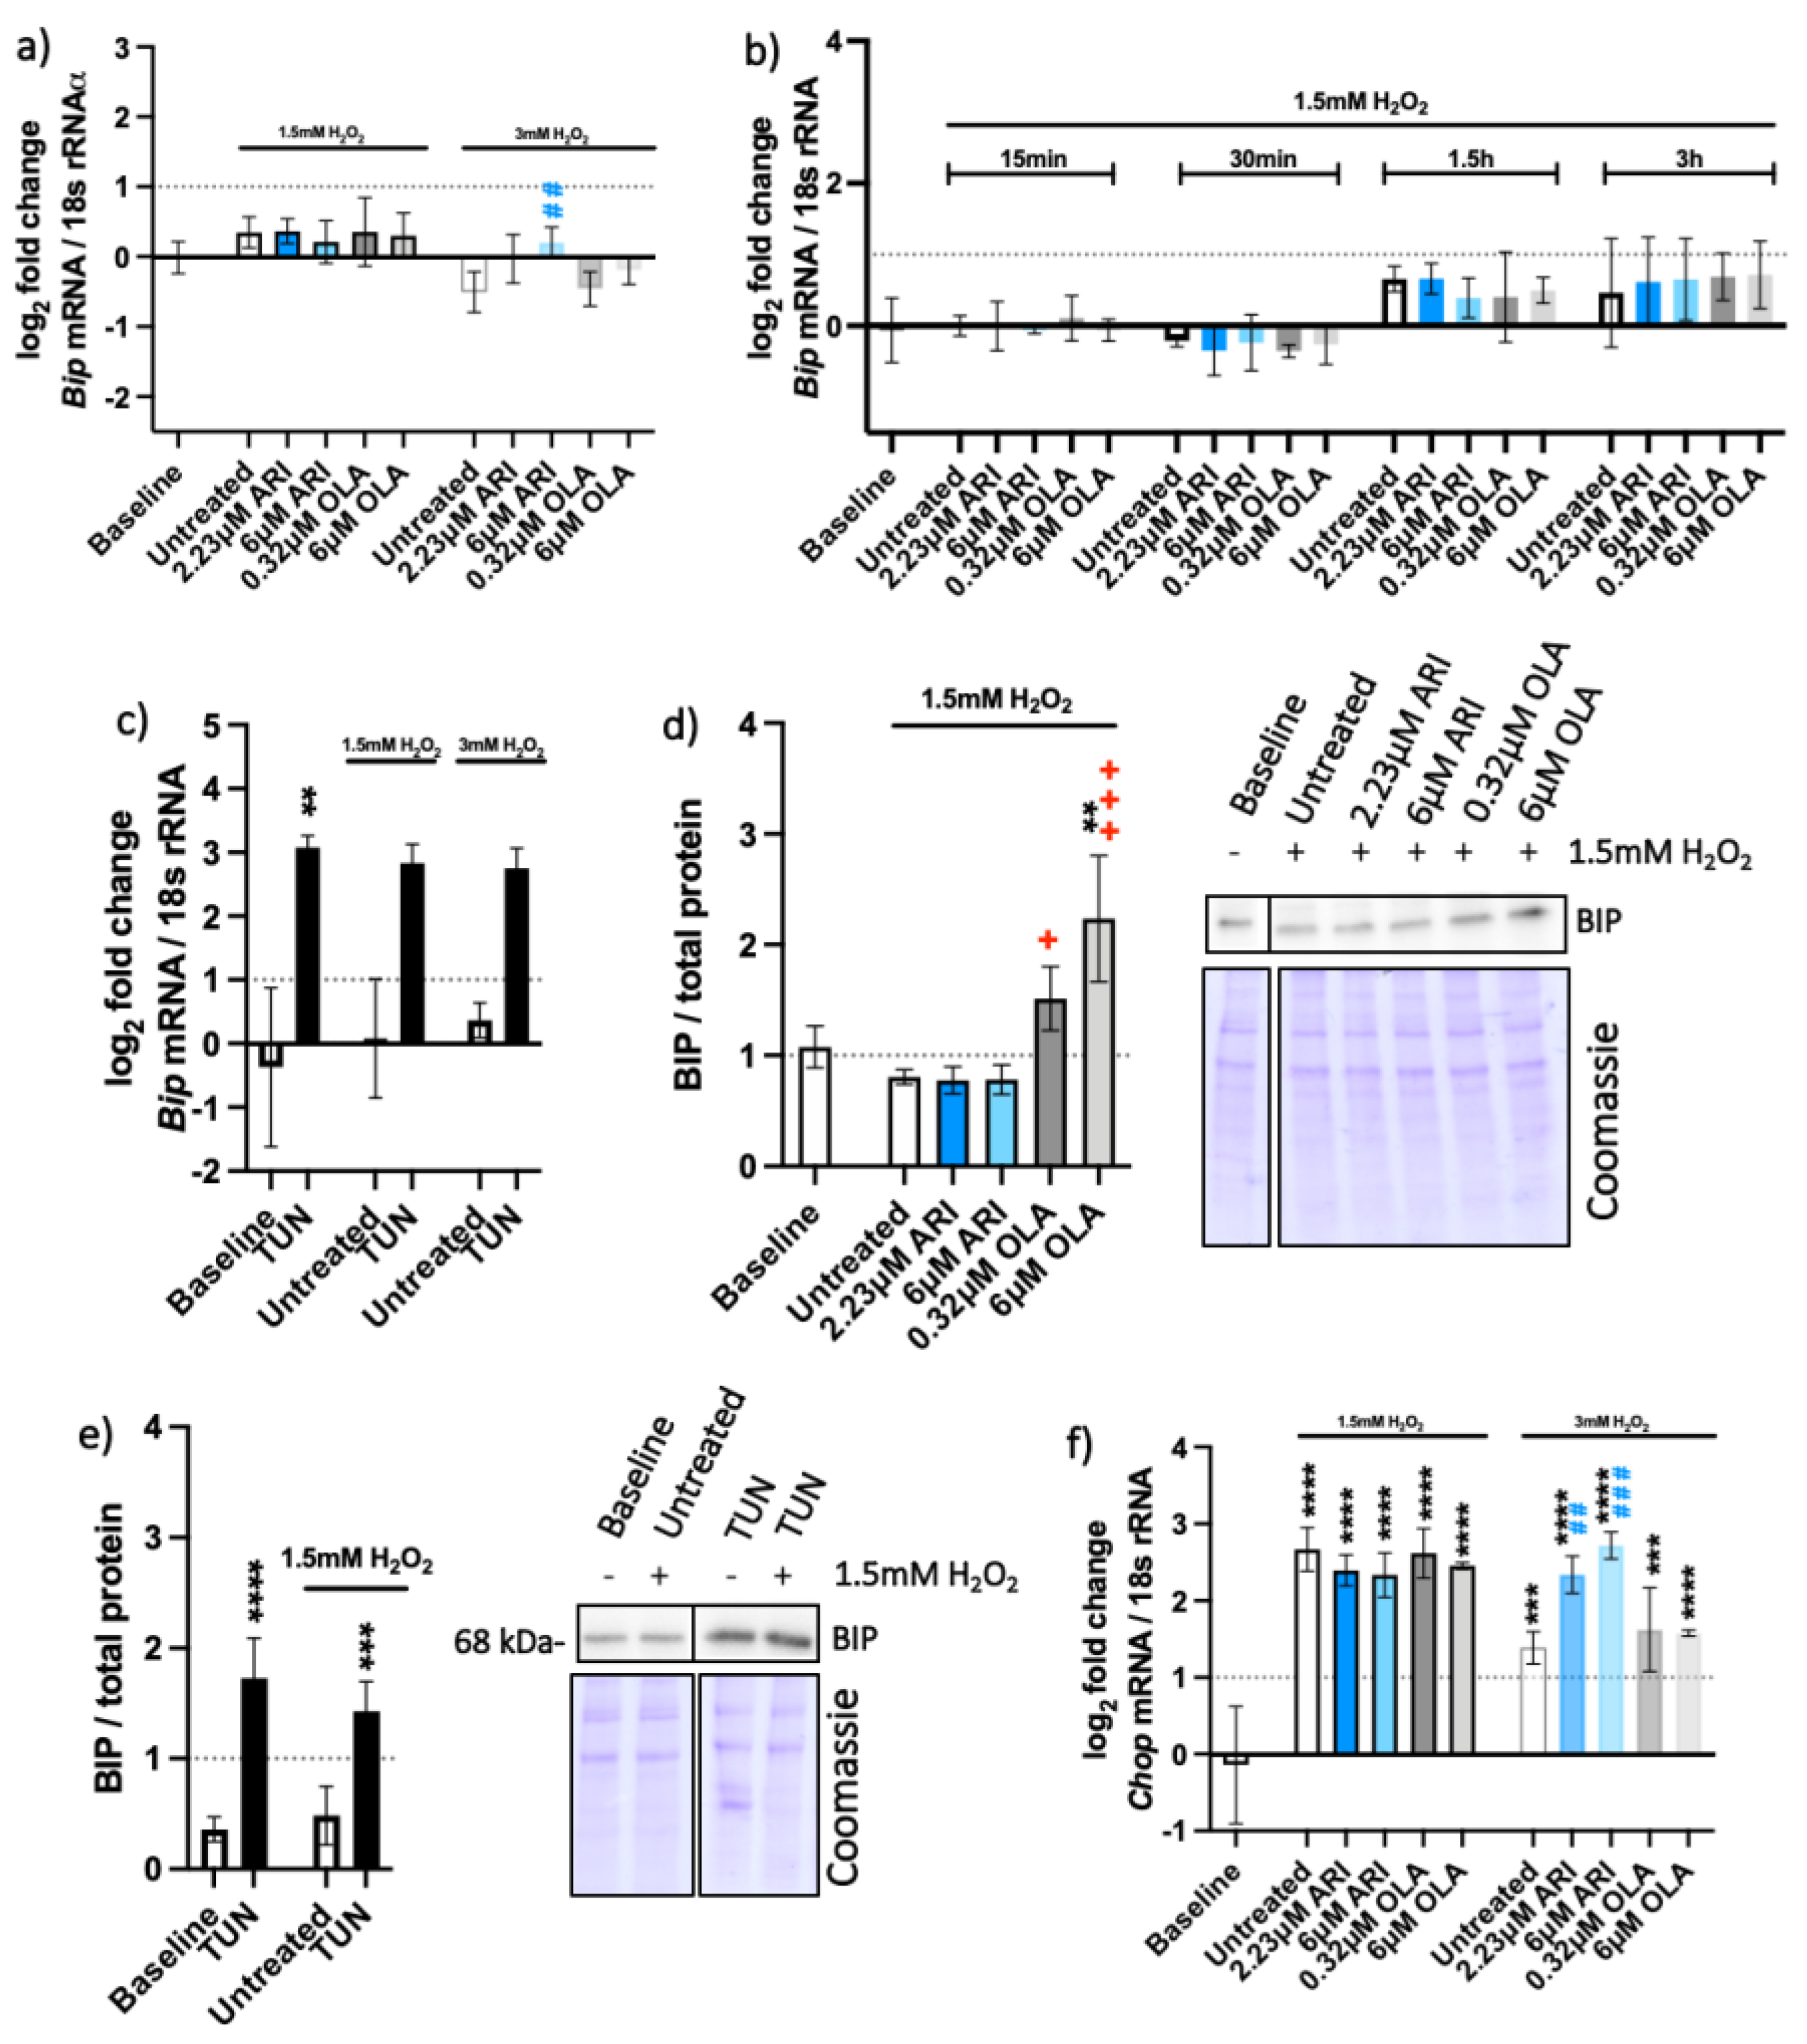
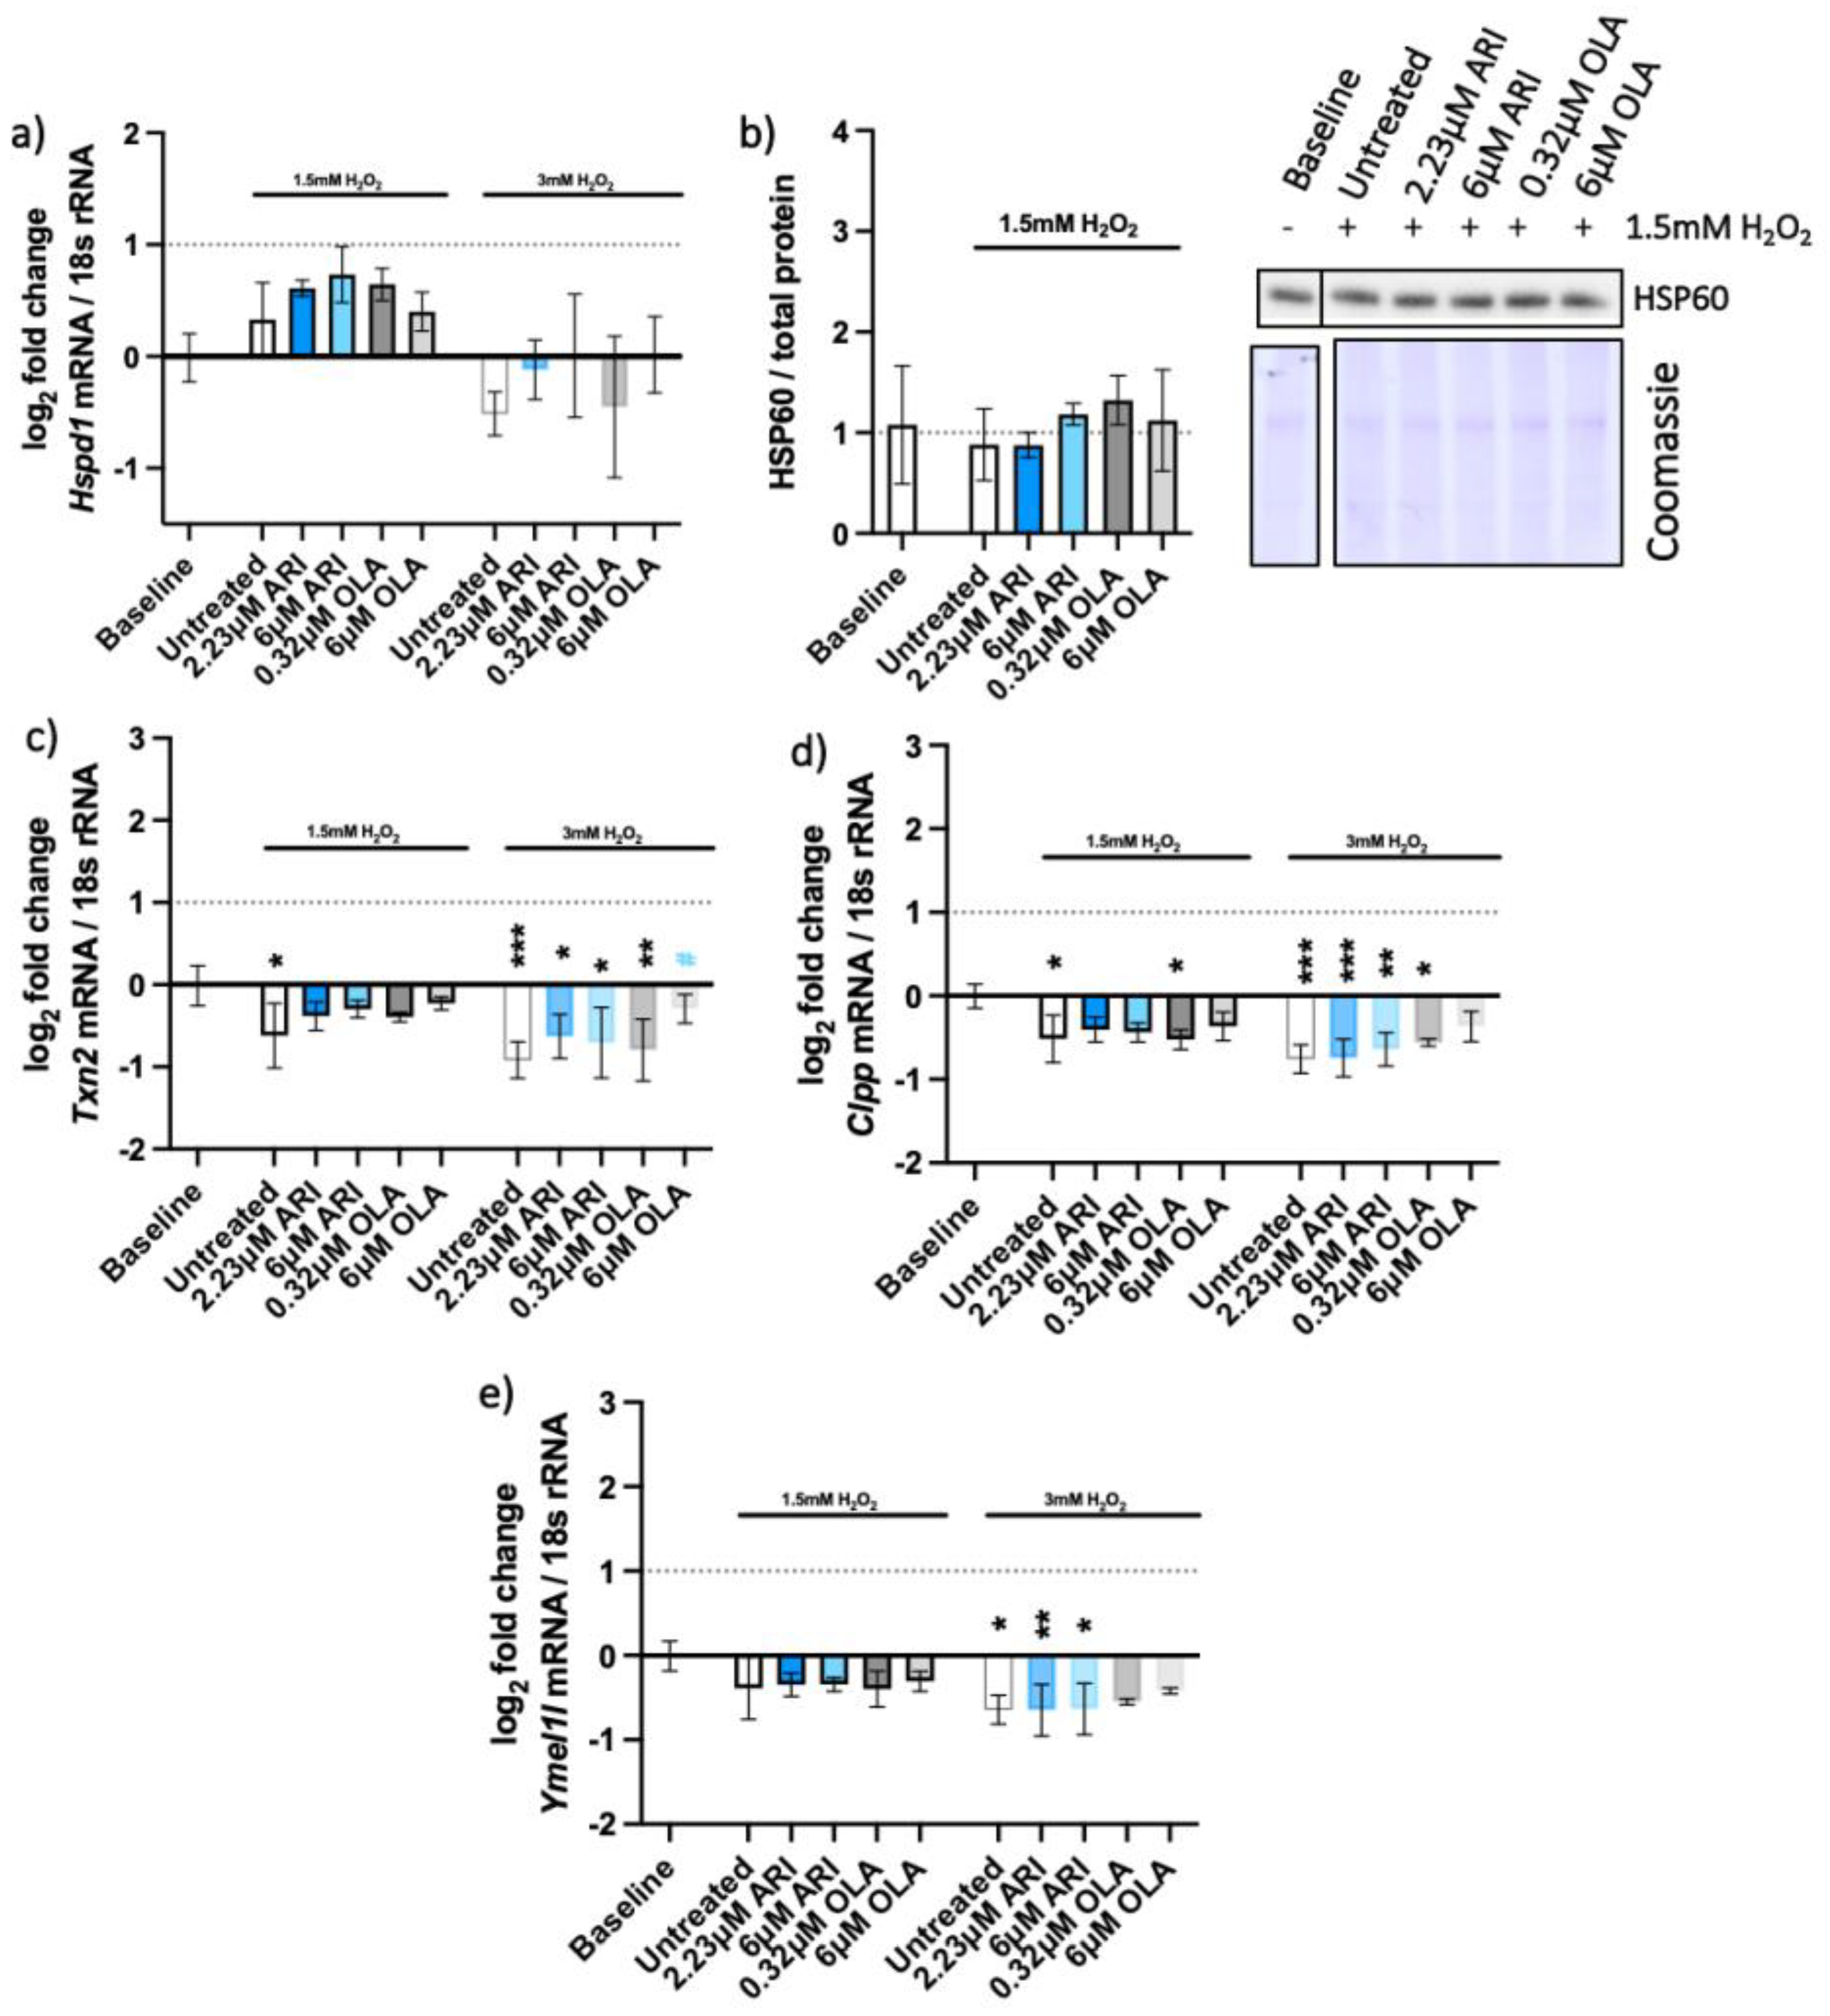
2.4. Unfolded Protein Response (UPR) Pathways
3. Discussion
4. Materials and Methods
4.1. Cell Cultures
4.2. Cell Viability Assay and Dehydrogenase Activity
4.3. RNA Isolation and Reverse-Transcription Quantitative Polymerase Chain Reaction Analysis (RT-qPCR)
4.4. Protein Extraction and Western Blotting
4.5. Catalase, Superoxide Dismutase and Glutathione Peroxidase Activities, Total Glutathione Measurements
4.6. Statistical Analysis
Supplementary Materials
Author Contributions
Funding
Institutional Review Board Statement
Informed Consent Statement
Data Availability Statement
Conflicts of Interest
References
- Todorovic Vukotic, N.; Dordevic, J.; Pejic, S.; Dordevic, N.; Pajovic, S.B. Antidepressants- and antipsychotics-induced hepatotoxicity. Arch. Toxicol. 2021, 95, 767–789. [Google Scholar] [CrossRef]
- Grajales, D.; Vazquez, P.; Ruiz-Rosario, M.; Tuduri, E.; Mirasierra, M.; Ferreira, V.; Hitos, A.B.; Koller, D.; Zubiaur, P.; Cigudosa, J.C.; et al. The second-generation antipsychotic drug aripiprazole modulates the serotonergic system in pancreatic islets and induces beta cell dysfunction in female mice. Diabetologia 2021, 65, 490–505. [Google Scholar] [CrossRef] [PubMed]
- Gonzalez-Munoz, M.; Monserrat Villatoro, J.; Marin-Serrano, E.; Stewart, S.; Bardon Rivera, B.; Marin, J.; Martinez de Soto, L.; Seco Meseguer, E.; Ramirez, E. A case report of a drug-induced liver injury (DILI) caused by multiple antidepressants with causality established by the updated Roussel Uclaf causality assessment method (RUCAM) and in vitro testing. Clin. Case Rep. 2020, 8, 3105–3109. [Google Scholar] [CrossRef] [PubMed]
- National Institute of Diabetes and Digestive and Kidney Diseases. LiverTox: Clinical and Research Information on Drug-Induced Liver Injury. Roussel Uclaf Causality Assessment Method (RUCAM) in Drug Induced Liver Injury; National Institute of Diabetes and Digestive and Kidney Diseases: Bethesda, MD, USA, 2012.
- Brelje, A.; Fay, B.; Mariouw, S.; VandenBerg, A. Identifying olanzapine induced liver injury in the setting of acute hepatitis C: A case report. Ment. Health Clin. 2022, 12, 210–213. [Google Scholar] [CrossRef]
- Gayam, V.; Khalid, M.; Shrestha, B.; Hossain, M.R.; Dahal, S.; Garlapati, P.; Gill, A.; Mandal, A.K.; Sangha, R. Drug-Induced Liver Injury: An Institutional Case Series and Review of Literature. J. Investig. Med. High. Impact Case Rep. 2018, 6, 2324709618761754. [Google Scholar] [CrossRef] [PubMed]
- Mahadik, S.P.; Evans, D.; Lal, H. Oxidative stress and role of antioxidant and omega-3 essential fatty acid supplementation in schizophrenia. Prog. Neuropsychopharmacol. Biol. Psychiatry 2001, 25, 463–493. [Google Scholar] [CrossRef]
- Bitanihirwe, B.K.; Woo, T.U. Oxidative stress in schizophrenia: An integrated approach. Neurosci. Biobehav. Rev. 2011, 35, 878–893. [Google Scholar] [CrossRef] [Green Version]
- Madireddy, S.; Madireddy, S. Regulation of Reactive Oxygen Species-Mediated Damage in the Pathogenesis of Schizophrenia. Brain Sci. 2020, 10, 742. [Google Scholar] [CrossRef]
- Wu, J.Q.; Kosten, T.R.; Zhang, X.Y. Free radicals, antioxidant defense systems, and schizophrenia. Prog. Neuropsychopharmacol. Biol. Psychiatry 2013, 46, 200–206. [Google Scholar] [CrossRef] [PubMed]
- Wu, Z.W.; Yu, H.H.; Wang, X.; Guan, H.Y.; Xiu, M.H.; Zhang, X.Y. Interrelationships Between Oxidative Stress, Cytokines, and Psychotic Symptoms and Executive Functions in Patients With Chronic Schizophrenia. Psychosom. Med. 2021, 83, 485–491. [Google Scholar] [CrossRef] [PubMed]
- Padurariu, M.; Ciobica, A.; Dobrin, I.; Stefanescu, C. Evaluation of antioxidant enzymes activities and lipid peroxidation in schizophrenic patients treated with typical and atypical antipsychotics. Neurosci. Lett. 2010, 479, 317–320. [Google Scholar] [CrossRef] [PubMed]
- Hendouei, N.; Farnia, S.; Mohseni, F.; Salehi, A.; Bagheri, M.; Shadfar, F.; Barzegar, F.; Hoseini, S.D.; Charati, J.Y.; Shaki, F. Alterations in oxidative stress markers and its correlation with clinical findings in schizophrenic patients consuming perphenazine, clozapine and risperidone. Biomed. Pharmacother. 2018, 103, 965–972. [Google Scholar] [CrossRef] [PubMed]
- Lin, C.H.; Lane, H.Y. Early Identification and Intervention of Schizophrenia: Insight From Hypotheses of Glutamate Dysfunction and Oxidative Stress. Front. Psychiatry 2019, 10, 93. [Google Scholar] [CrossRef]
- Wei, Z.; Bai, O.; Richardson, J.S.; Mousseau, D.D.; Li, X.M. Olanzapine protects PC12 cells from oxidative stress induced by hydrogen peroxide. J. Neurosci. Res. 2003, 73, 364–368. [Google Scholar] [CrossRef] [PubMed]
- Pickering, A.M.; Vojtovich, L.; Tower, J.; KJ, A.D. Oxidative stress adaptation with acute, chronic, and repeated stress. Free Radic. Biol. Med. 2013, 55, 109–118. [Google Scholar] [CrossRef] [Green Version]
- Cichoz-Lach, H.; Michalak, A. Oxidative stress as a crucial factor in liver diseases. World J. Gastroenterol. 2014, 20, 8082–8091. [Google Scholar] [CrossRef] [PubMed]
- Wink, S.; Hiemstra, S.W.; Huppelschoten, S.; Klip, J.E.; van de Water, B. Dynamic imaging of adaptive stress response pathway activation for prediction of drug induced liver injury. Arch. Toxicol. 2018, 92, 1797–1814. [Google Scholar] [CrossRef] [PubMed] [Green Version]
- Pirc Marolt, T.; Kramar, B.; Bulc Rozman, K.; Suput, D.; Milisav, I. Aripiprazole reduces liver cell division. PLoS ONE 2020, 15, e0240754. [Google Scholar] [CrossRef]
- Scarino, M.L.; Howell, K.E. The Fao Cell. A tissue culture model for lipoprotein synthesis and secretion. Exp. Cell Res. 1987, 170, 15–30. [Google Scholar] [CrossRef]
- Bayly, A.C.; French, N.J.; Dive, C.; Roberts, R.A. Non-genotoxic hepatocarcinogenesis in vitro: The FaO hepatoma line responds to peroxisome proliferators and retains the ability to undergo apoptosis. J. Cell Sci. 1993, 104 Pt 2, 307–315. [Google Scholar] [CrossRef]
- Monsalve, M.; Prieto, I.; de Bem, A.F.; Olmos, Y. Methodological Approach for the Evaluation of FOXO as a Positive Regulator of Antioxidant Genes. Methods Mol. Biol. 2019, 1890, 61–76. [Google Scholar] [CrossRef]
- Hiemke, C.; Bergemann, N.; Clement, H.W.; Conca, A.; Deckert, J.; Domschke, K.; Eckermann, G.; Egberts, K.; Gerlach, M.; Greiner, C.; et al. Consensus Guidelines for Therapeutic Drug Monitoring in Neuropsychopharmacology: Update 2017. Pharmacopsychiatry 2018, 51, e1. [Google Scholar] [CrossRef] [Green Version]
- Gulubova, M.V. Intercellular adhesion molecule-1 (ICAM-1) expression in the liver of patients with extrahepatic cholestasis. Acta Histochem. 1998, 100, 59–74. [Google Scholar] [CrossRef]
- Volpes, R.; van den Oord, J.J.; Desmet, V.J. Hepatic expression of intercellular adhesion molecule-1 (ICAM-1) in viral hepatitis B. Hepatology 1990, 12, 148–154. [Google Scholar] [CrossRef]
- Singh, A.; Ling, G.; Suhasini, A.N.; Zhang, P.; Yamamoto, M.; Navas-Acien, A.; Cosgrove, G.; Tuder, R.M.; Kensler, T.W.; Watson, W.H.; et al. Nrf2-dependent sulfiredoxin-1 expression protects against cigarette smoke-induced oxidative stress in lungs. Free Radic. Biol. Med. 2009, 46, 376–386. [Google Scholar] [CrossRef] [Green Version]
- Brunet, A.; Sweeney, L.B.; Sturgill, J.F.; Chua, K.F.; Greer, P.L.; Lin, Y.; Tran, H.; Ross, S.E.; Mostoslavsky, R.; Cohen, H.Y.; et al. Stress-dependent regulation of FOXO transcription factors by the SIRT1 deacetylase. Science 2004, 303, 2011–2015. [Google Scholar] [CrossRef] [Green Version]
- Wang, X.; Hu, S.; Liu, L. Phosphorylation and acetylation modifications of FOXO3a: Independently or synergistically? Oncol. Lett. 2017, 13, 2867–2872. [Google Scholar] [CrossRef] [Green Version]
- Tamura, R.E.; de Vasconcellos, J.F.; Sarkar, D.; Libermann, T.A.; Fisher, P.B.; Zerbini, L.F. GADD45 proteins: Central players in tumorigenesis. Curr. Mol. Med. 2012, 12, 634–651. [Google Scholar] [CrossRef]
- Oyadomari, S.; Mori, M. Roles of CHOP/GADD153 in endoplasmic reticulum stress. Cell Death Differ. 2004, 11, 381–389. [Google Scholar] [CrossRef] [Green Version]
- Adamowicz, K.; Kucharska-Mazur, J. Dietary Behaviors and Metabolic Syndrome in Schizophrenia Patients. J. Clin. Med. 2020, 9, 537. [Google Scholar] [CrossRef] [Green Version]
- Simonelli-Munoz, A.J.; Fortea, M.I.; Salorio, P.; Gallego-Gomez, J.I.; Sanchez-Bautista, S.; Balanza, S. Dietary habits of patients with schizophrenia: A self-reported questionnaire survey. Int. J. Ment. Health Nurs. 2012, 21, 220–228. [Google Scholar] [CrossRef]
- Belviranlı, M.; Gökbel, H. Acute exercise induced oxidative stress and antioxidant changes. Eur. J. Gen. Med. 2006, 3, 126–131. [Google Scholar] [CrossRef]
- Fisher-Wellman, K.; Bloomer, R.J. Acute exercise and oxidative stress: A 30 year history. Dyn. Med. 2009, 8, 1. [Google Scholar] [CrossRef] [Green Version]
- Kornischka, J.; Cordes, J. Acute Drug-Induced Hepatitis during Aripiprazole Monotherapy: A Case Report. J. Pharmacovigil. 2016, 4, 1000201. [Google Scholar] [CrossRef] [Green Version]
- Castanheira, L.; Fernandes, E.; Levy, P.; Coentre, R. Aripiprazole-induced Hepatitis: A Case Report. Clin. Psychopharmacol. Neurosci. 2019, 17, 551–555. [Google Scholar] [CrossRef]
- Sanchez-Ramos, C.; Prieto, I.; Tierrez, A.; Laso, J.; Valdecantos, M.P.; Bartrons, R.; Rosello-Catafau, J.; Monsalve, M. PGC-1alpha Downregulation in Steatotic Liver Enhances Ischemia-Reperfusion Injury and Impairs Ischemic Preconditioning. Antioxid. Redox Signal. 2017, 27, 1332–1346. [Google Scholar] [CrossRef] [Green Version]
- Hasan Tahsin Kilic, O.; Aksoy, I.; Cinpolat Elboga, G.; Bulbul, F. Oxidative parameters, oxidative DNA damage, and urotensin-II in schizoaffective disorder patients. Psychiatry Clin. Psychopharmacol. 2019, 29, 151–157. [Google Scholar] [CrossRef] [Green Version]
- Forno, F.; Maatuf, Y.; Boukeileh, S.; Dipta, P.; Mahameed, M.; Darawshi, O.; Ferreira, V.; Rada, P.; Garcia-Martinez, I.; Gross, E.; et al. Aripiprazole Cytotoxicity Coincides with Activation of the Unfolded Protein Response in Human Hepatic Cells. J. Pharmacol. Exp. Ther. 2020, 374, 452–461. [Google Scholar] [CrossRef]
- Zhang, M.; Zhao, Z.; He, L.; Wan, C. A meta-analysis of oxidative stress markers in schizophrenia. Sci. China Life Sci. 2010, 53, 112–124. [Google Scholar] [CrossRef]
- Yao, J.K.; Reddy, R.; van Kammen, D.P. Reduced level of plasma antioxidant uric acid in schizophrenia. Psychiatry Res. 1998, 80, 29–39. [Google Scholar] [CrossRef]
- Yao, J.K.; Reddy, R.D.; van Kammen, D.P. Oxidative damage and schizophrenia: An overview of the evidence and its therapeutic implications. CNS Drugs 2001, 15, 287–310. [Google Scholar] [CrossRef] [PubMed]
- Reddy, R.; Keshavan, M.; Yao, J.K. Reduced plasma antioxidants in first-episode patients with schizophrenia. Schizophr. Res. 2003, 62, 205–212. [Google Scholar] [CrossRef]
- Isaacson, R.H.; Beier, J.I.; Khoo, N.K.; Freeman, B.A.; Freyberg, Z.; Arteel, G.E. Olanzapine-induced liver injury in mice: Aggravation by high-fat diet and protection with sulforaphane. J. Nutr. Biochem. 2020, 81, 108399. [Google Scholar] [CrossRef]
- Hursitoglu, O.; Orhan, F.O.; Kurutas, E.B.; Doganer, A.; Durmus, H.T.; Kopar, H. Diagnostic Performance of Increased Malondialdehyde Level and Oxidative Stress in Patients with Schizophrenia. Noro Psikiyatr. Ars. 2021, 58, 184–188. [Google Scholar] [CrossRef] [PubMed]
- Beresford, T.P.; Clapp, L.; Martin, B.; Wiberg, J.L.; Alfers, J.; Beresford, H.F. Aripiprazole in schizophrenia with cocaine dependence: A pilot study. J. Clin. Psychopharmacol. 2005, 25, 363–366. [Google Scholar] [CrossRef]
- Ramakers, C.; Ruijter, J.M.; Deprez, R.H.; Moorman, A.F. Assumption-free analysis of quantitative real-time polymerase chain reaction (PCR) data. Neurosci. Lett. 2003, 339, 62–66. [Google Scholar] [CrossRef]
- Ruijter, J.M.; Ramakers, C.; Hoogaars, W.M.; Karlen, Y.; Bakker, O.; van den Hoff, M.J.; Moorman, A.F. Amplification efficiency: Linking baseline and bias in the analysis of quantitative PCR data. Nucleic Acids Res. 2009, 37, e45. [Google Scholar] [CrossRef] [Green Version]
- Willems, E.; Leyns, L.; Vandesompele, J. Standardization of real-time PCR gene expression data from independent biological replicates. Anal. Biochem. 2008, 379, 127–129. [Google Scholar] [CrossRef]
- Kramar, B.; Suput, D.; Milisav, I. Differential p16 expression levels in the liver, hepatocytes and hepatocellular cell lines. PeerJ 2021, 9, e12358. [Google Scholar] [CrossRef]
- Miller, I.P.; Pavlovic, I.; Poljsak, B.; Suput, D.; Milisav, I. Beneficial Role of ROS in Cell Survival: Moderate Increases in H2O2 Production Induced by Hepatocyte Isolation Mediate Stress Adaptation and Enhanced Survival. Antioxidants 2019, 8, 434. [Google Scholar] [CrossRef] [Green Version]


| 1.5 mM H2O2 (+) | 3 mM H2O2 (#) | ||||||||||||||
|---|---|---|---|---|---|---|---|---|---|---|---|---|---|---|---|
| ARI | OLA | ARI | OLA | ||||||||||||
| 2.23 | 6 | 0.32 | 6 | 2.23 | 6 | 0.32 | 6 | µM | |||||||
| Cell viability (Figure 1) | NR | 0.0299 | 0.0374 | 0.0008 | ↑ | Upregulation | |||||||||
| Icam1 | 0.0082 | 0.0119 | 0.0008 | ↓ | Downregulation | ||||||||||
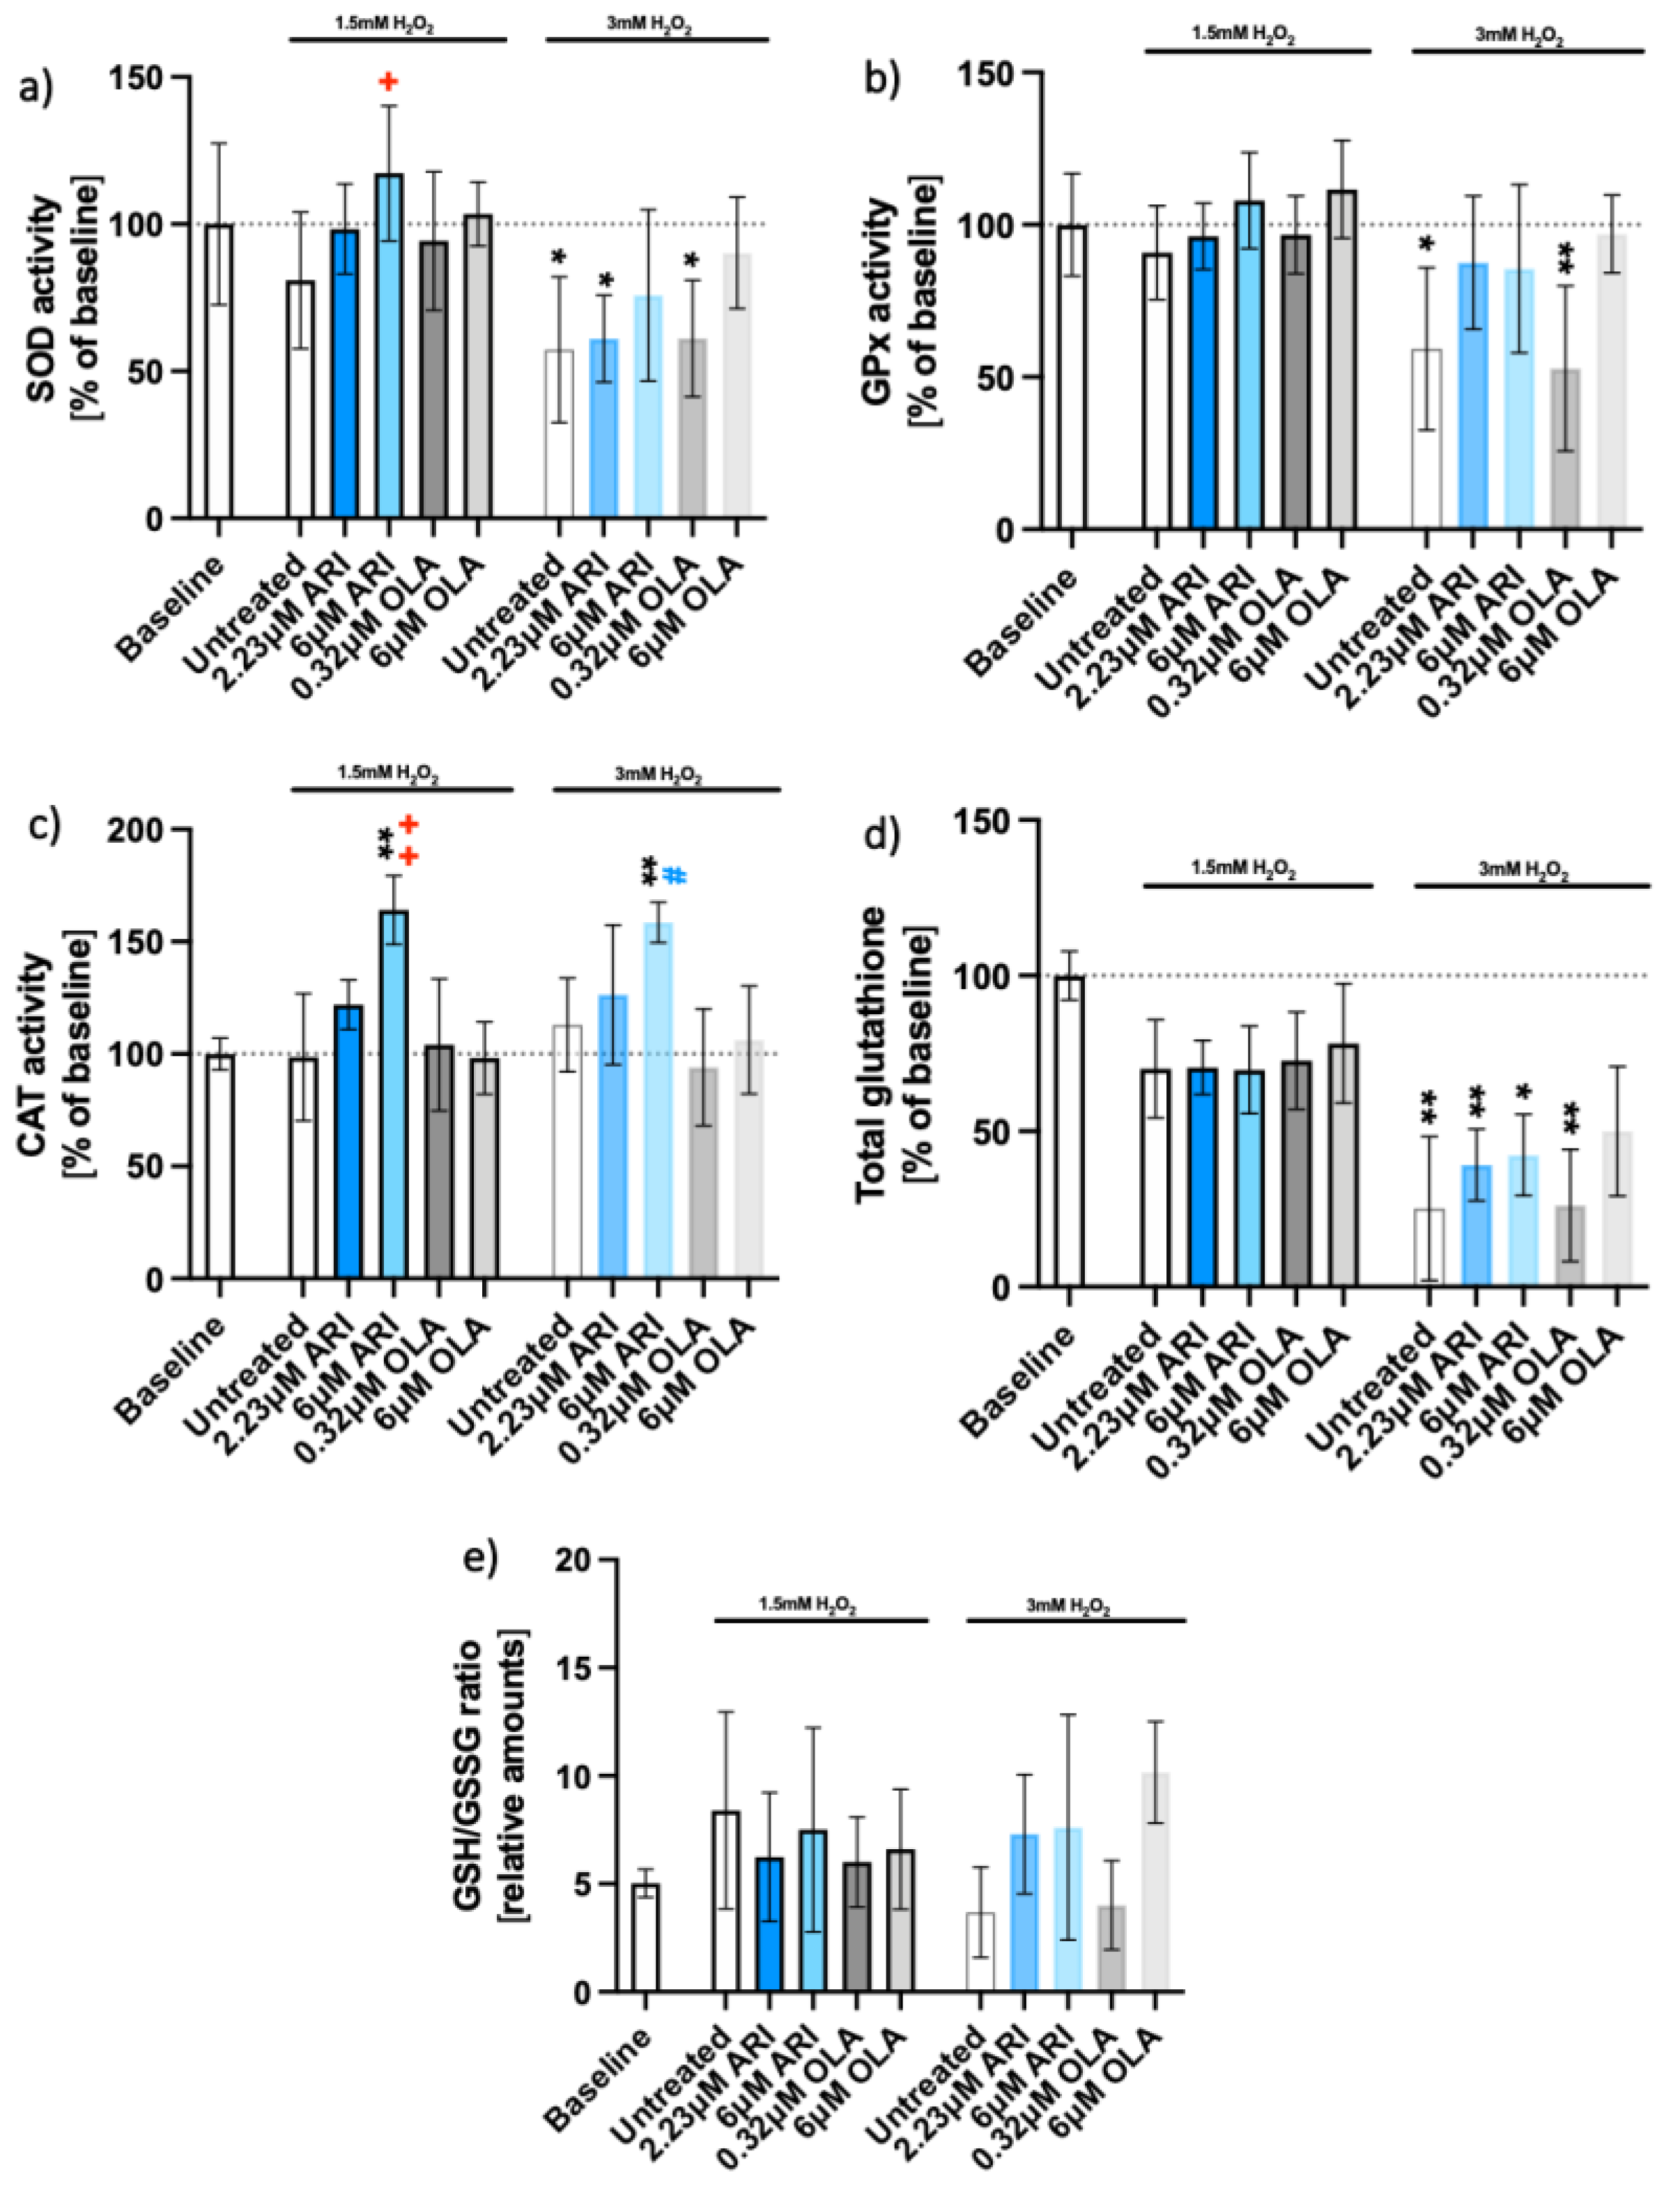
| Antioxidant activity (Figure 2) | SOD | 0.0298 | p > 0.05 | ||||||||||||
| GPx | Not presented | ||||||||||||||
| CAT | 0.0021 | 0.0475 | |||||||||||||
| total GSH | |||||||||||||||
| GSH/GSSG | |||||||||||||||
| Oxidative stress—prot. exp. (Figure 3) | SOD2 | ||||||||||||||
| PRX3 | 0.0118 | ||||||||||||||
| HO-1 | 0.0486 | 0.0259 | |||||||||||||
| NRF2 | |||||||||||||||
| Oxidative stress—gene exp. (Figure 4) | Nrf2 | ||||||||||||||
| Nrf2 (single treat.) | |||||||||||||||
| Srxn1 | 0.0213 | 0.0183 | 0.0115 | 0.0037 | |||||||||||
| Sirt1 | 0.0376 | ||||||||||||||
| Foxo3α | 0.0111 | 0.0134 | 0.0066 | ||||||||||||
| DNA damage (Figure 5) | p53 | 0.0490 | |||||||||||||
| p21 | 0.0314 | 0.0006 | |||||||||||||
| Gadd45α | 0.0102 | 0.0010 | |||||||||||||
| Gadd45β | 0.0041 | ||||||||||||||
| Gadd45γ | 0.0431 | 0.0205 | 0.0005 | 0.0033 | |||||||||||
| erUPR (Figure 6) | Bip | 0.0077 | |||||||||||||
| Bip (single treat.) | |||||||||||||||
| BIP | 0.0486 | 0.0005 | |||||||||||||
| Chop | 0.0041 | 0.0004 | |||||||||||||
| mtUPR (Figure 7) | Hspd1 | ||||||||||||||
| HSP60 | |||||||||||||||
| Txn2 | 0.0382 | ||||||||||||||
| Clpp | |||||||||||||||
| Ymel1l | |||||||||||||||
Publisher’s Note: MDPI stays neutral with regard to jurisdictional claims in published maps and institutional affiliations. |
© 2022 by the authors. Licensee MDPI, Basel, Switzerland. This article is an open access article distributed under the terms and conditions of the Creative Commons Attribution (CC BY) license (https://creativecommons.org/licenses/by/4.0/).
Share and Cite
Kramar, B.; Pirc Marolt, T.; Monsalve, M.; Šuput, D.; Milisav, I. Antipsychotic Drug Aripiprazole Protects Liver Cells from Oxidative Stress. Int. J. Mol. Sci. 2022, 23, 8292. https://doi.org/10.3390/ijms23158292
Kramar B, Pirc Marolt T, Monsalve M, Šuput D, Milisav I. Antipsychotic Drug Aripiprazole Protects Liver Cells from Oxidative Stress. International Journal of Molecular Sciences. 2022; 23(15):8292. https://doi.org/10.3390/ijms23158292
Chicago/Turabian StyleKramar, Barbara, Tinkara Pirc Marolt, Maria Monsalve, Dušan Šuput, and Irina Milisav. 2022. "Antipsychotic Drug Aripiprazole Protects Liver Cells from Oxidative Stress" International Journal of Molecular Sciences 23, no. 15: 8292. https://doi.org/10.3390/ijms23158292
APA StyleKramar, B., Pirc Marolt, T., Monsalve, M., Šuput, D., & Milisav, I. (2022). Antipsychotic Drug Aripiprazole Protects Liver Cells from Oxidative Stress. International Journal of Molecular Sciences, 23(15), 8292. https://doi.org/10.3390/ijms23158292