
Dosing Limitation for Intra-Renal Arterial Infusion of Mesenchymal Stromal Cells

 ,
,  , ,
, ,
Abstract
:
1. Introduction
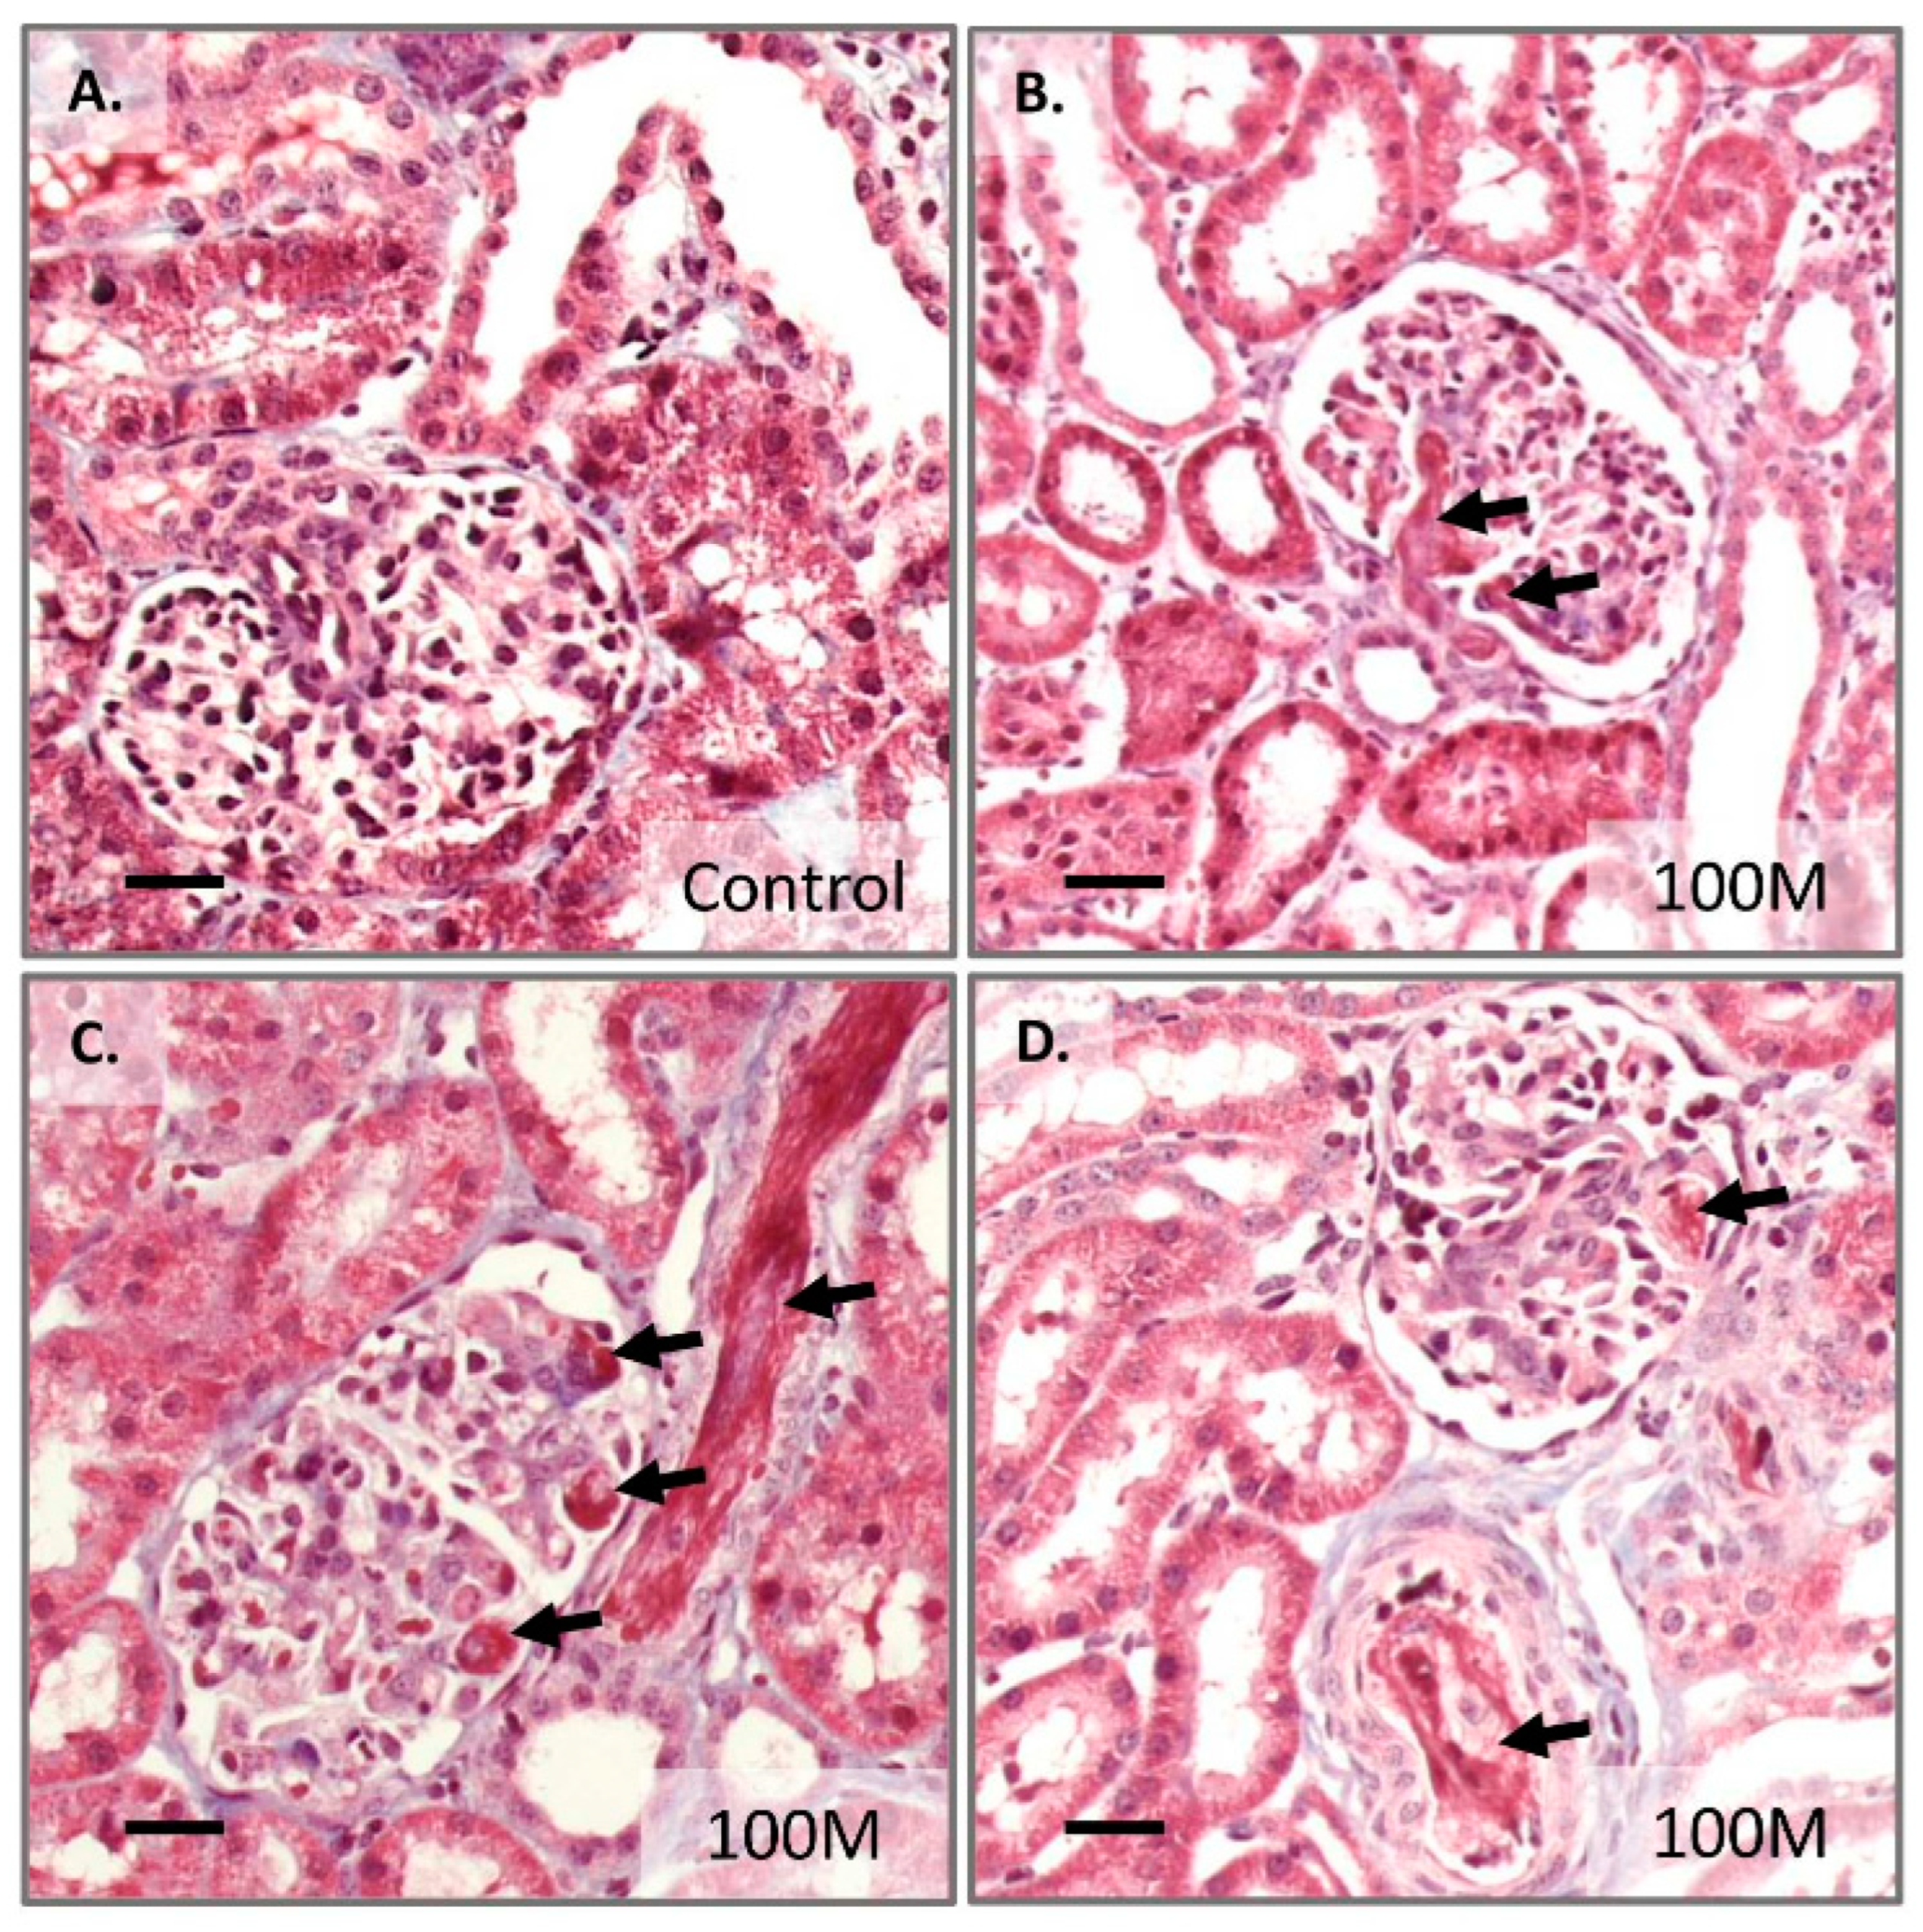
2. Results
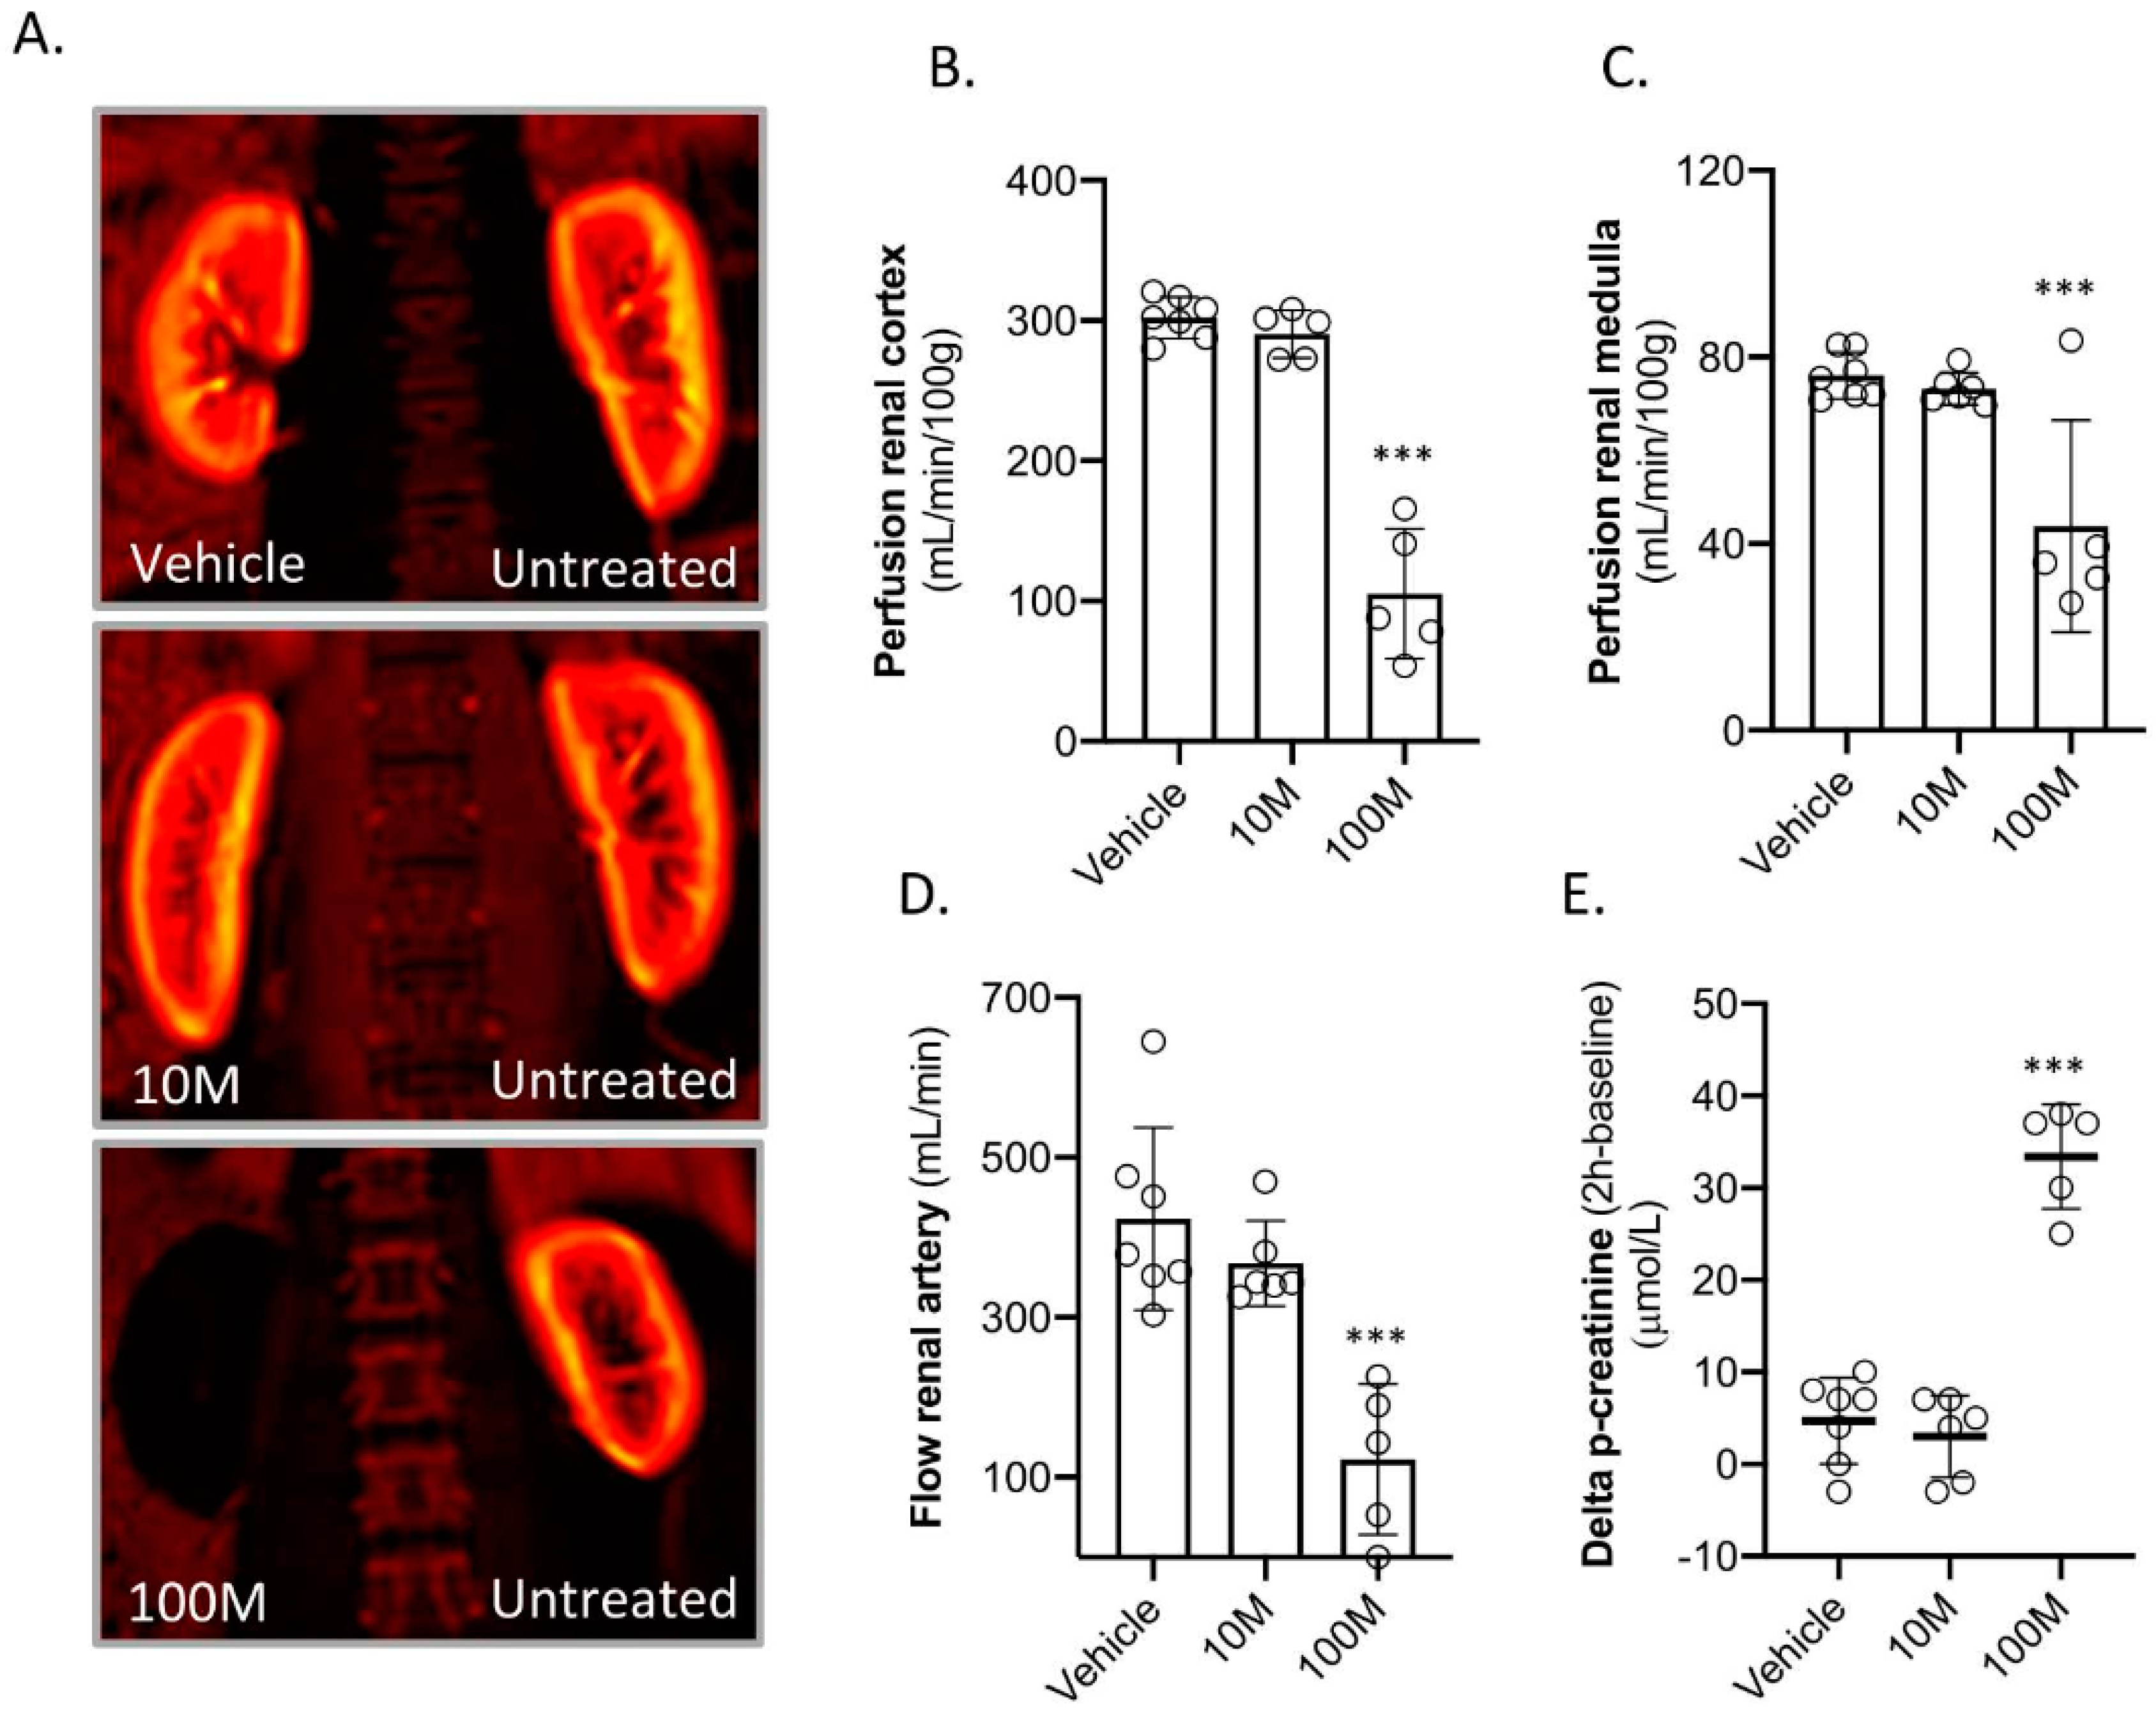
2.1. Kidney Function Directly after Mesenchymal Stem Cell Delivery
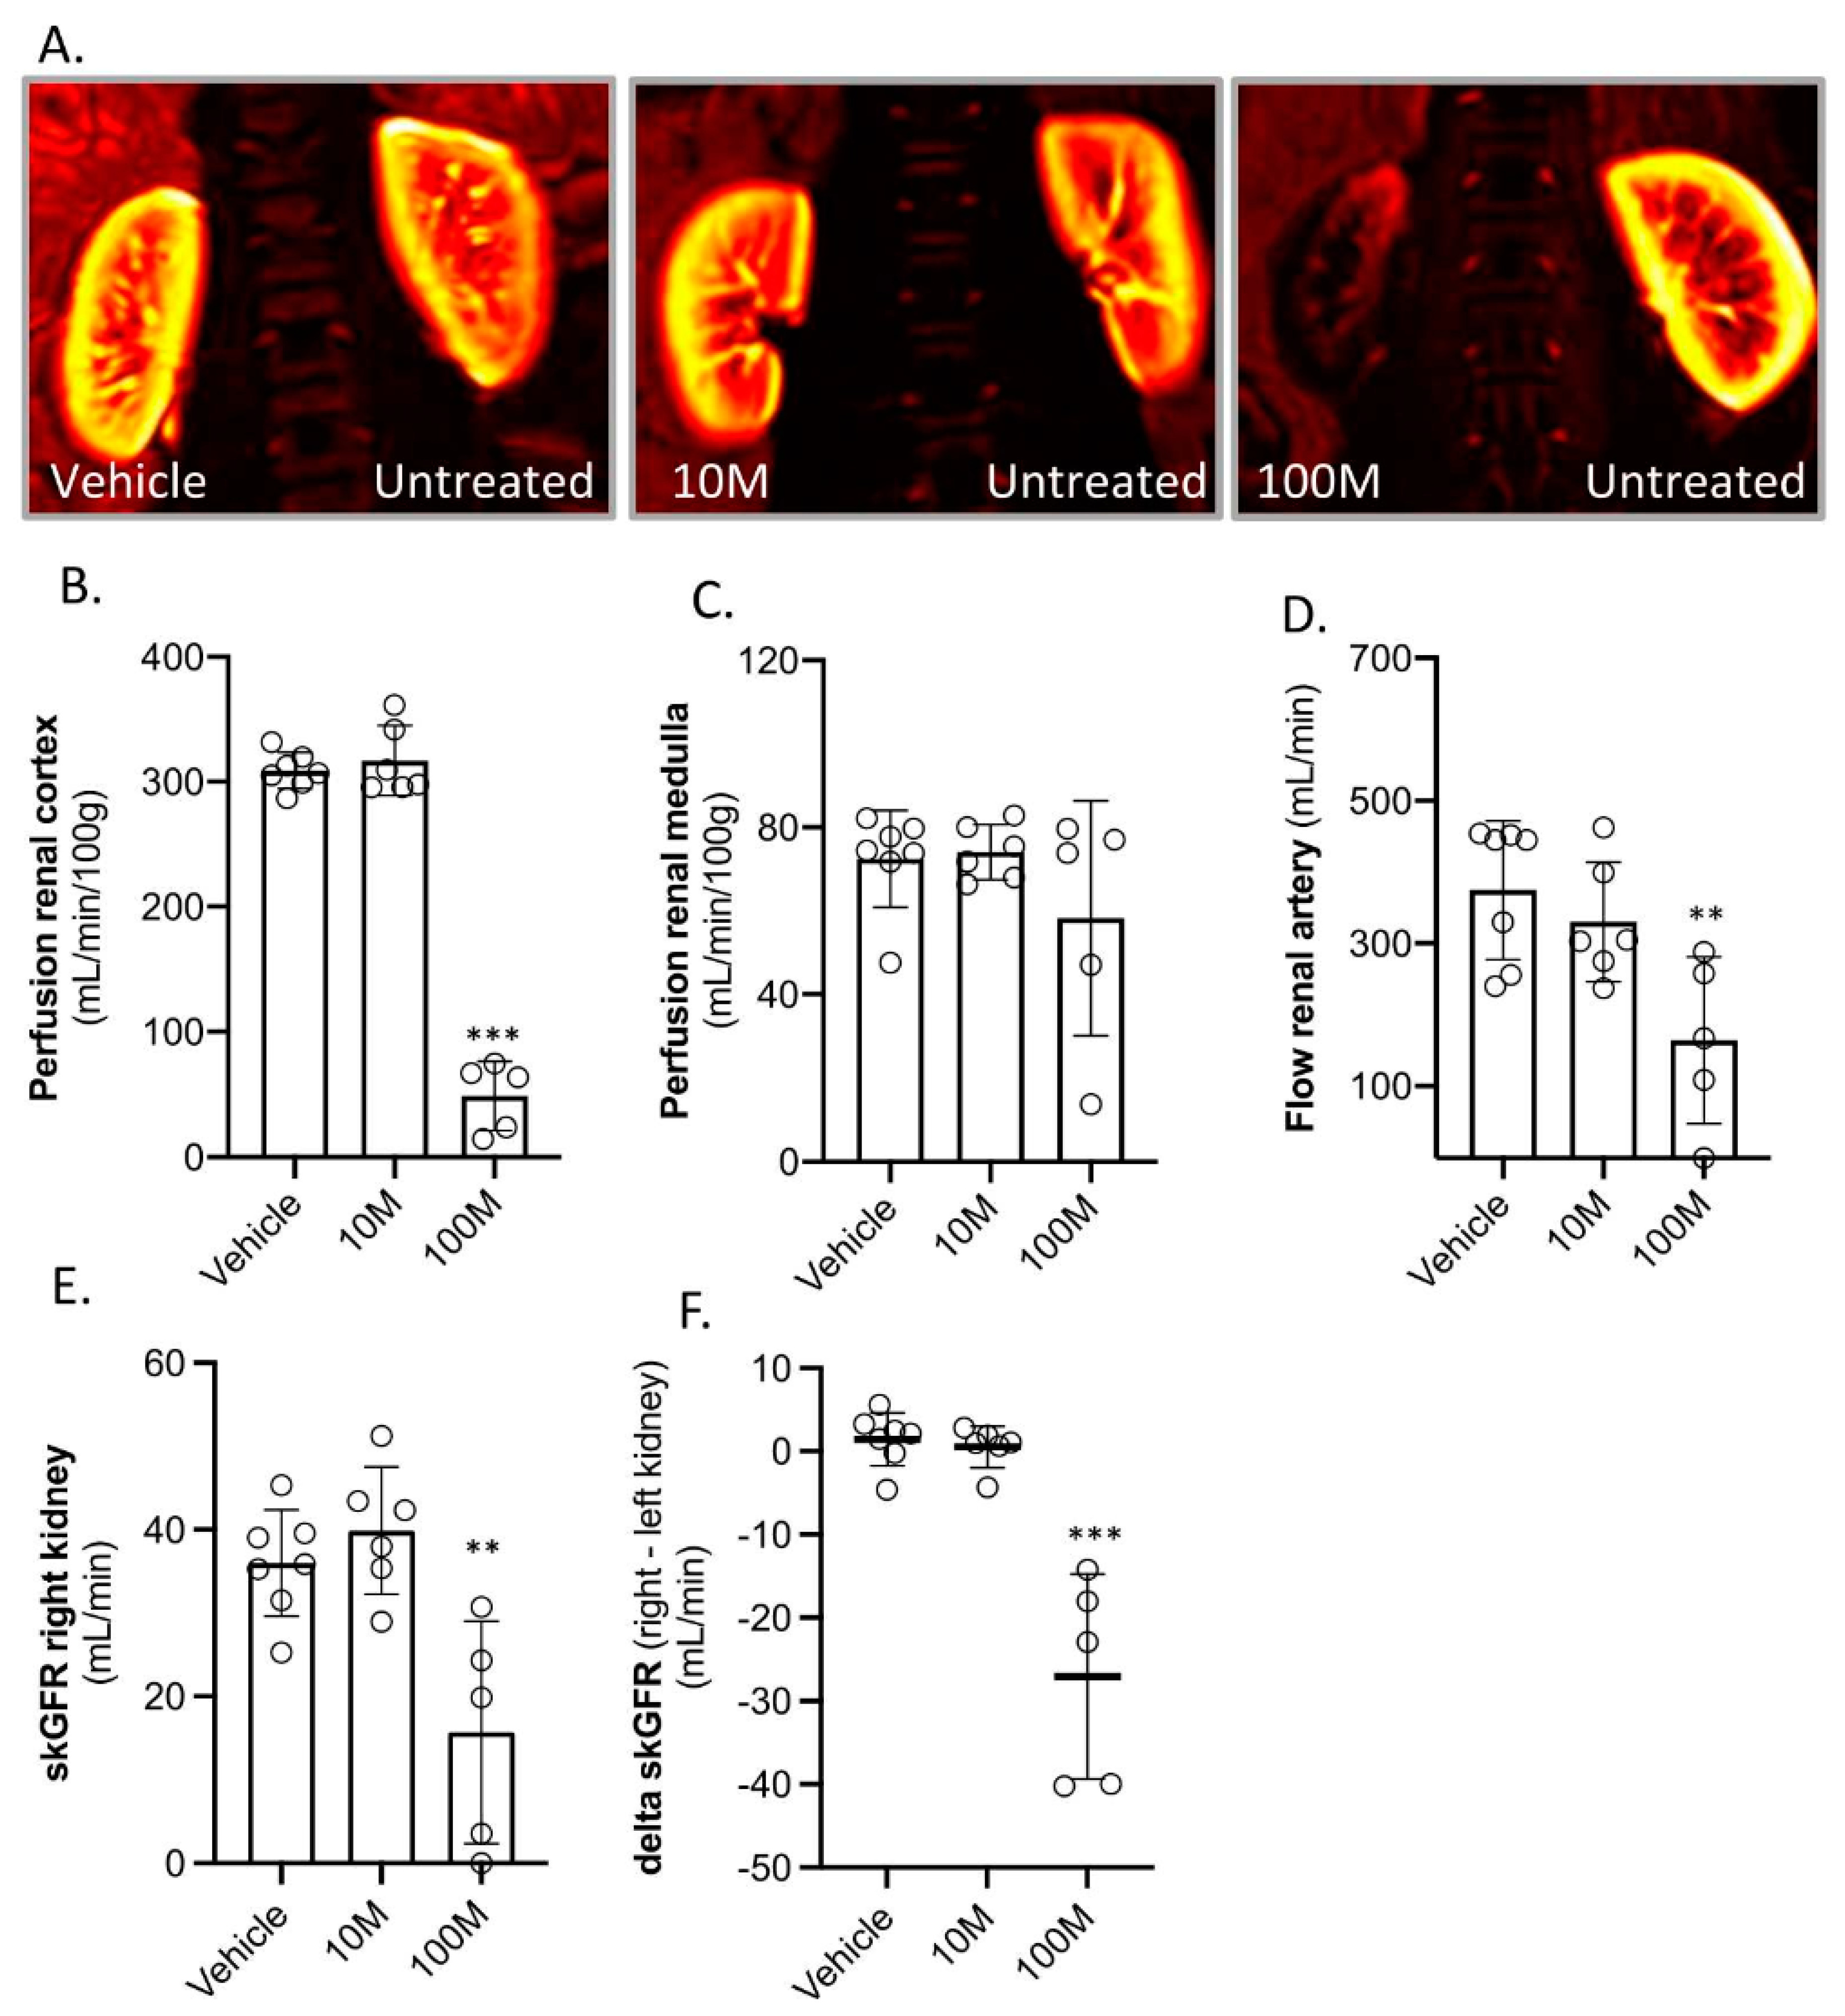
2.2. Kidney Function after Two-Weeks of Follow-Up
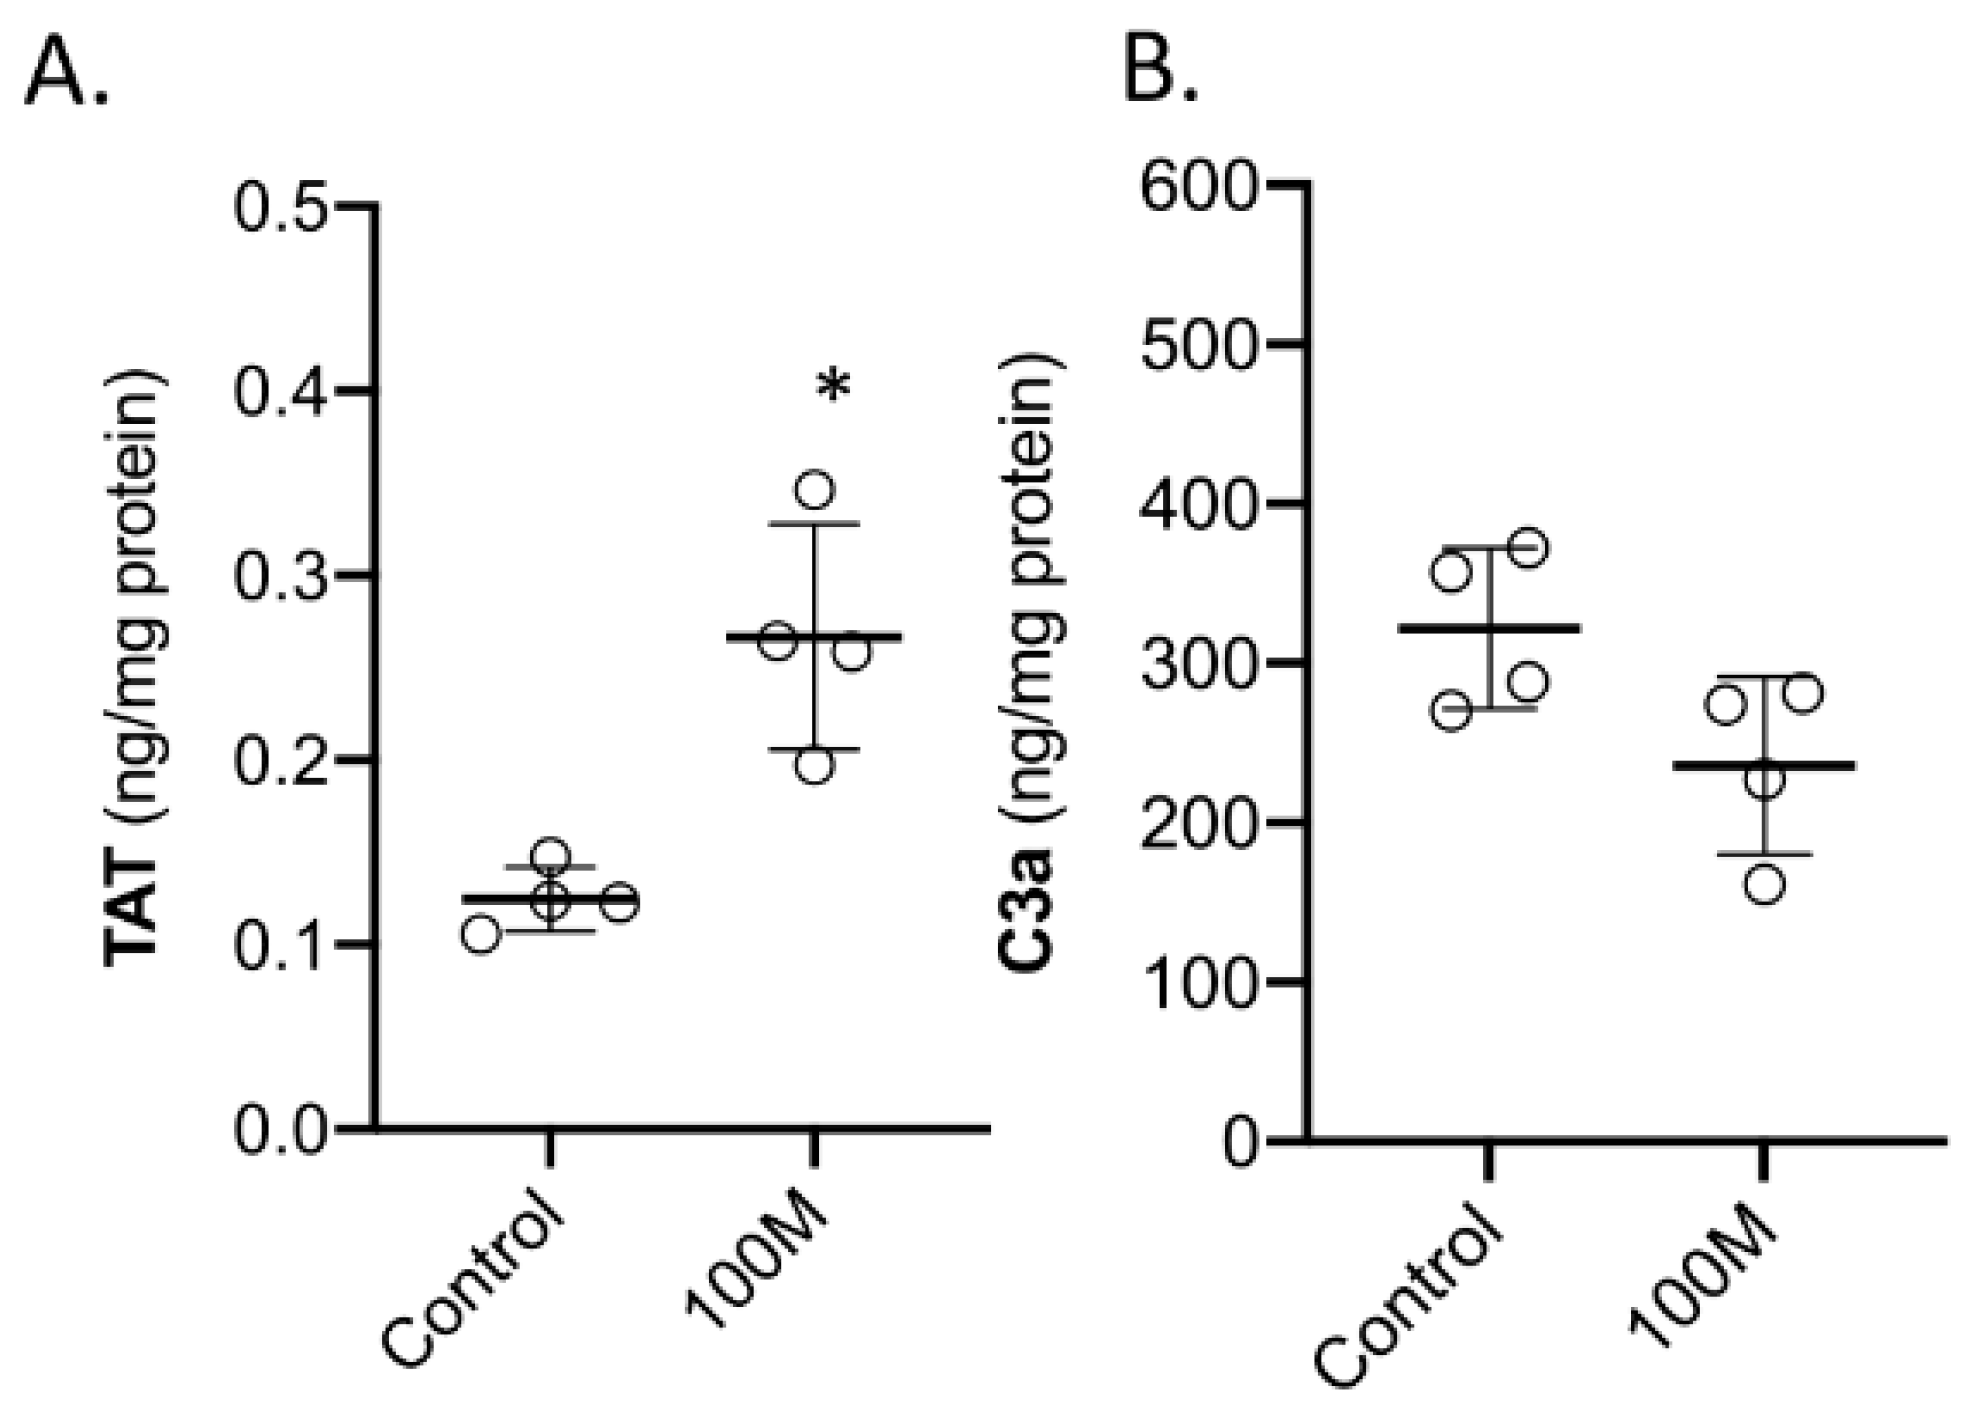
2.3. Acute Effects after High Dose Mesenchymal Stem Cell Administration
3. Discussion
4. Materials and Methods
4.1. Study Design
4.2. Animal Handling
4.3. Ethics
4.4. Infusion of Mesenchymal Stromal Cells
4.5. Mesenchymal Stromal Cell Isolation, Expansion and Administration
4.6. Samples Collection
4.7. Gene Expression Analysis
4.8. Protein Analysis
4.9. Magnetic Resonance Imaging
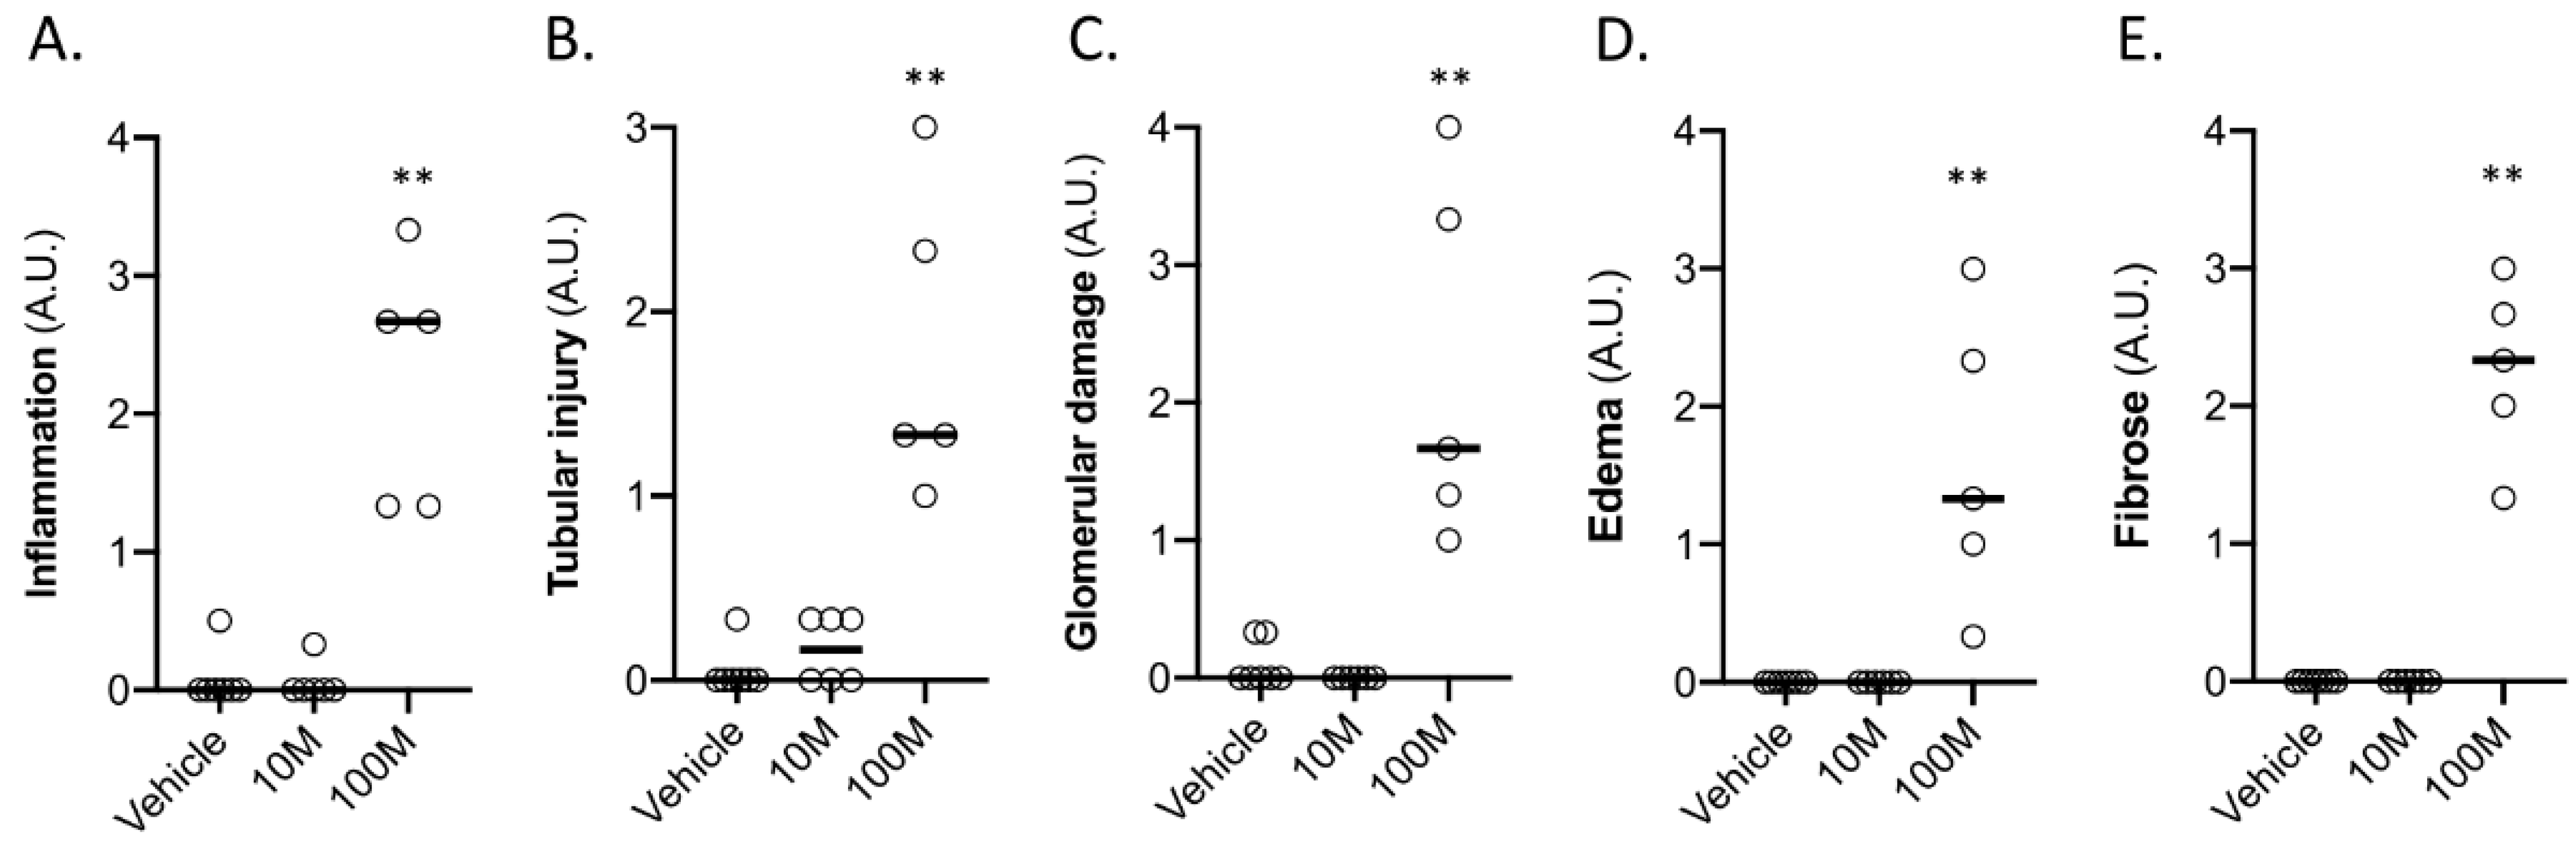
4.10. Histology
4.11. Single Kidney Glomerular Filtration Rate
4.12. Statistical Analysis
Author Contributions
Funding
Institutional Review Board Statement
Data Availability Statement
Acknowledgments
Conflicts of Interest
Abbreviations
| Col1a1 | Collagen Type I alpha 1 chain |
| C3a | Complement factor 3a |
| CKD | Chronic kidney disease |
| skGFR | Single kidney glomerular filtration rate |
| TF | Tissue factor |
| HGF | Hepatocyte growth factor |
| DMSO | Dimethyl sulfoxide |
| GAPDH | Genelyceraldehyde 3-phosphate dehydrogenase |
| IBMIR | Instant blood mediated inflammation reaction |
| IL8 | Interleukin 8 |
| I.M. | Intra-muscular |
| LCN2 | Lipocalin-2 |
| MAC | Minimum alveolar concentration |
| MSC | Mesenchymal stromal cells |
| MRI | Magnetic resonance imaging |
| NOX4 | Nicotinamide adenine dinucleotide phosphate oxidase 4 |
| PBS | Phosphate-buffered saline |
| p-creatinine | Plasma creatinine |
| qPCR | Quantitative real-time polymerase chain reaction |
| TAT | Thrombin-anti thrombin complex |
| VEGF | Vascular endothelial growth factor |
| 51Cr-EDTA | Chromium-51-labeled ethylenediamine tetraacetic acid |
References
- Fazekas, B.; Griffin, M.D. Mesenchymal stromal cell-based therapies for acute kidney injury: Progress in the last decade. Kidney Int. 2020, 97, 1130–1140. [Google Scholar] [CrossRef] [PubMed]
- Casiraghi, F.; Perico, N.; Cortinovis, M.; Remuzzi, G. Mesenchymal stromal cells in renal transplantation: Opportunities and challenges. Nat. Rev. Nephrol. 2016, 12, 241–253. [Google Scholar] [CrossRef] [PubMed]
- Zuk, P.A.; Zhu, M.; Mizuno, H.; Huang, J.; Futrell, J.W.; Katz, A.J.; Benhaim, P.; Lorenz, H.P.; Hedrick, M.H. Multilineage cells from human adipose tissue: Implications for cell-based therapies. Tissue Eng. 2001, 7, 211–228. [Google Scholar] [CrossRef] [Green Version]
- Pereira, R.F.; Halford, K.W.; O’Hara, M.D.; Leeper, D.B.; Sokolov, B.P.; Pollard, M.D.; Bagasra, O.; Prockop, D.J. Cultured adherent cells from marrow can serve as long-lasting precursor cells for bone, cartilage, and lung in irradiated mice. Proc. Natl. Acad. Sci. USA 1995, 92, 4857–4861. [Google Scholar] [CrossRef] [PubMed] [Green Version]
- Fan, X.L.; Zhang, Y.; Li, X.; Fu, Q.L. Mechanisms underlying the protective effects of mesenchymal stem cell-based therapy. Cell. Mol. Life Sci. 2020, 77, 2771–2794. [Google Scholar] [CrossRef] [PubMed] [Green Version]
- Martin, I.; Galipeau, J.; Kessler, C.; Le Blanc, K.; Dazzi, F. Challenges for mesenchymal stromal cell therapies. Sci. Transl. Med. 2019, 11, eaat2189. [Google Scholar] [CrossRef]
- Squillaro, T.; Peluso, G.; Galderisi, U. Clinical Trials With Mesenchymal Stem Cells: An Update. Cell Transplant. 2016, 25, 829–848. [Google Scholar] [CrossRef] [Green Version]
- Moll, G.; Ankrum, J.A.; Kamhieh-Milz, J.; Bieback, K.; Ringdén, O.; Volk, H.D.; Geissler, S.; Reinke, P. Intravascular Mesenchymal Stromal/Stem Cell Therapy Product Diversification: Time for New Clinical Guidelines. Trends Mol. Med. 2019, 25, 149–163. [Google Scholar] [CrossRef] [Green Version]
- Lira, R.; Oliveira, M.; Martins, M.; Silva, C.; Carvalho, S.; Stumbo, A.C.; Cortez, E.; Verdoorn, K.; Einicker-Lamas, M.; Thole, A.; et al. Transplantation of bone marrow-derived MSCs improves renal function and Na(+)+K(+)-ATPase activity in rats with renovascular hypertension. Cell Tissue Res. 2017, 369, 287–301. [Google Scholar] [CrossRef]
- Yun, C.W.; Lee, S.H. Potential and Therapeutic Efficacy of Cell-based Therapy Using Mesenchymal Stem Cells for Acute/chronic Kidney Disease. Int. J. Mol. Sci. 2019, 20, 1619. [Google Scholar] [CrossRef] [Green Version]
- Geng, Y.; Zhang, L.; Fu, B.; Zhang, J.; Hong, Q.; Hu, J.; Li, D.; Luo, C.; Cui, S.; Zhu, F.; et al. Mesenchymal stem cells ameliorate rhabdomyolysis-induced acute kidney injury via the activation of M2 macrophages. Stem Cell Res. Ther. 2014, 5, 80. [Google Scholar] [CrossRef] [Green Version]
- Swaminathan, M.; Stafford-Smith, M.; Chertow, G.M.; Warnock, D.G.; Paragamian, V.; Brenner, R.M.; Lellouche, F.; Fox-Robichaud, A.; Atta, M.G.; Melby, S.; et al. Allogeneic Mesenchymal Stem Cells for Treatment of AKI after Cardiac Surgery. J. Am. Soc. Nephrol. 2018, 29, 260–267. [Google Scholar] [CrossRef] [PubMed] [Green Version]
- Reinders, M.E.J.; Groeneweg, K.E.; Hendriks, S.H.; Bank, J.R.; Dreyer, G.J.; de Vries, A.P.J.; van Pel, M.; Roelofs, H.; Huurman, V.A.L.; Meij, P.; et al. Autologous bone marrow-derived mesenchymal stromal cell therapy with early tacrolimus withdrawal: The randomized prospective, single-center, open-label TRITON study. Am. J. Transplant. 2021, 21, 3055–3065. [Google Scholar] [CrossRef] [PubMed]
- Dreyer, G.J.; Groeneweg, K.E.; Heidt, S.; Roelen, D.L.; van Pel, M.; Roelofs, H.; Huurman, V.A.L.; Bajema, I.M.; Moes, D.; Fibbe, W.E.; et al. Human leukocyte antigen selected allogeneic mesenchymal stromal cell therapy in renal transplantation: The Neptune study, a phase I single-center study. Am. J. Transplant. 2020, 20, 2905–2915. [Google Scholar] [CrossRef] [PubMed]
- Wang, Y.; Yi, H.; Song, Y. The safety of MSC therapy over the past 15 years: A meta-analysis. Stem Cell Res. Ther. 2021, 12, 545. [Google Scholar] [CrossRef] [PubMed]
- Thompson, M.; Mei, S.H.J.; Wolfe, D.; Champagne, J.; Fergusson, D.; Stewart, D.J.; Sullivan, K.J.; Doxtator, E.; Lalu, M.; English, S.W.; et al. Cell therapy with intravascular administration of mesenchymal stromal cells continues to appear safe: An updated systematic review and meta-analysis. EClinicalMedicine 2020, 19, 100249. [Google Scholar] [CrossRef] [Green Version]
- Lalu, M.M.; McIntyre, L.; Pugliese, C.; Fergusson, D.; Winston, B.W.; Marshall, J.C.; Granton, J.; Stewart, D.J.; Canadian Critical Care Trials, G. Safety of cell therapy with mesenchymal stromal cells (SafeCell): A systematic review and meta-analysis of clinical trials. PLoS ONE 2012, 7, e47559. [Google Scholar] [CrossRef]
- Eggenhofer, E.; Benseler, V.; Kroemer, A.; Popp, F.C.; Geissler, E.K.; Schlitt, H.J.; Baan, C.C.; Dahlke, M.H.; Hoogduijn, M.J. Mesenchymal stem cells are short-lived and do not migrate beyond the lungs after intravenous infusion. Front Immunol. 2012, 3, 297. [Google Scholar] [CrossRef] [Green Version]
- Zhuo, W.; Liao, L.; Fu, Y.; Xu, T.; Wu, W.; Yang, S.; Tan, J. Efficiency of endovenous versus arterial administration of mesenchymal stem cells for ischemia-reperfusion-induced renal dysfunction in rats. Transplant. Proc. 2013, 45, 503–510. [Google Scholar] [CrossRef]
- Sierra-Parraga, J.M.; Munk, A.; Andersen, C.; Lohmann, S.; Moers, C.; Baan, C.C.; Ploeg, R.J.; Pool, M.; Keller, A.K.; Moller, B.K.; et al. Mesenchymal Stromal Cells Are Retained in the Porcine Renal Cortex Independently of Their Metabolic State After Renal Intra-Arterial Infusion. Stem Cells Dev. 2019, 28, 1224–1235. [Google Scholar] [CrossRef]
- Behr, L.; Hekmati, M.; Fromont, G.; Borenstein, N.; Noel, L.H.; Lelievre-Pegorier, M.; Laborde, K. Intra renal arterial injection of autologous mesenchymal stem cells in an ovine model in the postischemic kidney. Nephron Physiol. 2007, 107, p65–p76. [Google Scholar] [CrossRef]
- Moghadasali, R.; Azarnia, M.; Hajinasrollah, M.; Arghani, H.; Nassiri, S.M.; Molazem, M.; Vosough, A.; Mohitmafi, S.; Najarasl, M.; Ajdari, Z.; et al. Intra-renal arterial injection of autologous bone marrow mesenchymal stromal cells ameliorates cisplatin-induced acute kidney injury in a rhesus Macaque mulatta monkey model. Cytotherapy 2014, 16, 734–749. [Google Scholar] [CrossRef]
- Eirin, A.; Zhu, X.Y.; Krier, J.D.; Tang, H.; Jordan, K.L.; Grande, J.P.; Lerman, A.; Textor, S.C.; Lerman, L.O. Adipose tissue-derived mesenchymal stem cells improve revascularization outcomes to restore renal function in swine atherosclerotic renal artery stenosis. Stem Cells 2012, 30, 1030–1041. [Google Scholar] [CrossRef] [PubMed] [Green Version]
- Thompson, E.R.; Bates, L.; Ibrahim, I.K.; Sewpaul, A.; Stenberg, B.; McNeill, A.; Figueiredo, R.; Girdlestone, T.; Wilkins, G.C.; Wang, L.; et al. Novel delivery of cellular therapy to reduce ischemia reperfusion injury in kidney transplantation. Am. J. Transplant. 2021, 21, 1402–1414. [Google Scholar] [CrossRef]
- Lohmann, S.; Pool, M.B.F.; Rozenberg, K.M.; Keller, A.K.; Moers, C.; Moldrup, U.; Moller, B.K.; Lignell, S.J.M.; Krag, S.; Sierra-Parraga, J.M.; et al. Mesenchymal stromal cell treatment of donor kidneys during ex vivo normothermic machine perfusion: A porcine renal autotransplantation study. Am. J. Transplant. 2021, 21, 2348–2359. [Google Scholar] [CrossRef] [PubMed]
- Pool, M.B.F.; Vos, J.; Eijken, M.; van Pel, M.; Reinders, M.E.J.; Ploeg, R.J.; Hoogduijn, M.J.; Jespersen, B.; Leuvenink, H.G.D.; Moers, C. Treating Ischemically Damaged Porcine Kidneys with Human Bone Marrow- and Adipose Tissue-Derived Mesenchymal Stromal Cells During Ex Vivo Normothermic Machine Perfusion. Stem Cells Dev. 2020, 29, 1320–1330. [Google Scholar] [CrossRef]
- Abumoawad, A.; Saad, A.; Ferguson, C.M.; Eirin, A.; Herrmann, S.M.; Hickson, L.J.; Goksu, B.B.; Bendel, E.; Misra, S.; Glockner, J.; et al. In a Phase 1a escalating clinical trial, autologous mesenchymal stem cell infusion for renovascular disease increases blood flow and the glomerular filtration rate while reducing inflammatory biomarkers and blood pressure. Kidney Int. 2020, 97, 793–804. [Google Scholar] [CrossRef] [Green Version]
- Saad, A.; Dietz, A.B.; Herrmann, S.M.S.; Hickson, L.J.; Glockner, J.F.; McKusick, M.A.; Misra, S.; Bjarnason, H.; Armstrong, A.S.; Gastineau, D.A.; et al. Autologous Mesenchymal Stem Cells Increase Cortical Perfusion in Renovascular Disease. J. Am. Soc. Nephrol. 2017, 28, 2777–2785. [Google Scholar] [CrossRef] [PubMed] [Green Version]
- Kunter, U.; Rong, S.; Djuric, Z.; Boor, P.; Muller-Newen, G.; Yu, D.; Floege, J. Transplanted mesenchymal stem cells accelerate glomerular healing in experimental glomerulonephritis. J. Am. Soc. Nephrol. 2006, 17, 2202–2212. [Google Scholar] [CrossRef] [Green Version]
- Pool, M.; Eertman, T.; Sierra Parraga, J.; ‘t Hart, N.; Roemeling-van Rhijn, M.; Eijken, M.; Jespersen, B.; Reinders, M.; Hoogduijn, M.; Ploeg, R.; et al. Infusing Mesenchymal Stromal Cells into Porcine Kidneys during Normothermic Machine Perfusion: Intact MSCs Can Be Traced and Localised to Glomeruli. Int. J. Mol. Sci. 2019, 20, 3607. [Google Scholar] [CrossRef] [Green Version]
- Moll, G.; Rasmusson-Duprez, I.; von Bahr, L.; Connolly-Andersen, A.M.; Elgue, G.; Funke, L.; Hamad, O.A.; Lönnies, H.; Magnusson, P.U.; Sanchez, J.; et al. Are therapeutic human mesenchymal stromal cells compatible with human blood? Stem Cells 2012, 30, 1565–1574. [Google Scholar] [CrossRef] [PubMed] [Green Version]
- Huaman, O.; Bahamonde, J.; Cahuascanco, B.; Jervis, M.; Palomino, J.; Torres, C.G.; Peralta, O.A. Immunomodulatory and immunogenic properties of mesenchymal stem cells derived from bovine fetal bone marrow and adipose tissue. Res. Vet. Sci. 2019, 124, 212–222. [Google Scholar] [CrossRef] [PubMed]
- Moll, G.; Jitschin, R.; von Bahr, L.; Rasmusson-Duprez, I.; Sundberg, B.; Lönnies, L.; Elgue, G.; Nilsson-Ekdahl, K.; Mougiakakos, D.; Lambris, J.D.; et al. Mesenchymal stromal cells engage complement and complement receptor bearing innate effector cells to modulate immune responses. PLoS ONE 2011, 6, e21703. [Google Scholar] [CrossRef]
- Jung, J.W.; Kwon, M.; Choi, J.C.; Shin, J.W.; Park, I.W.; Choi, B.W.; Kim, J.Y. Familial occurrence of pulmonary embolism after intravenous, adipose tissue-derived stem cell therapy. Yonsei Med. J. 2013, 54, 1293–1296. [Google Scholar] [CrossRef] [Green Version]
- Perlee, D.; van Vught, L.A.; Scicluna, B.P.; Maag, A.; Lutter, R.; Kemper, E.M.; van ‘t Veer, C.; Punchard, M.A.; Gonzalez, J.; Richard, M.P.; et al. Intravenous Infusion of Human Adipose Mesenchymal Stem Cells Modifies the Host Response to Lipopolysaccharide in Humans: A Randomized, Single-Blind, Parallel Group, Placebo Controlled Trial. Stem Cells 2018, 36, 1778–1788. [Google Scholar] [CrossRef] [Green Version]
- Moll, G.; Hult, A.; von Bahr, L.; Alm, J.J.; Heldring, N.; Hamad, O.A.; Stenbeck-Funke, L.; Larsson, S.; Teramura, Y.; Roelofs, H.; et al. Do ABO blood group antigens hamper the therapeutic efficacy of mesenchymal stromal cells? PLoS ONE 2014, 9, e85040. [Google Scholar] [CrossRef] [PubMed] [Green Version]
- Ji, M.; Yi, S.; Smith-Hurst, H.; Phillips, P.; Wu, J.; Hawthorne, W.; O’Connell, P. The importance of tissue factor expression by porcine NICC in triggering IBMIR in the xenograft setting. Transplantation 2011, 91, 841–846. [Google Scholar] [CrossRef]
- Stephenne, X.; Nicastro, E.; Eeckhoudt, S.; Hermans, C.; Nyabi, O.; Lombard, C.; Najimi, M.; Sokal, E. Bivalirudin in combination with heparin to control mesenchymal cell procoagulant activity. PLoS ONE 2012, 7, e42819. [Google Scholar] [CrossRef]
- Liao, L.; Shi, B.; Chang, H.; Su, X.; Zhang, L.; Bi, C.; Shuai, Y.; Du, X.; Deng, Z.; Jin, Y. Heparin improves BMSC cell therapy: Anticoagulant treatment by heparin improves the safety and therapeutic effect of bone marrow-derived mesenchymal stem cell cytotherapy. Theranostics 2017, 7, 106–116. [Google Scholar] [CrossRef]
- Seeger, F.H.; Rasper, T.; Fischer, A.; Muhly-Reinholz, M.; Hergenreider, E.; Leistner, D.M.; Sommer, K.; Manavski, Y.; Henschler, R.; Chavakis, E.; et al. Heparin disrupts the CXCR4/SDF-1 axis and impairs the functional capacity of bone marrow-derived mononuclear cells used for cardiovascular repair. Circ. Res. 2012, 111, 854–862. [Google Scholar] [CrossRef] [Green Version]
- Thangakunam, B.; Christopher, D.J. Allogeneic Human Mesenchymal Stem Cells in Patients With Idiopathic Pulmonary Fibrosis: Well Done, but Subsequent Doses May Be Vital. Chest 2018, 153, 287. [Google Scholar] [CrossRef] [PubMed]
- Wang, S.; Li, Y.; Zhao, J.; Zhang, J.; Huang, Y. Mesenchymal stem cells ameliorate podocyte injury and proteinuria in a type 1 diabetic nephropathy rat model. Biol. Blood Marrow Transplant. 2013, 19, 538–546. [Google Scholar] [CrossRef] [Green Version]
- Cai, J.; Yu, X.; Xu, R.; Fang, Y.; Qian, X.; Liu, S.; Teng, J.; Ding, X. Maximum efficacy of mesenchymal stem cells in rat model of renal ischemia-reperfusion injury: Renal artery administration with optimal numbers. PLoS ONE 2014, 9, e92347. [Google Scholar] [CrossRef] [PubMed]
- Hayes, A.F.; Cai, L. Further evaluating the conditional decision rule for comparing two independent means. Br. J. Math. Stat. Psychol. 2007, 60, 217–244. [Google Scholar] [CrossRef] [PubMed]


| Baseline | Day 14 | ||||||||
|---|---|---|---|---|---|---|---|---|---|
| Body Weight (kg) | MSC Dose (×105/kg Body Weight) | P- Creatinine (µmol/L) | P-CRP (mg/L) | Body Weight (kg) | Left Kidney (g) | Treated Right Kidney (g) | P- Creatinine (µmol/L) | P-CRP (mg/L) | |
| Vehicle (n = 7) (25 mL PBS) | 40.4 (36.3–44.4) | 0 | 110 (92.0–153) | <4 | 44.4 (39.3–48.5) | 96.7 (71.2–128) | 99.4 (76.2–127) | 130 (96.0–162) | <4 |
| 10 m (n = 6) (107 MSCs/kidney) | 42.6 (39.0–45.6) | 2.4 (2.2–2.6) | 110 (91.0–128) | <4 | 46.8 (43.1–50.4) | 114 (92.0–153) | 113 (85.0–160) | 137 (122–153) | <4 |
| 100 m (n = 5) (108 MSCs/kidney) | 41.2 (39.4–43.0) | 24 (23–25) | 111 (100–139) | <4 | 43.7 (39.4–46.5) | 115 (98.5–127) | 96.6 (76.6–118) | 141 (118–172) | <4 |
Publisher’s Note: MDPI stays neutral with regard to jurisdictional claims in published maps and institutional affiliations. |
© 2022 by the authors. Licensee MDPI, Basel, Switzerland. This article is an open access article distributed under the terms and conditions of the Creative Commons Attribution (CC BY) license (https://creativecommons.org/licenses/by/4.0/).
Share and Cite
Munk, A.; Duvald, C.S.; Pedersen, M.; Lohmann, S.; Keller, A.K.; Møller, B.K.; Ringgaard, S.; Buus, N.H.; Jespersen, B.; Eijken, M. Dosing Limitation for Intra-Renal Arterial Infusion of Mesenchymal Stromal Cells. Int. J. Mol. Sci. 2022, 23, 8268. https://doi.org/10.3390/ijms23158268
Munk A, Duvald CS, Pedersen M, Lohmann S, Keller AK, Møller BK, Ringgaard S, Buus NH, Jespersen B, Eijken M. Dosing Limitation for Intra-Renal Arterial Infusion of Mesenchymal Stromal Cells. International Journal of Molecular Sciences. 2022; 23(15):8268. https://doi.org/10.3390/ijms23158268
Chicago/Turabian StyleMunk, Anders, Christina Søndergaard Duvald, Michael Pedersen, Stine Lohmann, Anna Krarup Keller, Bjarne Kuno Møller, Steffen Ringgaard, Niels Henrik Buus, Bente Jespersen, and Marco Eijken. 2022. "Dosing Limitation for Intra-Renal Arterial Infusion of Mesenchymal Stromal Cells" International Journal of Molecular Sciences 23, no. 15: 8268. https://doi.org/10.3390/ijms23158268
APA StyleMunk, A., Duvald, C. S., Pedersen, M., Lohmann, S., Keller, A. K., Møller, B. K., Ringgaard, S., Buus, N. H., Jespersen, B., & Eijken, M. (2022). Dosing Limitation for Intra-Renal Arterial Infusion of Mesenchymal Stromal Cells. International Journal of Molecular Sciences, 23(15), 8268. https://doi.org/10.3390/ijms23158268