
Removal of MuRF1 Increases Muscle Mass in Nemaline Myopathy Models, but Does Not Provide Functional Benefits

 , , ,
, , , 
Abstract
:1. Introduction
2. Results
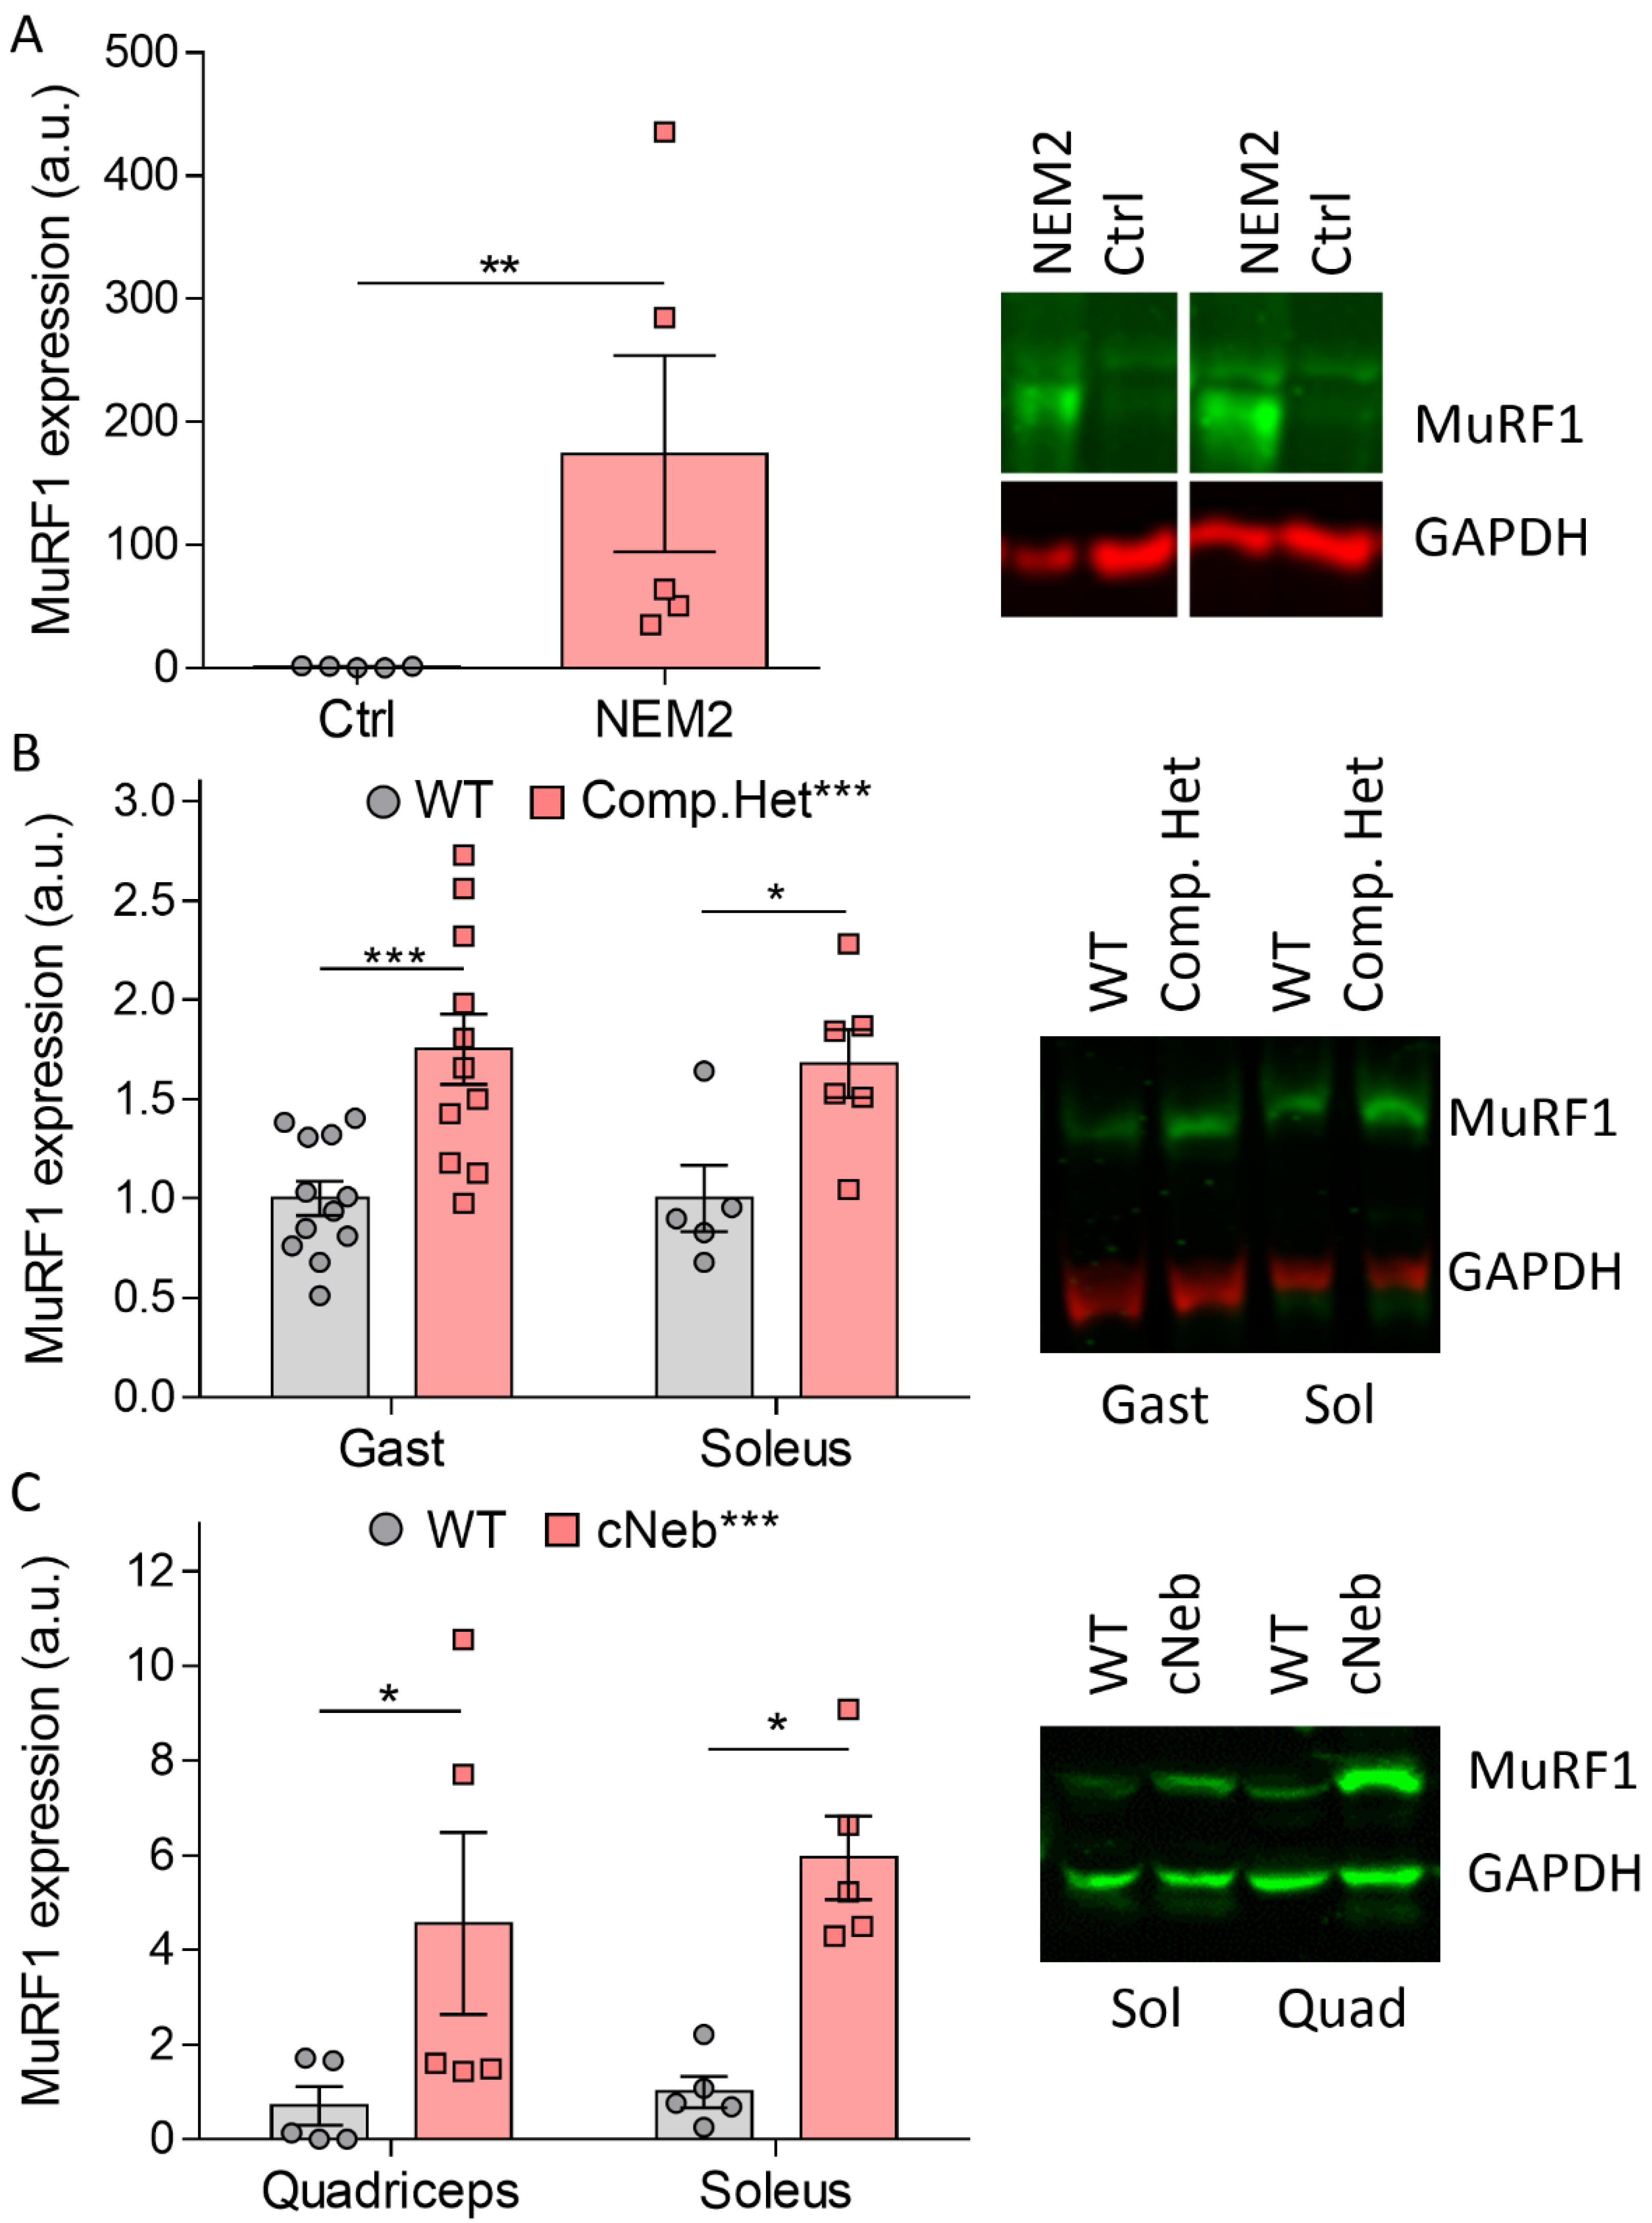
2.1. MuRF1 Protein Expression in NEM2
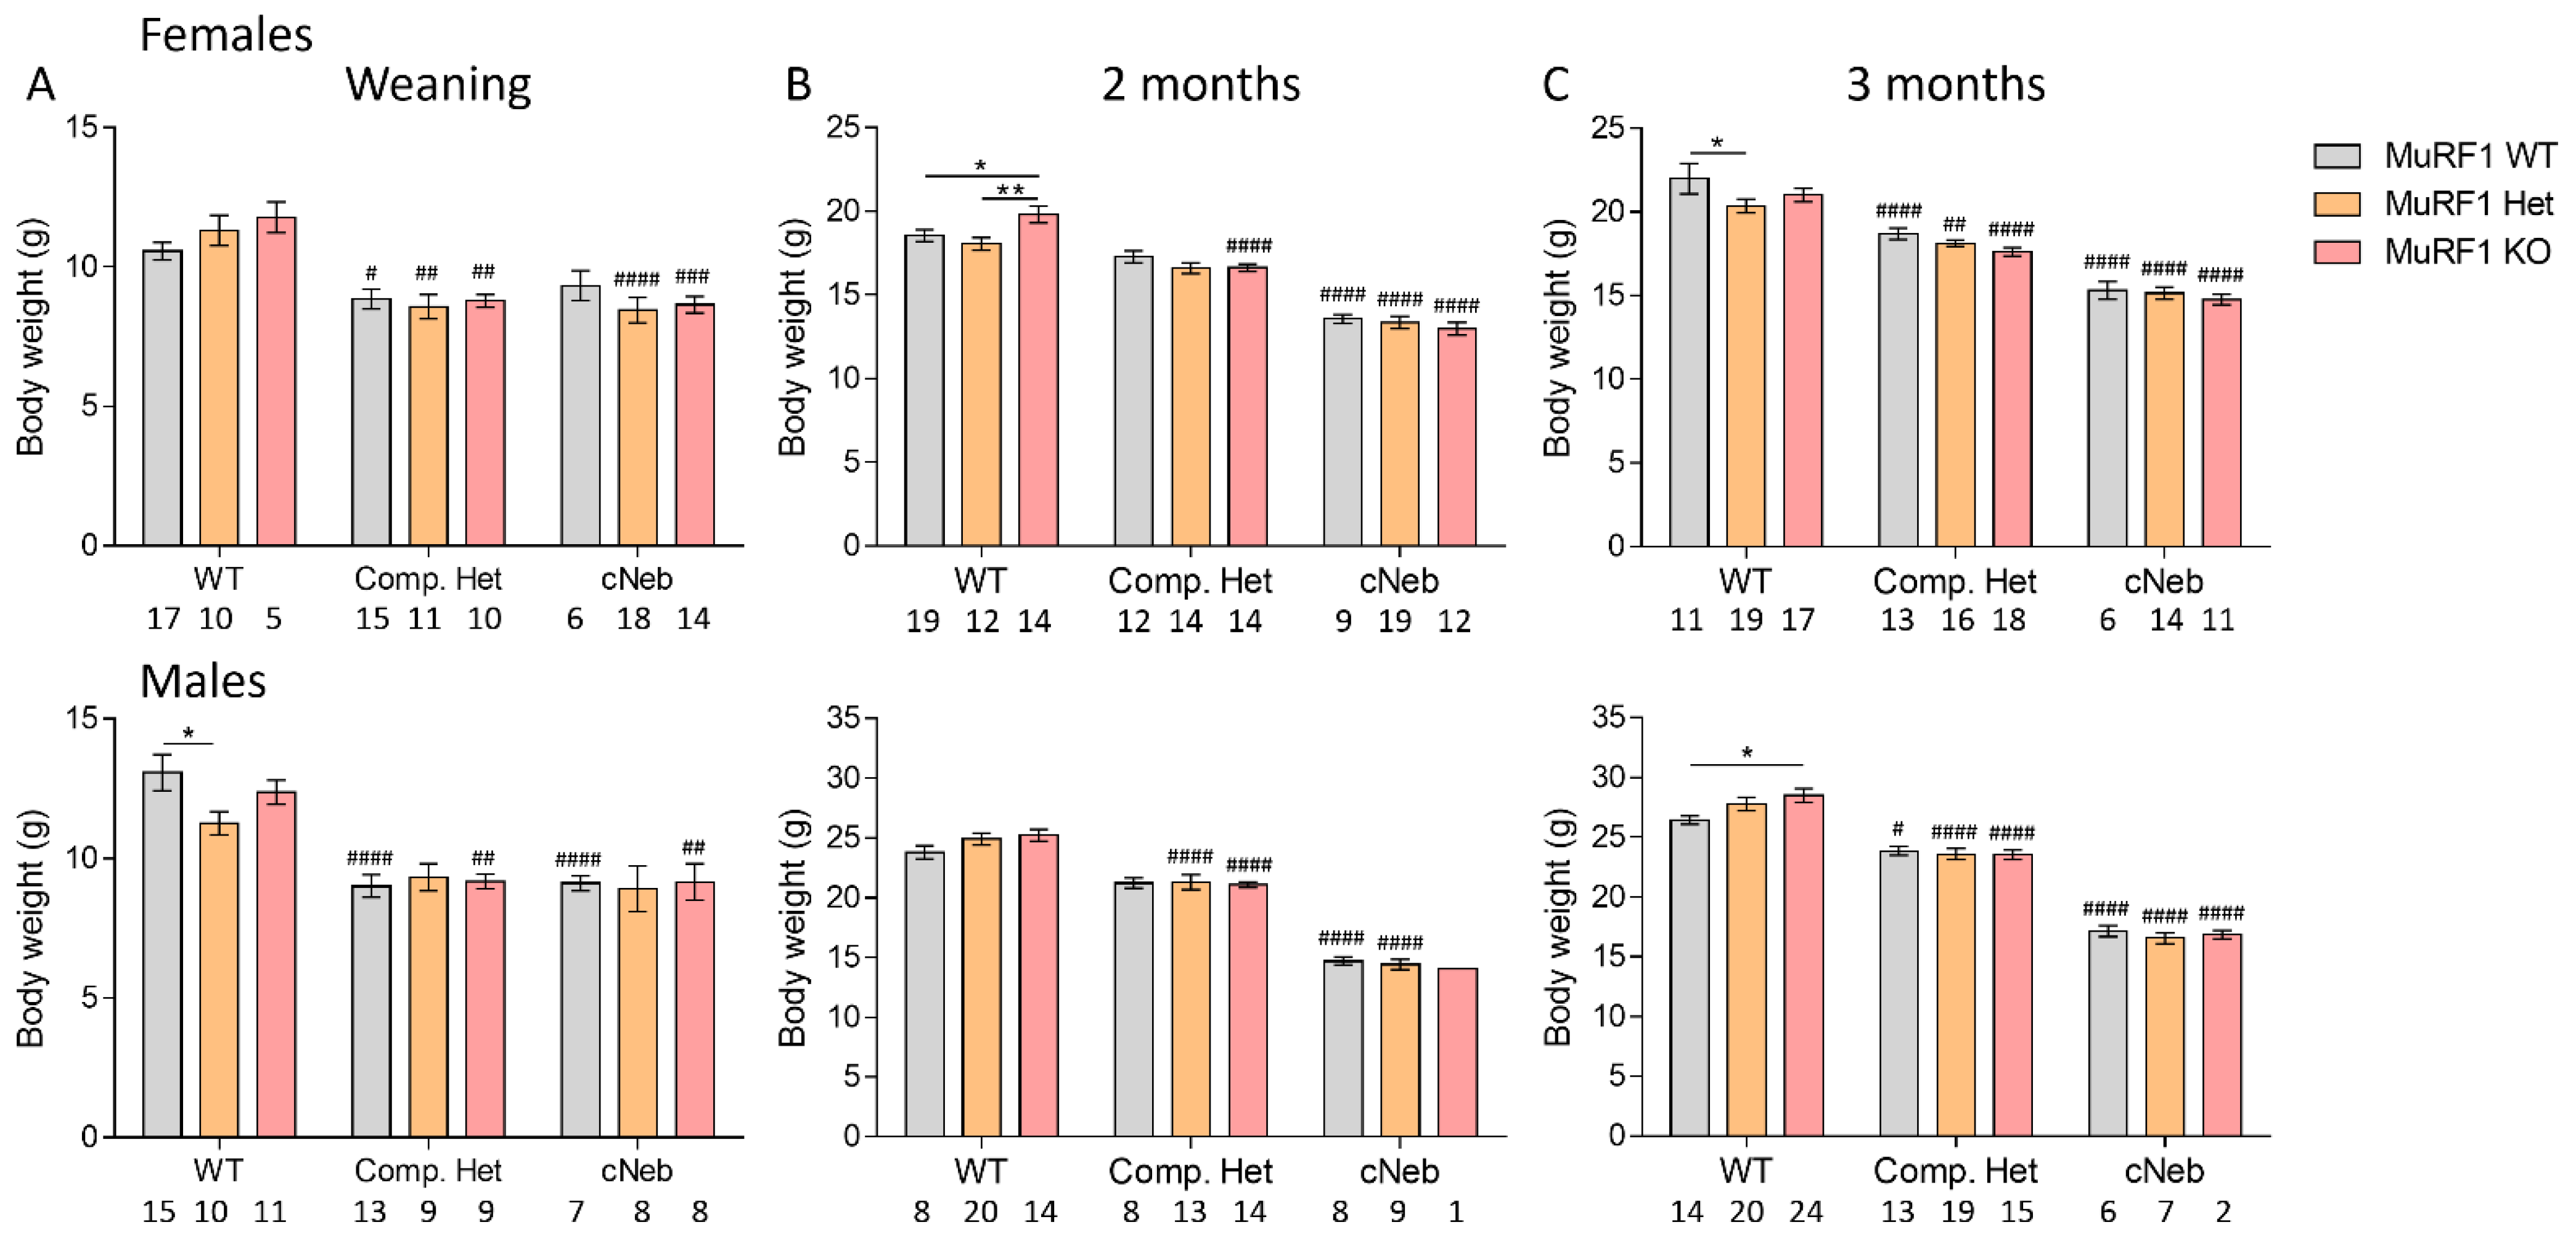
2.2. Body Weights
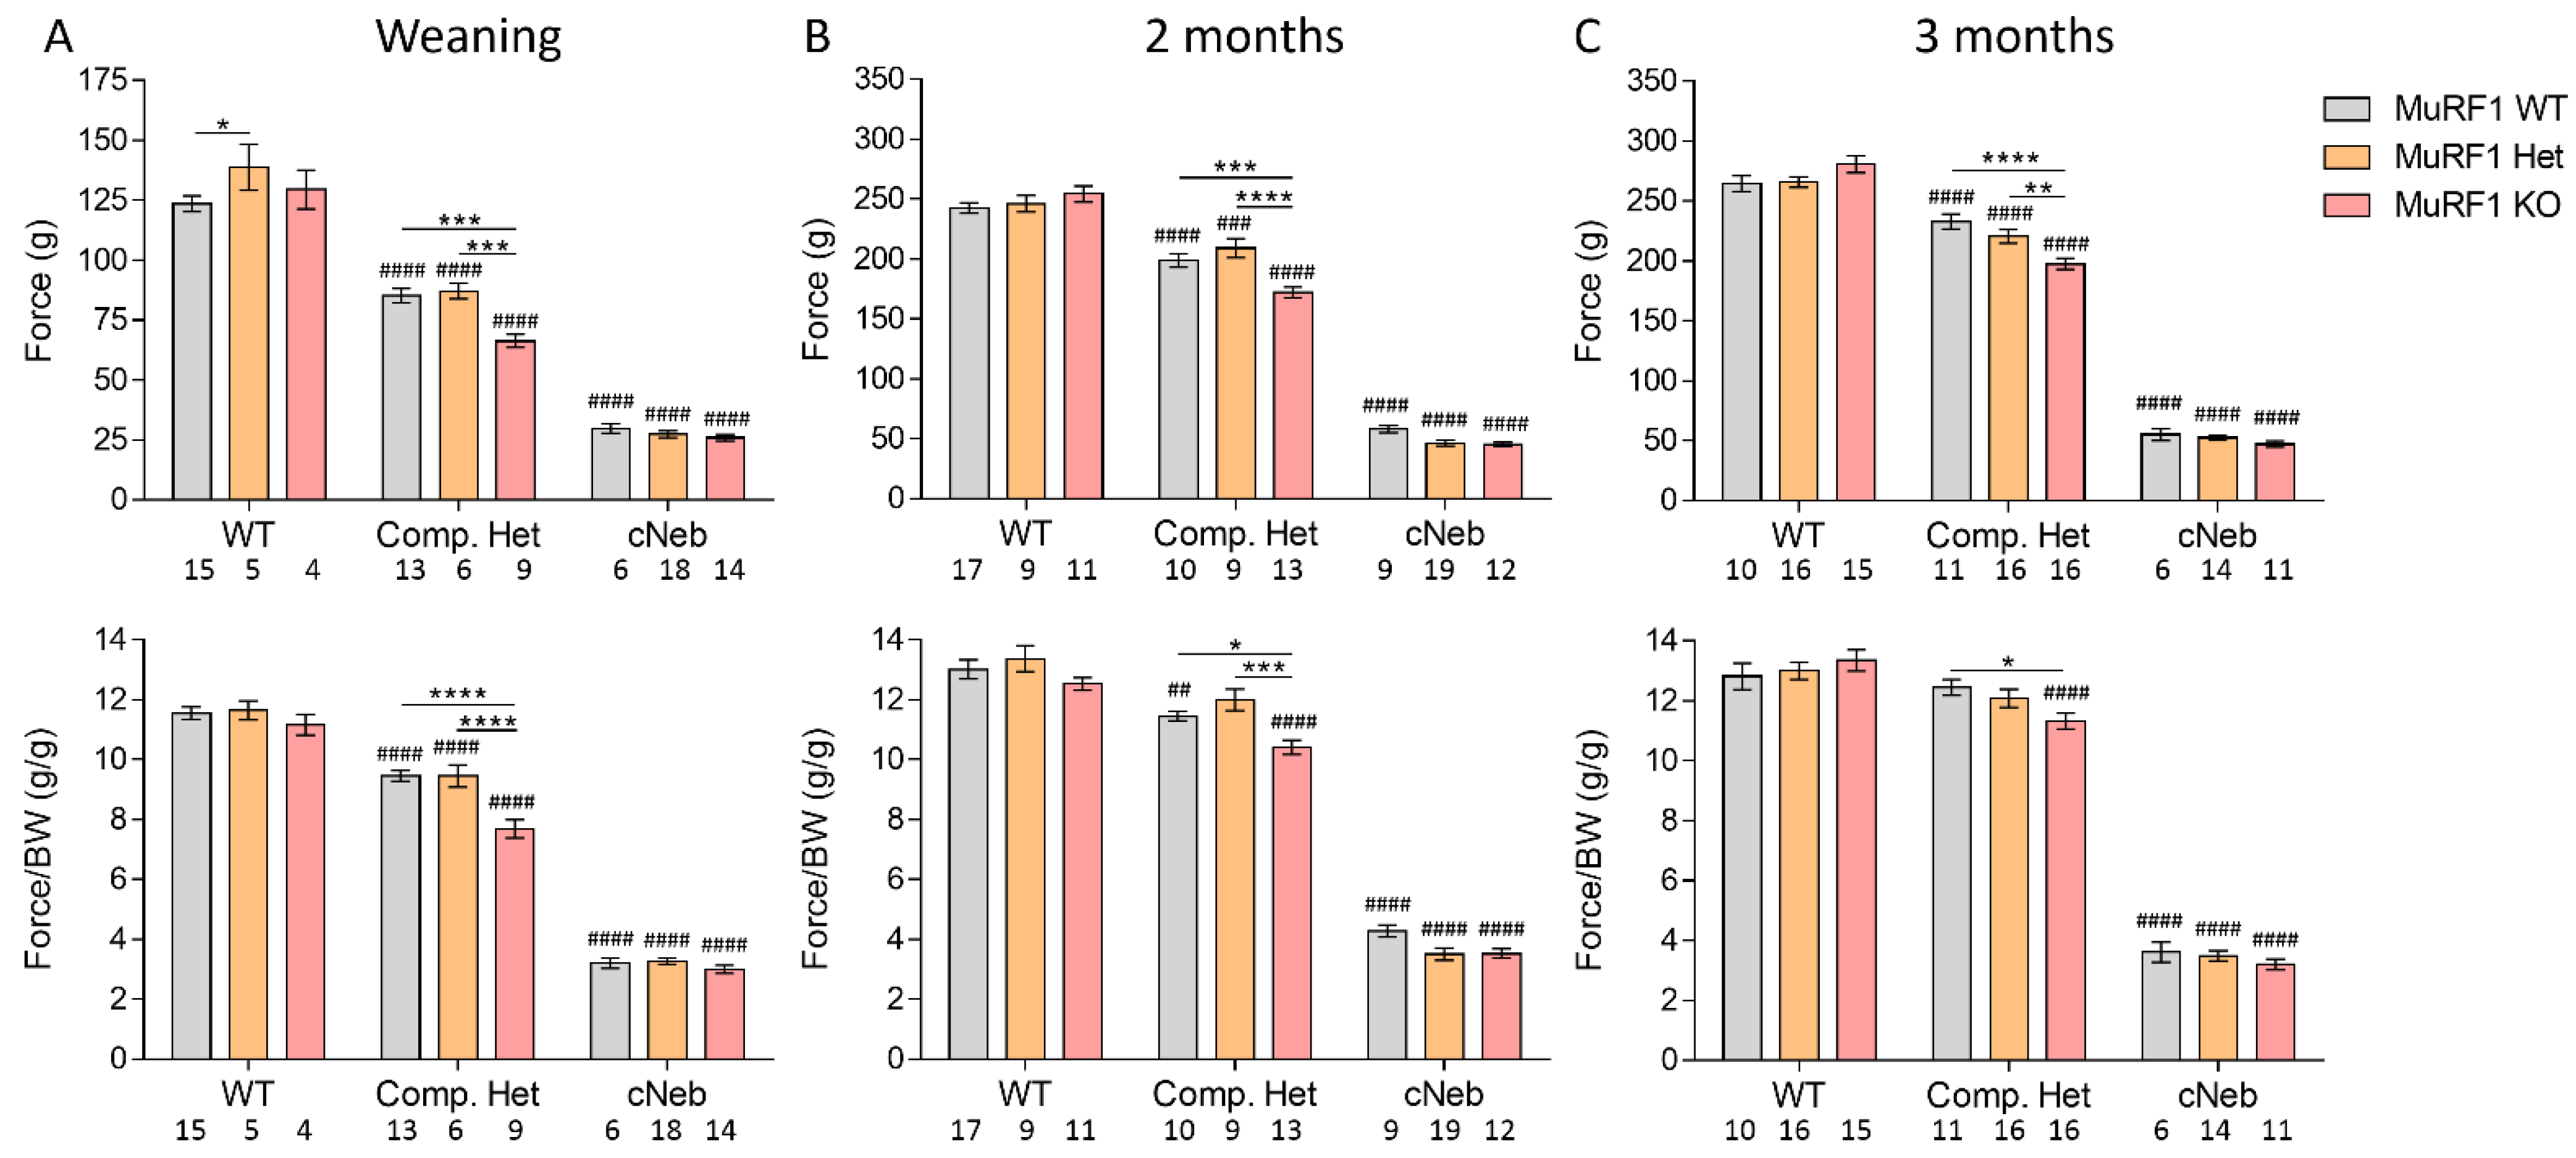
2.3. Grip Strength
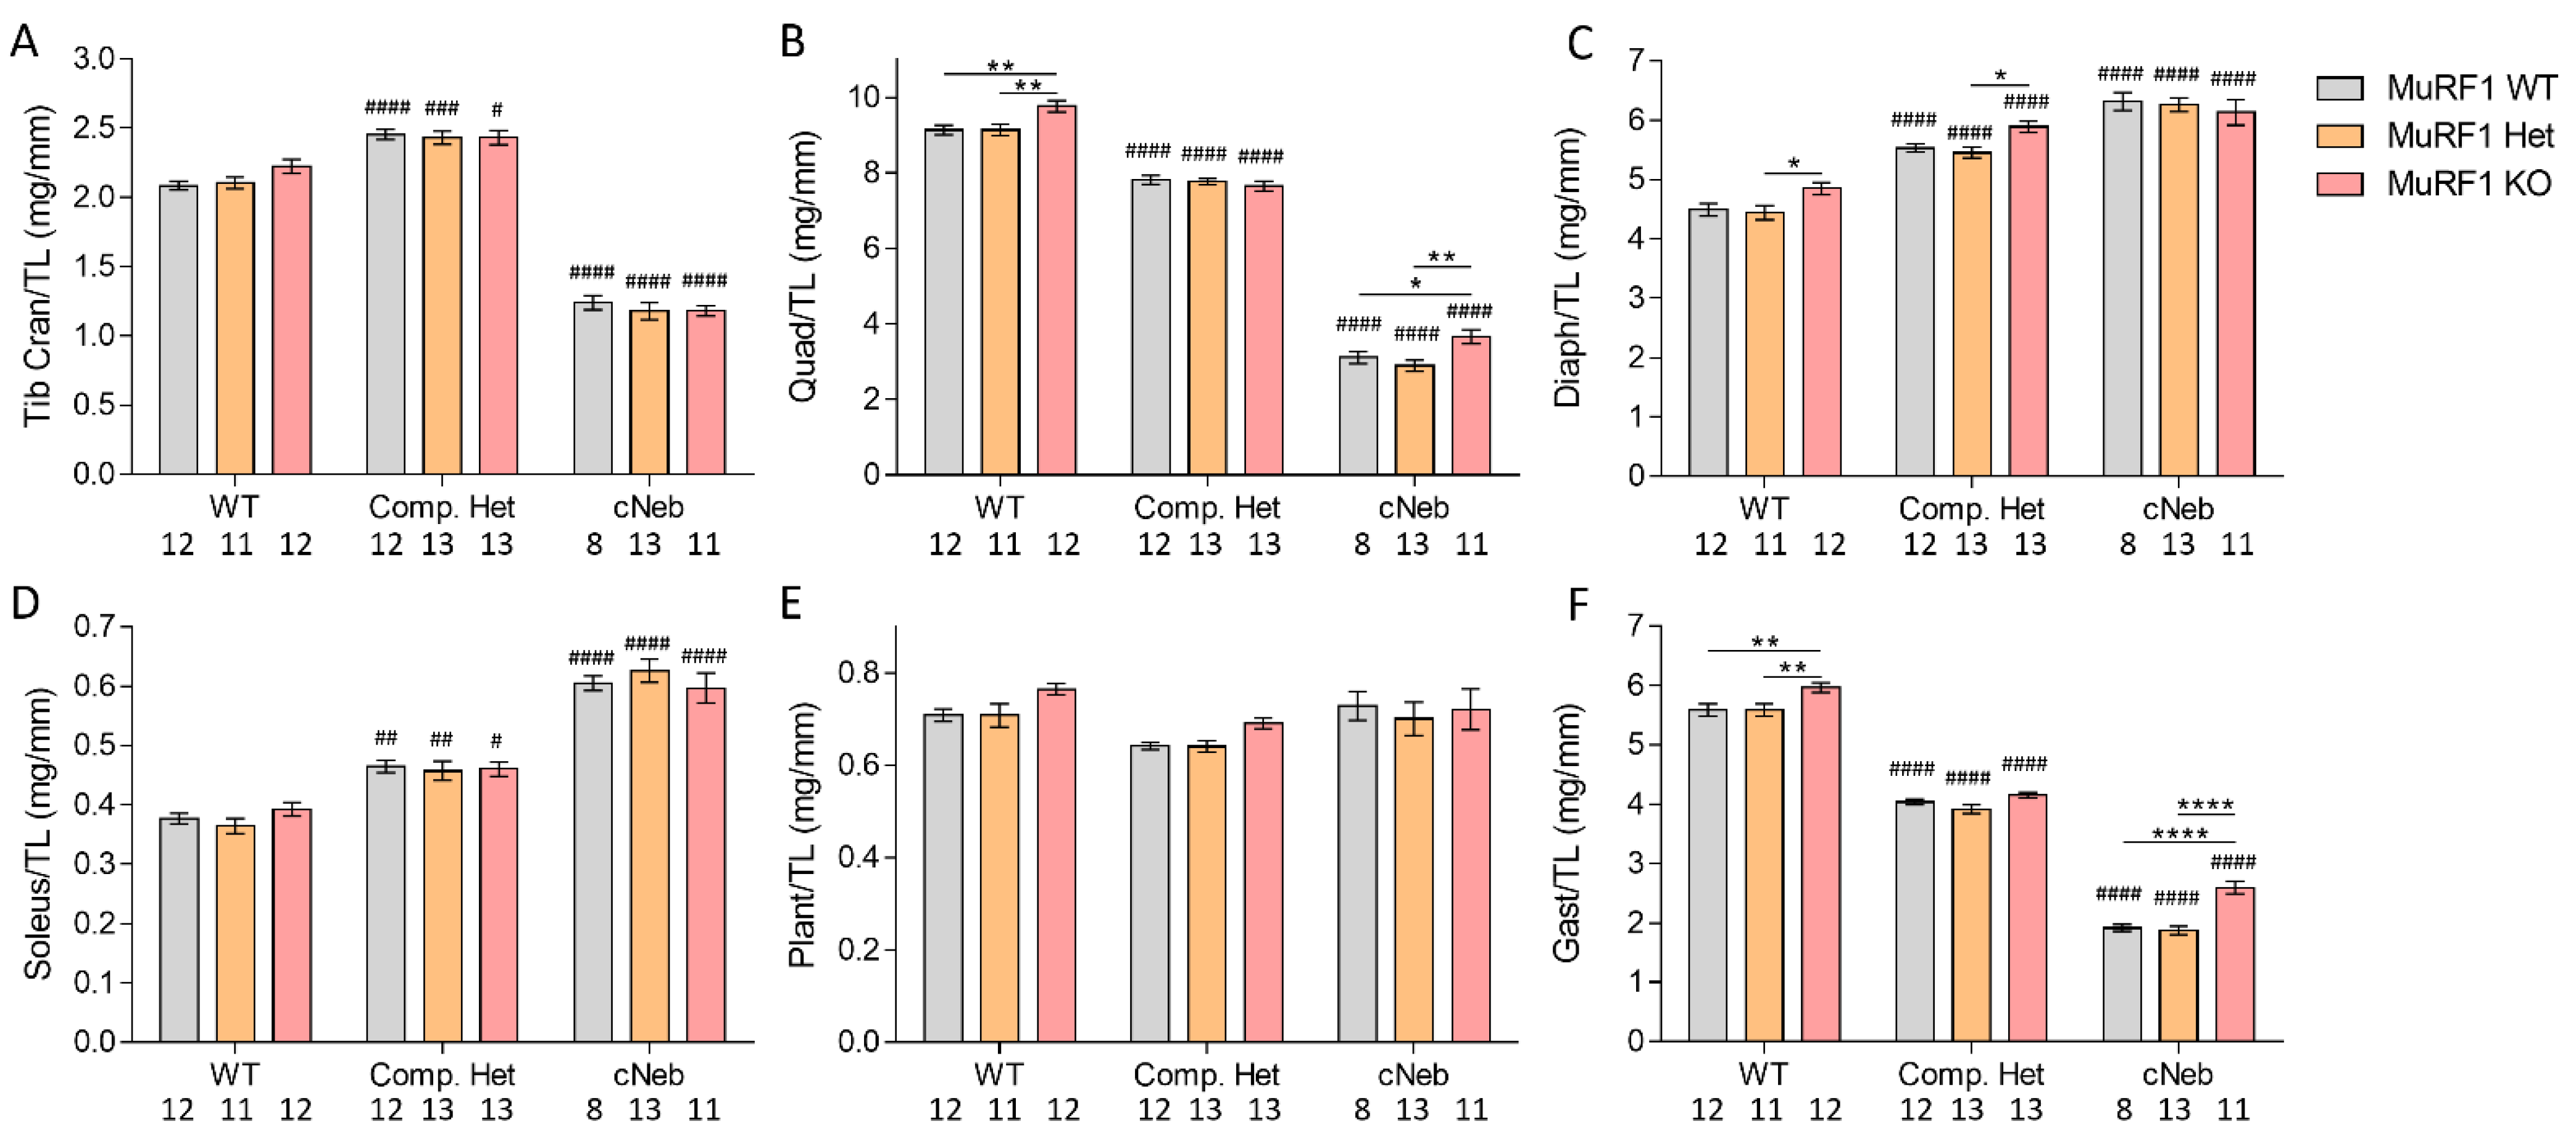
2.4. Tissue Weights
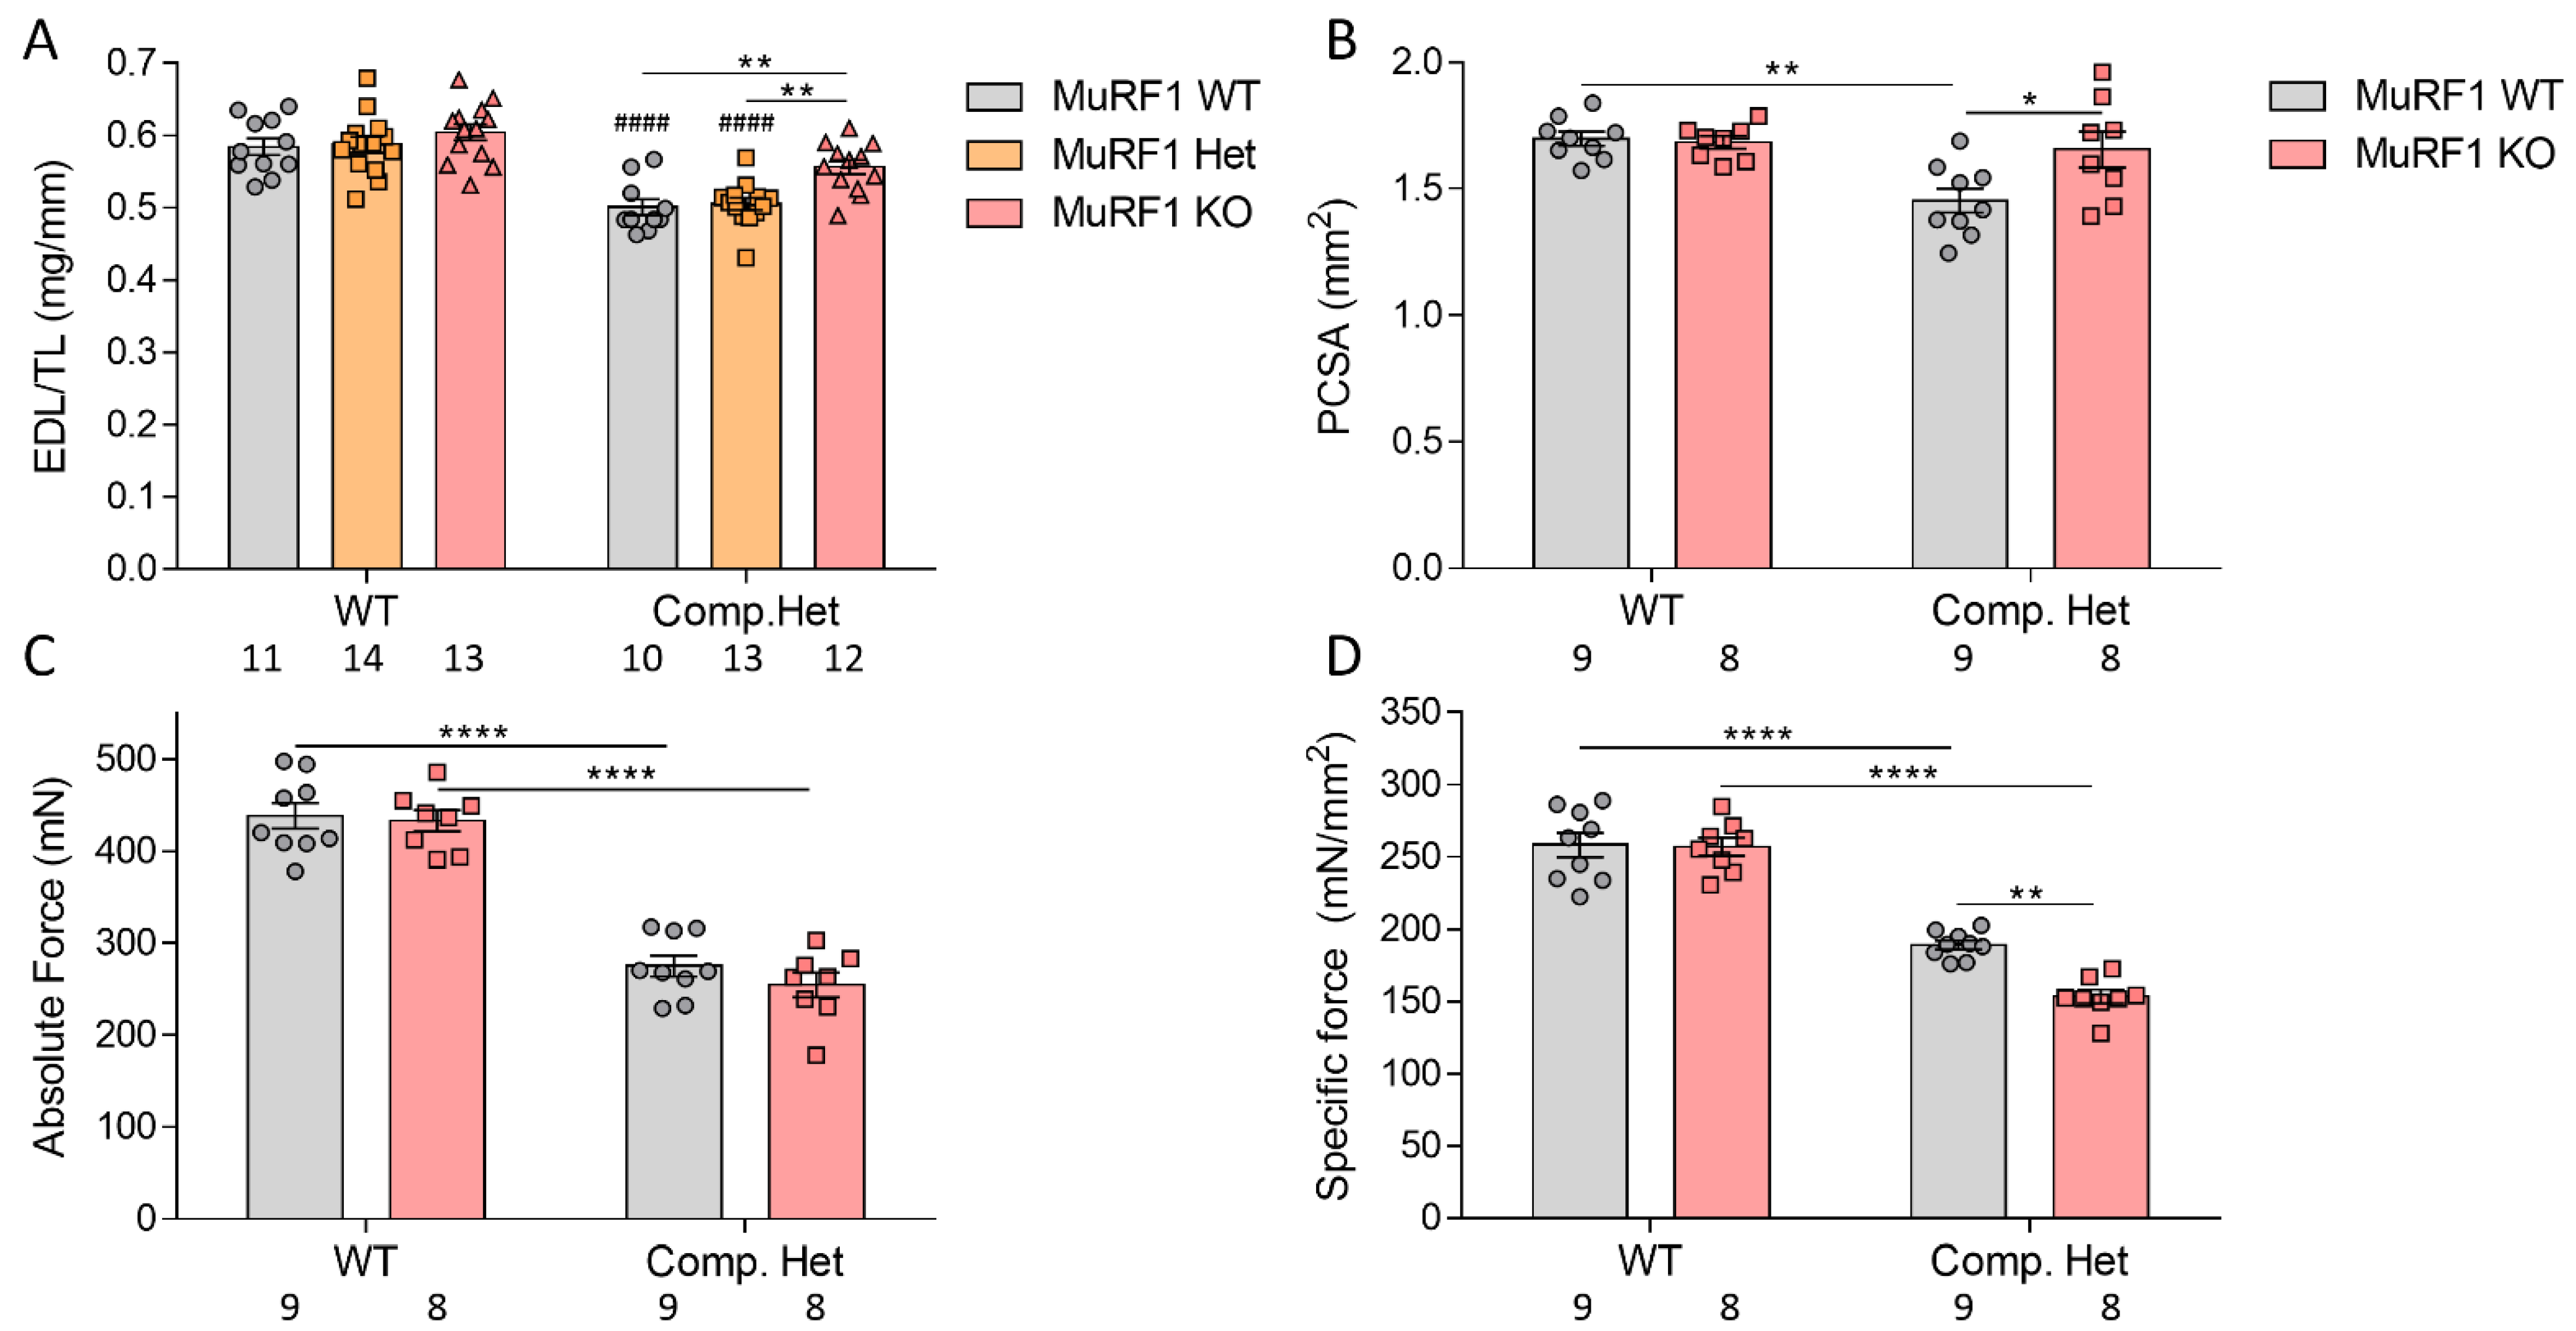
2.5. In Vivo and In Vitro Muscle Mechanics
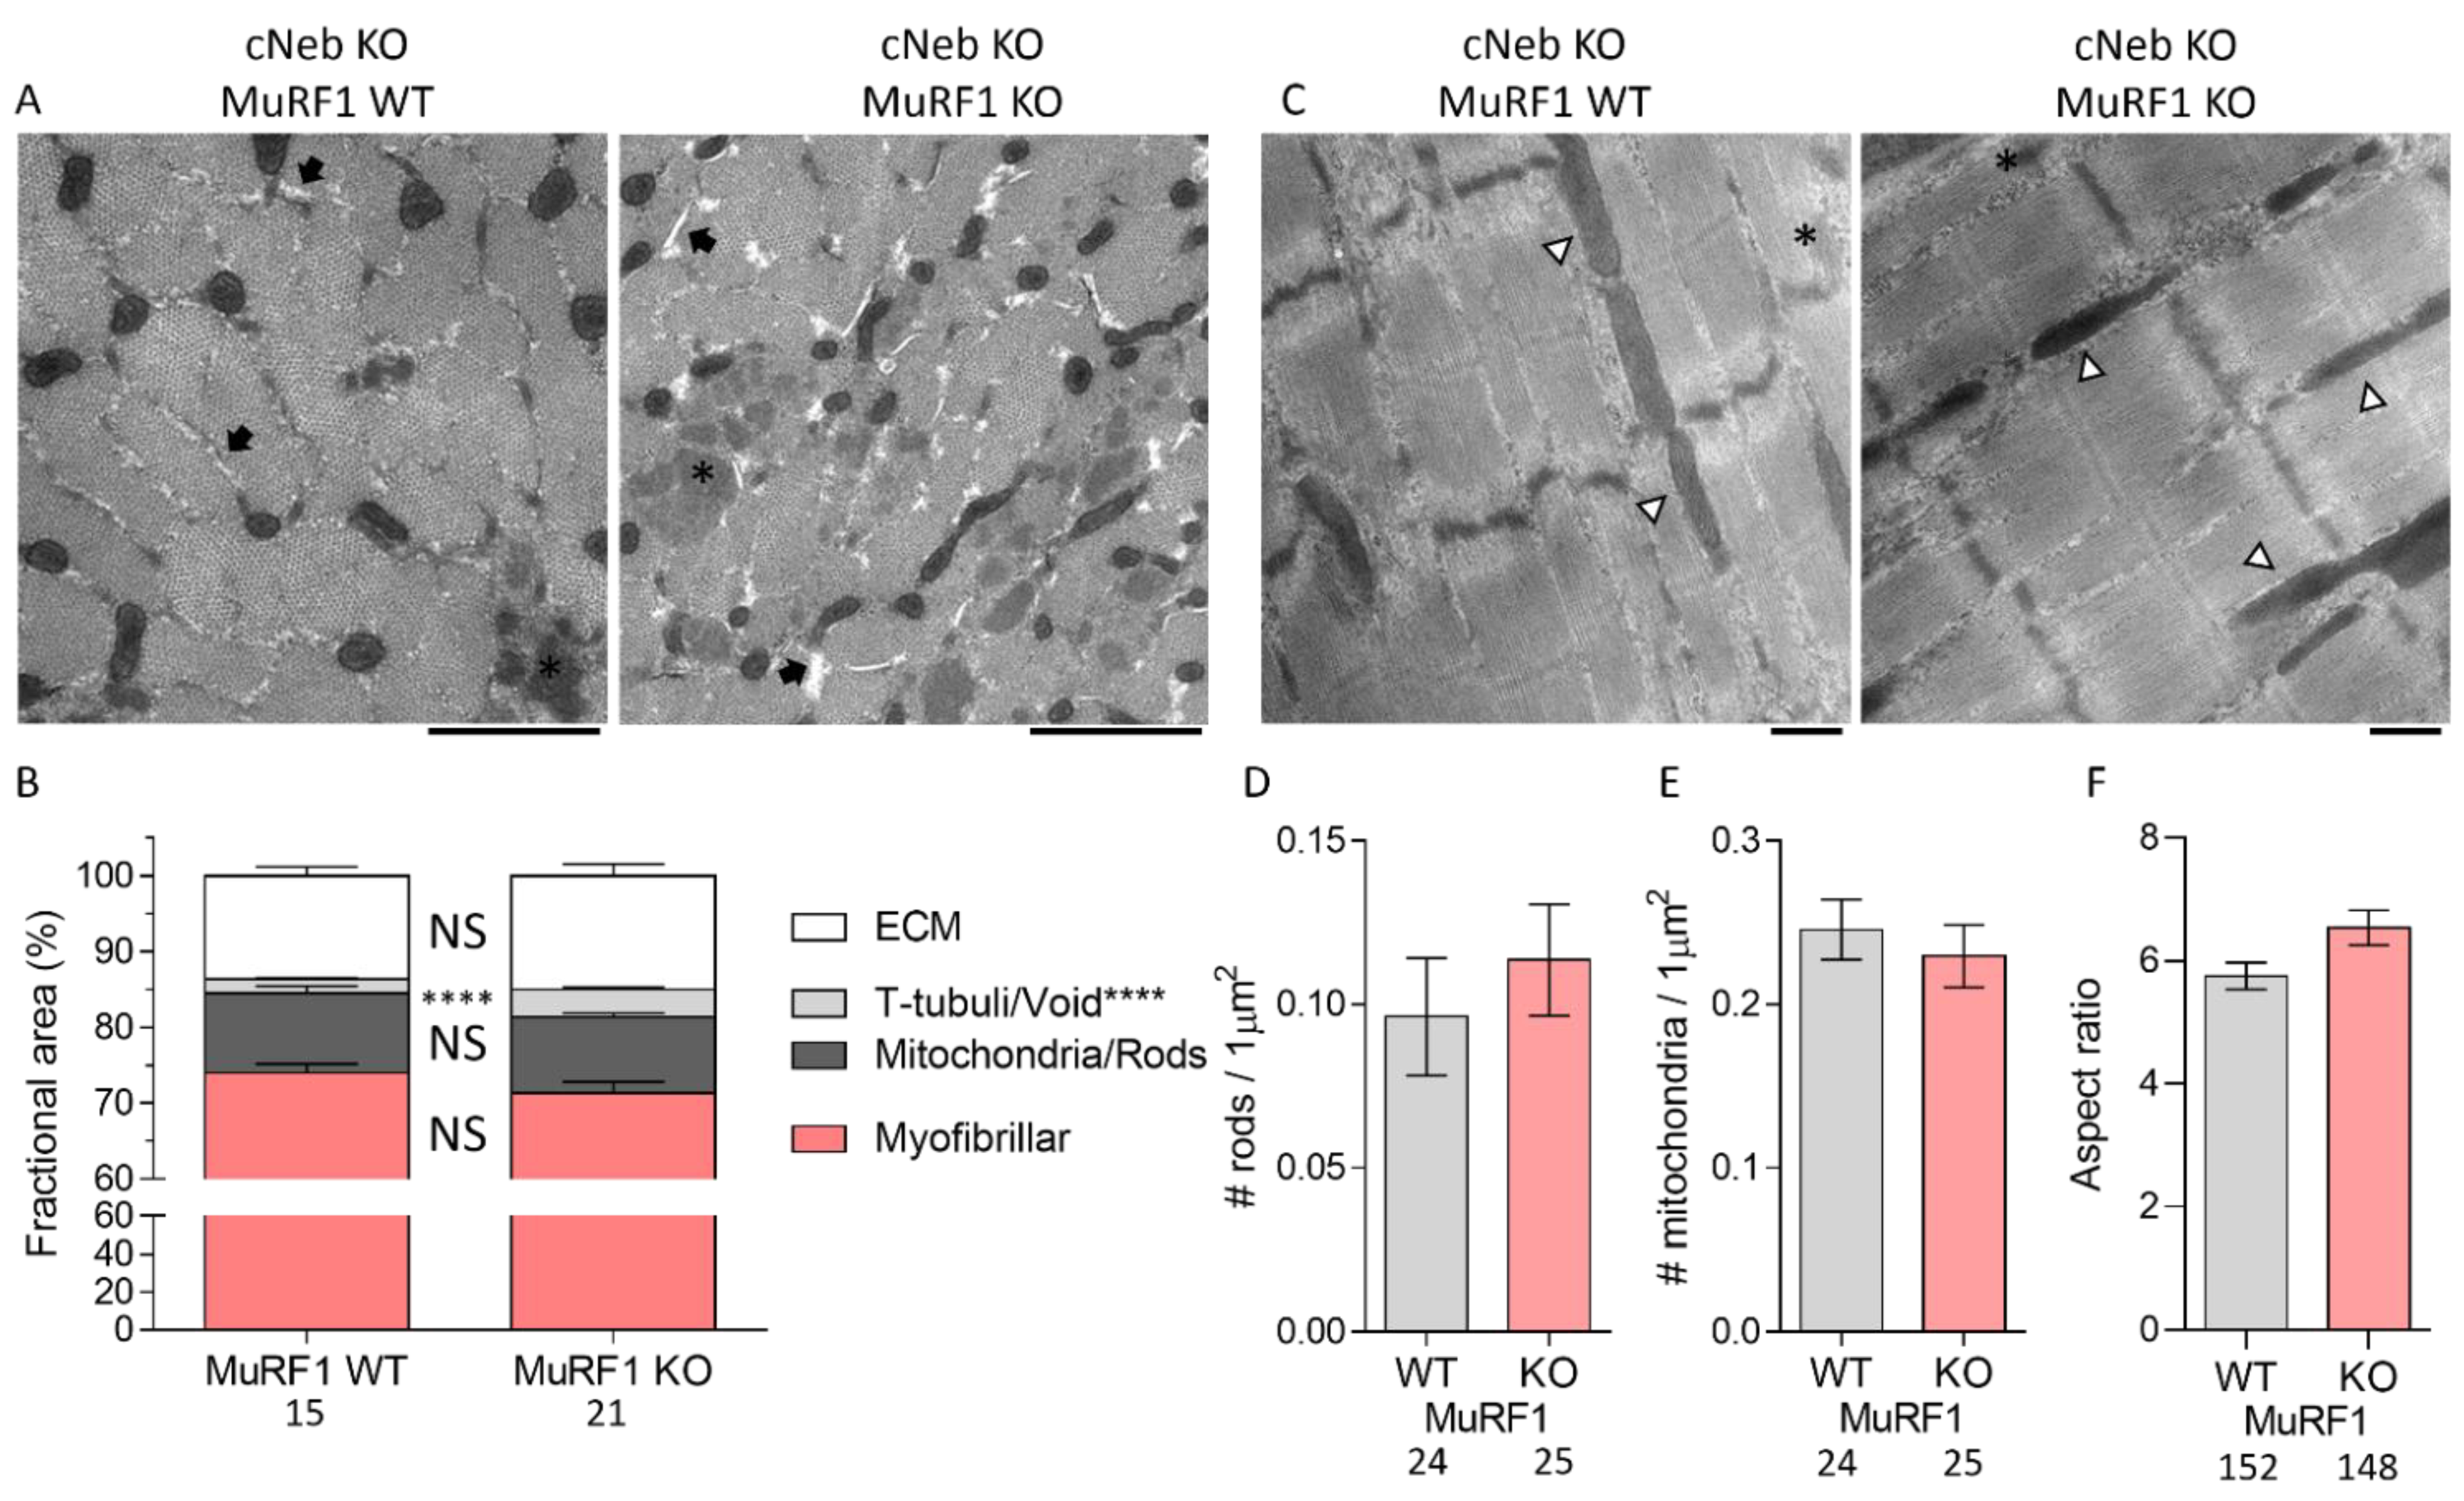
2.6. Ultrastructural Studies on cNeb Gastrocnemius
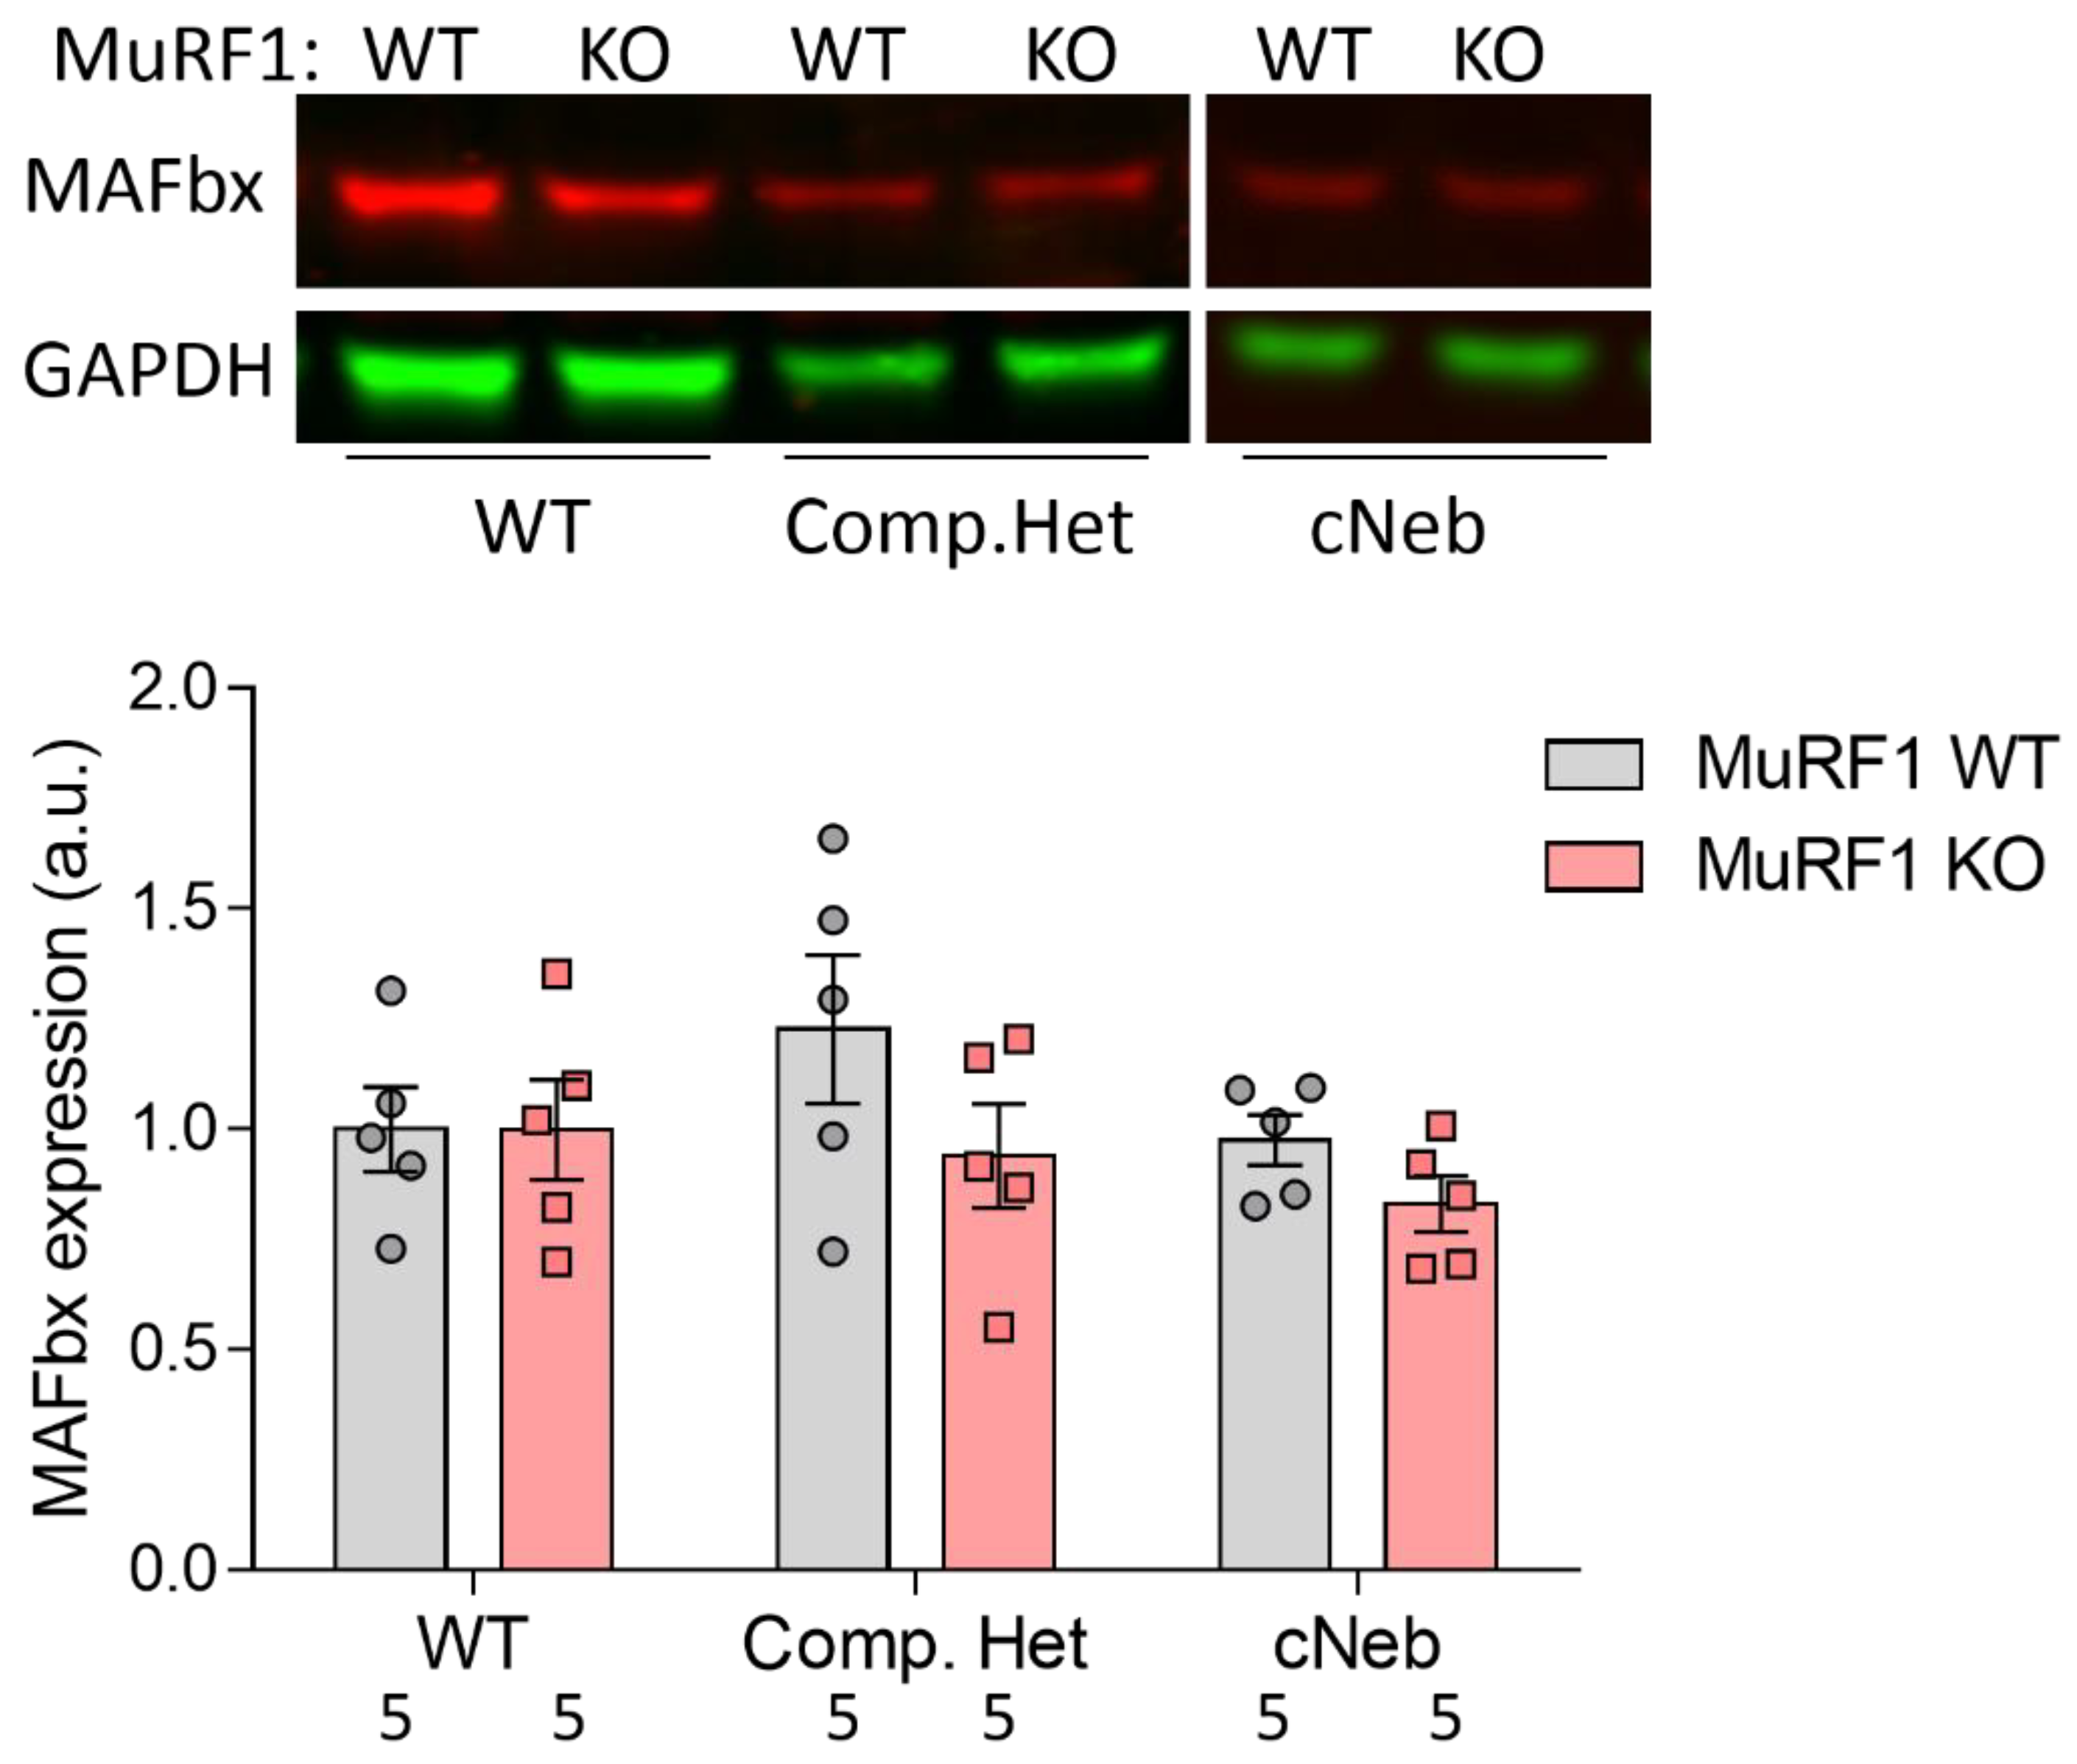
2.7. MAFbx Protein Expression
3. Discussion
4. Materials and Methods
4.1. Human Subjects
4.2. Animals
4.3. Western Blotting
4.4. Grip Strength
4.5. Body Weights
4.6. In Vivo Foot-Plate Experiments
4.7. Intact Muscle Mechanics
4.8. Transmission Electron Microscopy
4.9. Statistical Analysis
Supplementary Materials
Author Contributions
Funding
Institutional Review Board Statement
Informed Consent Statement
Data Availability Statement
Conflicts of Interest
References
- Yuen, M.; Ottenheijm, C.A.C. Nebulin: Big protein with big responsibilities. J. Muscle Res. Cell Motil. 2020, 41, 103–124. [Google Scholar] [CrossRef] [PubMed] [Green Version]
- Wang, Z.; Grange, M.; Pospich, S.; Wagner, T.; Kho, A.L.; Gautel, M.; Raunser, S. Structures from intact myofibrils reveal mechanism of thin filament regulation through nebulin. Science 2022, 375, eabn1934. [Google Scholar] [CrossRef] [PubMed]
- Labeit, S.; Kolmerer, B. The complete primary structure of human nebulin and its correlation to muscle structure. J. Mol. Biol. 1995, 248, 308–315. [Google Scholar] [CrossRef]
- Gohlke, J.; Tonino, P.; Lindqvist, J.; Smith, J.E.; Granzier, H. The number of Z-repeats and super-repeats in nebulin greatly varies across vertebrates and scales with animal size. J. Gen. Physiol 2021, 153, E202012783. [Google Scholar] [CrossRef] [PubMed]
- Kiss, B.; Lee, E.J.; Ma, W.; Li, F.W.; Tonino, P.; Mijailovich, S.M.; Irving, T.C.; Granzier, H.L. Nebulin stiffens the thin filament and augments cross-bridge interaction in skeletal muscle. Proc. Natl. Acad. Sci. USA 2018, 115, 10369–10374. [Google Scholar] [CrossRef] [Green Version]
- Ottenheijm, C.A.; Hooijman, P.; DeChene, E.T.; Stienen, G.J.; Beggs, A.H.; Granzier, H. Altered myofilament function depresses force generation in patients with nebulin-based nemaline myopathy (NEM2). J. Struct. Biol. 2010, 170, 334–343. [Google Scholar] [CrossRef] [Green Version]
- Chandra, M.; Mamidi, R.; Ford, S.; Hidalgo, C.; Witt, C.; Ottenheijm, C.; Labeit, S.; Granzier, H. Nebulin alters cross-bridge cycling kinetics and increases thin filament activation: A novel mechanism for increasing tension and reducing tension cost. J. Biol. Chem. 2009, 284, 30889–30896. [Google Scholar] [CrossRef] [Green Version]
- Lee, E.J.; De Winter, J.M.; Buck, D.; Jasper, J.R.; Malik, F.I.; Labeit, S.; Ottenheijm, C.A.; Granzier, H. Fast skeletal muscle troponin activation increases force of mouse fast skeletal muscle and ameliorates weakness due to nebulin-deficiency. PLoS ONE 2013, 8, e55861. [Google Scholar] [CrossRef] [Green Version]
- Lindqvist, J.; Lee, E.J.; Karimi, E.; Kolb, J.; Granzier, H. Omecamtiv mecarbil lowers the contractile deficit in a mouse model of nebulin-based nemaline myopathy. PLoS ONE 2019, 14, e0224467. [Google Scholar] [CrossRef]
- Kiss, B.; Gohlke, J.; Tonino, P.; Hourani, Z.; Kolb, J.; Strom, J.; Alekhina, O.; Smith, J.E., 3rd; Ottenheijm, C.; Gregorio, C.; et al. Nebulin and Lmod2 are critical for specifying thin-filament length in skeletal muscle. Sci. Adv. 2020, 6, eabc1992. [Google Scholar] [CrossRef]
- Winter, J.M.; Joureau, B.; Lee, E.J.; Kiss, B.; Yuen, M.; Gupta, V.A.; Pappas, C.T.; Gregorio, C.C.; Stienen, G.J.; Edvardson, S.; et al. Mutation-specific effects on thin filament length in thin filament myopathy. Ann. Neurol. 2016, 79, 959–969. [Google Scholar] [CrossRef] [PubMed] [Green Version]
- Ottenheijm, C.A.; Witt, C.C.; Stienen, G.J.; Labeit, S.; Beggs, A.H.; Granzier, H. Thin filament length dysregulation contributes to muscle weakness in nemaline myopathy patients with nebulin deficiency. Hum. Mol. Genet. 2009, 18, 2359–2369. [Google Scholar] [CrossRef] [PubMed]
- Donner, K.; Sandbacka, M.; Lehtokari, V.L.; Wallgren-Pettersson, C.; Pelin, K. Complete genomic structure of the human nebulin gene and identification of alternatively spliced transcripts. Eur. J. Hum. Genet. 2004, 12, 744–751. [Google Scholar] [CrossRef] [PubMed]
- Lehtokari, V.L.; Kiiski, K.; Sandaradura, S.A.; Laporte, J.; Repo, P.; Frey, J.A.; Donner, K.; Marttila, M.; Saunders, C.; Barth, P.G.; et al. Mutation update: The spectra of nebulin variants and associated myopathies. Hum. Mutat. 2014, 35, 1418–1426. [Google Scholar] [CrossRef] [Green Version]
- Kiiski, K.J.; Lehtokari, V.L.; Vihola, A.K.; Laitila, J.M.; Huovinen, S.; Sagath, L.J.; Evila, A.E.; Paetau, A.E.; Sewry, C.A.; Hackman, P.B.; et al. Dominantly inherited distal nemaline/cap myopathy caused by a large deletion in the nebulin gene. Neuromuscul. Disord. 2019, 29, 97–107. [Google Scholar] [CrossRef] [Green Version]
- Wallgren-Pettersson, C.; Lehtokari, V.L.; Kalimo, H.; Paetau, A.; Nuutinen, E.; Hackman, P.; Sewry, C.; Pelin, K.; Udd, B. Distal myopathy caused by homozygous missense mutations in the nebulin gene. Brain 2007, 130, 1465–1476. [Google Scholar] [CrossRef]
- Romero, N.B.; Lehtokari, V.L.; Quijano-Roy, S.; Monnier, N.; Claeys, K.G.; Carlier, R.Y.; Pellegrini, N.; Orlikowski, D.; Barois, A.; Laing, N.G.; et al. Core-rod myopathy caused by mutations in the nebulin gene. Neurology 2009, 73, 1159–1161. [Google Scholar] [CrossRef]
- Colombo, I.; Scoto, M.; Manzur, A.Y.; Robb, S.A.; Maggi, L.; Gowda, V.; Cullup, T.; Yau, M.; Phadke, R.; Sewry, C.; et al. Congenital myopathies: Natural history of a large pediatric cohort. Neurology 2015, 84, 28–35. [Google Scholar] [CrossRef] [Green Version]
- Sewry, C.A.; Laitila, J.M.; Wallgren-Pettersson, C. Nemaline myopathies: A current view. J. Muscle Res. Cell Motil. 2019, 40, 111–126. [Google Scholar] [CrossRef] [Green Version]
- Laitila, J.; Wallgren-Pettersson, C. Recent advances in nemaline myopathy. Neuromuscul. Disord. 2021, 10, 955–967. [Google Scholar] [CrossRef]
- Amburgey, K.; Acker, M.; Saeed, S.; Amin, R.; Beggs, A.H.; Bonnemann, C.G.; Brudno, M.; Constantinescu, A.; Dastgir, J.; Diallo, M.; et al. A Cross-Sectional Study of Nemaline Myopathy. Neurology 2021, 96, e1425–e1436. [Google Scholar] [CrossRef]
- Lindqvist, J.; Ma, W.; Li, F.; Hernandez, Y.; Kolb, J.; Kiss, B.; Tonino, P.; van der Pijl, R.; Karimi, E.; Gong, H.; et al. Triggering typical nemaline myopathy with compound heterozygous nebulin mutations reveals myofilament structural changes as pathomechanism. Nat. Commun. 2020, 11, 2699. [Google Scholar] [CrossRef] [PubMed]
- Li, F.; Buck, D.; De Winter, J.; Kolb, J.; Meng, H.; Birch, C.; Slater, R.; Escobar, Y.N.; Smith, J.E., 3rd; Yang, L.; et al. Nebulin deficiency in adult muscle causes sarcomere defects and muscle-type-dependent changes in trophicity: Novel insights in nemaline myopathy. Hum. Mol. Genet. 2015, 24, 5219–5233. [Google Scholar] [CrossRef] [PubMed] [Green Version]
- Bodine, S.C.; Baehr, L.M. Skeletal muscle atrophy and the E3 ubiquitin ligases MuRF1 and MAFbx/atrogin-1. Am. J. Physiol. Endocrinol. Metab. 2014, 307, E469–E484. [Google Scholar] [CrossRef] [PubMed] [Green Version]
- Cai, R.; Zhang, Q.; Wang, Y.; Yong, W.; Zhao, R.; Pang, W. Lnc-ORA interacts with microRNA-532-3p and IGF2BP2 to inhibit skeletal muscle myogenesis. J. Biol. Chem. 2021, 296, 100376. [Google Scholar] [CrossRef]
- Kleiger, G.; Mayor, T. Perilous journey: A tour of the ubiquitin-proteasome system. Trends Cell Biol. 2014, 24, 352–359. [Google Scholar] [CrossRef] [Green Version]
- Foletta, V.C.; White, L.J.; Larsen, A.E.; Leger, B.; Russell, A.P. The role and regulation of MAFbx/atrogin-1 and MuRF1 in skeletal muscle atrophy. Pflug. Arch. 2011, 461, 325–335. [Google Scholar] [CrossRef]
- Hooijman, P.E.; Beishuizen, A.; Witt, C.C.; de Waard, M.C.; Girbes, A.R.; Spoelstra-de Man, A.M.; Niessen, H.W.; Manders, E.; van Hees, H.W.; van den Brom, C.E.; et al. Diaphragm muscle fiber weakness and ubiquitin-proteasome activation in critically ill patients. Am. J. Respir Crit Care Med. 2015, 191, 1126–1138. [Google Scholar] [CrossRef] [Green Version]
- Clarke, B.A.; Drujan, D.; Willis, M.S.; Murphy, L.O.; Corpina, R.A.; Burova, E.; Rakhilin, S.V.; Stitt, T.N.; Patterson, C.; Latres, E.; et al. The E3 Ligase MuRF1 degrades myosin heavy chain protein in dexamethasone-treated skeletal muscle. Cell Metab. 2007, 6, 376–385. [Google Scholar] [CrossRef] [Green Version]
- Gomes, M.D.; Lecker, S.H.; Jagoe, R.T.; Navon, A.; Goldberg, A.L. Atrogin-1, a muscle-specific F-box protein highly expressed during muscle atrophy. Proc. Natl. Acad. Sci. USA 2001, 98, 14440–14445. [Google Scholar] [CrossRef] [Green Version]
- Bodine, S.C.; Latres, E.; Baumhueter, S.; Lai, V.K.; Nunez, L.; Clarke, B.A.; Poueymirou, W.T.; Panaro, F.J.; Na, E.; Dharmarajan, K.; et al. Identification of ubiquitin ligases required for skeletal muscle atrophy. Science 2001, 294, 1704–1708. [Google Scholar] [CrossRef] [PubMed]
- Moriscot, A.S.; Baptista, I.L.; Bogomolovas, J.; Witt, C.; Hirner, S.; Granzier, H.; Labeit, S. MuRF1 is a muscle fiber-type II associated factor and together with MuRF2 regulates type-II fiber trophicity and maintenance. J. Struct. Biol. 2010, 170, 344–353. [Google Scholar] [CrossRef] [PubMed] [Green Version]
- Labeit, S.; Kohl, C.H.; Witt, C.C.; Labeit, D.; Jung, J.; Granzier, H. Modulation of muscle atrophy, fatigue and MLC phosphorylation by MuRF1 as indicated by hindlimb suspension studies on MuRF1-KO mice. J. Biomed. Biotechnol. 2010, 2010, 693741. [Google Scholar] [CrossRef] [PubMed] [Green Version]
- Li, F.; Barton, E.R.; Granzier, H. Deleting nebulin’s C-terminus reveals its importance to sarcomeric structure and function and is sufficient to invoke nemaline myopathy. Hum. Mol. Genet. 2019, 28, 1709–1725. [Google Scholar] [CrossRef] [PubMed]
- Laitila, J.M.; McNamara, E.L.; Wingate, C.D.; Goullee, H.; Ross, J.A.; Taylor, R.L.; van der Pijl, R.; Griffiths, L.M.; Harries, R.; Ravenscroft, G.; et al. Nebulin nemaline myopathy recapitulated in a compound heterozygous mouse model with both a missense and a nonsense mutation in Neb. Acta Neuropathol. Commun. 2020, 8, 18. [Google Scholar] [CrossRef] [PubMed]
- de Winter, J.M.; Gineste, C.; Minardi, E.; Brocca, L.; Rossi, M.; Borsboom, T.; Beggs, A.H.; Bernard, M.; Bendahan, D.; Hwee, D.T.; et al. Acute and chronic tirasemtiv treatment improves in vivo and in vitro muscle performance in actin-based nemaline myopathy mice. Hum. Mol. Genet. 2021, 30, 1305–1320. [Google Scholar] [CrossRef] [PubMed]
- Lindqvist, J.; Cheng, A.J.; Renaud, G.; Hardeman, E.C.; Ochala, J. Distinct underlying mechanisms of limb and respiratory muscle fiber weaknesses in nemaline myopathy. J. Neuropathol. Exp. Neurol. 2013, 72, 472–481. [Google Scholar] [CrossRef] [Green Version]
- Joureau, B.; de Winter, J.M.; Conijn, S.; Bogaards, S.J.P.; Kovacevic, I.; Kalganov, A.; Persson, M.; Lindqvist, J.; Stienen, G.J.M.; Irving, T.C.; et al. Dysfunctional sarcomere contractility contributes to muscle weakness in ACTA1-related nemaline myopathy (NEM3). Ann. Neurol. 2018, 83, 269–282. [Google Scholar] [CrossRef]
- de Winter, J.M.; Molenaar, J.P.; Yuen, M.; van der Pijl, R.; Shen, S.; Conijn, S.; van de Locht, M.; Willigenburg, M.; Bogaards, S.J.; van Kleef, E.S.; et al. KBTBD13 is an actin-binding protein that modulates muscle kinetics. J. Clin. Invest. 2020, 130, 754–767. [Google Scholar] [CrossRef] [Green Version]
- Lindqvist, J.; Penisson-Besnier, I.; Iwamoto, H.; Li, M.; Yagi, N.; Ochala, J. A myopathy-related actin mutation increases contractile function. Acta Neuropathol. 2012, 123, 739–746. [Google Scholar] [CrossRef]
- Ochala, J. Thin filament proteins mutations associated with skeletal myopathies: Defective regulation of muscle contraction. J. Mol. Med. 2008, 86, 1197–1204. [Google Scholar] [CrossRef] [PubMed]
- Peris-Moreno, D.; Taillandier, D.; Polge, C. MuRF1/TRIM63, Master Regulator of Muscle Mass. Int, J. Mol. Sci 2020, 21, 6663. [Google Scholar] [CrossRef] [PubMed]
- Centner, T.; Yano, J.; Kimura, E.; McElhinny, A.S.; Pelin, K.; Witt, C.C.; Bang, M.L.; Trombitas, K.; Granzier, H.; Gregorio, C.C.; et al. Identification of muscle specific ring finger proteins as potential regulators of the titin kinase domain. J. Mol. Biol. 2001, 306, 717–726. [Google Scholar] [CrossRef] [PubMed] [Green Version]
- McElhinny, A.S.; Kakinuma, K.; Sorimachi, H.; Labeit, S.; Gregorio, C.C. Muscle-specific RING finger-1 interacts with titin to regulate sarcomeric M-line and thick filament structure and may have nuclear functions via its interaction with glucocorticoid modulatory element binding protein-1. J. Cell Biol. 2002, 157, 125–136. [Google Scholar] [CrossRef] [PubMed]
- Bogomolovas, J.; Fleming, J.R.; Franke, B.; Manso, B.; Simon, B.; Gasch, A.; Markovic, M.; Brunner, T.; Knoll, R.; Chen, J.; et al. Titin kinase ubiquitination aligns autophagy receptors with mechanical signals in the sarcomere. EMBO Rep. 2021, 22, e48018. [Google Scholar] [CrossRef]
- Witt, C.C.; Witt, S.H.; Lerche, S.; Labeit, D.; Back, W.; Labeit, S. Cooperative control of striated muscle mass and metabolism by MuRF1 and MuRF2. EMBO J. 2008, 27, 350–360. [Google Scholar] [CrossRef] [Green Version]
- Egawa, T.; Ogawa, T.; Yokokawa, T.; Kido, K.; Goto, K.; Hayashi, T. Methylglyoxal reduces molecular responsiveness to 4 weeks of endurance exercise in mouse plantaris muscle. J. Appl. Physiol. 2022, 2, 477–488. [Google Scholar] [CrossRef]
- Papadaki, M.; Kampaengsri, T.; Barrick, S.K.; Campbell, S.G.; von Lewinski, D.; Rainer, P.P.; Harris, S.P.; Greenberg, M.J.; Kirk, J.A. Myofilament glycation in diabetes reduces contractility by inhibiting tropomyosin movement, is rescued by cMyBPC domains. J. Mol. Cell Cardiol. 2021, 162, 1–9. [Google Scholar] [CrossRef]
- Steinz, M.M.; Persson, M.; Aresh, B.; Olsson, K.; Cheng, A.J.; Ahlstrand, E.; Lilja, M.; Lundberg, T.R.; Rullman, E.; Moller, K.A.; et al. Oxidative hotspots on actin promote skeletal muscle weakness in rheumatoid arthritis. JCI Insight 2019, 5, e126347. [Google Scholar] [CrossRef]
- Labeit, S.; Hirner, S.; Bogomolovas, J.; Cruz, A.; Myrzabekova, M.; Moriscot, A.; Bowen, T.S.; Adams, V. Regulation of Glucose Metabolism by MuRF1 and Treatment of Myopathy in Diabetic Mice with Small Molecules Targeting MuRF1. Int. J. Mol. Sci. 2021, 22, 2225. [Google Scholar] [CrossRef]
- Gomes, A.V.; Waddell, D.S.; Siu, R.; Stein, M.; Dewey, S.; Furlow, J.D.; Bodine, S.C. Upregulation of proteasome activity in muscle RING finger 1-null mice following denervation. FASEB J. 2012, 26, 2986–2999. [Google Scholar] [CrossRef] [Green Version]
- Baehr, L.M.; Furlow, J.D.; Bodine, S.C. Muscle sparing in muscle RING finger 1 null mice: Response to synthetic glucocorticoids. J. Physiol. 2011, 589, 4759–4776. [Google Scholar] [CrossRef] [PubMed] [Green Version]
- Braten, O.; Livneh, I.; Ziv, T.; Admon, A.; Kehat, I.; Caspi, L.H.; Gonen, H.; Bercovich, B.; Godzik, A.; Jahandideh, S.; et al. Numerous proteins with unique characteristics are degraded by the 26S proteasome following monoubiquitination. Proc. Natl. Acad. Sci. USA 2016, 113, E4639–E4647. [Google Scholar] [CrossRef] [PubMed] [Green Version]
- Hicke, L.; Dunn, R. Regulation of membrane protein transport by ubiquitin and ubiquitin-binding proteins. Annu. Rev. Cell Dev. Biol. 2003, 19, 141–172. [Google Scholar] [CrossRef] [PubMed]
- Bowen, T.S.; Adams, V.; Werner, S.; Fischer, T.; Vinke, P.; Brogger, M.N.; Mangner, N.; Linke, A.; Sehr, P.; Lewis, J.; et al. Small-molecule inhibition of MuRF1 attenuates skeletal muscle atrophy and dysfunction in cardiac cachexia. J. Cachexia Sarcopenia Muscle 2017, 8, 939–953. [Google Scholar] [CrossRef]
- Adams, V.; Schauer, A.; Augstein, A.; Kirchhoff, V.; Draskowski, R.; Jannasch, A.; Goto, K.; Lyall, G.; Mannel, A.; Barthel, P.; et al. Targeting MuRF1 by small molecules in a HFpEF rat model improves myocardial diastolic function and skeletal muscle contractility. J. Cachexia Sarcopenia Muscle 2022, 3, 1565–1581. [Google Scholar] [CrossRef]
- Nguyen, M.A.; Joya, J.E.; Kee, A.J.; Domazetovska, A.; Yang, N.; Hook, J.W.; Lemckert, F.A.; Kettle, E.; Valova, V.A.; Robinson, P.J.; et al. Hypertrophy and dietary tyrosine ameliorate the phenotypes of a mouse model of severe nemaline myopathy. Brain 2011, 134, 3516–3529. [Google Scholar] [CrossRef] [Green Version]
- Tinklenberg, J.; Meng, H.; Yang, L.; Liu, F.J.; Hoffmann, R.G.; Dasgupta, M.; Allen, K.P.; Beggs, A.H.; Hardeman, E.C.; Pearsall, R.S.; et al. Treatment with ActRIIB-mFc Produces Myofiber Growth and Improves Lifespan in the Acta1 H40Y Murine Model of Nemaline Myopathy. Am. J. Pathol. 2016, 186, 1568–1581. [Google Scholar] [CrossRef] [Green Version]
- Lindqvist, J.; Hardeman, E.C.; Ochala, J. Sexually dimorphic myofilament function in a mouse model of nemaline myopathy. Arch. Biochem. Biophys. 2014, 564, 37–42. [Google Scholar] [CrossRef]
- Warren, C.M.; Krzesinski, P.R.; Greaser, M.L. Vertical agarose gel electrophoresis and electroblotting of high-molecular-weight proteins. Electrophoresis 2003, 24, 1695–1702. [Google Scholar] [CrossRef]
- Burkholder, T.J.; Fingado, B.; Baron, S.; Lieber, R.L. Relationship between muscle fiber types and sizes and muscle architectural properties in the mouse hindlimb. J. Morphol. 1994, 221, 177–190. [Google Scholar] [CrossRef] [PubMed]
- Yuen, M.; Cooper, S.T.; Marston, S.B.; Nowak, K.J.; McNamara, E.; Mokbel, N.; Ilkovski, B.; Ravenscroft, G.; Rendu, J.; de Winter, J.M.; et al. Muscle weakness in TPM3-myopathy is due to reduced Ca2+-sensitivity and impaired acto-myosin cross-bridge cycling in slow fibres. Hum. Mol. Genet. 2015, 24, 6278–6292. [Google Scholar] [CrossRef] [PubMed] [Green Version]
- Malfatti, E.; Lehtokari, V.L.; Bohm, J.; De Winter, J.M.; Schaffer, U.; Estournet, B.; Quijano-Roy, S.; Monges, S.; Lubieniecki, F.; Bellance, R.; et al. Muscle histopathology in nebulin-related nemaline myopathy: Ultrastrastructural findings correlated to disease severity and genotype. Acta Neuropathol. Commun. 2014, 2, 44. [Google Scholar] [CrossRef] [PubMed] [Green Version]


Publisher’s Note: MDPI stays neutral with regard to jurisdictional claims in published maps and institutional affiliations. |
© 2022 by the authors. Licensee MDPI, Basel, Switzerland. This article is an open access article distributed under the terms and conditions of the Creative Commons Attribution (CC BY) license (https://creativecommons.org/licenses/by/4.0/).
Share and Cite
Lindqvist, J.; Kolb, J.; de Winter, J.; Tonino, P.; Hourani, Z.; Labeit, S.; Ottenheijm, C.; Granzier, H. Removal of MuRF1 Increases Muscle Mass in Nemaline Myopathy Models, but Does Not Provide Functional Benefits. Int. J. Mol. Sci. 2022, 23, 8113. https://doi.org/10.3390/ijms23158113
Lindqvist J, Kolb J, de Winter J, Tonino P, Hourani Z, Labeit S, Ottenheijm C, Granzier H. Removal of MuRF1 Increases Muscle Mass in Nemaline Myopathy Models, but Does Not Provide Functional Benefits. International Journal of Molecular Sciences. 2022; 23(15):8113. https://doi.org/10.3390/ijms23158113
Chicago/Turabian StyleLindqvist, Johan, Justin Kolb, Josine de Winter, Paola Tonino, Zaynab Hourani, Siegfried Labeit, Coen Ottenheijm, and Henk Granzier. 2022. "Removal of MuRF1 Increases Muscle Mass in Nemaline Myopathy Models, but Does Not Provide Functional Benefits" International Journal of Molecular Sciences 23, no. 15: 8113. https://doi.org/10.3390/ijms23158113
APA StyleLindqvist, J., Kolb, J., de Winter, J., Tonino, P., Hourani, Z., Labeit, S., Ottenheijm, C., & Granzier, H. (2022). Removal of MuRF1 Increases Muscle Mass in Nemaline Myopathy Models, but Does Not Provide Functional Benefits. International Journal of Molecular Sciences, 23(15), 8113. https://doi.org/10.3390/ijms23158113