1. Introduction
Non-small-cell lung cancer (NSCLC) is a common subtype of lung cancer, accounting for almost 85% of all cases. Growing evidence has revealed that epidermal growth factor receptor (EGFR) is highly expressed in NSCLC cells, and its activation via ligand binding (epithermal growth factor) can induce phosphorylation via tyrosine kinase activity and consequently promote tumor cell proliferation [
1]. Gefitinib (ZD1839 or Iressa) is the most remarkable first-generation EGFR tyrosine kinase inhibitor (TKI), applied as a first-line NSCLC therapy. Mutations located in the
EGFR tyrosine kinase region (exon 19 deletion or exon 21
L858R mutation) have been closely linked to patients’ positive response to gefitinib [
2,
3]. Despite the initial positive response, most patients inevitably develop acquired resistance, accompanied by severe side effects due to the use of high-dose gefitinib. In over 60% of patients, the mechanisms of acquired resistance involve a secondary
EGFR mutation characterized by a threonine to methionine substitution at position 790 (
T790M mutation) [
3]. Meanwhile, multiple studies have revealed additional mechanisms of gefitinib resistance, including the activation of EGFR downstream or parallel mechanisms, epithelial–mesenchymal transition, and cell autophagy [
4,
5,
6,
7,
8,
9]. Although second- and third-generation EGFR-TKIs have been developed to overcome the aforementioned problems, acquired resistance emerges eventually [
10]. Therefore, alternative strategies should be considered.
Drug combination therapy has long been accepted as a potent anti-cancer management to overcome tumor resistance. Although accumulating evidence has highlighted that EGFR-TKI treatment can induce persistent NSCLC cell autophagy, its role in subsequent cell survival is still considered to be contextual [
11,
12]. Since activation of the autophagic pathway beyond a certain threshold may directly promote cell death [
13], we infer that a cell autophagy activator that can augment gefitinib-induced cell autophagy may be a desirable candidate for combination therapy against gefitinib-resistant NSCLC. Rapamycin is a well-studied cell autophagy activator that functions as an inhibitor of the mammalian target of rapamycin (mTOR), which is a negative regulator of cell autophagy located downstream of the EGFR signaling pathway. Furthermore, since mTOR serves as a regulator of cell cycle and growth in response to altered nutrient levels in multiple types of cancer cells, rapamycin is effective against almost all types of solid tumors [
14,
15]. Therefore, we speculate that rapamycin can not only improve the therapeutic efficacy of gefitinib through the induction of autophagic cell death but also kill NSCLC cells through its anti-tumor activity.
Regarding drug combination therapy, drug toxicity is a significant problem. Moreover, if drugs with dissimilar pharmacokinetic profiles are administrated in a free molecular form, the combinational agents cannot be effectively delivered to the target sites with desirable distribution and duration [
16]. In this context, studies on co-delivery and targeted delivery using nanomedicine have opened extraordinary opportunities for facilitating drug retention and uptake by tumor cells. For instance, ligand-conjugated chitosan nanoparticles have been widely applied in cancer diagnosis and therapy owing to the outstanding cell membrane affinity and biocompatibility of chitosan and its remarkable potential for targeted drug delivery [
17,
18]. Recently, oligonucleotide aptamers have garnered much popularity in targeted drug delivery, since they can bind the target proteins with high affinity and low immunogenicity [
19]. In a previous study, the high affinity of an anti-EGFR aptamer toward EGFR and its successful application offered novel insights into the development of an anti-EGFR aptamer-functionalized chitosan nanoparticle (NP-Apt) carrier system [
20].
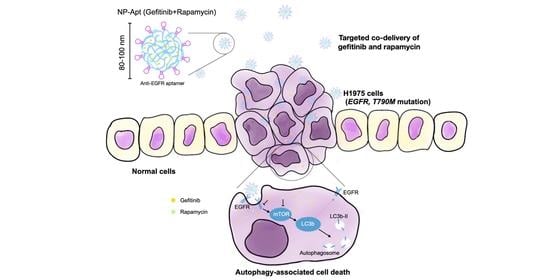
To this end, in the present study, we experimentally demonstrated a strategy to overcome gefitinib resistance in NSCLC through nanomedicine-based drug combination therapy. The combination of gefitinib and rapamycin efficiently induced autophagic cell death. Additionally, we examined the therapeutic efficacy of this combination therapy in the human NSCLC cell line H1975 (harboring L858R and T790M mutations) and investigated whether it links with autophagy-mediated cell death. To minimize side effects, we further constructed an NP-Apt carrier system and subsequently evaluated its cell toxicity and targeted delivery efficiency in vitro. Overall, the proposed drug combination therapy appears efficient in the treatment of gefitinib-resistant NSCLC, and the developed aptamer-modified nanoparticles show great potential in improving the targeted delivery efficiency and therapeutic efficacy of the combined medication.
3. Discussion
Gefitinib’s reversible suppression of
EGFR mutant tumors has gained global approval since its first in-human dosing in 1998, but acquired resistance ultimately occurs, and this has become a major restriction in advanced NSCLC [
26]. Although novel EGFR-TKIs are being developed, their irreversible binding or broader inhibition of the HER family still has obstacles, such as acquired resistance and severe side effects [
27,
28]. In this regard, we aim to demonstrate an effective therapeutic way to overcome gefitinib resistance and eliminate advanced NSCLC cells effectively. This study was carried out utilizing advanced human NSCLC cell line H1975, which harbors both activating EGFR mutation (
L858R) and secondary mutation (
T790M) on the EGFR tyrosine kinesis domain. Some studies have shown that EGFR-TKI treatment can induce cell autophagy, and this is considered a self-protective process for cells from being damaged by EGFR-TKI treatment [
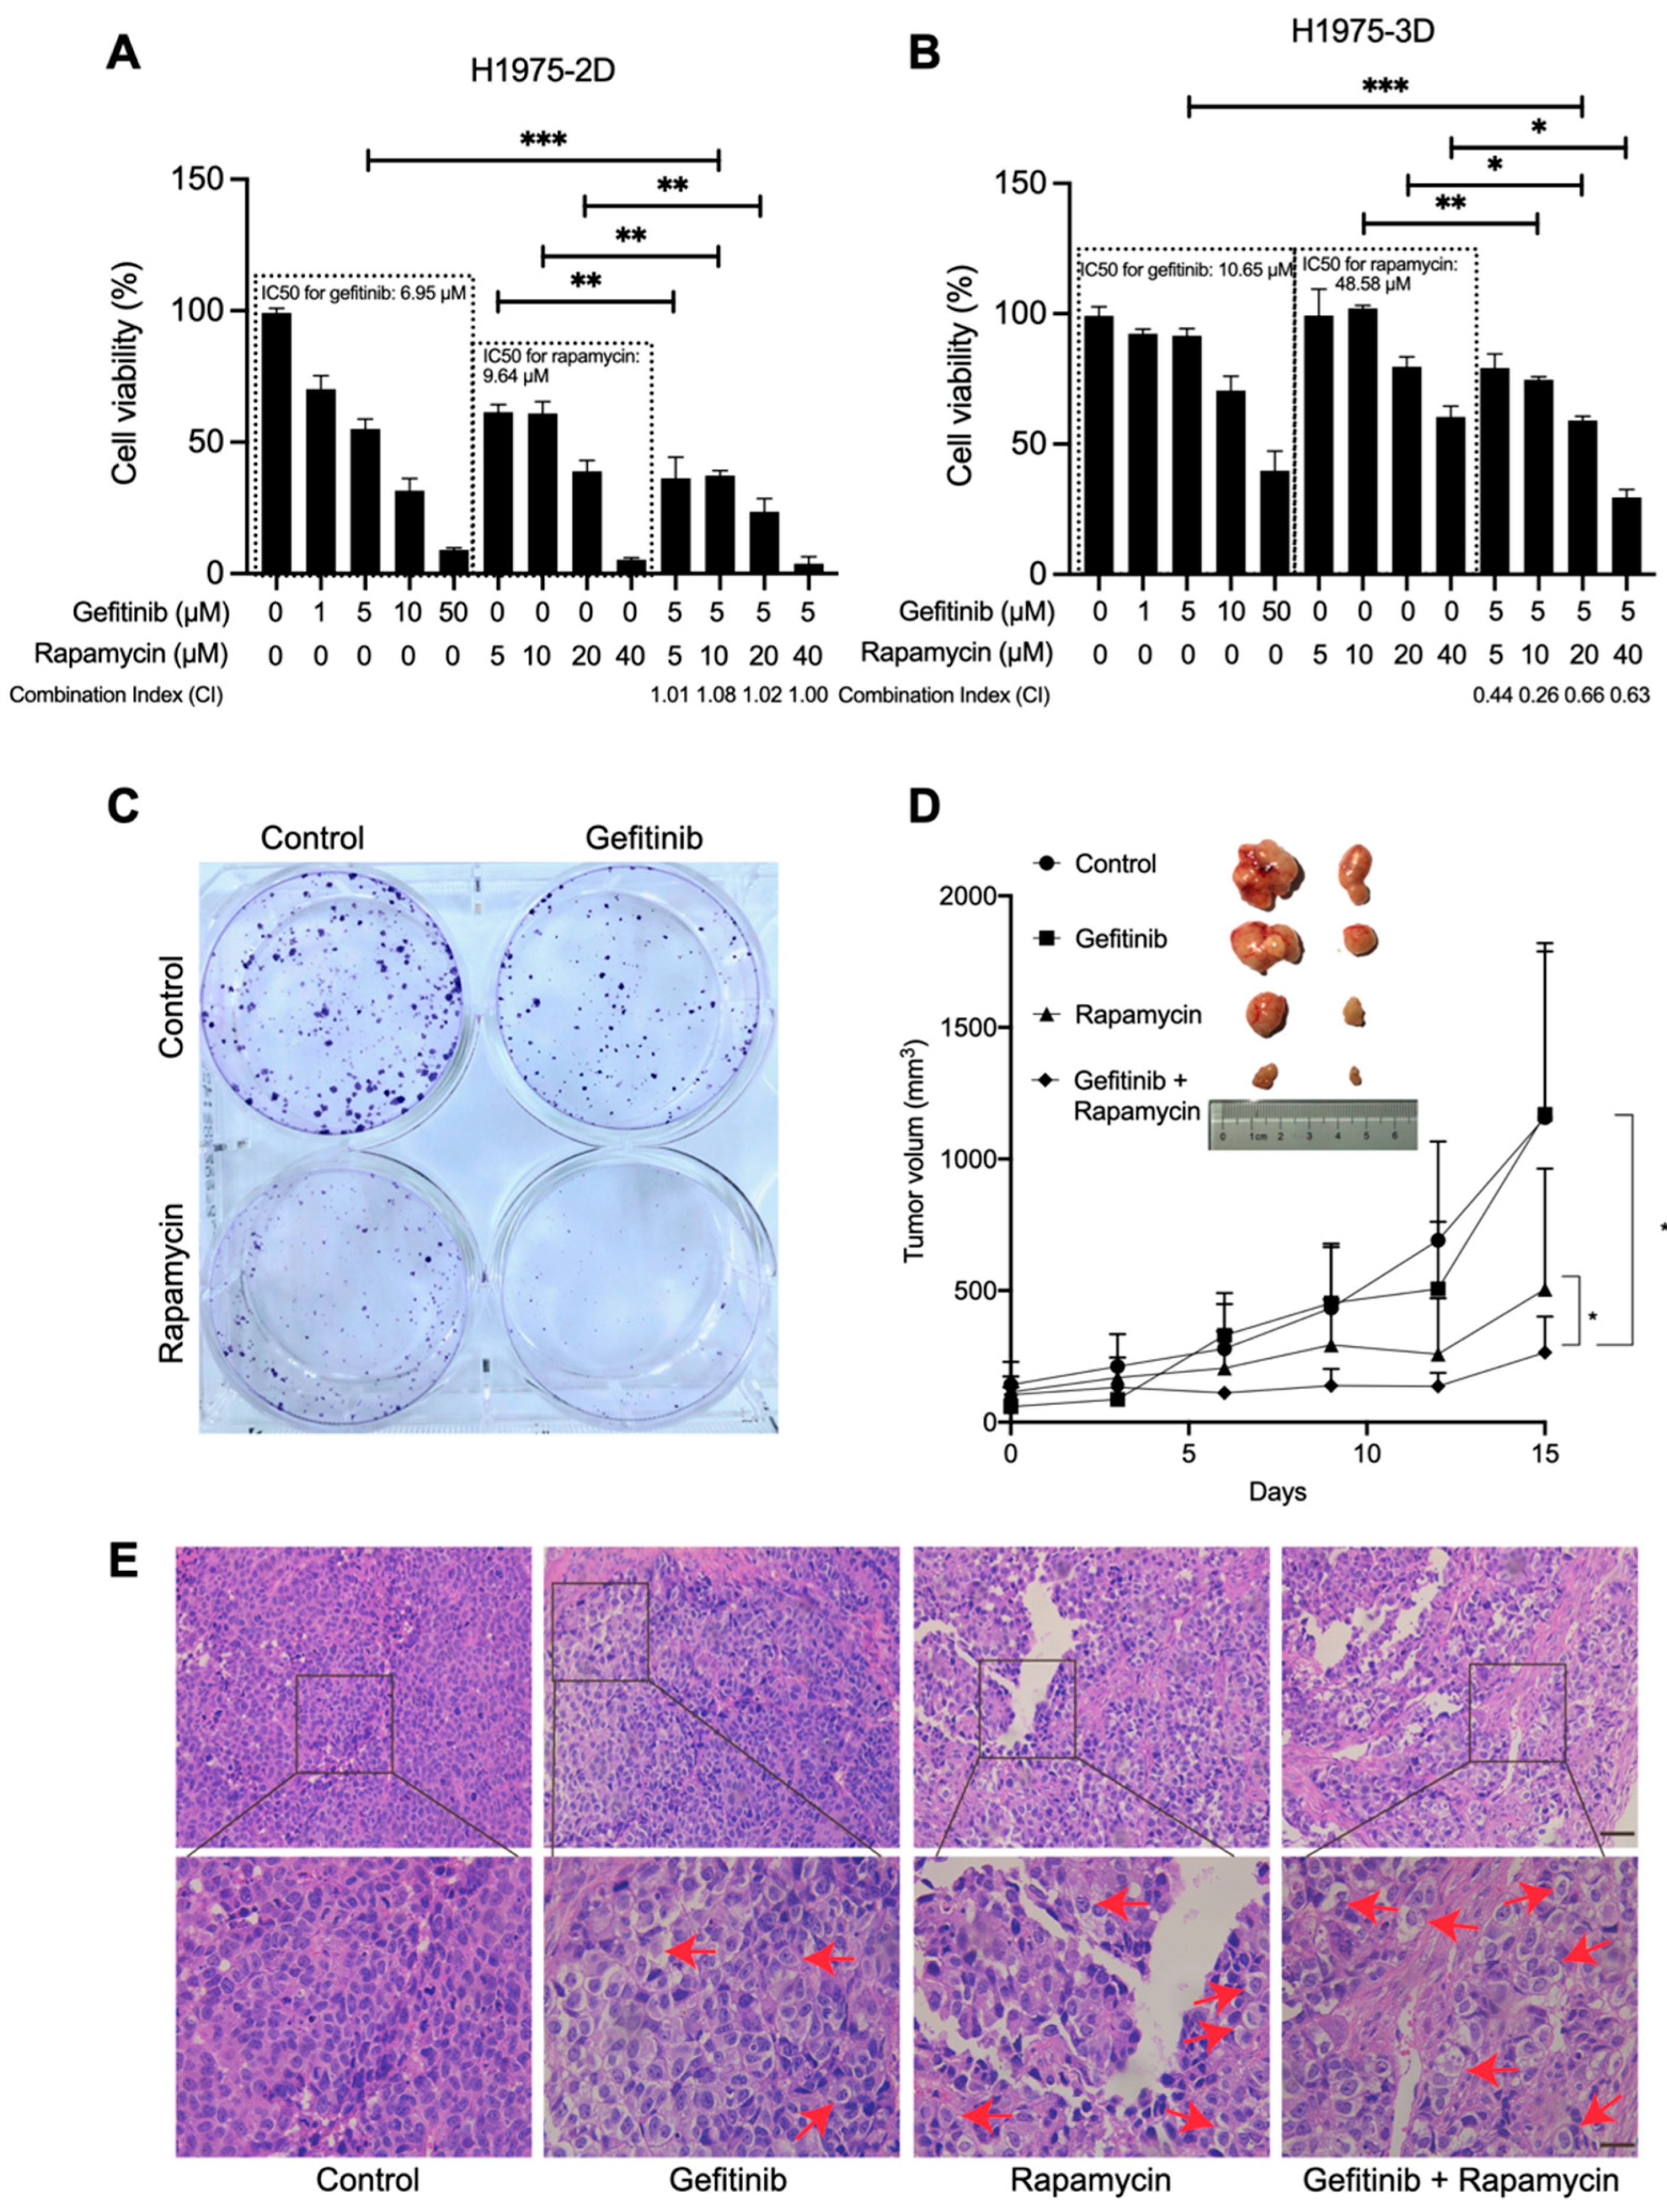
12]. However, cell autophagy is a double-edged sword controlling cell fate in a precise way: it supports cell survival via digestion and recycling, but in certain physiological and pathological conditions, it leads to cell death, characterized by cytoplasmic vacuolation. Therefore, we speculated that a potent cell autophagy activator, rapamycin, could be a component of drug combination therapy to induce autophagic cell death in advanced NSCLC cells. In this study, we validated the high therapeutic potential of concomitant treatment with gefitinib and rapamycin on 2D/3D cultures and tumor xenografts (
Figure 1A,B,D). Although the CI in 2D cultures suggested that the drugs are additive, we still believe rapamycin is an effective sensitizer of gefitinib in inhibiting the growth of H1975 cells in vitro and in vivo since 3D cultures are better in vitro models. Further, SynergyFinder 2.0 calculation (
Figure S2) also suggested gefitinib and rapamycin are actually synergistic.
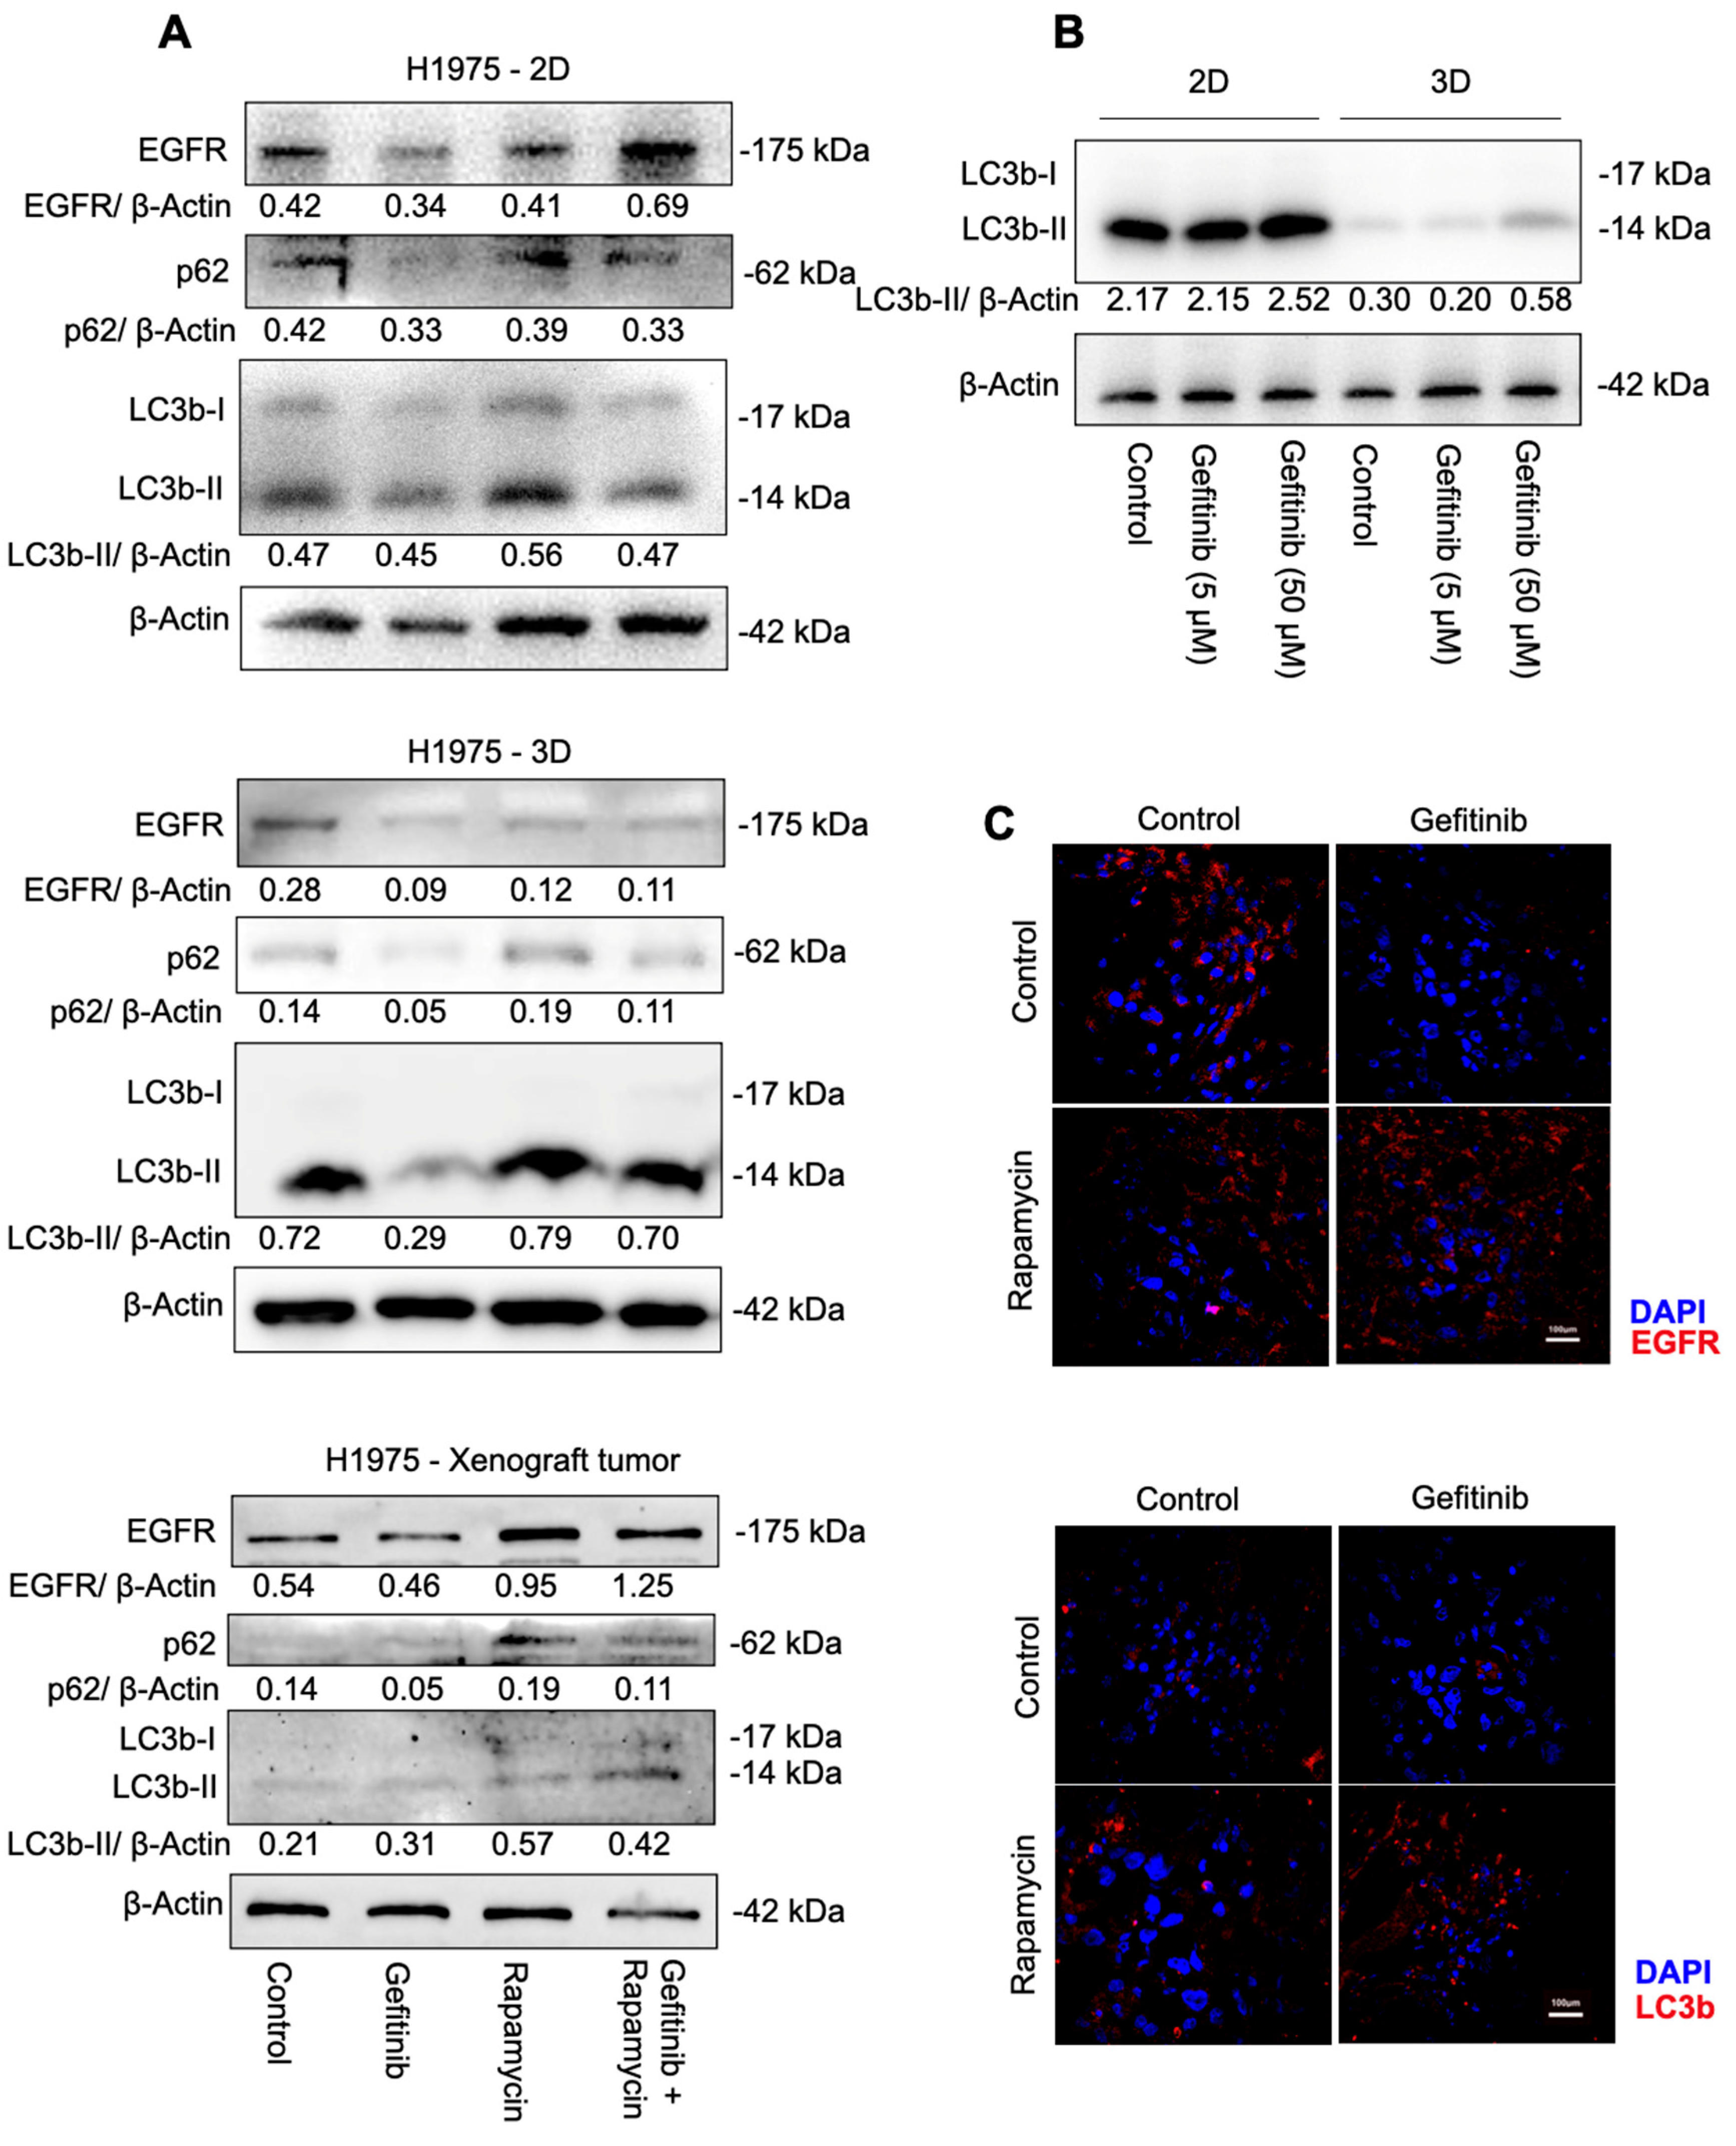
To define the role of cell autophagy in H1975 cells under the treatment of gefitinib, rapamycin, and the combination of gefitinib and rapamycin, we examined cell autophagy-related protein expression under different treatments. Increased LC3b-II in H1975 cells suggested that the combination of gefitinib and rapamycin induced cell autophagy significantly compared with gefitinib mono-treatment, whereas a slight decrease in LC3b-II also suggested that gefitinib caused downregulation of cell autophagy (
Figure 2A). Meanwhile, p62 showed consistent upregulation with LC3b-II expression rather than being selectively degraded by autophagy, suggesting that autophagosomes are accumulated in cells instead of being fused with lysosomes and degraded after 48 h of treatment. The expression of cleaved PARP and Caspase-3 at 89 and 17 kDa (
Figure S4) confirmed that the combination therapy successfully induced H1975 cells to death. Taken together, our data demonstrated that rapamycin mono-treatment and the combination of gefitinib and rapamycin both elevated cell autophagy levels, whereas rapamycin mono-treatment failed in cancer cell elimination. Thus, whether H1975 cell death could be classified as cell autophagic cell death remains unclear. We can only reasonably conclude that cell autophagy is closely related to the drug combination therapeutic effect, other cell activities’ inter-connection, or an alteration of cell tolerance of autophagy under gefitinib treatment could be reasonable.
Additionally, there was a huge cell autophagy variation between 2D cultures and 3D cultures. A complete inhibition of autophagy was observed in cells grown in the 3D culture system compared with cells grown in the 2D culture system (
Figure 2B). Our data suggested that the gefitinib IC
50 values in 3D cultures (10.64 μM) were slightly higher than in 2D cultures (6.95 μM); in addition, a high concentration of gefitinib (50 μM) inhibited 2D cell proliferation enormously and 3D cell proliferation poorly (
Figure 1A,B). These observations also mirror the current cancer studies in that 3D cultures often display lower cell proliferation and higher resistance to chemotherapeutic drugs [
29]. Since 3D cell culture systems are widely considered an approach closer to complex in vivo conditions, we concluded that cell autophagy was actually inhibited in H1975 cells and that gefitinib treatment also failed to induce cell autophagy induction.
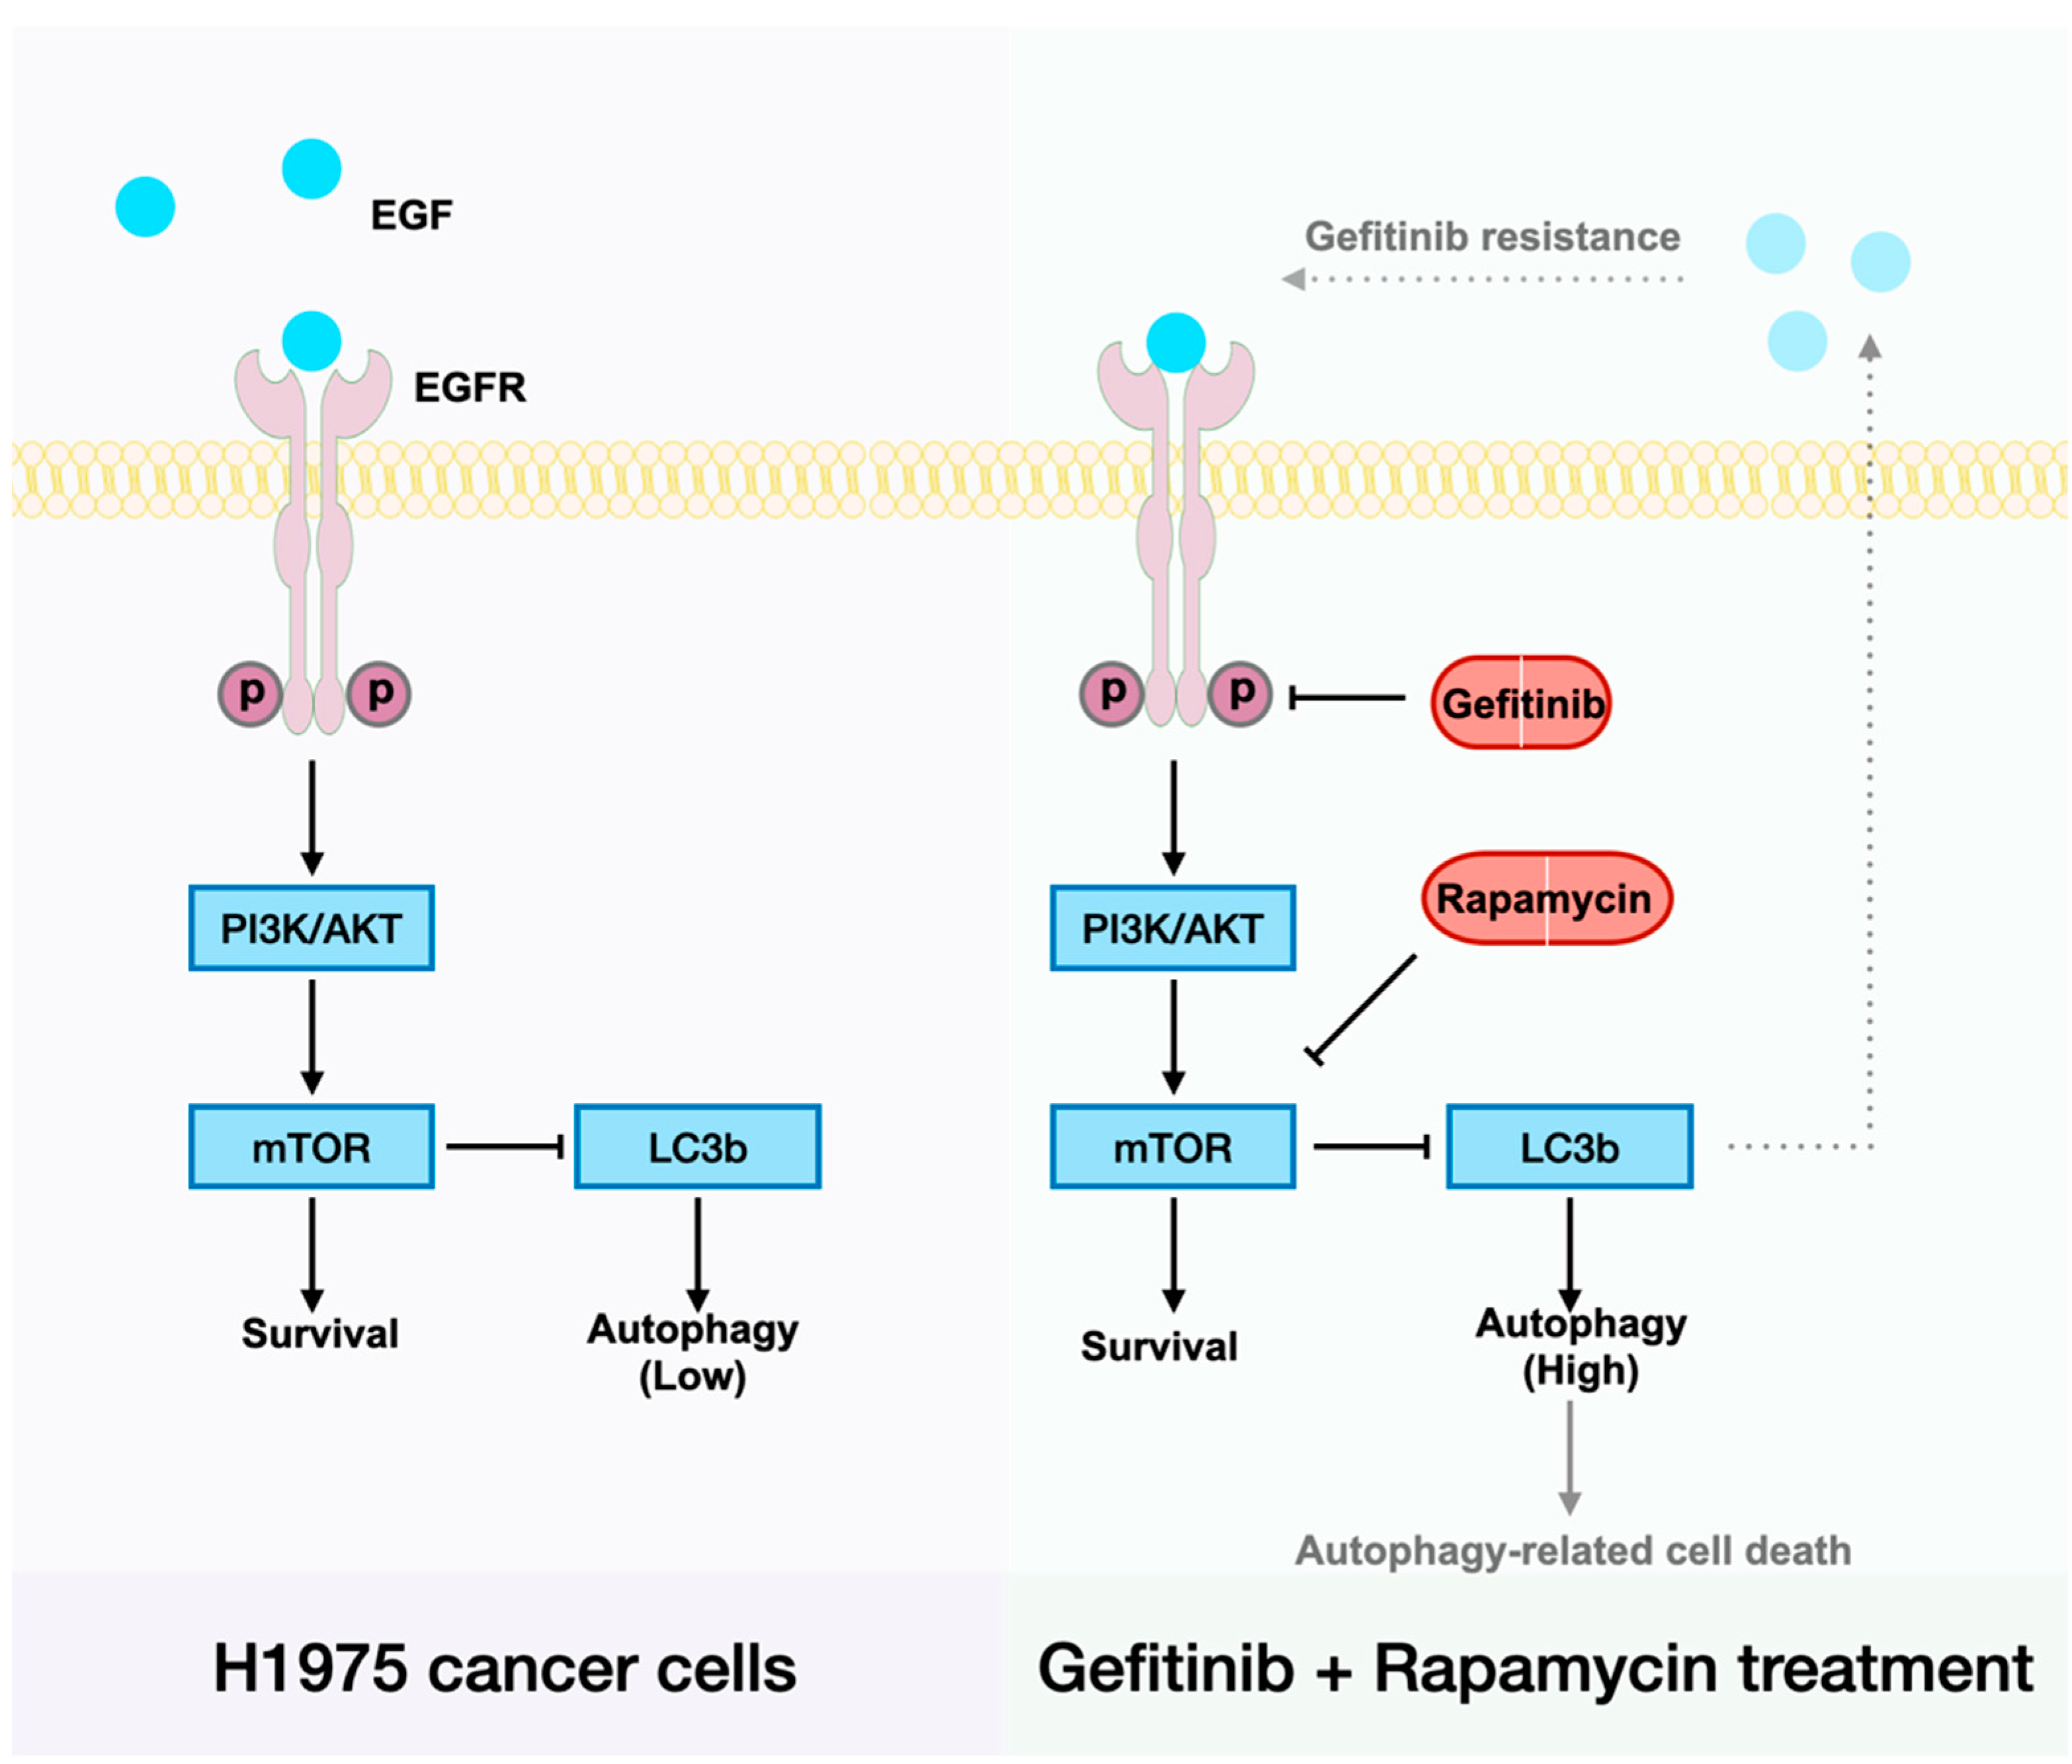
Our mechanistic studies have suggested that H1975 expresses low levels of EGFR when treated with gefitinib, and that there is a clear positive correlation between EGFR and cell autophagy induction (
Figure 2A,C). Recently, Song et al. reported a novel LC3b–EGF–EGFR regulation in NANOG
+ tumor cells and demonstrated that LC3b contributed to the secretion of EGF, thereby activating EGFR signaling [
30]. Accordingly, we suggest that increased LC3b may lead to increased EGF–EGFR signaling and then relief gefitinib resistance in H1975 cells (
Figure 5). To be specific, less EGFR expression made gefitinib useless, the arisen of other receptors on the cell membrane such as MET also contributes to gefitinib resistance in NSCLC cells [
7]. When H1975 cells were treated with rapamycin and gefitinib simultaneously, rapamycin could first inhibit mTOR, lead to LC3b overexpression and thereby enhance EGF secretion. As the receptor of EGF, more EGFR will exist on the cell membrane, and the EGFR–AKT signaling pathway will become significant for cell survival. Next, gefitinib will inhibit EGFR and prevent cell proliferation. In the end, cells will die of autophagy-related mechanisms.
Although the mechanism remains unclear, the proposed gefitinib and rapamycin drug combination therapy has been validated to be efficient in gefitinib-resistant tumor regression. For a better clinical application, we investigated NP-Apt as a desirable delivery system. Its properties of co-encapsulation and target drug delivery strategy could tune the dose of drugs and coordinate drug biodistribution. Chitosan is cationic and mucoadhesive, the ligand-receptor interaction could also mediate endocytosis. All the aforementioned characteristics of NP-Apt-enabled drugs to remain at the target site for a longer period.
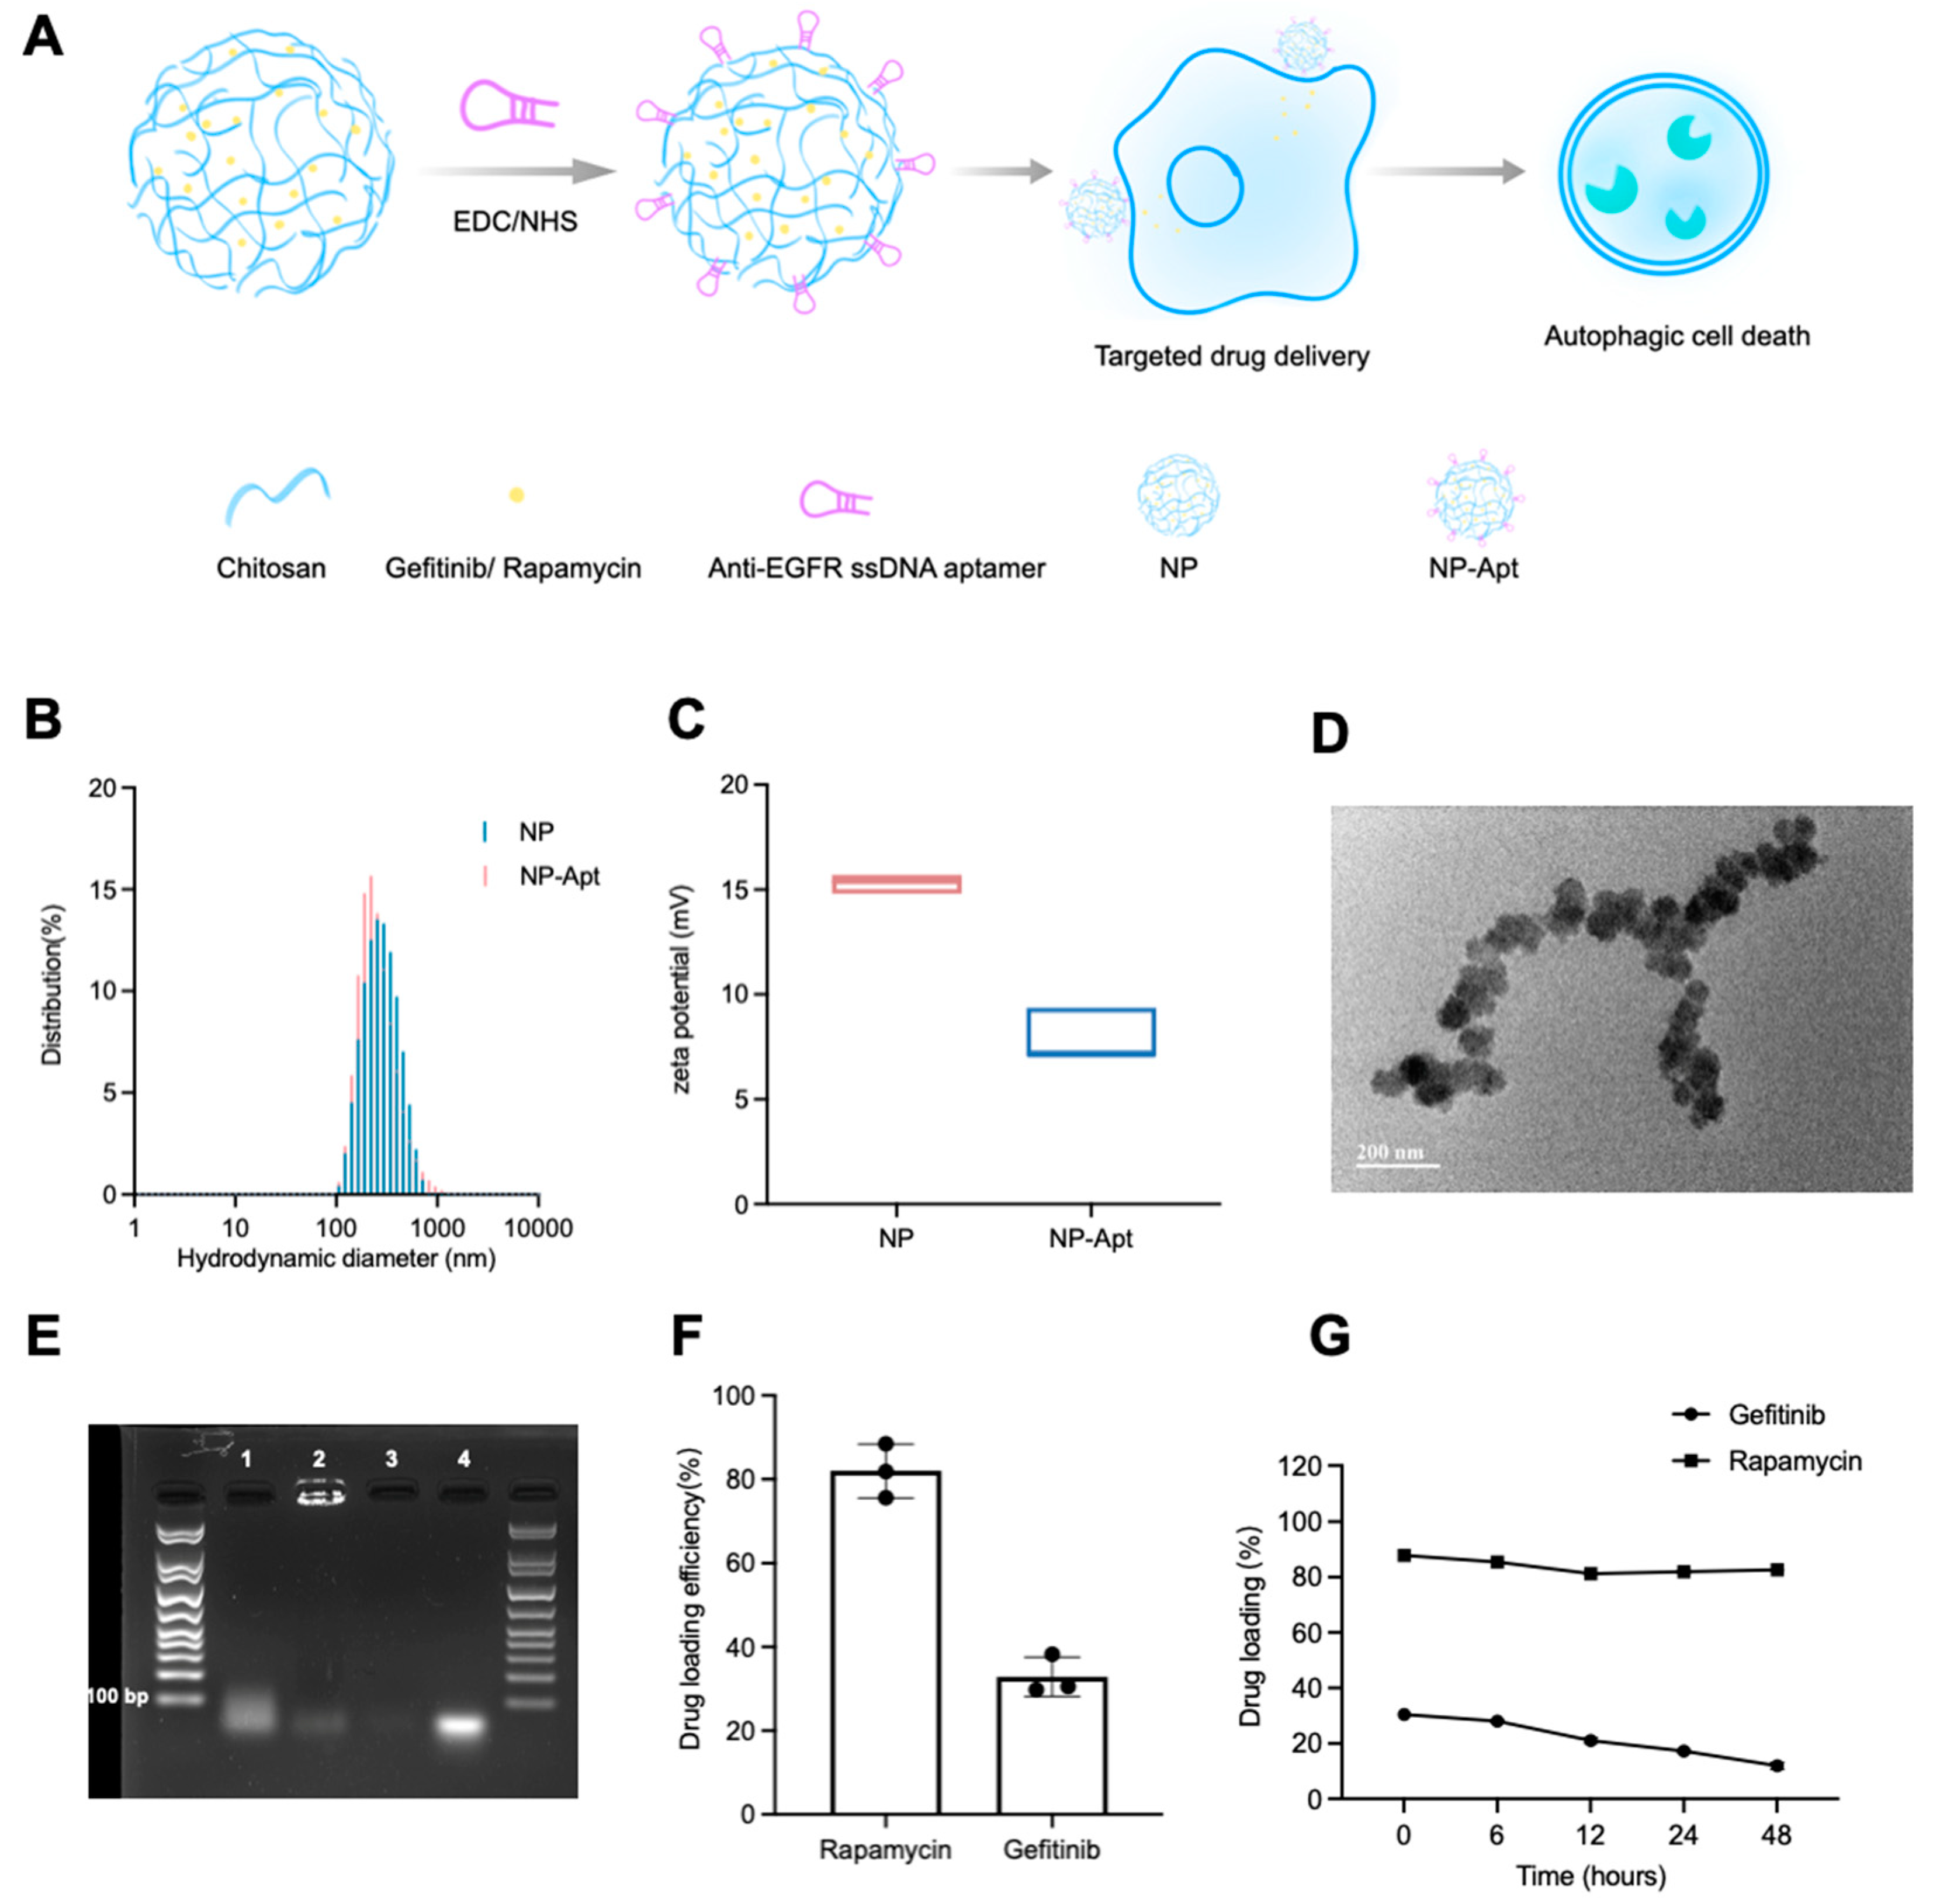
TEM images of NP-Apt revealed its spherical morphology with a diameter less than 100 nm (
Figure 3D), which is beneficial to drug delivery in terms of enhanced permeability, retention, and cellular uptake through electronic attraction with the cell membrane. Meanwhile, the good stability of NP-Apt-enabled drugs (gefitinib + rapamycin;
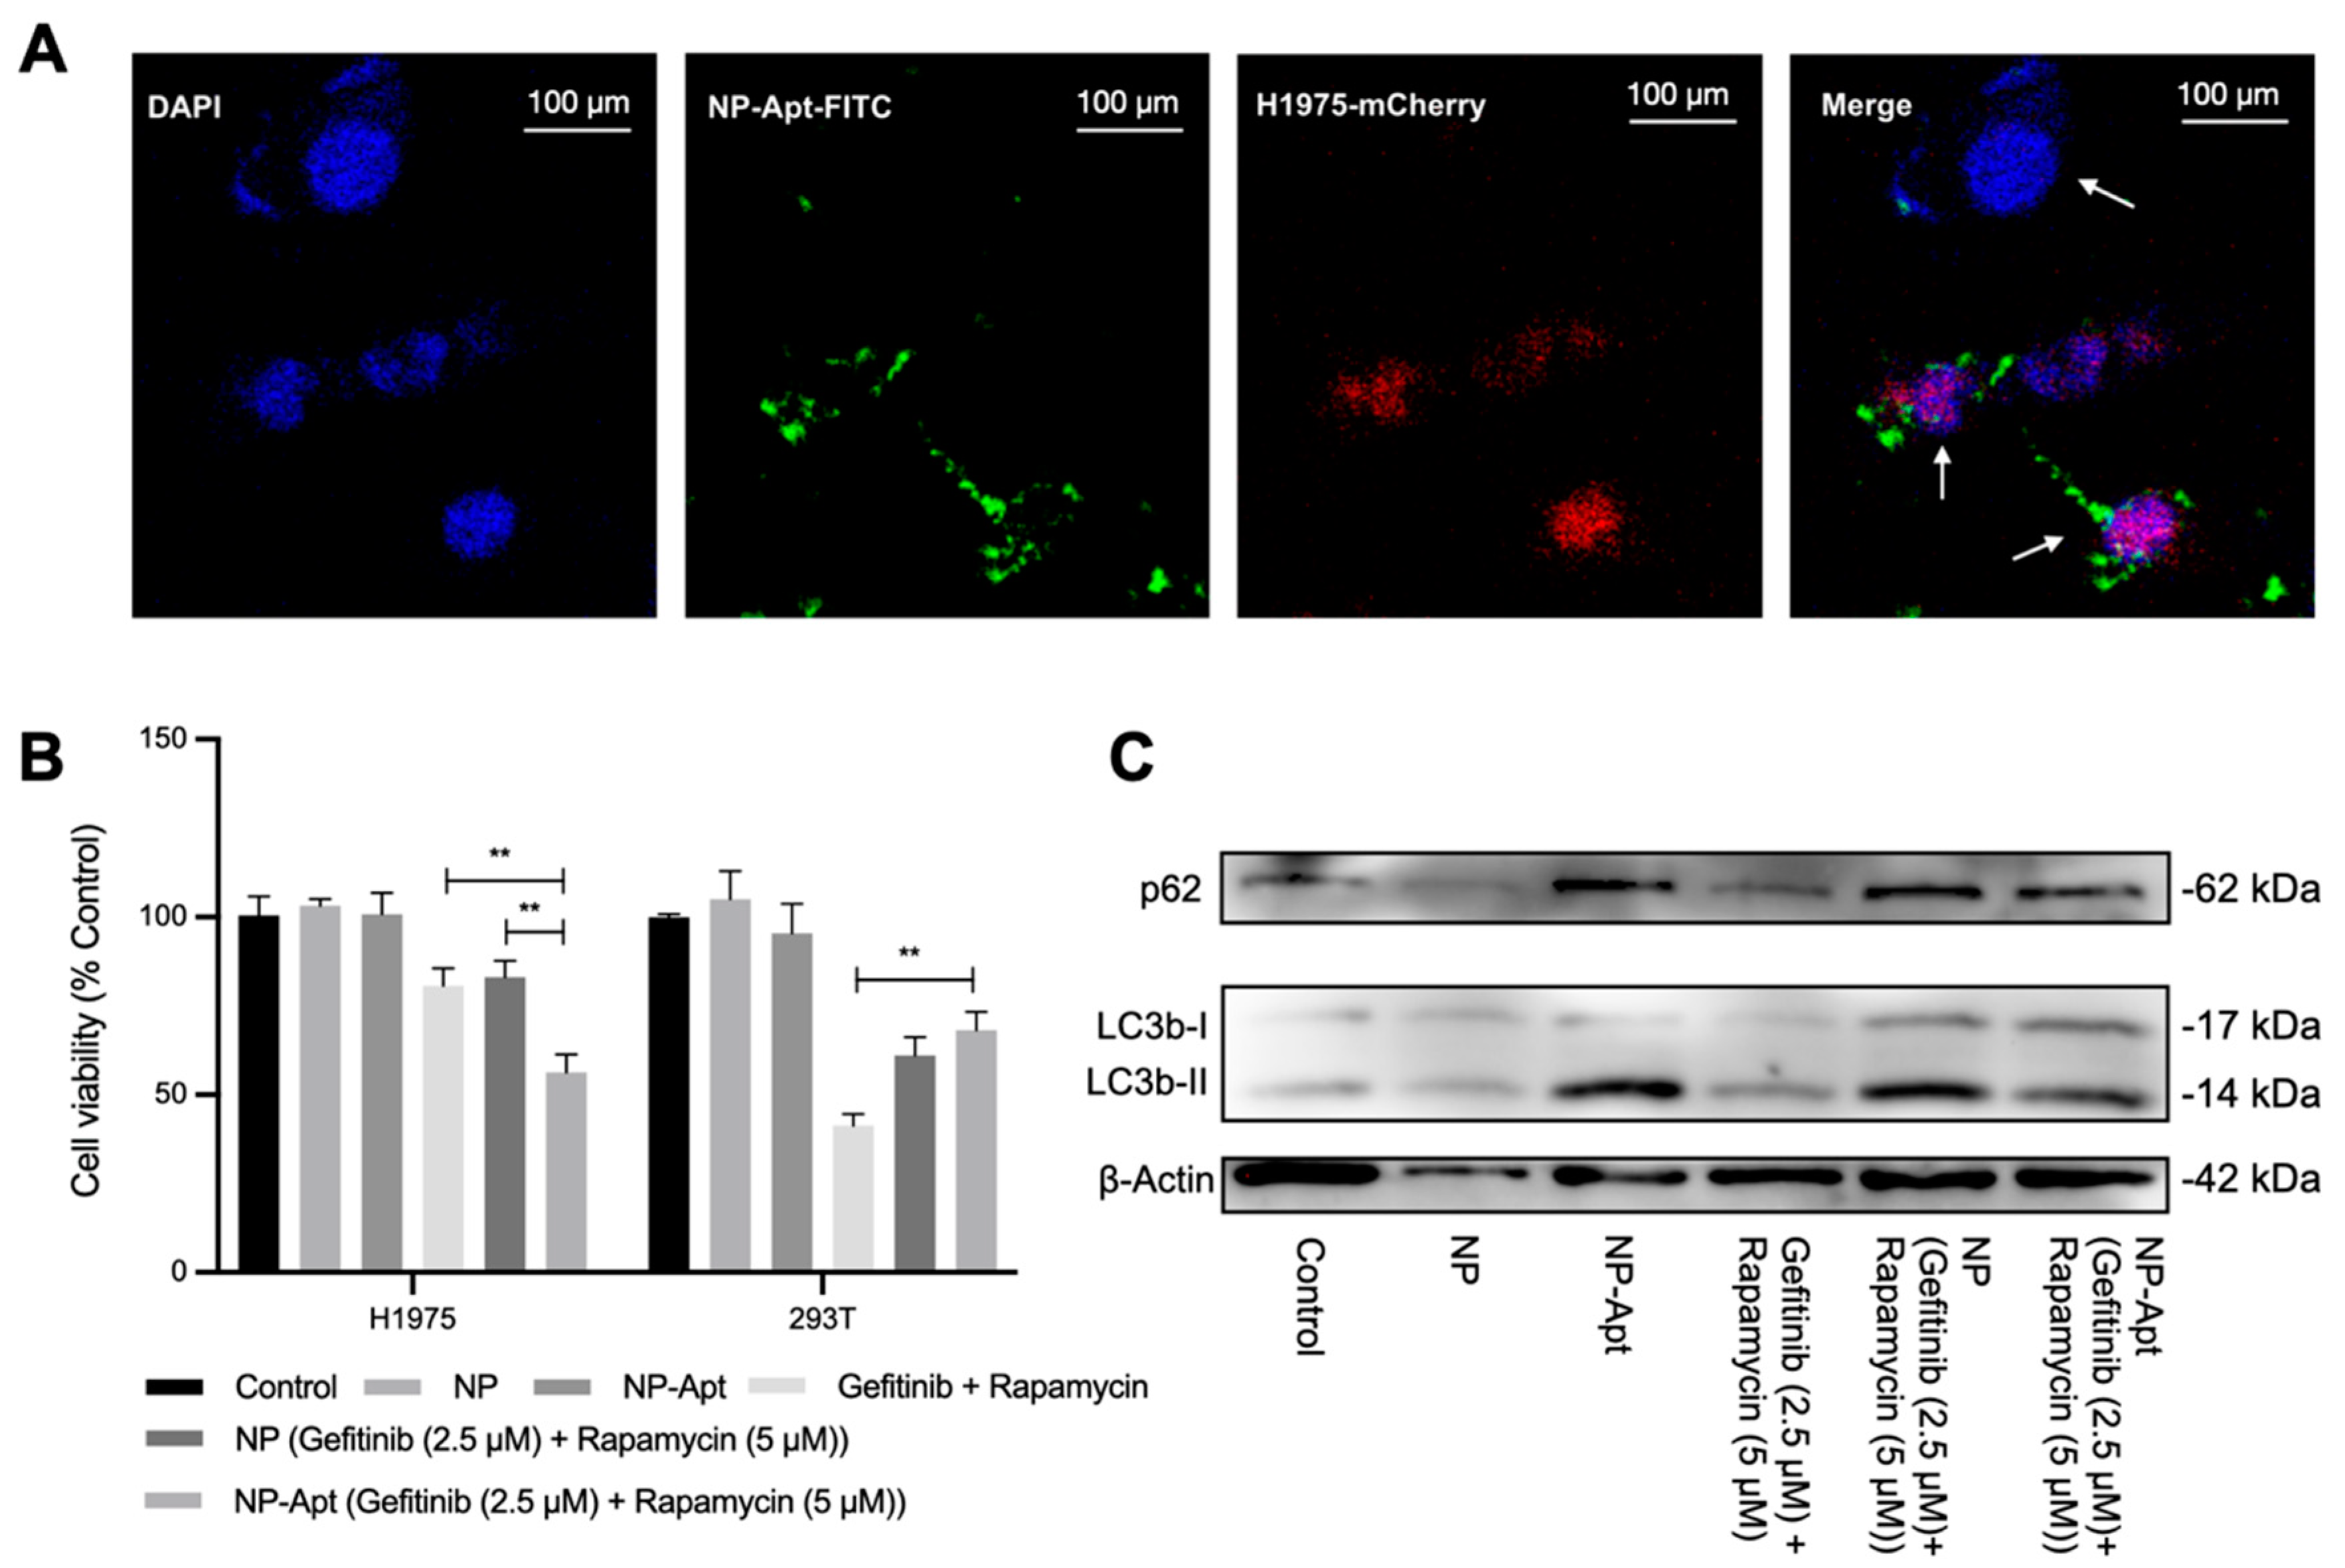
Figure 3G) to be delivered to the tumor area without significant leakage. The target delivery was verified through confocal observation of FITC-tagged NP-Apt in target cells and control cells. Co-localization of red, green, and blue fluorescence indicated NP-Apt could be accumulated around target cells (
Figure 4A). following cell viability assay of NP-Apt (gefitinib + rapamycin) also confirmed its therapeutic efficiency in target and non-target cells (
Figure 4B). The Western blotting analysis proved the mechanism of modified nanomedicine could activate cell autophagy as drug combinational treatment did, indicating a potential cellular function of anti-EGFR aptamer in cell autophagy activities (
Figure 4C), which is worth further investigation. Taken together, the results indicated that NP-Apt (gefitinib + rapamycin) is promising for the improvement of the drug combination therapy in vivo.
In conclusion, we described a nanomedicine that can overcome EGFR-TKI resistance in NSCLC cells based on a drug combination strategy. Gefitinib and rapamycin synergistically inhibit advanced human NSCLC cell line (H1975, harboring EGFR T790M secondary mutation) proliferation and tumor formation by upregulating cell autophagy activities, thereby inducing cell autophagy–EGFR positive feedback regulation. Meanwhile, anti-EGFR aptamer-decorated chitosan nanocarriers co-encapsulated gefitinib and rapamycin exalted multi-drug administration accuracy. Our data suggest that rapamycin could be a preferred sensitizer of gefitinib in acquired gefitinib resistance, whereas the crosstalk between cell autophagy and EGFR signal transduction and the potential cellular function of the aforementioned anti-EGFR aptamer is still worth studying.
4. Materials and Methods
4.1. Drugs and Chemicals
Cell counting kit 8, gefitinib hydrochloride, and rapamycin were obtained from Med Chem Express (Beijing, China). A 3D cell viability assay was purchased from Progema (Beijing, China). Antibodies against p62, LC3b, GAPDH, and horseradish peroxidase (HRP)-conjugated goat anti-rabbit IgG were purchased from Cell Signaling Technology; those against EGFR, and β-Actin, PARP, Caspase-3, cleaved Caspase-3 were obtained from Abclonal (Wuhan, China). Matrigel was purchased from Corning. Chitosan (deacetylation degree ≥ 95%, biotechnology level) and sodium tripolyphosphate (TPP) were purchased from Macklin (Shanghai, China).
4.2. Cell Culture
Two-dimensional (2D)- and three-dimensional (3D)-cultured H1975 cells were maintained in a cell culture incubator at 37 °C with 5% CO
2 with RPMI 1640 medium (Thermofisher, Shanghai, China) supplemented with 10% fetal bovine serum (FBS, Tsingmu Biotechnology, Wuhan, China). Three-dimensional cultures were formed through mixing H1975 cells with Matrigel (Corning, NY, USA) using microfluidic technology, as we previously reported [
21].
4.3. Cell Viability Assay
Two-dimensional and 3D cell viabilities were assessed using a CCK-8 and 3D cell viability assay (Promega, Madison, WI, USA), respectively. Two-dimensional cultures (8000 cells per well) and 3D cultures (one cell spheroid per well) were seeded in the 96-well plate and treated with various concentrations of gefitinib, rapamycin, gefitinib + rapamycin, NP, NP-Apt, NP (gefitinib + rapamycin), and NP-Apt (gefitinib + rapamycin) for 48 h. Next, CCK-8 solution and 3D cell viability assay reagent were added to each well, respectively. For 2D cultures, absorbance was measured at 450 nm (Thermo, Waltham, MA, USA) after 1 h of incubation at 37 °C. For 3D cultures, the luminescence signal (Thermo, USA) was read after 30 min of incubation at room temperature.
4.4. Clonogenic Assay
Two-dimensional-cultured H1975 cells were seeded into six-well plates at a density of 2000 cells per well, and they were cultured in the medium with 5% FBS at 37 °C in a humidified atmosphere containing 5% CO2. The cells were treated with medium, gefitinib (5 μM), rapamycin (10 μM), and gefitinib (5 μM) + rapamycin (10 μM). After 15 days, cells were washed twice with PBS and then fixed with paraformaldehyde for 15 min. The cells were stained with 0.1% crystal violet for 30 min and then visualized under a camera (Nikon, Tokyo, Japan).
4.5. In Vivo Tumorigenesis Assay
The H1975 mouse lung cancer model was established for the following in vivo evaluation. Female BALB/C nude mice (4–6 weeks of age) were purchased from Guangdong Medical Laboratory Center, and all mice were handled under the protocols approved by the Institutional Animal Care Committee. In this study, 5 × 10⁶ H1975 cells were suspended in 100 μL PBS for subcutaneous injection. After 7 days of tumor formation, the mice were randomized into four groups (control, gefitinib, rapamycin, and gefitinib + rapamycin). Gefitinib (150 mg/kg orally by gavage) and rapamycin (2 mg/kg intraperitoneal injection) were administered every 2 days and continued for 15 days. Body weight and tumor size were recorded, tumor volume was calculated as 0.5 × length × width2, and the animal experiment was repeated three times, with eight mice for each group in total. Body weight and tumor size were recorded every 2 days until the xenograft tumor was stripped for further study, and no significant body weight decrease was observed.
4.6. Histopathology Study
The tissues were fixed with 4% paraformaldehyde and sliced into 8 μm sections after being embedded with paraffin. The hematoxylin and eosin (H&E) staining followed the standard procedure and was observed using optical microscopy (Nikon, Tokyo, Japan).
4.7. Western Blotting
H1975 with different treatments were cultured in the 2D/3D cell culture system for 48 h and then lysed with RIPA lysis (Beyotime, Haimen, China) buffer at 4 °C. The DNA or Matrigel was removed via centrifugation (ThermoFisher, Waltham, MA, USA) at 10,000 rpm for 15 min. Total protein was quantified with a BCA Protein Assay Kit (ThermoFisher, USA) and then mixed with loading buffer and boiled at 100 °C for 10 min. Protein extracts (30 μg) were resolved and separated by 12.5% sodium dodecyl sulfate-polyacrylamide gel electrophoresis (SDS-PAGE) and then transferred to nitrocellulose membranes. The membrane was incubated in the sequence of blocking solution (5% non-fat milk) for 1 h, primary antibody EGFR, β-Actin, p62, and LC3b solution for 3 h, and HRP-tagged secondary antibody solution for 1 h at room temperature with gentle rocking. The nitrocellulose membranes were washed three times with phosphate-buffered saline with 0.05% Tween-20 (PBST) buffer before every incubation. Finally, the membrane was incubated with enhanced chemiluminescence for 5 min, and the blot was imaged using an X-ray imaging system (Bio-Rad, Hercules, CA, USA). Every experiment was performed at least 3 times. The relative ratio of EGFR, p62, and LC3b-II to β-Actin was evaluated using Image J software.
4.8. Immunofluorescence
Sliced tumor tissue samples were fixed in 4% paraformaldehyde for 30 min. After being blocked with 3% BSA/PBS, the cells were stained with primary antibodies (EGFR, LC3b), followed by staining with the corresponding fluorophore-conjugated secondary antibodies. The cell nucleus was stained with DAPI for 10 min. Samples were mounted on coverslips and examined under a confocal microscope (Olympus, Tokyo, Japan).
4.9. Aptamer-Functionalized Drug-Loaded Chitosan Nanoparticle Preparation
Chitosan nanoparticles (NP) were prepared by ionic crosslinking with sodium tripolyphosphate (TPP) according to the methodology of Alessandro et al. [
31]. Specifically, gefitinib and rapamycin were dissolved into 10 mL of chitosan solution (2 mg/mL dissolved in 1% acetum, pH 5), and 3 mL of TPP (2 mg/mL) was added to the system in a dropwise fashion under room temperature with magnetic stirring at 800 rpm for 30 min.
Aptamer-modified chitosan nanoparticle (NP-Apt) was synthesized using the EDC/NHS conjugation method. In short, 1 nmol of carboxyl-modified anti-EGFR aptamer [
20] (5′-TAC CAG TGC GAT GCT CAG TGC CGT TTC TTC TCT TTC GCT TTT TTT GCT TTT GAG CAT GCT GAC GCA TTC GGT TGA C-3′) was conjugated to 8 mg of NP by adding EDC and NHS and stirring at room temperature for 3 h. The final concentrations of EDC and NHS were 50 and 5 mM, respectively. The final product—namely NP, NP (gefitinib + rapamycin), NP-Apt, or NP-Apt (gefitinib + rapamycin)—was obtained via centrifuging (ThermoFisher, USA) at 10,000 rpm at 4 °C for 10 min, washing twice with distilled water, and suspending the product suspended in cell culture medium for future study.
4.10. Characterization of NP and NP-Apt
Particle size and electrostatic potential were measured using a nano dynamic light scattering analyzer (Malvern, Worcestershire, UK). The shape and surface morphology of NP-Apt were observed using transmission electron microscopy (TEM, FEI Tecnai G2 Spirit, Hillsboro, OR, USA).
4.11. Agarose Analysis
Agarose gel electrophoresis was used to confirm the conjugation of aptamer binding on the NP surface. Ten microliters of the mixture of Apt and NP, NP-Apt, NP, and free aptamer was mixed with loading buffer and then loaded on the agarose gel stained with SYBR green. The electrophoresis picture was obtained using the Bio Rad ChemiDoc MP imaging system (Hercules, CA, USA).
4.12. Drug Loading Efficiency and Stability
Drug concentration was detected using a UV–visible spectrophotometer (Agilent, Santa Clara, CA, USA) at 343 and 283 nm after NP-Apt (gefitinib + rapamycin) was removed from the system through centrifuging. Drug loading efficiency was calculated by subtracting the unencapsulated drug amount from the original amount. We detected drug-loading stability by monitoring an in vivo drug release: NP-Apt (gefitinib + rapamycin) was suspended in PBS at 37 °C, and the concentration of encapsulated drug was calculated by the detection of drug released concentration at specific times (6, 12, 24, 48 h).
4.13. Cellular Uptake and Target Delivery of NP-Apt
Cells from the 293T and H1975 lines labeled with a red fluorescent protein (H1975-mCherry) were cocultured and incubated with FITC-tagged NP-Apt (NP-Apt-FITC) for 3 h. Then, the cell nuclei were counterstained with DAPI. The specimens were examined under a confocal laser scanning microscope (Olympus, Japan).
4.14. Statistical Analysis
All data were repeated at least three times and presented as the mean ± standard deviation (SD). The comparison was performed using a two-tailed paired Student’s
t-test. (*
p < 0.05, **
p < 0.01, and ***
p <0.001). The combinatorial index (CI) was calculated as CI = (Ea + Eb − Ea * Eb)/Eab, where E means cell viability of compound a or b or the ab (combination of both). The combination of drugs with a 0.9 < CI < 1.1 was considered additive, whereas the combination of drugs with a CI < 0.9 was considered synergistic. SynergyFinder was used to calculate dose responses and the HSA synergy score. We applied the HSA model to quantify the degree of synergy, and the scores were determined as the average excess response due to drug interactions [
23].


 ,
, 