Article

Arabidopsis Toxicos en Levadura 12 Modulates Salt Stress and ABA Responses in Arabidopsis thaliana

1
Department of Biological Sciences, The University of Alabama, Tuscaloosa, AL 35401, USA
2
Department of Plant Pathology, University of Georgia, Athens, GA 30602, USA
*
Author to whom correspondence should be addressed.
Int. J. Mol. Sci. 2022, 23(13), 7290; https://doi.org/10.3390/ijms23137290
Submission received: 25 May 2022 / Revised: 23 June 2022 / Accepted: 28 June 2022 / Published: 30 June 2022
(This article belongs to the Section Molecular Plant Sciences)

Abstract

:
Salt is one of the most common abiotic stresses, causing ionic and osmotic pressure changes that affect plant growth and development. In this work, we present molecular and genetic evidence that Arabidopsis Toxicos en Levadura 12 (ATL12) is involved in both salt stress and in the abscisic acid response to this stress. We demonstrate that ATL12 is highly induced in response to salt stress and that atl12 mutants have a lower germination rate, decreased root length, and lower survival rate compared to the Col-0 wild-type in response to salt stress. Overexpression of ATL12 increases expression of the salt stress-associated genes SOS1/2, and ABA-responsive gene RD29B. Additionally, higher levels of reactive oxygen species are detected when ATL12 is overexpressed, and qRT-PCR showed that ATL12 is involved in the AtRBOHD/F-mediated signaling. ATL12 expression is also highly induced by ABA treatment. Mutants of atl12 are hypersensitive to ABA and have a shorter root length. A decrease in water loss and reduced stomatal aperture were also observed in atl12 mutants in response to ABA. ABA-responsive genes RD29B and RAB18 were downregulated in atl12 mutants but were upregulated in the overexpression line of ATL12 in response to ABA. Taken together our results suggest that ATL12 modulates the response to salt stress and is involved in the ABA signaling pathway in Arabidopsis thaliana.

1. Introduction

In nature, salt stress is a common abiotic stress that changes plants’ physiology and metabolism and adversely affects overall growth and crop production in agriculture [1]. More than 20% of the world’s arable lands are affected by high salt stress [2,3]. It is estimated that by the year 2050, up to half of the world’s arable land will be lost due to increased salinization [4]. Since the availability of arable lands to feed an increasing world population is limited; a clear understanding of the underlying signal transduction events in the plant response to salt stress is crucial for understanding both plant-environment interactions and in developing transgenic strategies to improve salt tolerance in crops.
To counter salt stress, plants have developed various mechanisms to respond and survive [5]. Due to the osmotic pressure and ionic toxicity caused by salt stress, maintaining ion homeostasis is important to survive under salt stress [6]. NaCl is the major salt form in soils and Na+ accumulation is the primary physiological change observed in cells in response to salt stress [7]. Excess Na+ usually causes the production of a variety of damaging oxygen species in a plant cell [8]. Plants have evolved complex mechanisms to exclude excess Na+ ions to preserve overall growth and survival [9]. The vacuolar-localized Na+/H+ transporter pathway and salt overly sensitive (SOS) pathway are two of the most studied mechanisms. The vacuolar-localized Na+/H+ transporter helps transfer excess Na+ from the cytoplasm to the vacuole, while the salt overly sensitive (SOS) pathway is a conserved regulatory system in plants that mediates active Na+ extrusion from the cytoplasm to the outside of the cell and maintains ion homeostasis in response to salt stress [10,11].
Reactive oxygen species (ROS) production is another early signaling change that occurs in response to salt stress [12]. ROS including hydrogen peroxide (H2O2), hydroxyl radicals (OH•), superoxide anions (O2•−), and singlet oxygen (1O2) is accumulated in plants in response to drought, salt, and cold stress [13]. Recent studies showed that ROS accumulation causes oxidative damage and even cell death if not cleared by the ROS scavenger system [14,15]. ROS at low levels is recognized as a signaling molecule involved in both normal growth [16] and in response to biotic and abiotic stresses [15,17]. The activity of ROS as second messengers is closely related to multiple signaling pathways, including Ca2+-related signaling [18], the Salt-Overly-Sensitive (SOS) signaling pathway [10], and plant hormone signaling pathways [19]. In general, reactive oxygen species production and changing intracellular Ca2+ levels will initiate a downstream protein phosphorylation cascade, including the induction of Calcium-dependent protein kinases (CPKs), that in turn target proteins directly involved in defense or transcription factors controlling the expression of specific salt stress-responsive genes [5,19,20]. The induced stress-responsive genes include some defense-related proteins such as the SOS protein, which extrudes excess ions to maintain ion homeostasis. SOS is also responsible for the generation of the phytohormone abscisic acid (ABA) that is synthesized under high salt conditions and mediates salt tolerance through an ABA-dependent pathway, that eventually promotes salt tolerance and coordinates plant growth and development [21]. In addition, increasing evidence has shown that large numbers of genes are involved in the recognition and response to salt stress in plants including several Arabidopsis receptor-like kinases (RLK) and receptor-like proteins (RLP) [22,23]. The Arabidopsis thaliana histidine kinase receptor protein HK1 is known to complement the loss of the yeast osmotic sensor Sln1 and is involved in response to high osmotic stress [24]. A receptor-like kinase in rice (Oryza sativa), Salt Intolerance 1 (SIT1), a lectin receptor-like kinase, has also been shown to mediate salt sensitivity [25]. One of the chitin receptors, CHITIN ELICITOR RECEPTOR KINASE 1 (CERK1), that is involved in chitin-triggered innate immunity in Arabidopsis has also been shown to play a role in mediating salt signaling [26].
The Arabidopsis Toxicos en Levadura (ATL) gene family encodes a large group of RING (REALLY-INTERESTING-NEW-GENE) zinc-finger domain-containing proteins, which are highly conserved [27,28]. Previous studies have shown that ATL family proteins are involved in multiple defense pathways in Arabidopsis thaliana that are induced by fungal infection, bacterial invasion, wounding stress, cold, drought, and salt stress [29]. For example, the Arabidopsis RING E3 ubiquitin ligase AtATL80 is known to be involved in cold stress response in sufficient phosphate growth conditions [30]. The Arabidopsis E3 ubiquitin ligase ATL9 is involved in fungal defense [31], and suppression of AtATL78 increases tolerance to cold stress and decreases tolerance to drought stress in Arabidopsis thaliana [32]. Our previous studies have shown that ATL12, a gene belonging to the Arabidopsis Toxicos en Levadura 2 family, is involved in crosstalk between hormonal, chitin-induced, and NADPH oxidase-mediated defense responses in Arabidopsis [33].
In this study, we show that ATL12 positively modulates the salt stress response in Arabidopsis thaliana. T-DNA insertional mutants of atl12 showed decreased seed germination and root length growth, as well as a lower overall survival rate. ATL12 is highly induced by salt stress and its expression is upregulated at late stages in response to NaCl stress. In addition, over-expression of ATL12 increases the expression of the salt stress-associated genes SALT-OVERLY-SENSITIVE 1 and 2 (SOS1 and SOS2), the ABA-responsive gene RESPONSIVE TO DESICCATION 29B (RD29B), and the chitin-receptor gene CERK1. An elevated oxidative burst is detected in over-expression of ATL12 in response to NaCl stress, and qRT-PCR showed that Arabidopsis thaliana RESPIRATORY BURST OXIDASE HOMOLOGUE D/F (AtRBOHD/F) may be responsible for the ROS generation, suggesting that ATL12 may positively regulate salt tolerance via regulating AtRBOHD/F mediated ROS production. Mutants of atl12 plants are hypersensitive to ABA treatment, showing a decrease in water loss and reduced stomatal aperture in response to ABA. In contrast, ATL12 overexpression (OE-ATL12) plants have a reduced sensitivity to ABA and show increased water loss and enlarged stomatal aperture compared to Col-0 wild type (WT). qRT-PCR showed expression of ATL12 is highly induced by ABA treatment, and over-expression of ATL12 upregulates the expression of ABA-responsive genes in response to salt, suggesting that ATL12 may enhance salt tolerance through an ABA-mediated pathway in Arabidopsis thaliana. Together these results suggest that ATL12 modulates the response to salt stress and is involved with an ABA-dependent pathway in Arabidopsis thaliana.

2. Results

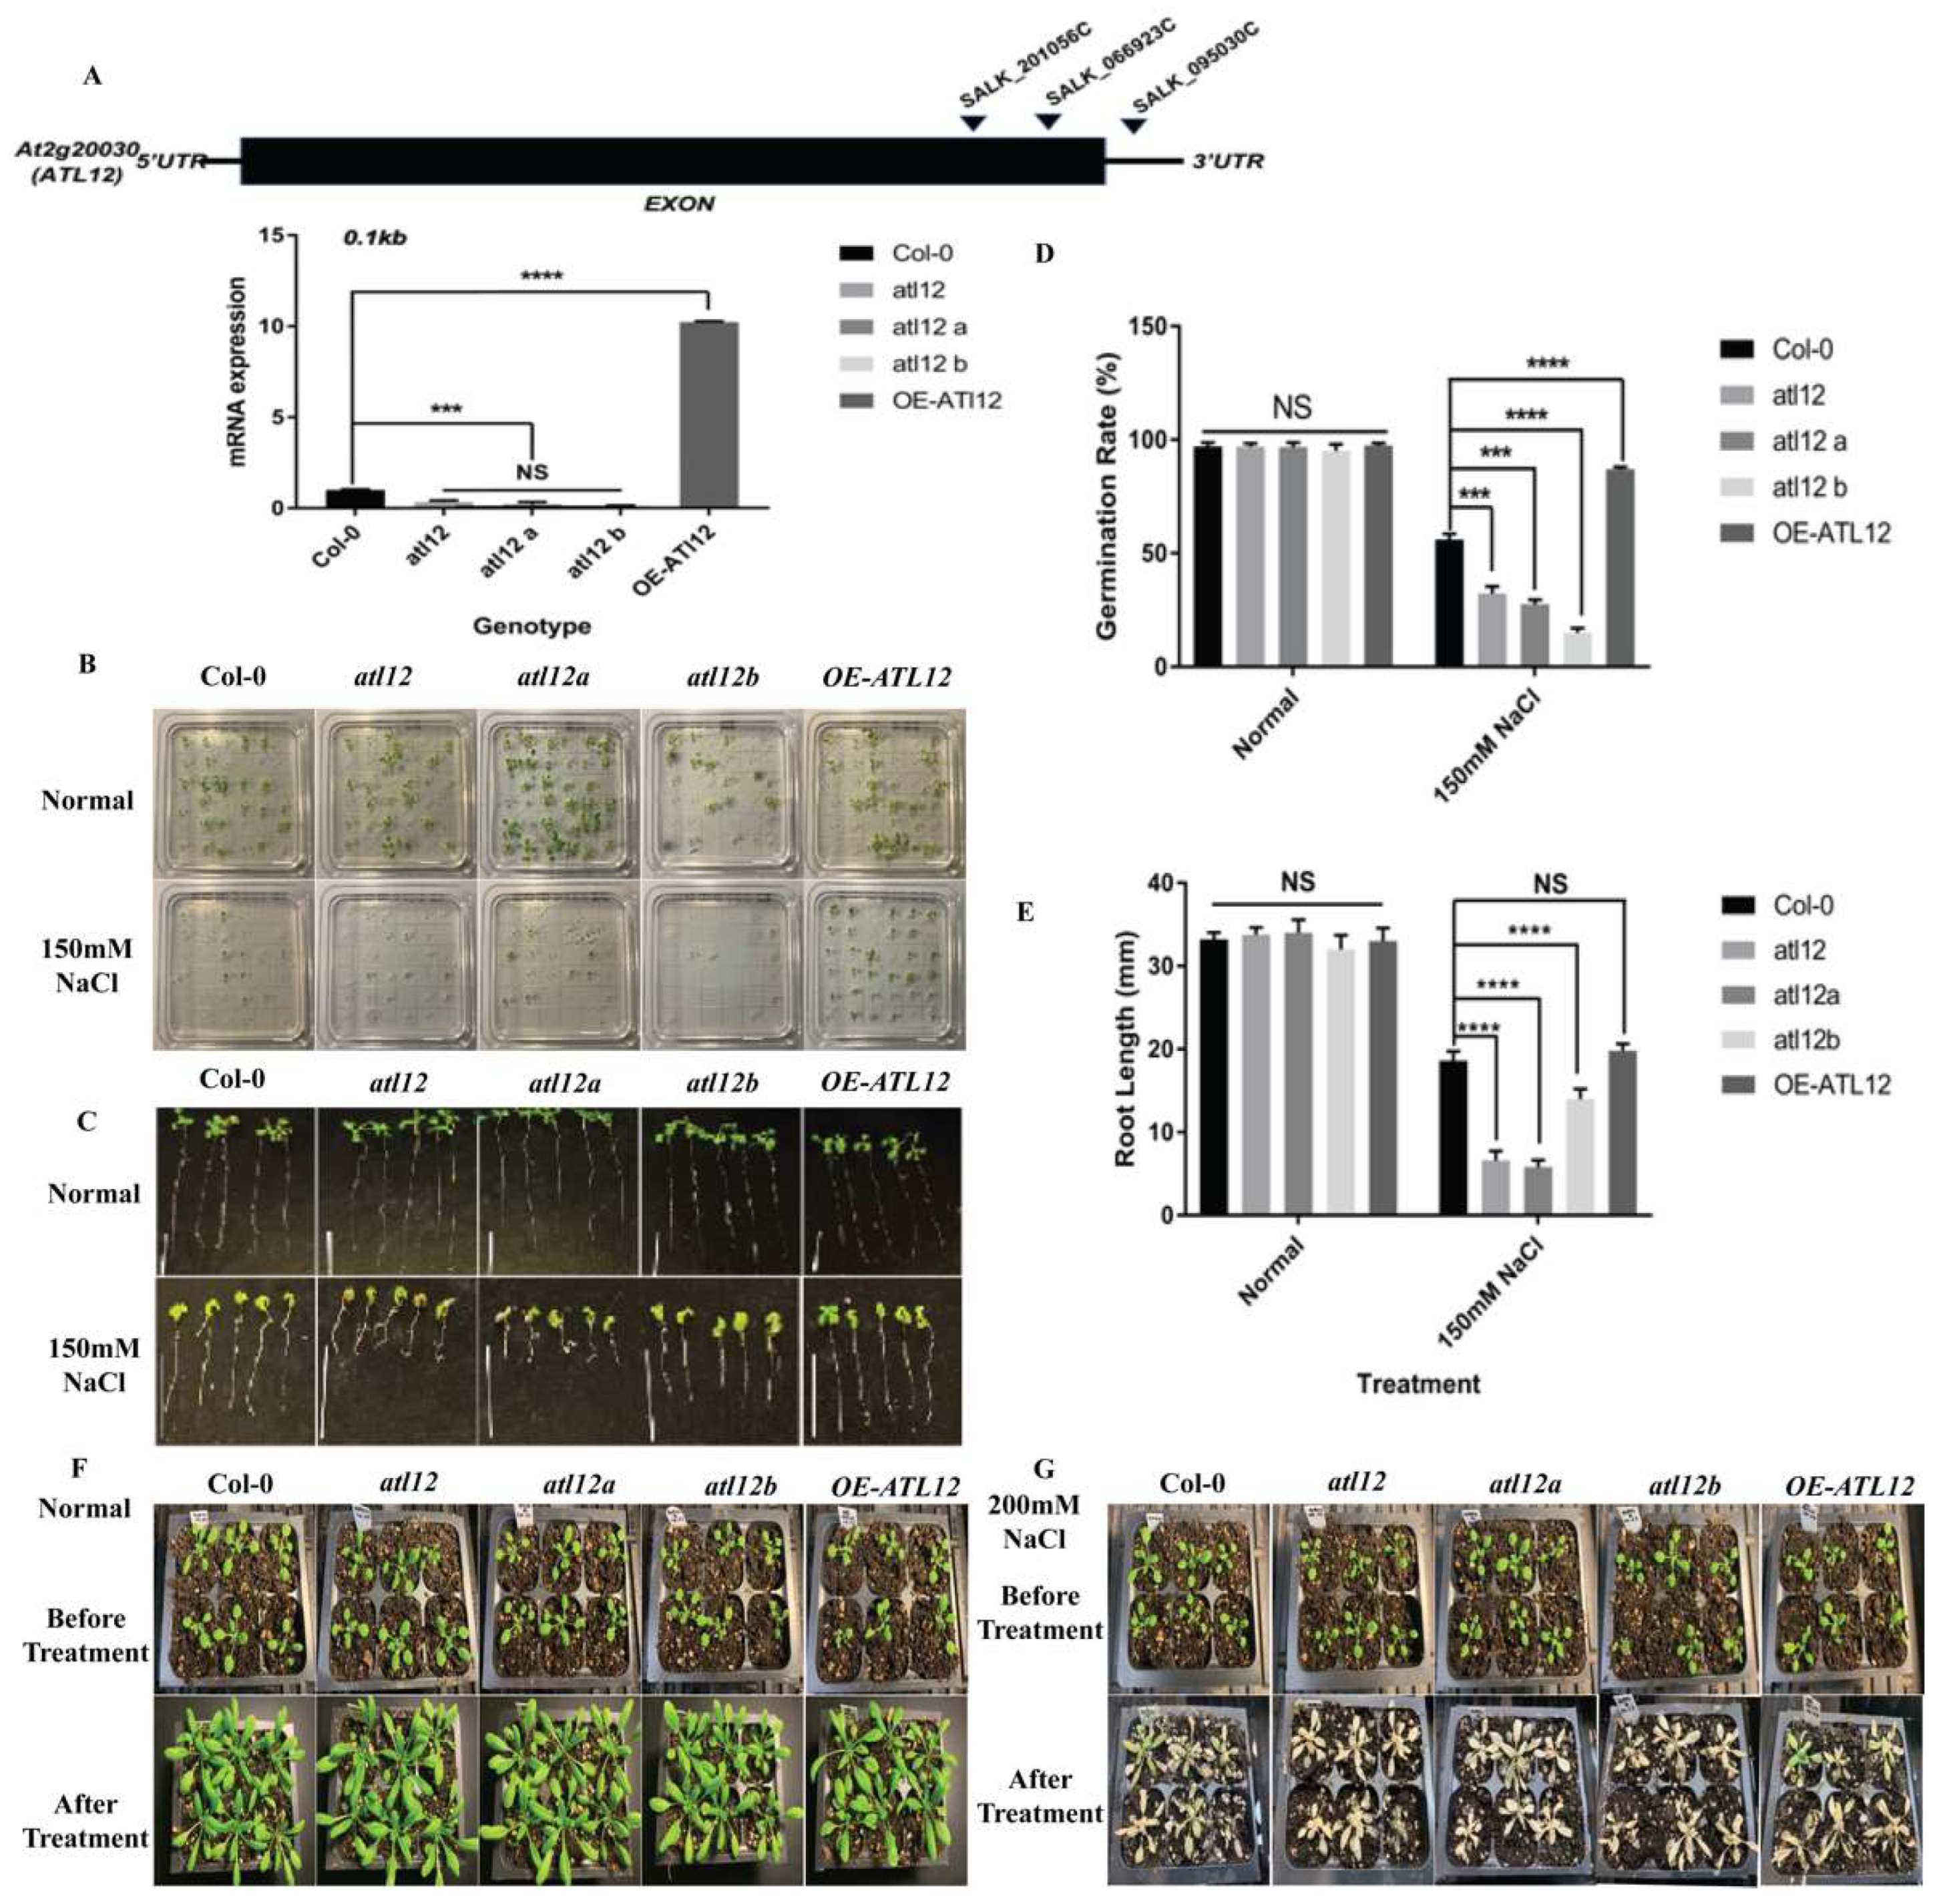
2.1. ATL12 Positively Regulates Salt Tolerance in Arabidopsis Seedlings

To characterize ATL12, we first analyzed the ATL12 gene structure and domain information. ATL12 belongs to the ATL2 gene family and encodes a 390 amino acid C3HC4 RING/Ubox protein with a signal peptide (red color) near the N-terminal region, a transmembrane domain (blue color), and a RING-finger domain (purple color) near the C-terminal region, as shown in Figure 1A. To determine if the ATL12 protein has homologs in other plant species, homology searches were performed. Selected ATL12 protein homologs were aligned and the result is shown in Supplementary Figure S1. Since ATL12 encodes a protein containing a conserved RING domain, which is essential for E3 ubiquitin ligase activity, we also determined if the RING domain was conserved among the other ATL12 homologs. As shown in Figure 1A, all ATL12 homologs shared a RING domain. Phylogenetic trees were also generated to determine the evolutionary relationship between the genes. As shown in Figure 1B, the closest homolog of ATL12 in Arabidopsis thaliana (NM_127561) is the putative RING-H2 finger protein ATL12 (LOC9320018) in Arabidopsis lyrata subsp. lyrata with accession number XM_002885958. Another Arabidopsis thaliana RING/U-box superfamily protein ATL42 (AT4G28890) is also a close homolog of ATL12 in Arabidopsis thaliana. Other close homologs of ATL12 are found in Brassica napus (XM 013860) and Brassica rapa (XM_009130924). In addition, several proteins in other plant species share similarities with ATL12, including in Melon (Cucumis melo), soybean (Glycine max), maize (Zea mays), and rice (Oryza sativa).
In Arabidopsis, there are over 61 U-box domain-containing proteins with predicted E3 ubiquitin ligase activity and over 450 predicted proteins that contain one or more RING domains [34]. E3 ubiquitin ligases are known to be involved in plant defense against both biotic and abiotic stress [35]. Since ATL12 encodes a protein containing a conserved RING domain, which is essential for E3 ubiquitin ligase activity, we confirmed ATL12’s E3 ubiquitin ligase activity using an in vitro ubiquitination assay, as shown in Figure 1C. To perform the in vitro ubiquitination assay, we expressed and purified Arabidopsis ATL12, UBC8 (E2), UBQ14 (Ub), and UBA2 (E1) in E. coli. As shown in Figure 1C, we noted that proteins were ubiquitinated only in the presence of E1 (UBA2), E2 (UBC8), and 6× His tagged ubiquitin, demonstrating that ATL12 has E3 ubiquitin ligase activity.
To analyze the phenotypes of atl12 mutants in response to salt stress, we determined if the sensitivity of the mutants to salt was altered when challenged with high salt. Homozygous T-DNA insertional mutants of atl12 and a transgenic line overexpressing ATL12 from a previous study were used in these experiments [33]. Quantitative RT-PCR was performed to confirm the expression of the ATL12 mRNA transcript in different seedlings, as shown in Figure 2A. The qRT-PCR results indicated that expression of ATL12 is significantly decreased in all three T-DNA insertional mutants of atl12 compared to Col-0 WT, while ATL12 was overexpressed in the overexpression (OE) line. We then assessed the salt tolerance of ATL12 during seed germination and in the early stages of plant development. Seeds of Col-0 WT, the three atl12 mutants, and the ATL12 OE line were planted on agar plates containing 150 mM NaCl and the germination rates were observed after seven days (Figure 2B). Under normal conditions, germination rates are not significantly different among Col-0 wild type, atl12 mutants, and the ATL12 overexpression lines. When the plants were treated with 150 mM NaCl, the germination rate of the atl12 mutants was significantly decreased compared to the Col-0 wild type and the germination rate in the OE ATL12 line increased (Figure 2D). To study the function of ATL12 in response to salt stress in more detail, we also determined if there were changes in the primary root growth of Col-0 wild type, atl12 mutants, and OE ATL12 under salt stress conditions (Figure 2C). Under 150 mM NaCl conditions, atl12 mutants were hypersensitive to salt treatment and had decreased root length growth compared to Col-0 WT. Interestingly, there was no significant change in root length growth observed in the OE ATL12 line compared to WT (Figure 2E). To further investigate the role of ATL12 in salt stress, we also determined if mutations in ATL12 altered the plant phenotype in post-germination stages in response to high salt treatment. Four-week-old seedlings of Col-0, atl12 mutants, and the OE ATL12 line were treated with 200 mM NaCl and leaf appearance was observed after seven days (Figure 2F,G). The results showed that the atl12 mutants are more sensitive to salt stress compared to Col-0 WT and exhibited more cell death on the leaves. Taken together these results indicate that ATL12 plays a positive role in salt tolerance.

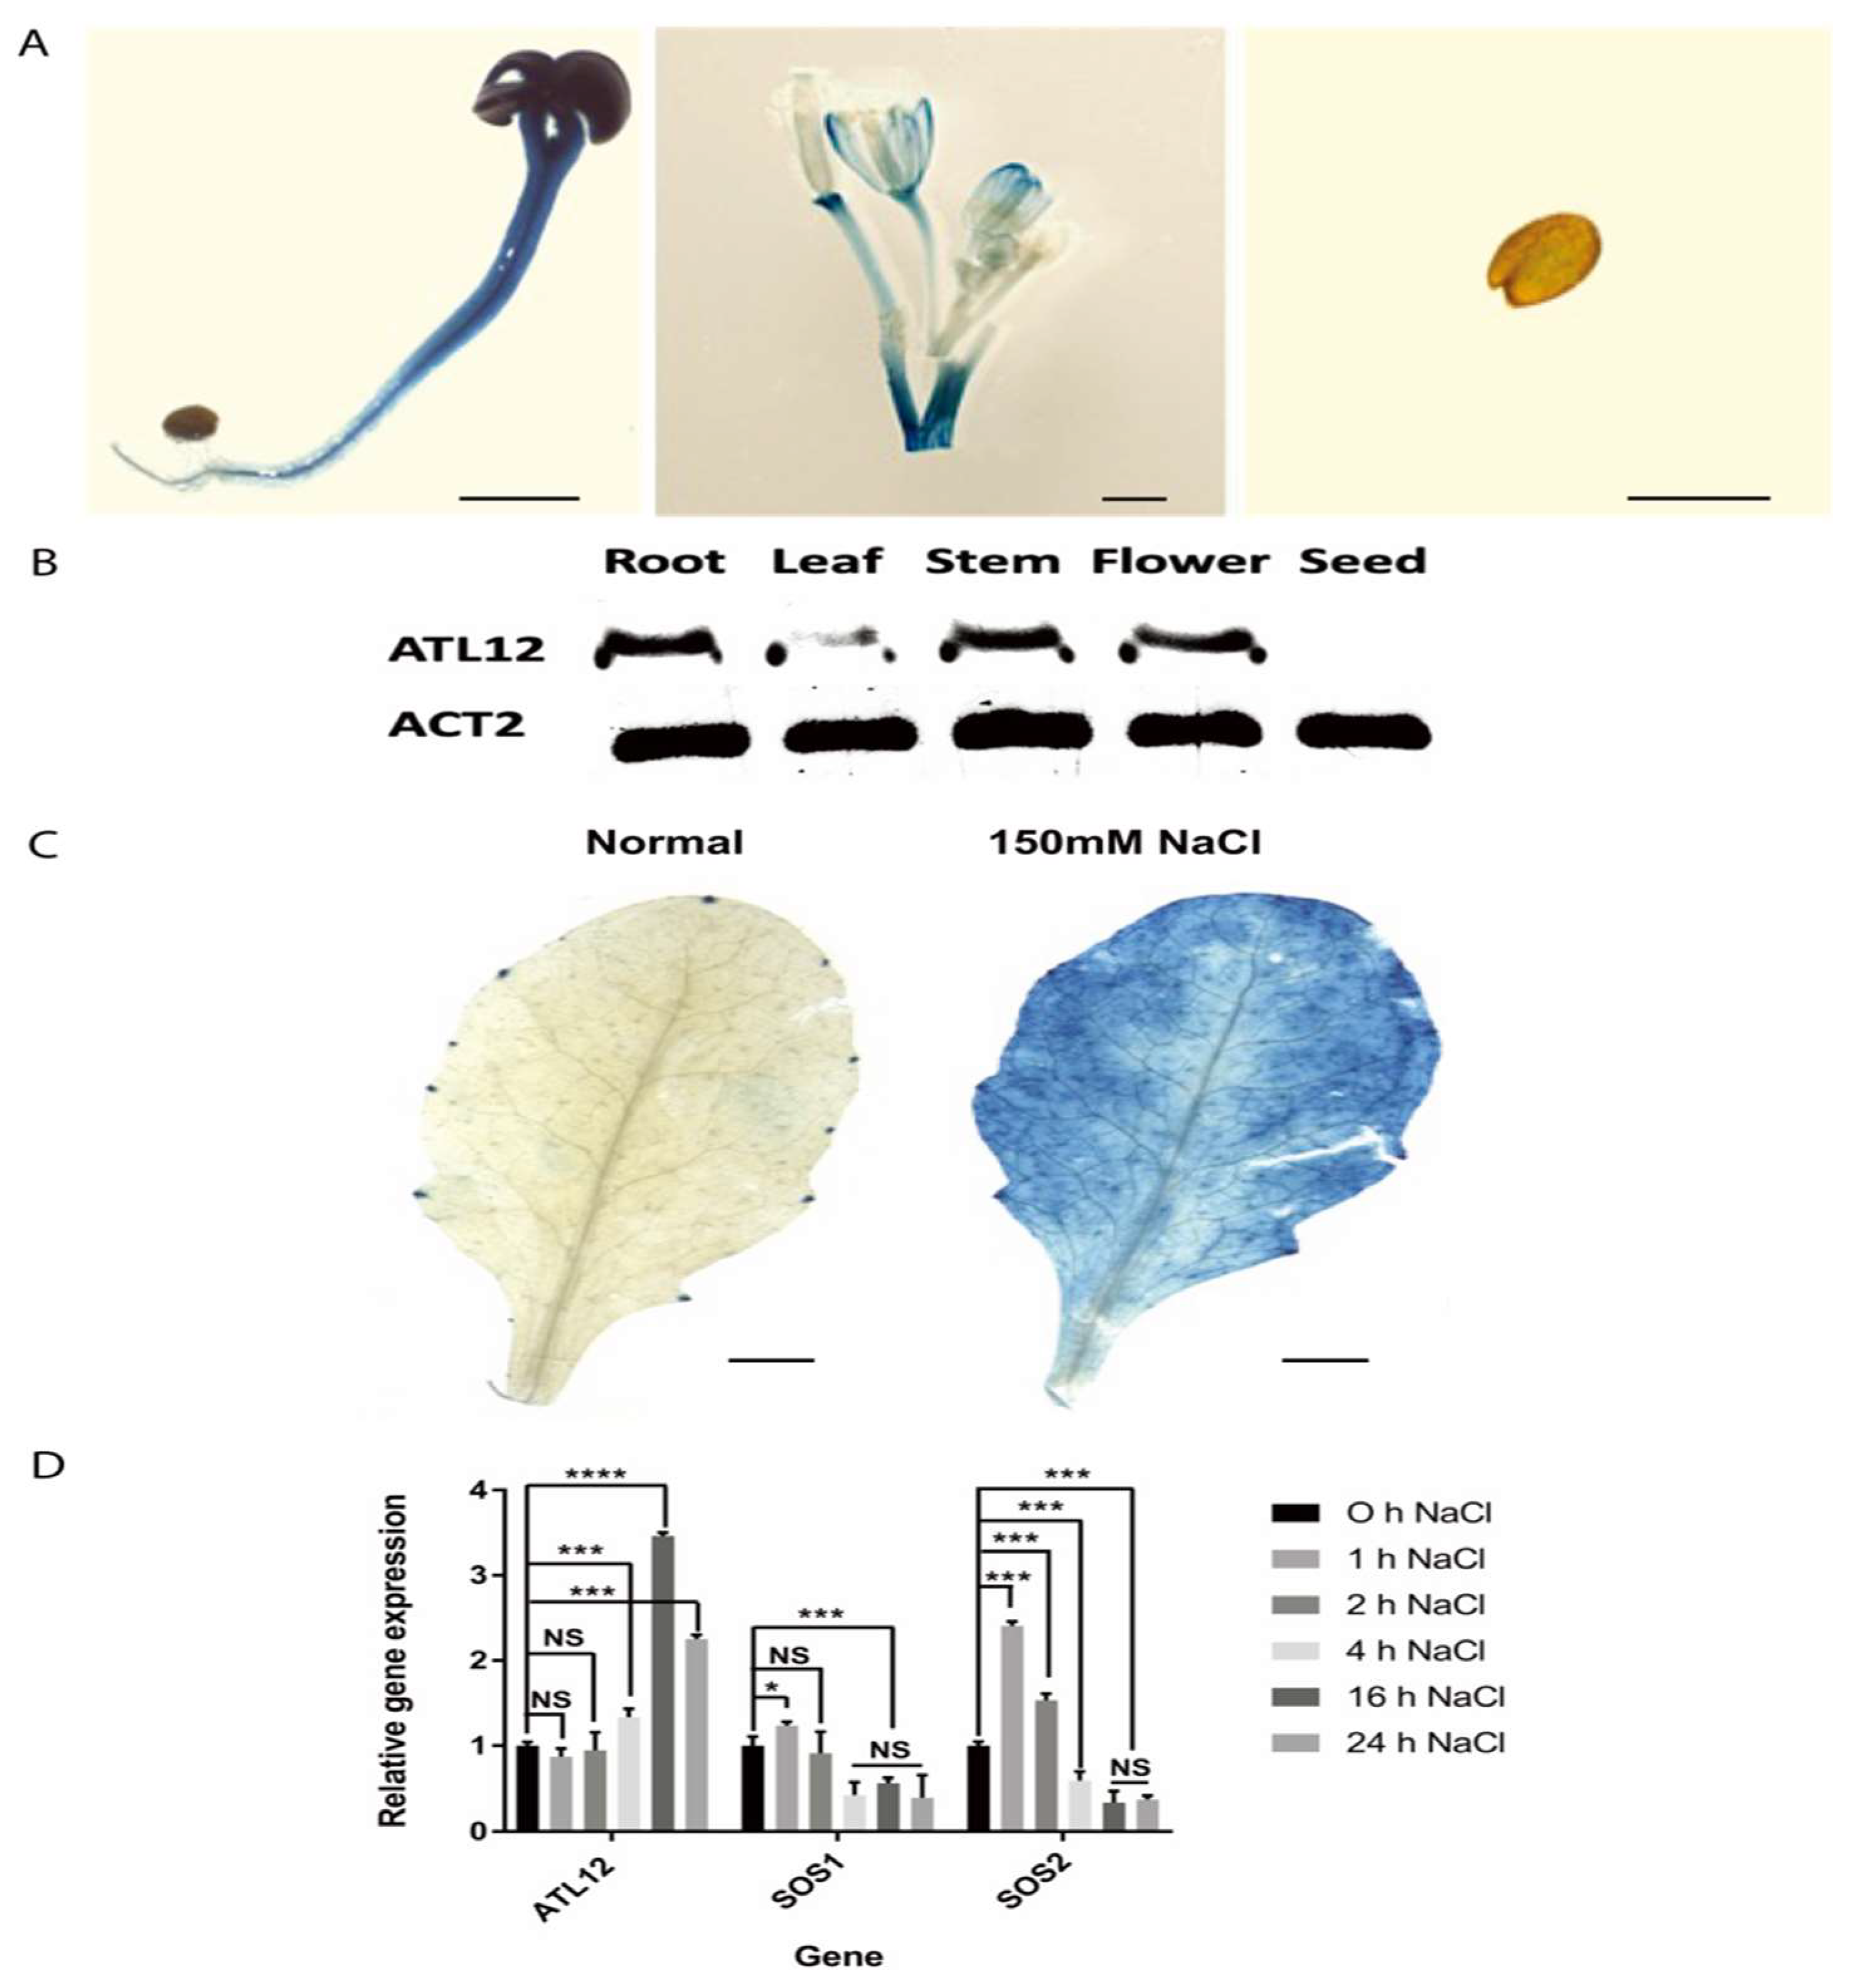
2.2. Expression Pattern of ATL12 under High Salt Conditions

To analyze the expression pattern of ATL12 at the tissue level, we fused the promoter of ATL12 with the GUS reporter gene and generated transgenic plants. As shown in Figure 3A, ATL12 is expressed in the root, stem, and leaves of two-week-old seedlings, and in mature flowers. To confirm the tissue-specific expression, the expression levels of ATL12 were tested using RT-PCR in the root, leaf, and stem of two-week-old seedlings, in mature flowers, and in dried seeds of Col-0 wild-type plants. As shown in Figure 3B, the ATL12 transcript was detected in the root, stem, and flower, but its expression was relatively low in the leaf tissue.
To determine if the expression of ATL12 is induced by salt treatment, we used histochemical staining of ATL12 promoter GUS fusion transgenic plants treated with 150 mM NaCl. The results showed that ATL12 is rarely expressed under normal conditions, while pATL12:GUS expression was strongly induced after being treated with 150 mM NaCl for 16 h, as shown in Figure 3C. Additionally, we performed qRT-PCR to examine the expression of ATL12 in Arabidopsis treated with 150 mM NaCl at early (1 h, 2 h, and 4 h) and late stages (16 h and 24 h) post-salt treatment. The salt stress-responsive genes salt-overly sensitively 1 and 2 (SOS1 and SOS2) and the reference gene beta-actin were also determined using qRT-PCR. As shown in Figure 3D, the expression of ATL12 is increased after 4 h and is significantly increased at 16 h. Compared to ATL12, SOS1 and SOS2 are significantly increased during the early stages of salt stress, as shown in Figure 3D. Our results show that ATL12 expression is salt-inducible and its expression is upregulated at later stages in response to NaCl.

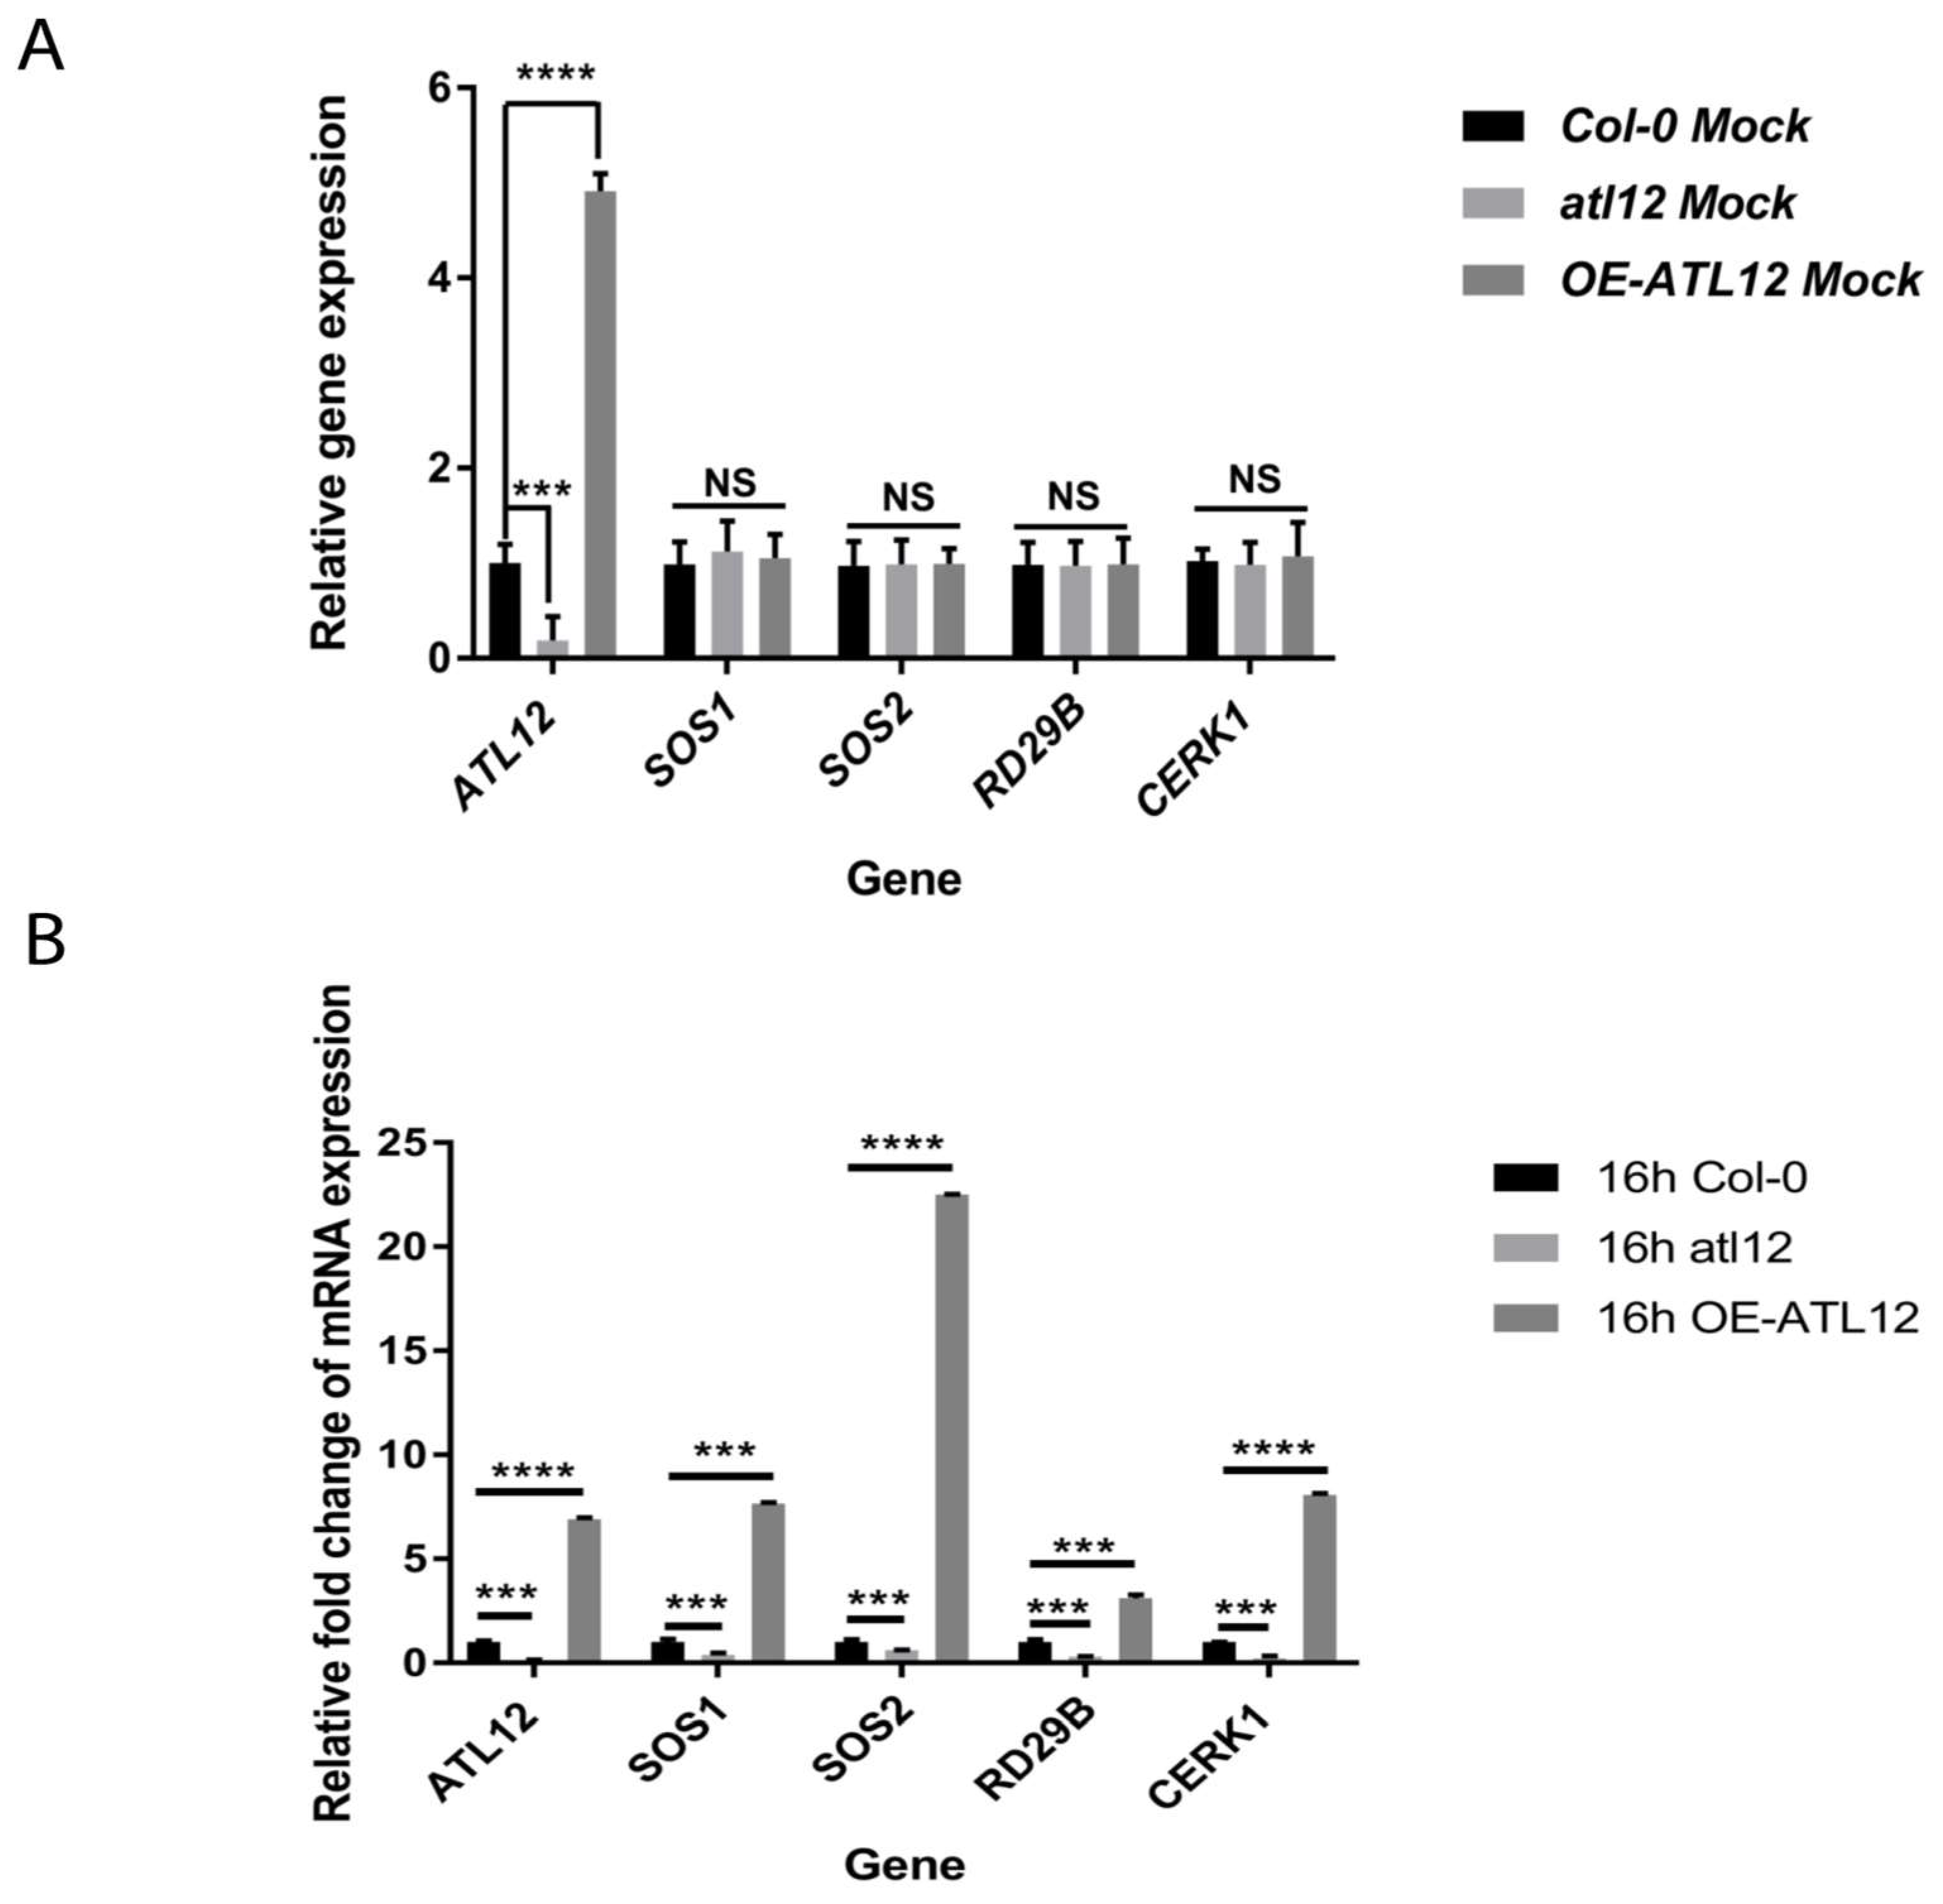
2.3. Overexpression of ATL12 Increases the Expression of Salt Stress-Associated Genes

We noticed that ATL12 expression is upregulated at later stages during salt stress (Figure 3D) and that over-expression of ATL12 increases seed germination rate (Figure 2). To better understand the function of ATL12 in response to salt stress, we determined if over-expression of ATL12 alters the expression of other well-characterized salt stress-associated genes. Two-week-old Col-0 wild-type plants, atl12, and OE lines of ATL12 were treated with 150 mM NaCl for 16 h. Distilled water treatment was used as a mock control. Gene expression of ATL12, salt-responsive genes SOS1 (SALT-OVERLY-SENSITIVE 1) and SOS2 (SALT-OVERLY-SENSITIVE 2), ABA-responsive gene RD29B, and chitin-responsive gene CERK1 were then determined. As shown in Figure 4A, under normal conditions, there are no significant changes in the gene expression of SOS1, SOS2, CERK1, and RD29B. The transcript level of ATL12 is downregulated in the atl12 mutant and is upregulated in the OE ATL12 line in the water controls. Under high salt conditions, gene expression of SOS1 and SOS2 was significantly increased in the OE line of ATL12 compared to wild-type plants, while SOS1 and SOS2 expression levels were decreased in the atl12 mutant, as shown in Figure 4B. Together these results suggest that ATL12 may be involved in plant salt responses via regulation of SOS signaling in order to mediate Na+ ion extrusion in response to salt stress. In addition, we noticed that the ABA-responsive gene RD29B, and the chitin-responsive gene CERK1 showed increased expression in the ATL12 overexpression line, whereas CERK1 expression was downregulated in the atl12 mutant, suggesting that ATL12 modulates salt stress through multiple signaling events and ATL12 may play a broader role in abiotic stress responses.

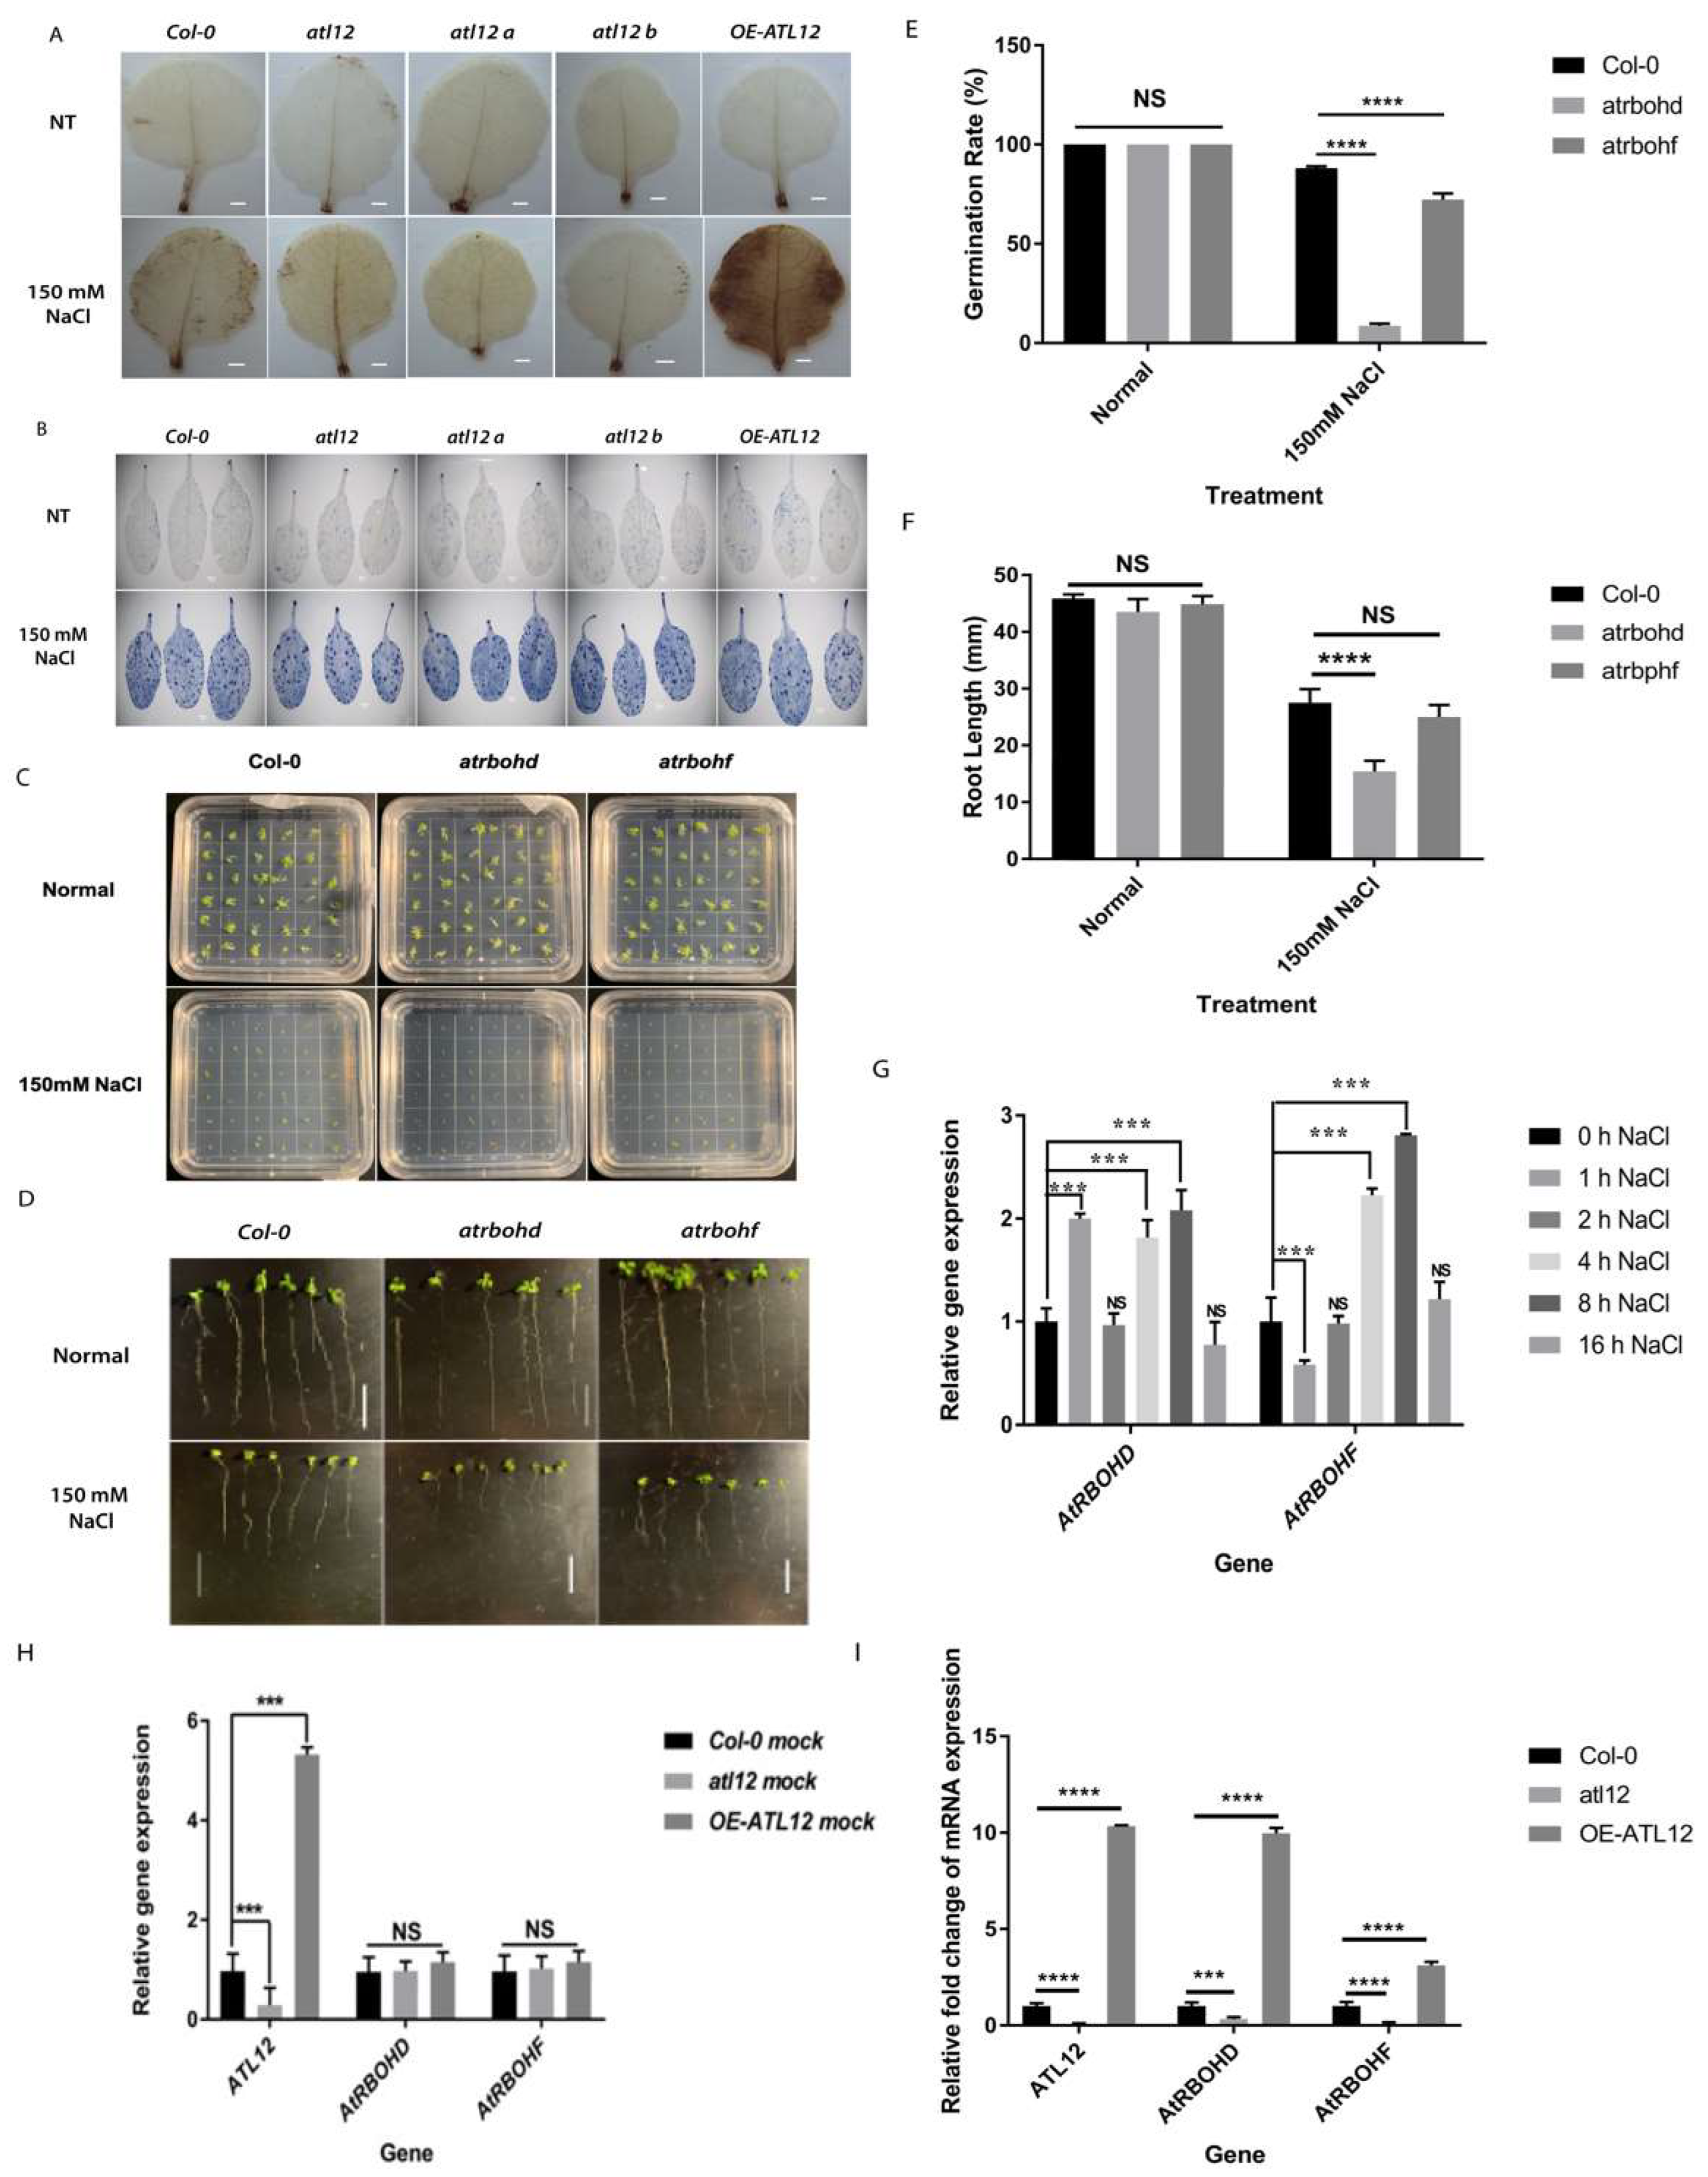
2.4. Detection of Reactive Oxygen Species Production in Over-Expression of ATL12 in Response to NaCl Stress

In plants, NADPH oxidase-mediated reactive oxygen species (ROS) generation has been found to play an important role in salt stress responses [36,37]. Our previous work showed that ATL12 is involved in AtRBOHD/F-mediated ROS production in response to the fungal pathogen Golovinomyces cichoracearum (33). To determine if ATL12 and ROS generation were also involved in the response to salt stress, we performed DAB (3,3′-diaminobenzidine) staining to detect H2O2 production. Four-week-old Col-0 wild-type, atl12 mutants, and OE-ATL12 leaves were treated with 150 mM NaCl for 16 h, and no treatment (NT) was used as a control. The leaves were then stained with DAB (3,3′-diaminobenzidine) staining solution. As Figure 5A shows, compared to wild-type Col-0, the leaves of OE ATL12 showed more ROS generation in response to salt stress, while atl12 mutants exhibited less ROS generation. This suggests that ATL12 may be associated with ROS generation in response to salt stress.
It has been shown that the accumulation of ROS in response to salt stress can have toxic effects in plants, leading to programmed cell death [12]. In our experiment (Figure 5), we noted that ROS accumulated in the OE-ATL12 line in response to salt stress (Figure 5A). In order to determine if ATL12-mediated ROS production is inducing cell death in response to high salt conditions, we used trypan blue staining to observe areas of cell death in the leaves of plants under 150 mM salt conditions. Detached leaves from four-week-old Col-0 wild-type, atl12 T-DNA insertional mutants, and the OE ATL12 line were treated with NaCl for 16 h and distilled water treatment was used as the control. As shown in Figure 5B, there is no significant difference between Col-0 wild-type, the atl12 mutants, and the OE ATL12 line in the levels of cell death observed in the leaves under normal conditions. In the salt treatment, there is increased cell death in the leaves of all the plants tested compared to normal conditions. However, no significant differences were observed between the salt-treated Col-0 wild-type, the atl12 mutants, and OE-ATL12, suggesting that ATL12-mediated ROS production may not lead to cell death under salt stress. Other than its toxic effects, ROS are also known to function as signaling molecules in response to salt stress [12,37]. In Arabidopsis, the multiple respiratory burst oxidase homolog (RBOH) proteins have been suggested to be involved in the regulation of salt stress responses [38]. The expression of two respiratory burst oxidase homologs, AtRBOHD and AtRBOHF are known to be highly induced under salinity stress and are responsible for ROS-mediated ion homeostasis [36,37]. To confirm if AtRBOHD and AtRBOHF were involved in the salt stress response and if their expression was induced by salt stress, a germination rate assay and a root length assay were performed using Col-0 WT and atrbohd and atrbohf mutants in response to 150 mM NaCl, as shown in Figure 5C–F. Mutants of atrbohd and atrbohf showed lower germination rates compared to the Col-0 wild-type. Only mutants of atrbohd showed a decrease in root length growth compared to wild-type plants, suggesting that AtRBOHD and AtRBOHF are involved in the salt stress response. In addition, we used qRT-PCR to determine the AtRBOHD and AtRBOHF expression patterns in response to salt stress. Two-week-old Col-0 wild-type plants were treated with 150 mM NaCl for 1 h, 2 h, 4 h, 16 h, and 24 h, and expression levels of ATL12, AtRBOHD, and AtRBOHF were evaluated. As shown in Figure 5G, AtRBOHD expression is highly induced at 1 h, 4 h, and 16 h, while AtRBOHF expression is induced at 4 h and 16 h. These results confirmed that AtRBOHD/F are involved in the Arabidopsis response to salt stress.
To further analyze if mutations in ATL12 and its overexpression alter AtRBOHD/F expression, two-week-old Col-0 wild-type, atl12 mutants, and the OE ATL12 line were treated with 150 mM NaCl for 16 h, and gene expression was evaluated using qRT-PCR. The results are shown in Figure 5H,I. Under normal conditions (water control), there is no significant change in the AtRBOHD/F expression. Under salt stress, we noted that AtRBOHD/F expression was upregulated in the OE ATL12 line, while their expression was downregulated in the atl12 mutant. Taken together, these data suggest that ATL12 may play a central role in AtRBOHD/F-mediated ROS generation in response to salt stress.

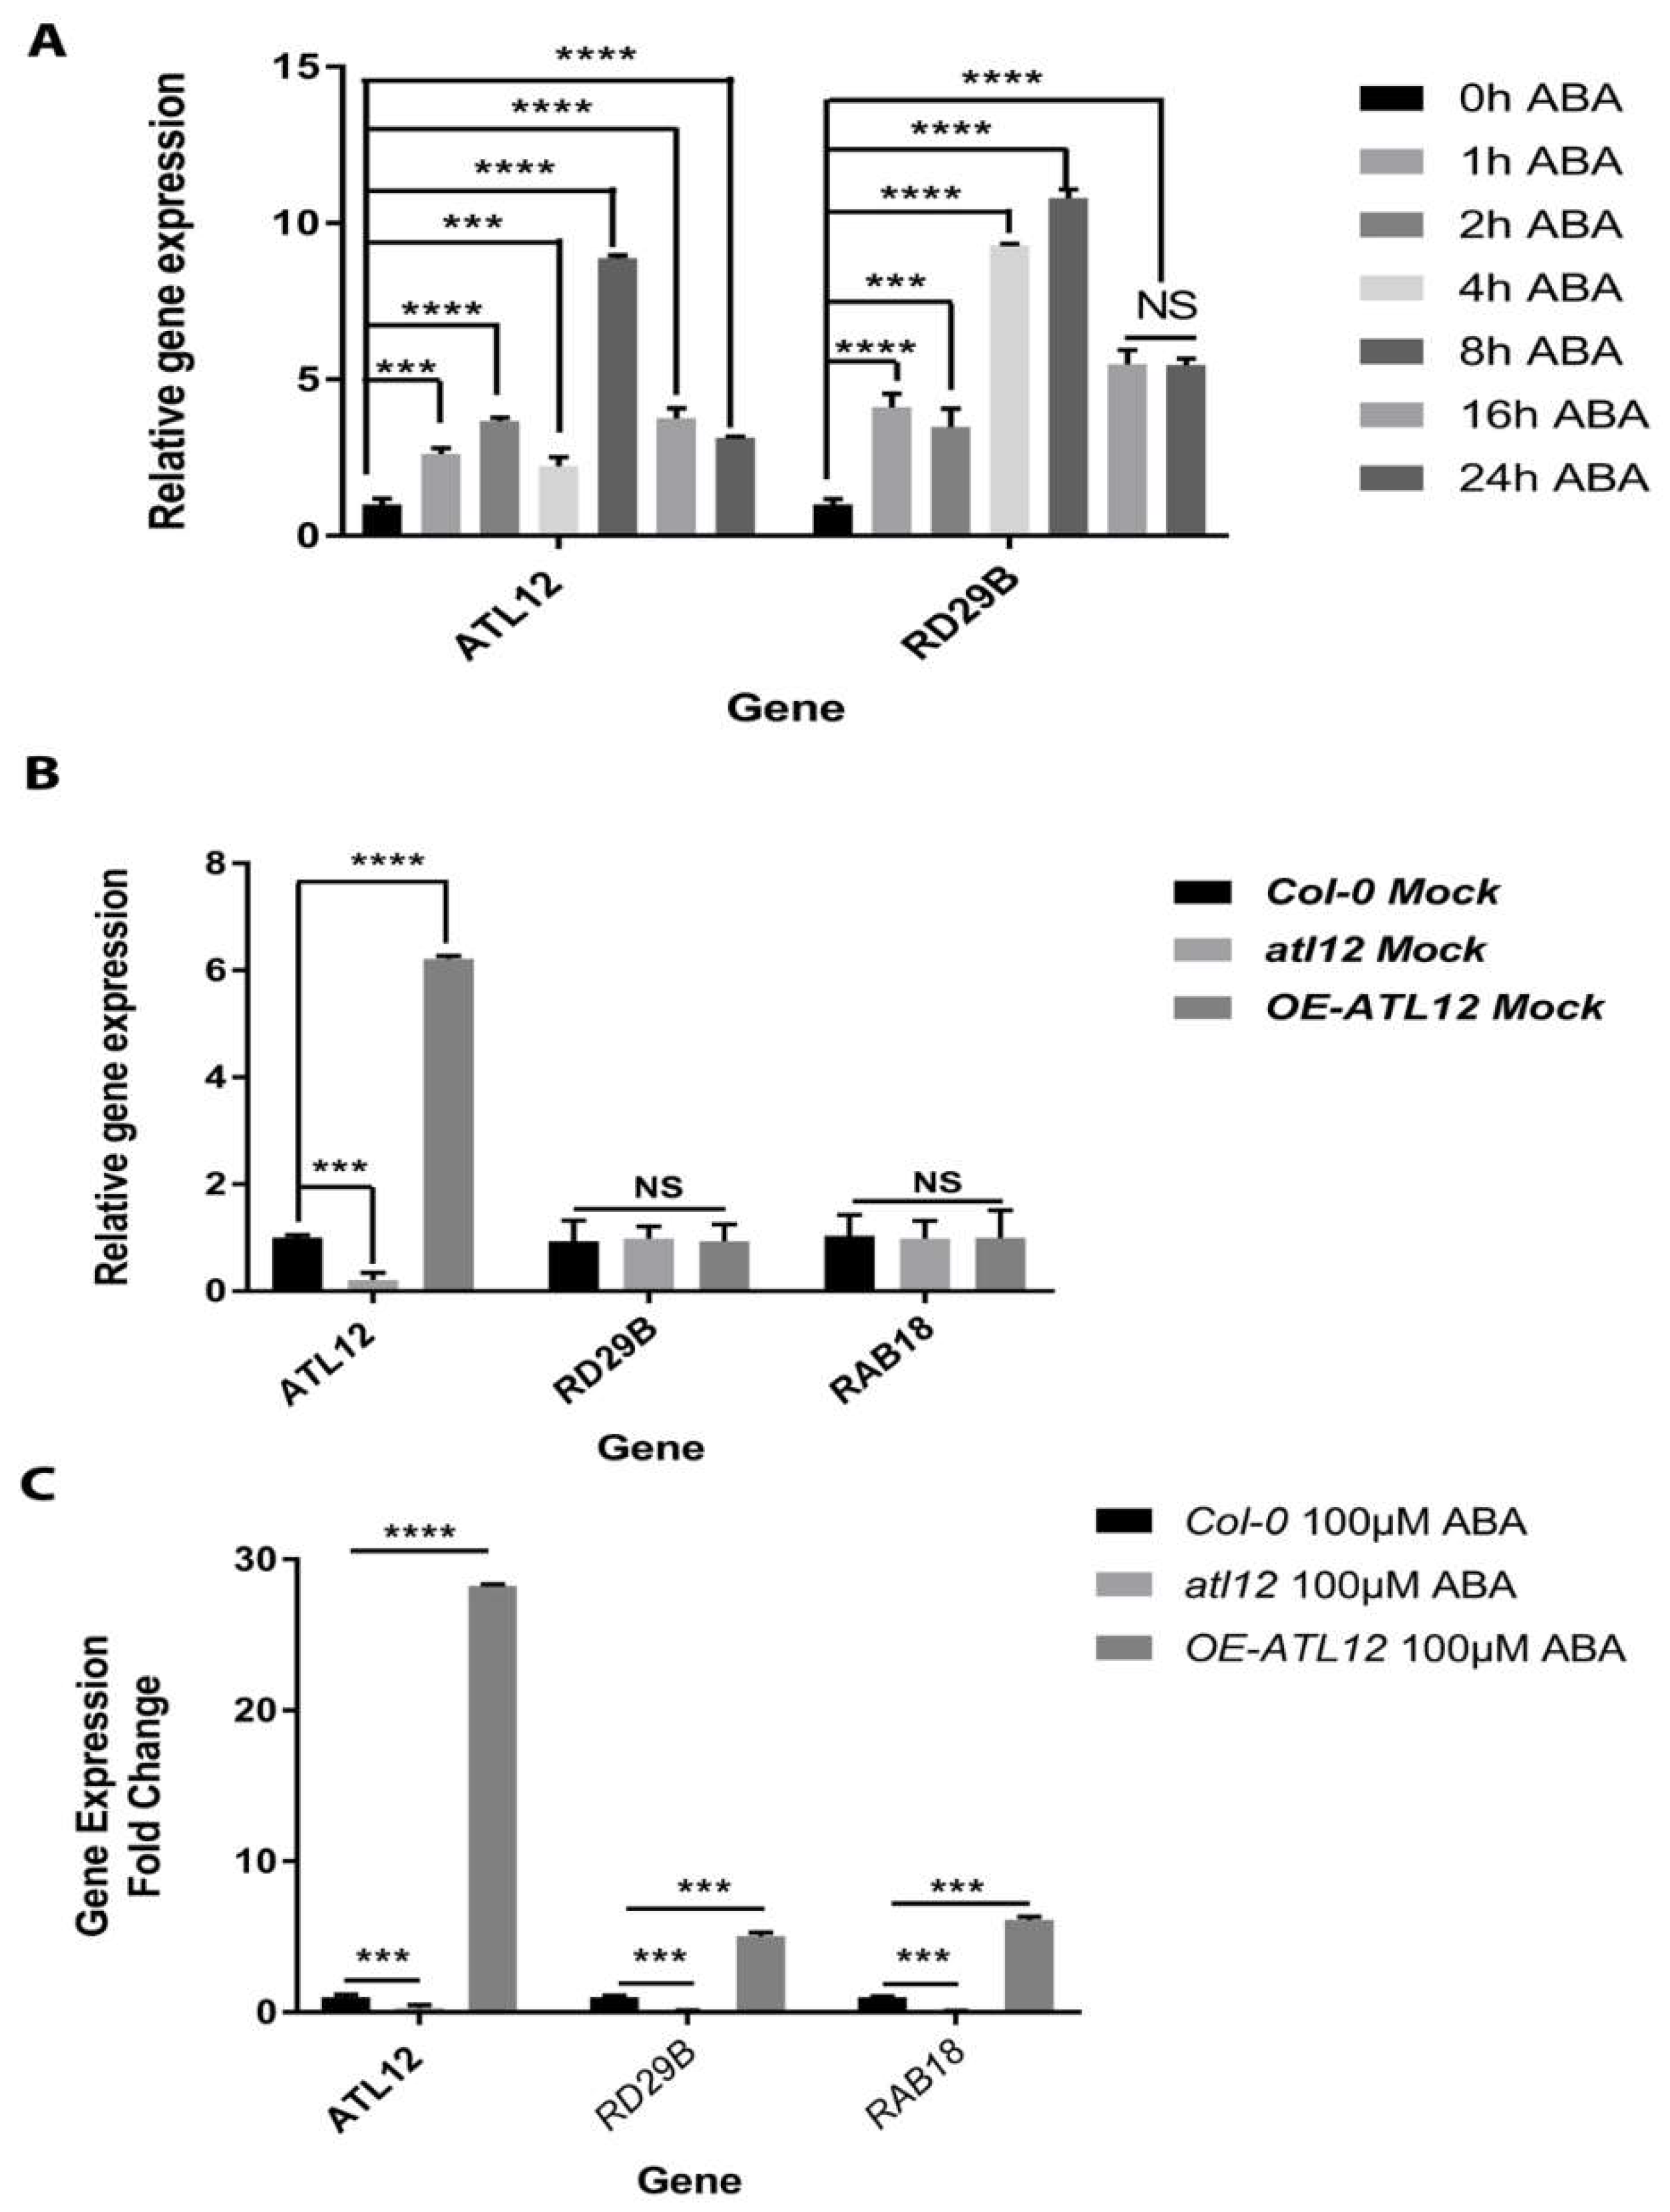
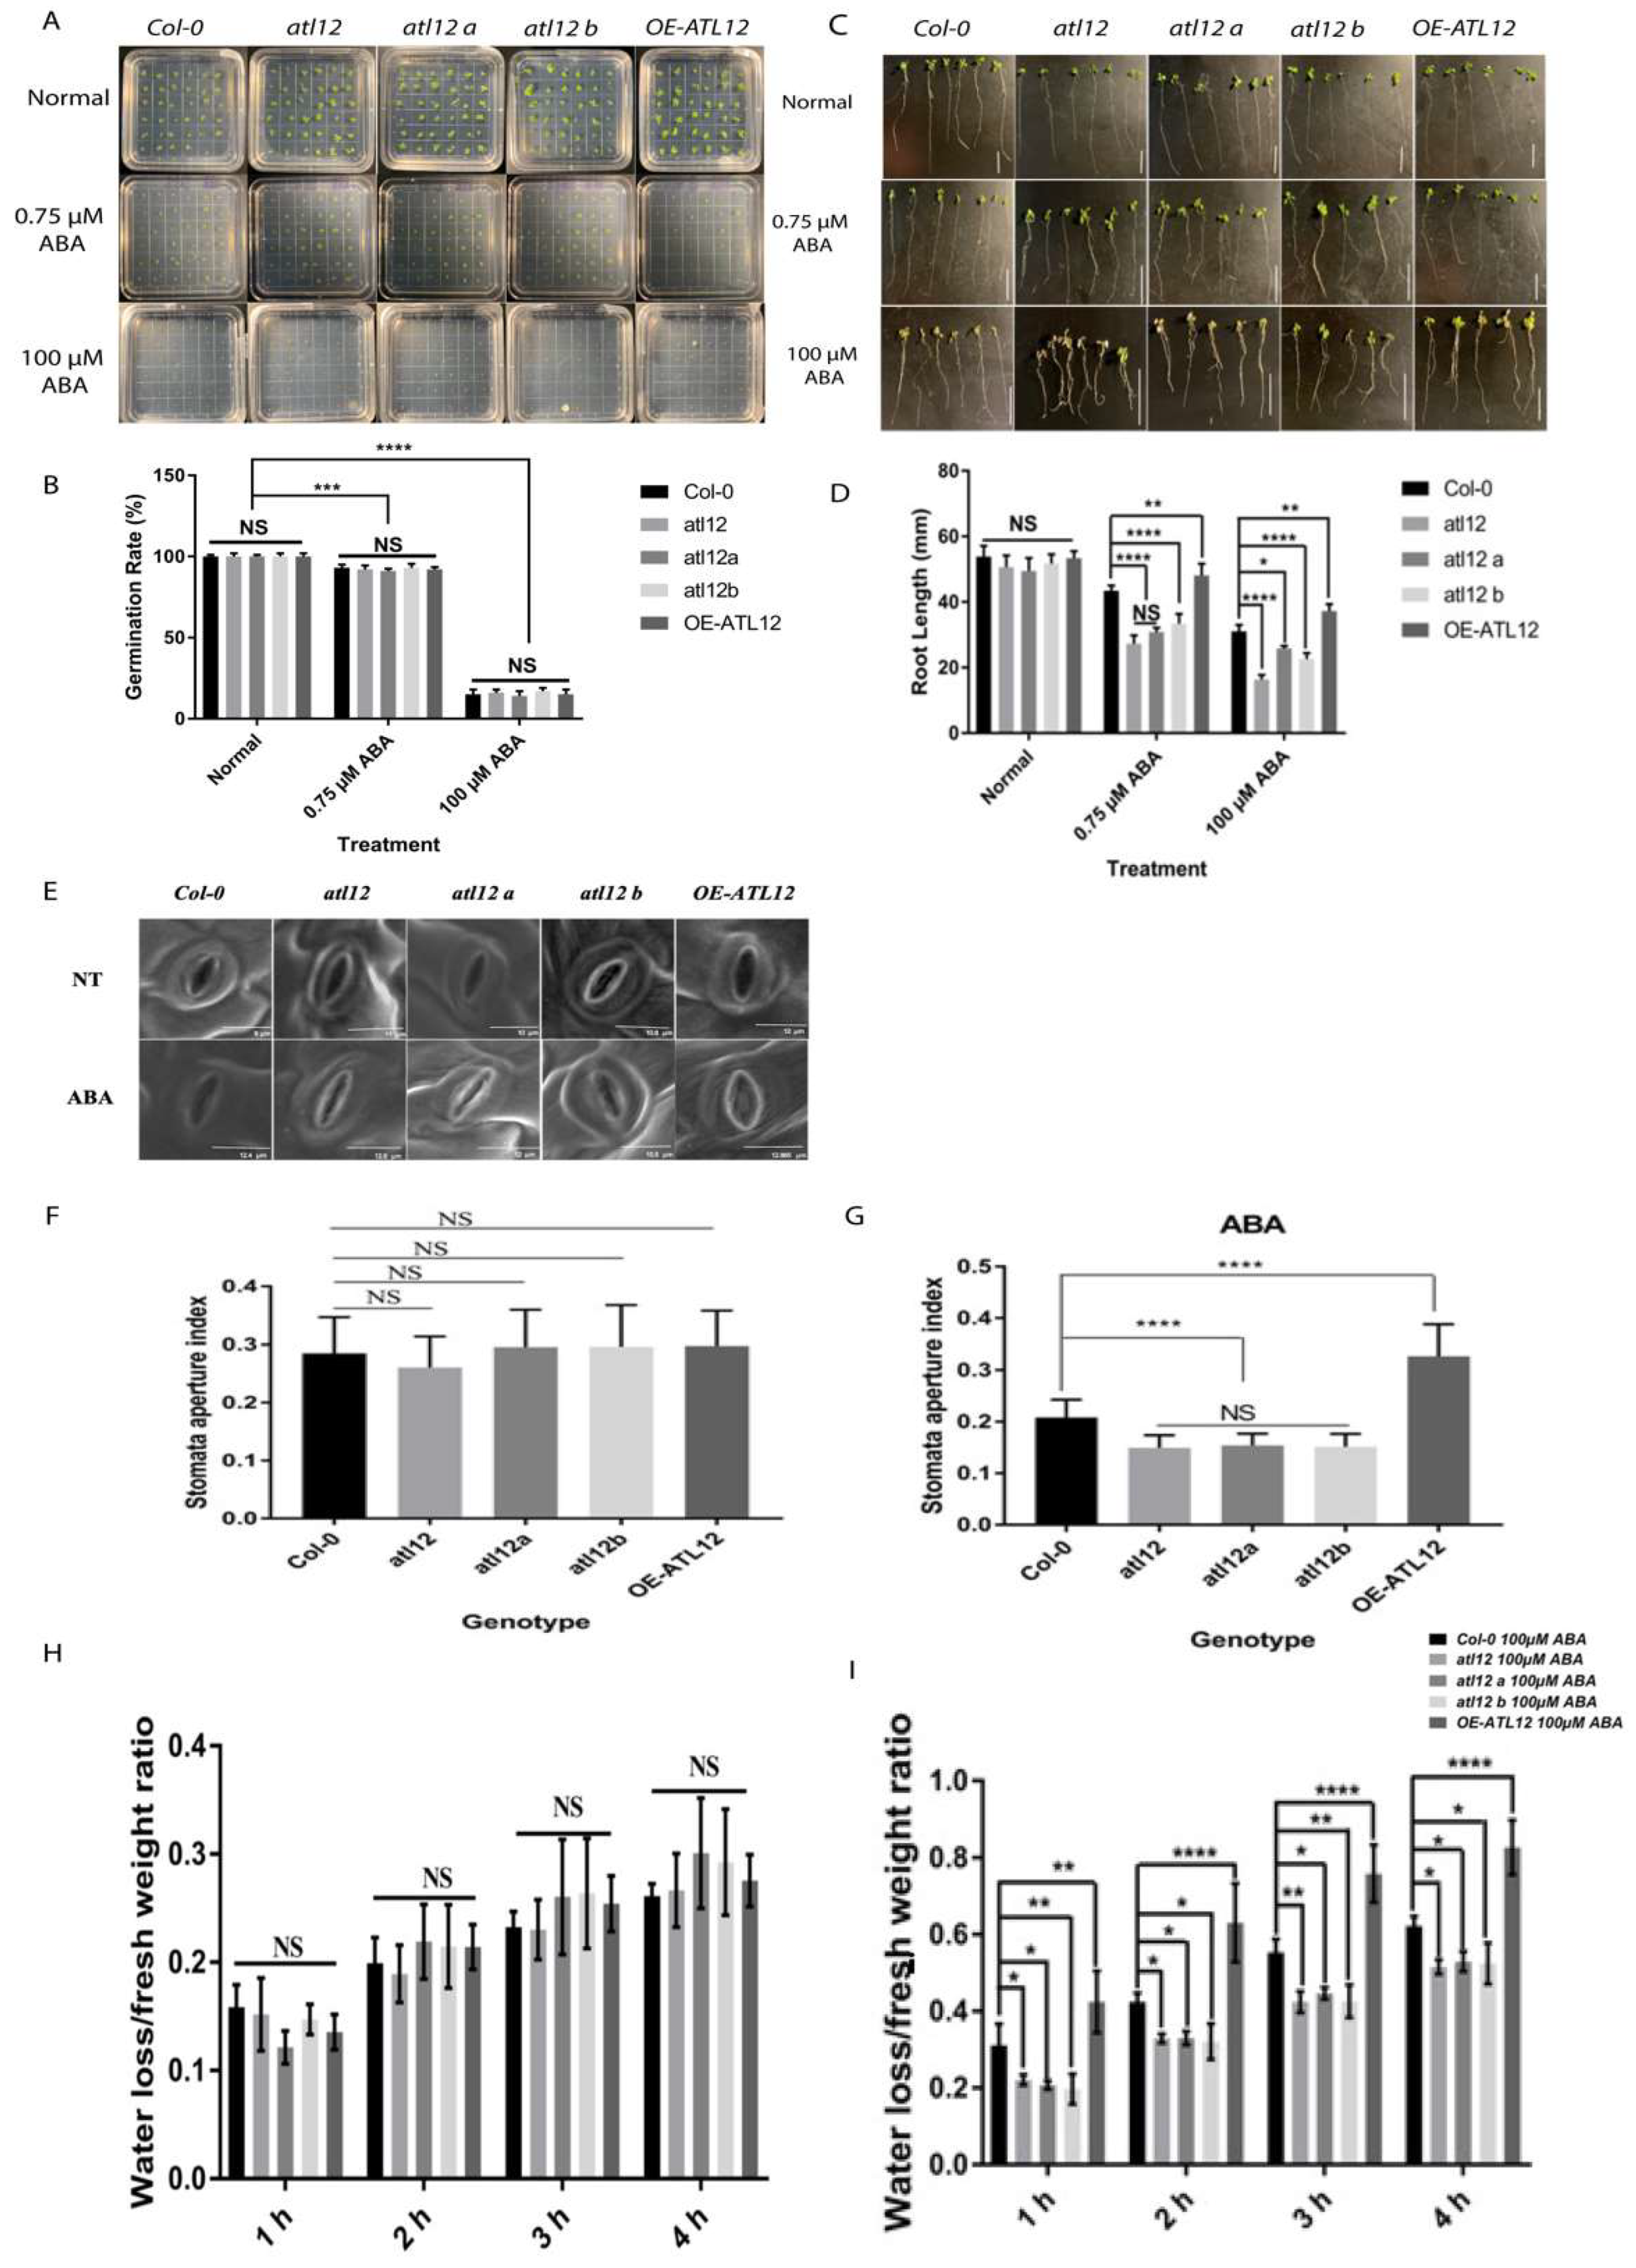
2.5. ATL12 Expression Is ABA Inducible and Negatively Regulate ABA-Dependent Response

Abscisic acid signaling is known for regulating multiple physiological processes and is involved in abiotic stress tolerance [39]. Our results show that the ABA-responsive RD29B gene’s expression is induced in the OE-ATL12 line in response to salt stress (Figure 4B), which suggests that ATL12 might be involved in salt stress responses via ABA signaling. To investigate whether ATL12 expression is induced by ABA, ATL12’s expression pattern in response to ABA treatment was examined via qRT-PCR. Two-week-old Col-0 wild-type plants were treated with 0.75 μM ABA and tissues were harvested at different time points (Early-stage: 0 h, 1 h, 2 h, 4 h, and 8 h; Late-stage: 16 h and 24 h). Expression of the ABA-responsive gene RD29B was also examined as a marker gene and the ACT2 gene was used as an internal control. As shown in Figure 6A, ATL12 expression is continuously induced at all the time points and the expression of RD29B is highly induced at all time points. To further dissect the potential interaction between ATL12 and ABA, Col-0 wild-type, atl12 mutants, and OE ATL12 plants were treated with 100 mM ABA for 2 h, and then gene expression of ATL12, ABA-inducible genes RD29B and RAB18, and ACT2 was evaluated by qRT-PCR. There were no significant changes in RD29B and RAB18 expression under normal conditions (water treatment) as shown in Figure 6B. It was noted that RD29B and RAB18 expression were upregulated in OE-ATL12 plants, while their expression was downregulated in the atl12 mutant, as shown in Figure 6C. These data suggest that ATL12 gene expression is highly induced by ABA and that ATL12 is involved in some way with the ABA signaling pathway.
To investigate if atl12 and over-expression of ATL12 alter the sensitivity of plants to ABA, the germination rate and root length of Col-0 WT, atl12, and OE-ATL12 were tested under normal (water), and ABA treated conditions. As shown in Figure 7A,B, there were no significant differences in the germination rate between the Col-0, atl12, and OE-ATL12 seedlings under both the normal conditions and ABA treatment. In the root length assay, no significant difference was also observed between Col-0, atl12, and OE-ATL12 line under normal conditions as shown in Figure 7C,D. However, the atl12 mutants showed significantly inhibited root length growth compared to Col-0 WT (Figure 7D) and OE-ATL12 showed significantly increased root length with ABA treatment. These results suggest that ATL12 negatively influences ABA inhibition of root length growth.
Since ABA is known for regulating water loss and stomatal aperture [40,41], and to further characterize the role of ATL12 in ABA responses, we investigated if atl12 plants had altered stomatal aperture in response to ABA. Fresh leaves from four-week-old plants were immersed in a stomatal opening solution and then treated with ABA or distilled water (control). Images of leaf stomata were then obtained via scanning electron microscopy and the stomatal aperture index was analyzed (Figure 7E). As shown in Figure 7F,G, under normal conditions, there was no significant difference in the stomatal aperture. However, after ABA treatment, mutants in atl12 have a reduced stomatal aperture, while leaves from OE-ATL12 plants have a significantly larger stomatal aperture when compared to Col-0 WT. Taken together, these results suggest that ATL12 expression is ABA inducible and negatively regulates ABA-dependent responses. We also evaluated if mutations in ATL12 alter the plant’s ability to prevent water loss in response to ABA. Detached leaves from four-week-old plants were incubated in 100 μM ABA for 2 h and then the leaf fresh weight was measured every hour for four hours. As shown in Figure 7H,I, under normal conditions, there was no significant difference in water loss rates between the atl12 mutant, Col-0 WT, and the OE line. However, the OE-ATL12 line lost more water compared to Col-0 WT in response to ABA treatment. Mutants in atl12 have decreased water loss compared to Col-0 WT suggesting that ATL12 negatively influences ABA-mediated water loss.

3. Discussion

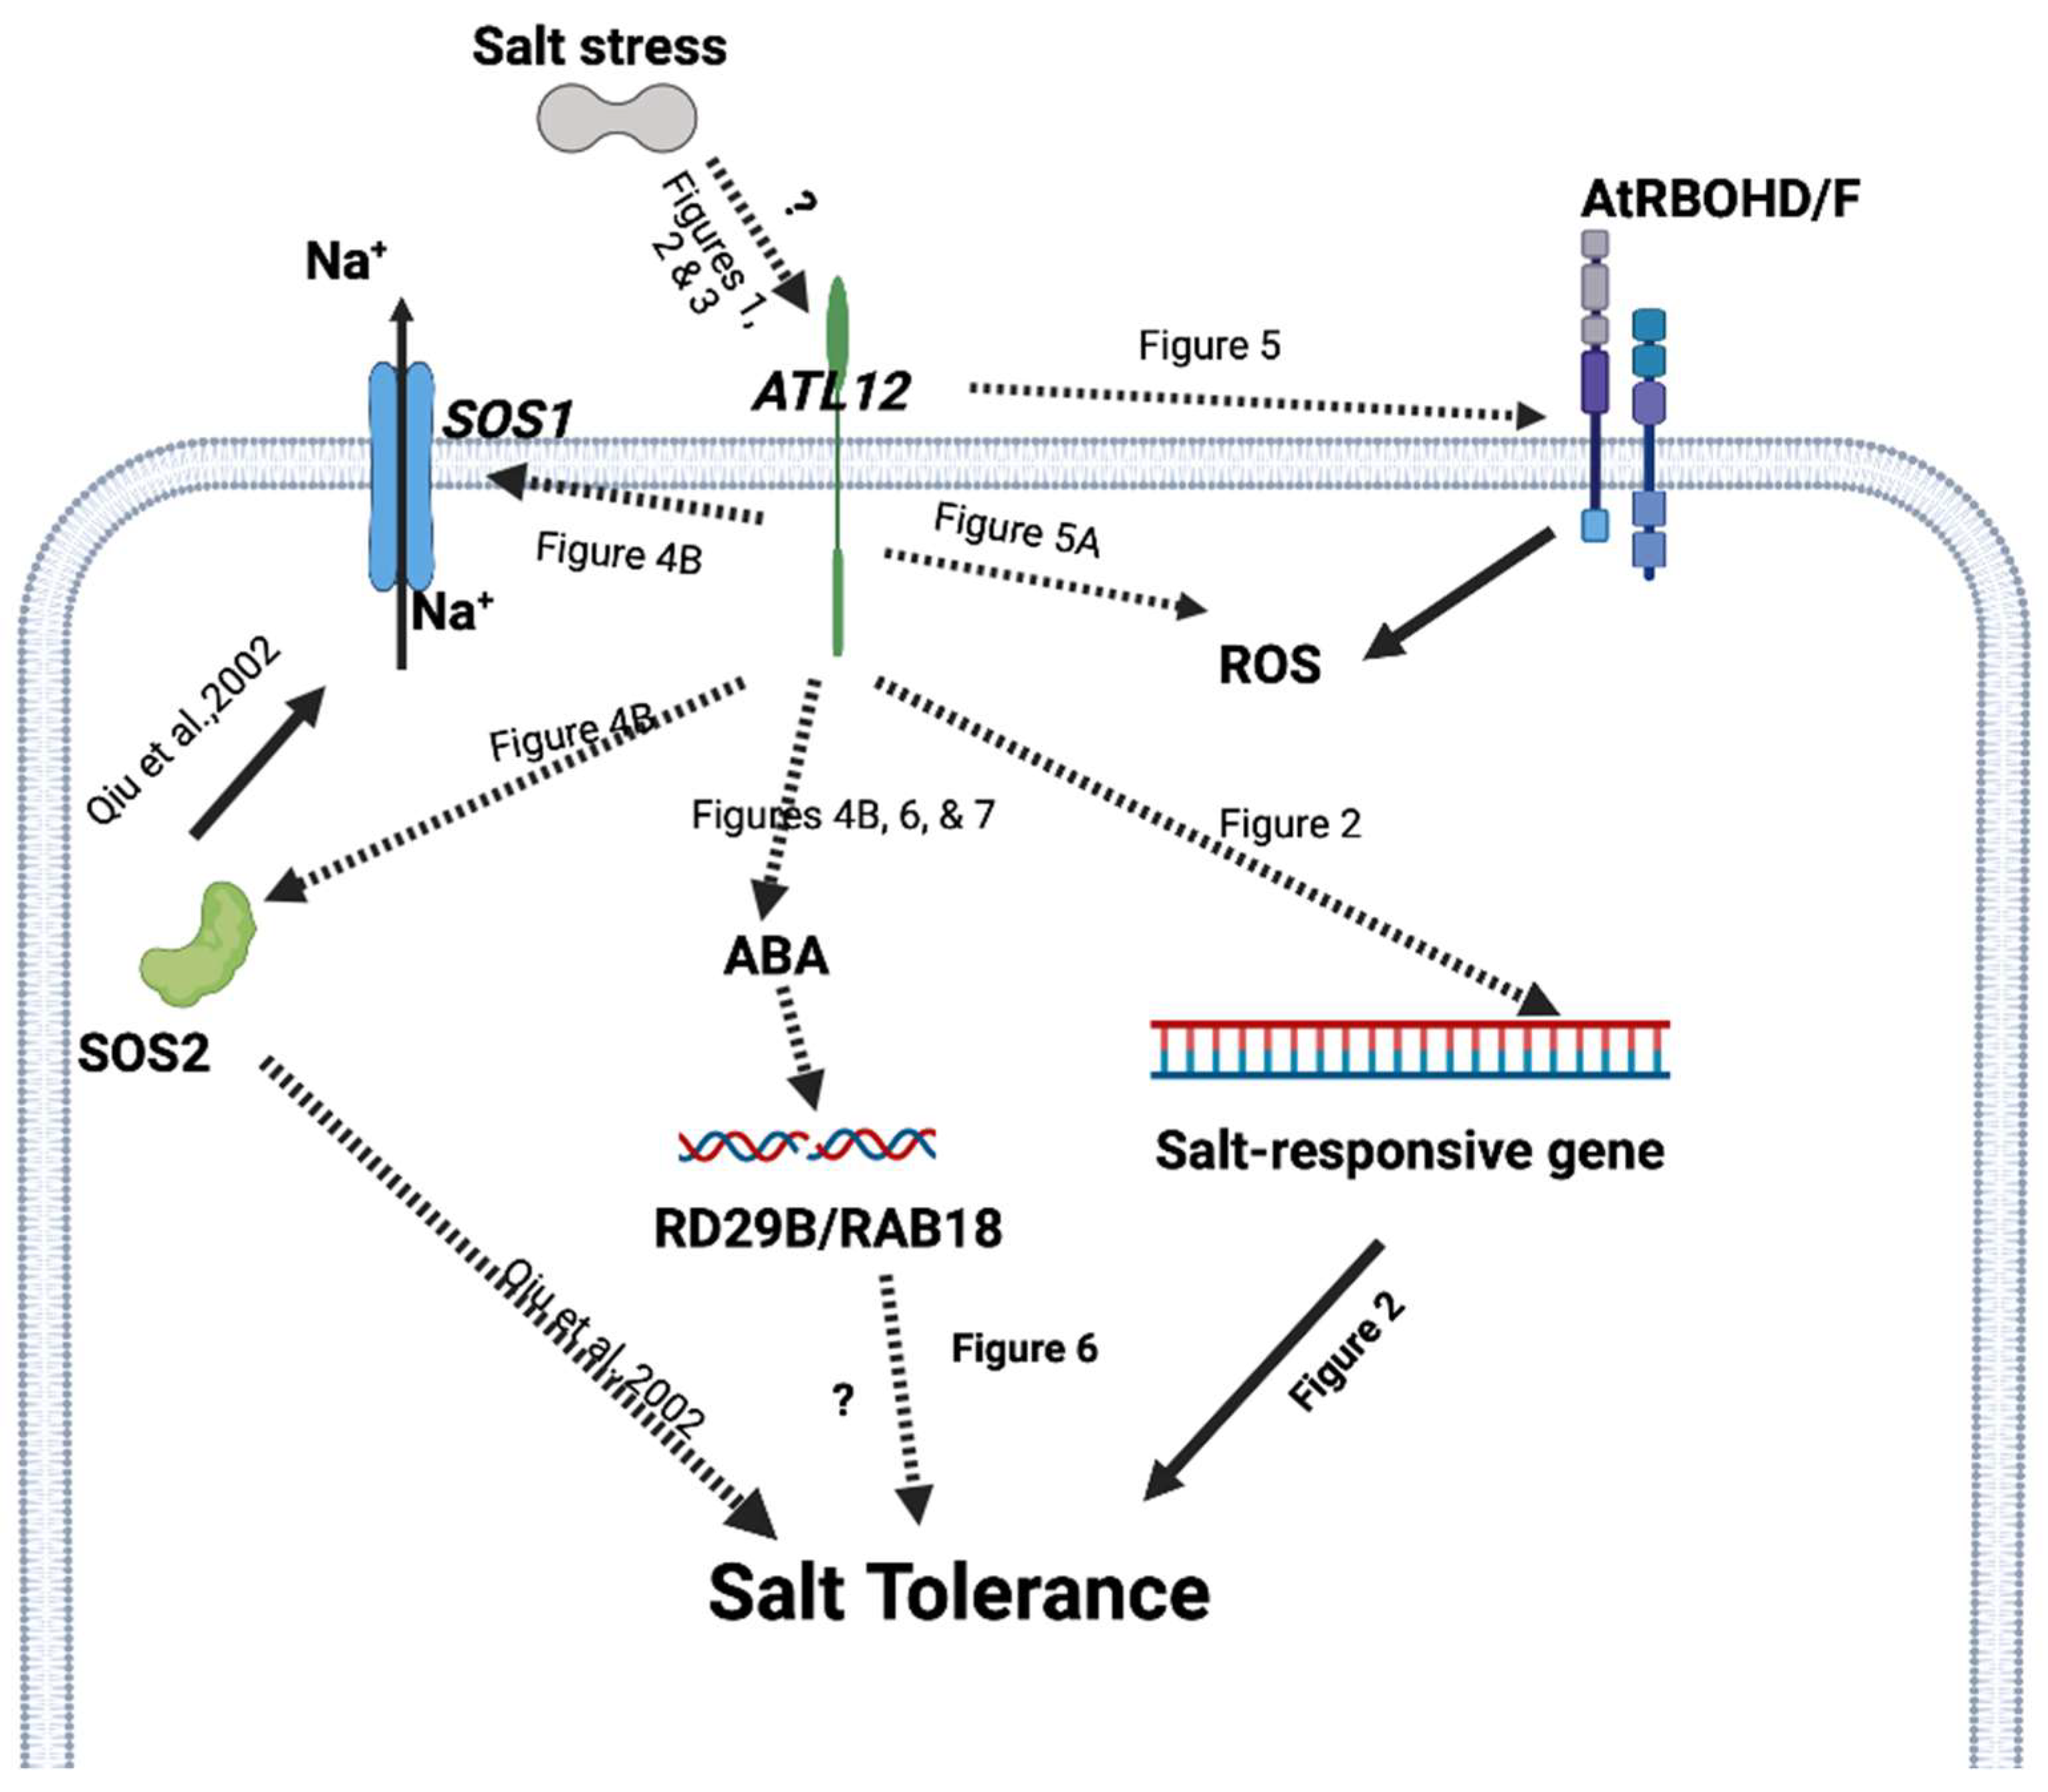
Arabidopsis Toxicos en Levadura 12, Modulates Salt Stress Responses through Multiple Signaling Events

Salt is one of the most common abiotic stresses that cause changes in ionic and osmotic pressure, affecting plant growth and development [2]. However, the cellular and molecular mechanisms behind how plants regulate salt stress largely remain unclear [1]. In this study, we characterize the gene ATL12, which belongs to the Arabidopsis Toxicos en Levadura 2 (ATL2) gene family and encodes a conserved RING-Zinc finger protein with E3 ubiquitin ligase activity. RT-PCR showed that ATL12 is continually expressed in roots, leaves, stems, and flowers and T-DNA insertional mutants of atl12 showed decreased seed germination rates and reduced root length compared to Col-0 WT. Over-expression of ATL12 resulted in an increased germination rate compared to WT. In addition, ATL12 was found to be highly induced by salt stress, and its expression is upregulated at late stages in response to NaCl stress. These results strongly suggest that ATL12 plays a positive role in the plant response to salt stress.
The Salt Overly Sensitive (SOS) signaling pathway, including the three major proteins SOS1, SOS2, and SOS3, mediate active Na+ extrusion at the cell membrane and maintain ion homeostasis in response to salt stress, which is believed to play an important role in plant salt tolerance [11]. Our study showed that SOS1 and SOS2 are upregulated in the overexpression line of ATL12 in response to salt, which suggests that ATL12 may be involved in Na+ ion extrusion via SOS signaling in order to assist plant cells in avoiding the toxic effects of excess Na+ accumulation. Further experiments to investigate Na+/K+ ion accumulation in Col-0, atl12 mutants, and OE-ATL12 after salt treatment would be valuable in order to confirm this hypothesis. In addition, ROS function as secondary signaling components in stress responses [17]. Excess ROS production in plants causes cellular damage, however, controlled levels of ROS play important roles in both biotic and abiotic stress tolerance [36,38]. A previous study has also shown that the NADPH oxidase genes AtRBOHD and AtRBOHF are involved in ROS-dependent regulation of Na+/K+ homeostasis in Arabidopsis under salt stress [37]. In this study, we detected an elevated oxidative burst in the OE-ATL12 in response to NaCl stress, while the atl12 mutant generated less ROS compared to Col-0 WT. These data suggest that ATL12 may be involved in ROS signaling in response to salt stress. ROS is mainly produced by the respiratory burst oxidase homolog D and F (RBOHD/F) proteins in response to abiotic stress in Arabidopsis thaliana. Our results show that the expression of AtRBOHD and AtRBOHF are highly induced at 4 h post salt treatment. Over-expression of ATL12 also upregulates the AtRBOHD/F expression, while AtRBOHD/F expression was downregulated in the mutant of atl12. Together these results suggest that ATL12 may be involved in the SOS1/2-mediated Na+ homeostasis and AtRBOHD/F mediated ROS generation in response to salt stress. Further studies focusing on the crosstalk between SOS1/2-mediated ion homeostasis and AtRBOHD/F mediated ROS signaling will be important to understand the role of ATL12 in mediating ion homeostasis under salt stress. RD29B (RESPONSIVE TO DESICCATION 29B) serves as a positive regulator in response to high salt stress through the ABA-activated signaling pathway [42]. Our results indicated that RD29B expression was upregulated in the over-expression line of ATL12 in response to salt stress, suggesting that ATL12 may modulate salt stress responses through the ABA signaling pathway. We also noted that RD29B and RAB18 expression were upregulated in the over-expression line of ATL12 in response to ABA. Compared to Col-0 WT, mutants of atl12 displayed different phenotypes in their germination rate, root length growth, leaf water loss, and stomatal aperture in response to ABA. These data confirmed that ATL12 is involved with the ABA signaling pathway. However, the detailed regulatory mechanisms in ABA-mediated responses to salt stress remain unclear and require further study.
CERK1 (Chitin elicitor receptor kinase 1) is a major receptor for plants in response to fungal pathogens or chitin treatment [43]. Our work has shown that ATL12 expression is highly induced by chitin treatment and that ATL12 expression is reduced in the cerk1 mutant after treatment with chitin [33]. A previous study also showed that CERK1 linked both salt stress and the chitin immune response in Arabidopsis and is capable of mediating salt signaling [26]. The cerk1 mutant is more susceptible to NaCl than wild-type plants and CERK1 is necessary for NaCl-induced cytosolic calcium([Ca2+] cyt) increase, which induces a mechanism for salt tolerance [26]. However, little is known about CERK1’s role in salt stress. In the current study, we showed that CERK1 expression is highly induced 2 h, 4 h, 16 h, and 24 h after salt treatment (Supplementary Figure S2). CERK1 expression is also upregulated in the over-expression line of ATL12 compared to Col-0 WT, while its expression is downregulated in mutants of atl12, as shown in Figure 4. Together these results strongly suggest that ATL12 may be involved in plant salt responses through CERK1 signaling. Further study is required to fully characterize the relationship between ATL12 and CERK1 in response to salt stress. Considering all of our data, we propose a putative model for ATL12’s function in salt stress response, shown in Figure 8. ATL12 is induced by NaCl stress after 4 h. ATL12 activates the AtRBOHD/F-mediated ROS signaling, SOS1/2 signaling, and ABA-dependent signaling pathway to induce the expression of a salt-responsive gene, which eventually increases the tolerance to salt stress.
In the current work, we present strong evidence demonstrating that ATL12 modulates salt stress responses via AtRBOHD/F-mediated ROS signaling, SOS1/2 signaling, and ABA-dependent signaling in Arabidopsis thaliana. Our results clearly indicate that ATL12 has an important role in modulating salt stress in Arabidopsis thaliana via multiple signaling pathways and has a broad role in salt responses. Further work characterizing the precise interactions between ATL12 and these signaling pathways will be important in determining the overlapping processes that regulate plant responses to salt stress in the environment.

4. Materials and Methods

4.1. Plant Materials and Growth Conditions

Arabidopsis thaliana ecotype Columbia (Col-0) plants were obtained from our laboratory stock. T-DNA insertion mutants of atl12 with Col-0 background (SALK_21056C, SALK_066923C, and SALK_0950303C) were obtained from the Arabidopsis Biological Resource Center (ABRC, Ohio State University, Columbus, OH, USA) [33]. All the plants were grown in the growth chamber under controlled conditions at 22 °C day/19 °C night with 16 h of light per 24 h and 50% humidity.

4.2. Bioinformatics Analysis and Phylogenetic Analysis

The complete sequences of ATL12 were obtained from GenBank and TAIR (The Arabidopsis Information Resource (TAIR). Open-reading frames (ORFs) of ATL12 were analyzed with ORF Finder (http://www.ncbi.nlm.nih.gov/gorf/orFig.cgi) (accessed on 15 October 2021), and its gene structure and functional domains were predicted with Uniprot (https://www.uniprot.org) (accessed on 15 October 2021) and Smart software (http://smart.embl-heidelberg.de/) (accessed on 15 October 2021). Tools used for general bioinformatics analysis and protein-specific domains were: http://www.ncbi.nlm.nih.gov/ and http://www.ebi.ac.uk/tools/ (accessed on 15 October 2021). Protein homology searches were performed with the Gramene program (https://www.gramene.org/#) (accessed on 15 October 2021) and the Phytozome program (https://phytozome-next.jgi.doe.gov; accessed on 10 January 2022). Selected nucleotide sequences were obtained from NCBI and aligned using MUSCLE with default parameter settings (accessed on 10 January 2022). Selected amino acid sequences were also aligned using Clustal Omega software (https://www.ebi.ac.uk/Tools/msa/clustalo/) (accessed on 10 January 2022) and highlighted in Boxshade (https://embnet.vital-it.ch/software/BOX_form.html; accessed on 10 January 2022). The alignment is available as Supplementary Figure S2. Phylogenetic trees were generated using the neighbor-joining method in MEGAX (https://www.megasoftware.net; accessed on 11 January 2022) and bootstrap analysis with 1000 replicates. Branch length indicates divergence distance. Numbers on the branches designate percentage bootstrap support.

4.3. Generation of Transgenic Plants and Constructs

To determine if the over-expression of ATL12 increases the tolerance to salt stress, ATL12 sequence was amplified using Phusion® High-Fidelity DNA Polymerase from New England Bio-Labs. For Gateway entry cloning, Taq DNA polymerase is added to the raw PCR product to generate 3′ A-Overhangs. The resulting PCR products are purified, and entry clones are generated by recombination into the pCR™8/GW/TOPO vector, using the pCRTM8/GW/TOPO® TA Cloning® Kit. To generate the overexpression constructs for ATL12, we utilized the destination vector pMDC 32 (35S promoter-attR1-CmR-ccdB-attR2). After sequencing the plasmid to confirm that the clone is in frame and oriented correctly, the recombinant construct is transformed into Agrobacterium tumefaciens strain (pGV3101) via chemical transformation. The floral dip method was used to generate overexpression transgenic plants and select the transformed resistant plants using kanamycin plates. The T3 progeny from these transformants will be used in future experiments. Transcript levels of ATL12 were measured via quantitative RT-PCR in the over-expression lines to confirm our results.

4.4. Salt and ABA Tolerance Test

To assess the susceptibility of Arabidopsis atl12 mutants to salt stress, the germination assay, and root length growth assay were performed. Arabidopsis seeds of Col-0 WT, and atl12 T-DNA insertional mutants were sterilized and then placed in the cold room for three days. For germination rate assay, over 36 seeds of wild-type, atl12 mutants, and over-expression lines were then planted on 0.5× MS agar plates containing 150 mM NaCl and normal 0.5× MS agar plates to grow. The emergence of the radicle is used as germinated seed and the percentage of germination rates for the seedlings was then observed and calculated after 7 days. For root elongation assay, seeds of wild-type, atl12 mutants, and overexpression seedlings were sterilized and dark-treated for 2 days and were grown on vertical MS medium plates for 2 days. After that, over 10 seeds with similar root lengths were transferred to MS medium supplemented with 150 mM NaCl and no salt for 7 days. The root length was measured by a ruler. The whole experiment was repeated five times. Statistical significance among samples was analyzed using one-way ANOVA followed by post-Hoc tests.

4.5. Histochemical Staining Assay

Transgenic Arabidopsis plants expressing pATL12-GUS were generated and a histochemical staining assay was used to figure out the pATL12-GUS (β-Glucuronidase) expression pattern. Primers pATL12-ATL12 5′-ATCCACCTTCATAAGCTGGTAATAGA-3′(forward) and pATL12-ATL12 5′-TGTTTTAGGATGGTGATTCGATGAG-3′(reverse) were used to generate the ATL12 promoter region. pATL12 sequence was amplified using Phusion® High-Fidelity DNA Polymerase from New England Bio-Labs. Taq DNA polymerase was added to the raw PCR product to generate 3′ A-overhangs and the resulting PCR products were purified and entry clones were generated by recombination into the pCR™8/GW/TOPO vector. The construct was sequenced and then switched onto destination vector CD3-754 (-attR1-CmR-ccdB-attR2-GUS) via LR reaction. Then the recombinant construct was transformed into Agrobacterium tumefaciens strain (pGV3101) via chemical transformation. The floral dip method was used to generate transgenic plants and selection for the transgenics was performed using kanamycin plates. The T3 progeny from these transformants was used in future experiments. The screened pATL12-GUS seeds were placed into 1× MS liquid culture and grown to specific developmental stages. The seedlings and tissues were then collected and stained overnight at 37 °C in GUS staining buffer. Samples were de-stained for up to 8 h in 100% Ethanol and the GUS expression is observed directly under the dissecting microscope.

4.6. Reactive Oxygen Species (ROS) Detection via DAB Staining Assay

Arabidopsis plants Col-0, T-DNA insertional mutants of atl12 and ATL12 over-expression lines were grown under normal conditions (22 °C day/19 °C night with 12 h of light per 24 h and 50% relative humidity) for 3 weeks. Plants were then treated with 150 mM NaCl for 16 h, then at least 5 leaves were removed from the plant and placed in a 24-well microtiter plate. 1 mL of the 10 mM Na2HPO4 DAB staining solution (50 mg DAB, 45 mL sterile H2O, 25 μL Tween 20 (0.05% v/v) and 2.5 mL 200 mM Na2HPO4, pH 3.0) was added to the leaf or leaves. The volume in each well was adjusted to ensure that the leaves were immersed in the DAB solution. The brown precipitate formed by the DAB reacting with the hydrogen peroxide can be observed by light microscopy and photographs are taken by the imaging system. The entire experiments were repeated three times.

4.7. Trypan Blue Staining

To study whether ATL12 was involved with cell death in response to salt stress, over five detached leaves from 4-weeks-old Col-0 wild-type, atl12 T-DNA insertion mutants, and ATL12 overexpression lines were treated with 150 mM NaCl for 16 h, no treatment (NT) was used as a control. The treated leaves were then transferred into a 50 mL Falcon tube with a lid and fully immersed with diluted trypan blue solution (10 mL phenol, 10 mL glycerol, 10 mL lactic acid, 10 mL water, and 0.02 g of trypan blue). The tissue was left for 30 min in the staining solution then the staining solution was replaced with 100% ethanol solution. The tissue was then left overnight in the distaining solution and ethanol was replaced several times until the tissue becomes clear. The tissue then can be observed by dissecting microscope and photographs were taken by image system. The experiments were repeated three times.

4.8. Water Loss Assay and Stomatal Aperture Measurement

To evaluate the water loss in response to ABA, over five detached leaves from 4-weeks-old plants were obtained and were incubated on 100 μM ABA for 2 h with the abaxial side towards. The leaves incubated with water were used as a control. The leaves’ weight was measured at each indicated time. The water loss was calculated as the loss of the percentage of the fresh weight for each leaf. To measure the stomatal aperture, the method described in Eisele et al., 2016 was used with modification [44]. Over five fresh detached leaves from 4-weeks-old plants were immersed in the stomatal opening solution (30 mM KCl,100 mM CaCl2, and 10 mM MES, pH 6.15) for 2 h. Leaves were then cut into half along the midrib. One part of the leaves was incubated with the stomatal opening solution containing ABA for 2 h, and the other part of the leaves was incubated with the stomatal opening solution as a control. All treatments are under constant light conditions. The leaves were then obtained and prepared for scanning electron microscopy. 10–15 stomatal apertures in each leaf were measured. 5 leaves were calculated for each genotype. The images were then measured and analyzed by ImageJ software. The stomatal aperture index (the division of the aperture width through the length) was calculated.

4.9. Quantitative Real-Time RT-PCR and RT-PCR

The seedlings with different treatments were collected and frozen in liquid nitrogen and stored in −80 for future qRT-PCR assays. Total RNA was extracted and purified from frozen tissues using TRizol Reagent (Invitrogen®, Carlsbad, CA, USA) followed by RNeasy plant mini kit from QIAGEN according to the manufacturer’s protocol. RNA samples were treated with RNase-free DNase I from Bio-Rad (Hercules, CA, USA). First-strand cDNA synthesis was primed with an oligo (dT)15 anchor primer and cDNA was synthesized using the First-Strand Synthesis Kit (Amersham-Pharmacia, Rainham, UK) according to the manufacturer’s protocol. The RT-PCR program consisted of 3 min at 96 °C, 35 cycles of 30 s at 94 °C, 30 s at about 60 °C, and 1 min at 72 °C. The final extension step consisted of 7 min at 72 °C. Amplified PCR fragments were visualized using 1.5% agarose gels. Quantitative RT-PCR experiments were performed using a SYBR® Green qPCR kit (Finnzymes, Espoo, Finland) with reactions at a final volume of 20 µL per well and using the cycle protocol recommended by the manufacturer. Samples were run in the Applied Bioscience qRT-PCR machine. Gene-specific primers were designed using the Geneious software. For quantitative real-time PCR, the following gene-specific primers are used:
ATL12 (At2g20030): 5′-GAATTATGCCGTTACTGCGACC-3(forward) and 5′-ATTTTGGCGTGTCGTGTTTAGG-3′(reverse);
SOS1 (At2g01980): 5′-GCAAACACTTTGATATTTATCCTCAG-3′(forward) and 5′-CATGAATTCCCTTGGTAGGC-3′(reverse);
SOS2 (At5g35410): 5′-CGAGCGAGAAGAATTGAAAGA-3′ (forward), and 5′-CGTTTTGCGGTCTGCTT-3′(reverse);
AtRBOHD (At5g47910): 5′-ATCAGTGCCGCATATTCTTTG-3′(forward) and 5′- ATCTTTCTTCCGAAGCACCTC-3′ (reverse);
AtRBOHF (At1g64060): 5′- AAACCAACACGCACCTTATTG-3′(forward) and 5′- ATGAAATTGGCATTGCATTTC-3′(reverse);
RD29B (At5g523000): 5′-GCAAGCAGAAGAACCAATCA-3′(forward) and 5′-CTTTGGATGCTCCCTTCTCA-3′(reverse);
CERK1 (At3g21630): 5′-TCGAAACAGTTCTTGGCGGA-3′(forward) and 5′-GGTTCTCGTCCTGACCCATG-3′(reverse);
Beta-ACTIN (At3g18780): 5′-AGCAGCTTCCATTCCCACAA-3(forward) and 5′- CATGCCATCCTCCGTCTTGA -3; (reverse).
Relative fold changes in transcript levels are determined by the double delta Ct Value (ΔΔCt) method. Data were acquired and analyzed using ANOVA followed by Tukey post hoc analysis. Three independent biological replicates will be used in each experiment.

4.10. Protein Expression and In Vitro Ubiquitination Assay

ATL12 (At2g20030), UBC8 (At5g41700), UBQ14 (At4g02890) and UBA2 (At5g06460) cDNA were amplified via PCR using primers listed below:
UBA2 FP: 5′-GGAATTCCATATGATGGAACCATTCGTTGTTAAGG-3′ RP 5′-GGAATTCCTCTCTCTATCTCTGAAACTCA-3′
UBC8 FP 5′-CGCCATATGATGGCTTCGAAACGGATCTTGAA-3′ RP 5′-CGCGGATCCCTGAAGCATACGAATCTTTGTTTAGC-3′
UBQ14 FP 5′-GGAATTCCATATGGAATTACAGATGCAGATCTT-3′ RP 5′-CGCGGATGGTTAGAAACCACCACGGAG-3′
ATL12 FP 5′-GGAATTCCATATGATGAATTCACCACAAGAAATCTCC-3′ RP 5′-CGGATCCCTATACATTAAGATTTTGGCGTGTC-3′
All cDNA of genes were cloned into a modified pET-28a (+) vector containing an N-terminal 6× His tag, which was obtained from Integrated DNA Technologies with the above-mentioned primers. The sequences and direction of all constructs were confirmed by Eurofins Scientific (Luxembourg) DNA tube sequencing. Positive plasmids were transformed into Escherichia coli BL21 (DE3) plyss competent cells from ThermoFisher Scientific (Waltham, MA, USA) based on the manufacturer’s protocol, and positive clones were confirmed with plasmid PCR and double restriction enzyme digestion. Two or three fresh positive clones were then picked and incubated with LB medium containing 50 μg/mL kanamycin and 34 μg/mL of chloramphenicol under shaker at 225 rpm overnight at 37 °C. The cells were transferred to 1 L of LB medium containing kanamycin and chloramphenicol in an incubator shaker at 37 °C under 225 rpm until the OD600 reaches about 0.6, BL21 cells were induced with 1 mM isopropyl β-D-1-thiogalactopyranoside (IPTG) overnight at 16 °C. The cells were harvested by centrifugation at 3500 rpm for 10 min and cell pellets were stored at −80 °C for future use. Protein extraction and purification were performed using TALON metal affinity resin with gravity columns kit from Clontech Laboratories, Inc. with modification. 1 g of bacterial cell pellet was suspended in 20 mL xTractor buffer with 40 μL of 5 units/μL DNase I solution, 6 mg lysozyme, 200 μL 0.1 M PMSF, 7 μL BME, and 1 mL of 100 mM MgCl2. The cells were lysed with gentle shaking for 30 min at 4 °C and were then centrifuged at 16,000 rpm for 20 min. The supernatant was mixed with 2 mL of equilibrated Talon metal resin with gentle agitation on ice for 20 min. The resin was washed with 40 mL of equilibration buffer containing 300 mM NaCl and 50 mM sodium phosphate at pH 7.4 and then loaded onto the Talon gravity column. Then 40 mL of washing buffer containing 300 mM NaCl, 50 mM sodium phosphate, and 25 mM Imidazole at pH 7.4 was used to wash non-specific binding proteins. The proteins were finally eluted with 10 mL of the elution buffer containing 300 mM NaCl, 50 mM sodium phosphate, and 150 mM Imidazole at pH 7.5 in 500 μL fractions. The protein fraction was determined using a UV spectrometer and SDS-PAGE and then dialyzed with dialysis tubing from ward’s science with 14 kDa molecular weight cut off in 1× phosphate-buffered saline solution contained 137 mM sodium chloride, 2.7 mM potassium chloride, and 10 mM phosphate buffer. The proteins were collected and concentration was determined by Bradford assay (IBI scientific, Dubuque, IA, USA). The proteins were aliquoted in small fractions and stored at −80 °C for downstream application. The in vitro ubiquitination assay was performed with Zhao et al., 2012 protocol with modification. 5× Ubiquitination buffer was prepared containing 100 mM Tris-HCl at pH 7.5, 25 mM MgCl2, 2.5 mM DTT and 2 mM ATP. The reactions were prepared in 40 μL total, including 8 μL of 5× ubiquitination buffer, 50 ng of UBA2, 250 ng of UBC8, 500 ng of UBQ14, and 500 ng of ATL12. The reactions minus UBA2, UBC8, UBQ14, ATL12, and ATP, respectively, were prepared at the same time as the control. The reactions were incubated at 30 °C for 2 h. The reactions were stopped by adding 4× SDS sample buffer containing 2 mL 1 M Tris-HCl at pH 6.8, 0.8 g SDS, 4 mL of 100% glycerol, 0.4 mL 14.7 M BME, 1 mL 0.5 M EDTA and 8 mg bromophenol blue, and the samples were boiled at 100 °C for 5 min. The reaction products were separated with 4–20% SDS-PAGE mini protean TGX precast protein gel (Bio-Rad) and detected with the anti-ubiquitin antibody by Western blotting.

Supplementary Materials

The following supporting information can be downloaded at: https://www.mdpi.com/article/10.3390/ijms23137290/s1.

Author Contributions

Conceptualization, F.K.; methodology, F.K.; validation, F.K.; formal analysis, F.K.; investigation, F.K.; data curation, F.K.; writing—original draft preparation, F.K.; writing—review and editing, F.K. and K.M.R.; visualization, F.K.; supervision, K.M.R.; project administration, F.K. and K.M.R.; funding acquisition, K.M.R. All authors have read and agreed to the published version of the manuscript.

Funding

This research received no external funding.

Institutional Review Board Statement

Not applicable.

Informed Consent Statement

Not applicable.

Data Availability Statement

Data is contained within the article or Supplementary Materials.

Acknowledgments

We thank all the members of the Ramonell lab for helpful discussions and review of the manuscript.

Conflicts of Interest

The authors declare no conflict of interest.

References

  1. Flowers, T.J. Improving crop salt tolerance. J. Exp. Bot. 2004, 55, 307–319. [Google Scholar] [CrossRef] [PubMed]
  2. Chen, Z.C.; Yamaji, N.; Horie, T.; Che, J.; Li, J.; An, G.; Ma, J.F. A Magnesium Transporter OsMGT1 Plays a Critical Role in Salt Tolerance in Rice. Plant Physiol. 2017, 174, 1837–1849. [Google Scholar] [CrossRef] [PubMed] [Green Version]
  3. Zhu, J.K. Salt and drought stress signal transduction in plants. Annu. Rev. Plant Biol. 2002, 53, 247–273. [Google Scholar] [CrossRef] [PubMed] [Green Version]
  4. Wang, W.; Vinocur, B.; Altman, A. Plant responses to drought, salinity and extreme temperatures: Towards genetic engineering for stress tolerance. Planta 2003, 218, 1–14. [Google Scholar] [CrossRef]
  5. Deinlein, U.; Stephan, A.B.; Horie, T.; Luo, W.; Xu, G.; Schroeder, J.I. Plant salt-tolerance mechanisms. Trends Plant Sci. 2014, 19, 371–379. [Google Scholar] [CrossRef] [Green Version]
  6. Gupta, B.; Huang, B. Mechanism of salinity tolerance in plants: Physiological, biochemical, and molecular characterization. Int. J. Genom. 2014, 2014, 701596. [Google Scholar] [CrossRef]
  7. Yan, Y.; Jing, X.; Tang, H.; Li, X.; Gong, B.; Shi, Q. Using Transcriptome to Discover a Novel Melatonin-Induced Sodic Alkaline Stress Resistant Pathway in Solanum lycopersicum L. Plant Cell Physiol. 2019, 60, 2051–2064. [Google Scholar] [CrossRef]
  8. Li, X.Y.; Zhao, J.; Sun, Y.H.; Li, Y.Z. Arabidopsis thaliana CRK41 negatively regulates salt tolerance via H2O2 and ABA cross-linked networks. Environ. Exp. Bot. 2020, 179, 104210. [Google Scholar] [CrossRef]
  9. Rabbani, M.A.; Maruyama, K.; Abe, H.; Khan, M.A.; Katsura, K.; Ito, Y.; Yoshiwara, K.; Seki, M.; Shinozaki, K.; Yamaguchi-Shinozaki, K. Monitoring expression profiles of rice genes under cold, drought, and high-salinity stresses and abscisic acid application using cDNA microarray and RNA gel-blot analyses. Plant Physiol. 2003, 133, 1755–1767. [Google Scholar] [CrossRef] [Green Version]
  10. Qiu, Q.S.; Guo, Y.; Dietrich, M.A.; Schumaker, K.S.; Zhu, J.K. Regulation of SOS1, a plasma membrane Na+/H+ exchanger in Arabidopsis thaliana, by SOS2 and SOS3. Proc. Natl. Acad. Sci. USA 2002, 99, 8436–8441. [Google Scholar] [CrossRef] [Green Version]
  11. Guan, P.; Wang, J.; Li, H.; Xie, C.; Zhang, S.; Wu, C.; Yang, G.; Yan, K.; Huang, J.; Zheng, C. SENSITIVE TO SALT1, An Endoplasmic Reticulum-Localized Chaperone, Positively Regulates Salt Resistance. Plant Physiol. 2018, 178, 1390–1405. [Google Scholar] [CrossRef] [PubMed] [Green Version]
  12. Yang, Y.; Guo, Y. Unraveling salt stress signaling in plants. J. Integr. Plant Biol. 2018, 60, 796–804. [Google Scholar] [CrossRef] [PubMed] [Green Version]
  13. Hasegawa, P.M.; Bressan, R.A.; Zhu, J.K.; Bohnert, H.J. Plant cellular and molecular responses to high salinity. Annu. Rev. Plant Physiol. Plant Mol. Biol. 2000, 51, 463–499. [Google Scholar] [CrossRef] [PubMed] [Green Version]
  14. Prasad, T.K.; Anderson, M.D.; Martin, B.A.; Stewart, C.R. Evidence for Chilling-Induced Oxidative Stress in Maize Seedlings and a Regulatory Role for Hydrogen Peroxide. Plant Cell 1994, 6, 65–74. [Google Scholar] [CrossRef]
  15. You, J.; Chan, Z. ROS Regulation During Abiotic Stress Responses in Crop Plants. Front. Plant Sci. 2015, 6, 1092. [Google Scholar] [CrossRef] [PubMed] [Green Version]
  16. Tsukagoshi, H.; Busch, W.; Benfey, P.N. Transcriptional regulation of ROS controls transition from proliferation to differentiation in the root. Cell 2010, 143, 606–616. [Google Scholar] [CrossRef] [PubMed] [Green Version]
  17. Huang, H.; Ullah, F.; Zhou, D.X.; Yi, M.; Zhao, Y. Mechanisms of ROS Regulation of Plant Development and Stress Responses. Front. Plant Sci. 2019, 10, 800. [Google Scholar] [CrossRef]
  18. Kurusu, T.; Kuchitsu, K.; Tada, Y. Plant signaling networks involving Ca(2+) and Rboh/Nox-mediated ROS production under salinity stress. Front. Plant Sci. 2015, 6, 427. [Google Scholar] [CrossRef] [Green Version]
  19. Yu, L.; Nie, J.; Cao, C.; Jin, Y.; Yan, M.; Wang, F.; Liu, J.; Xiao, Y.; Liang, Y.; Zhang, W. Phosphatidic acid mediates salt stress response by regulation of MPK6 in Arabidopsis thaliana. New Phytol. 2010, 188, 762–773. [Google Scholar] [CrossRef]
  20. Rodriguez, M.C.; Petersen, M.; Mundy, J. Mitogen-activated protein kinase signaling in plants. Annu. Rev. Plant Biol. 2010, 61, 621–649. [Google Scholar] [CrossRef]
  21. Zhu, J.K. Cell signaling under salt, water and cold stresses. Curr. Opin. Plant Biol. 2001, 4, 401–406. [Google Scholar] [CrossRef]
  22. Wang, J.; Liu, S.; Li, C.; Wang, T.; Zhang, P.; Chen, K. PnLRR-RLK27, a novel leucine-rich repeats receptor-like protein kinase from the Antarctic moss Pohlia nutans, positively regulates salinity and oxidation-stress tolerance. PLoS ONE 2017, 12, e0172869. [Google Scholar] [CrossRef] [PubMed]
  23. Zhou, Y.B.; Liu, C.; Tang, D.Y.; Yan, L.; Wang, D.; Yang, Y.Z.; Gui, J.S.; Zhao, X.Y.; Li, L.G.; Tang, X.D.; et al. The Receptor-Like Cytoplasmic Kinase STRK1 Phosphorylates and Activates CatC, Thereby Regulating H2O2 Homeostasis and Improving Salt Tolerance in Rice. Plant Cell. 2018, 30, 1100–1118. [Google Scholar] [CrossRef] [Green Version]
  24. Tran, L.S.; Urao, T.; Qin, F.; Yamaguchi-Shinozaki, K. Functional analysis of AHK1/ATHK1 and cytokinin receptor histidine kinases in response to abscisic acid, drought, and salt stress in Arabidopsis. Proc. Natl. Acad. Sci. USA 2007, 104, 20623–20628. [Google Scholar] [CrossRef] [PubMed] [Green Version]
  25. Li, C.H.; Wang, G.; Zhao, J.L.; Zhang, L.Q.; Ai, L.F.; Han, Y.F.; Sun, D.Y.; Zhang, S.W.; Sun, Y. The Receptor-Like Kinase SIT1 Mediates Salt Sensitivity by Activating MAPK3/6 and Regulating Ethylene Homeostasis in Rice. Plant Cell 2014, 26, 2538–2553. [Google Scholar] [CrossRef] [Green Version]
  26. Espinoza, C.; Liang, Y.; Stacey, G. Chitin receptor CERK1 links salt stress and chitin-triggered innate immunity in Arabidopsis. Plant J. 2017, 89, 984–995. [Google Scholar] [CrossRef] [Green Version]
  27. Salinas-Mondragón, R.E.; Garcidueñas-Piña, C.; Guzmán, P. Early elicitor induction in members of a novel multigene family coding for highly related RING-H2 proteins in Arabidopsis thaliana. Plant Mol. Biol. 1999, 40, 579–590. [Google Scholar] [CrossRef]
  28. Serrano, M.; Guzmán, P. Isolation and gene expression analysis of Arabidopsis thaliana mutants with constitutive expression of ATL2, an early elicitor-response RING-H2 zinc-finger gene. Genetics 2004, 167, 919–929. [Google Scholar] [CrossRef] [Green Version]
  29. Serrano, M.; Parra, S.; Alcaraz, L.D.; Guzmán, P. The ATL gene family from Arabidopsis thaliana and Oryza sativa comprises a large number of putative ubiquitin ligases of the RING-H2 type. J. Mol. Evol. 2006, 62, 434–445. [Google Scholar] [CrossRef]
  30. Suh, J.Y.; Kim, W.T. Arabidopsis RING E3 ubiquitin ligase AtATL80 is negatively involved in phosphate mobilization and cold stress response in sufficient phosphate growth conditions. Biochem. Biophys. Res. Commun. 2015, 463, 793–799. [Google Scholar] [CrossRef]
  31. Guo, T.; Kong, F.; Burton, C.; Scaglione, S.; Beagles, B.; Ray, J.; Ramonell, K.M. The E3 Ubiquitin Ligase ATL9 Affects Expression of Defense Related Genes, Cell Death and Callose Deposition in Response to Fungal Infection. Pathogens 2022, 11, 68. [Google Scholar] [CrossRef] [PubMed]
  32. Kim, S.J.; Kim, W.T. Suppression of Arabidopsis RING E3 ubiquitin ligase AtATL78 increases tolerance to cold stress and decreases tolerance to drought stress. FEBS Lett. 2013, 587, 2584–2590. [Google Scholar] [CrossRef] [PubMed] [Green Version]
  33. Kong, F.; Guo, T.; Ramonell, K.M. Arabidopsis Toxicos en Levadura 12 (ATL12): A Gene Involved in Chitin-Induced, Hormone-Related and NADPH Oxidase-Mediated Defense Responses. J. Fungi 2021, 7, 883. [Google Scholar] [CrossRef]
  34. Dreher, K.; Callis, J. Ubiquitin, hormones and biotic stress in plants. Ann. Bot. 2007, 99, 787–822. [Google Scholar] [CrossRef]
  35. Craig, A.; Ewan, R.; Mesmar, J.; Gudipati, V.; Sadanandom, A. E3 ubiquitin ligases and plant innate immunity. J. Exp. Bot. 2009, 60, 1123–1132. [Google Scholar] [CrossRef] [Green Version]
  36. Liu, Y.; He, C. Regulation of plant reactive oxygen species (ROS) in stress responses: Learning from AtRBOHD. Plant Cell Rep. 2016, 35, 995–1007. [Google Scholar] [CrossRef] [PubMed]
  37. Ma, L.; Zhang, H.; Sun, L.; Jiao, Y.; Zhang, G.; Miao, C.; Hao, F. NADPH oxidase AtrbohD and AtrbohF function in ROS-dependent regulation of Na+/K+ homeostasis in Arabidopsis under salt stress. J. Exp. Bot. 2012, 63, 305–317. [Google Scholar] [CrossRef]
  38. Kadota, Y.; Shirasu, K.; Zipfel, C. Regulation of the NADPH Oxidase RBOHD During Plant Immunity. Plant Cell Physiol. 2015, 56, 1472–1480. [Google Scholar] [CrossRef] [Green Version]
  39. Sah, S.K.; Reddy, K.R.; Li, J. Abscisic Acid and Abiotic Stress Tolerance in Crop Plants. Front. Plant Sci. 2016, 7, 571. [Google Scholar] [CrossRef] [Green Version]
  40. Munemasa, S.; Hauser, F.; Park, J.; Waadt, R.; Brandt, B.; Schroeder, J.I. Mechanisms of abscisic acid-mediated control of stomatal aperture. Curr. Opin. Plant Biol. 2015, 28, 154–162. [Google Scholar] [CrossRef] [Green Version]
  41. Aguilar, M.L.; Espadas, F.L.; Coello, J.; Maust, B.E.; Trejo, C.; Robert, M.L.; Santamaría, J.M. The role of abscisic acid in controlling leaf water loss, survival and growth of micropropagated Tagetes erecta plants when transferred directly to the field. J. Exp. Bot. 2000, 51, 1861–1866. [Google Scholar] [CrossRef] [PubMed] [Green Version]
  42. Msanne, J.; Lin, J.; Stone, J.M.; Awada, T. Characterization of abiotic stress-responsive Arabidopsis thaliana RD29A and RD29B genes and evaluation of transgenes. Planta 2011, 234, 97–107. [Google Scholar] [CrossRef] [PubMed]
  43. Miya, A.; Albert, P.; Shinya, T.; Shibuya, N. CERK1, a LysM receptor kinase, is essential for chitin elicitor signaling in Arabidopsis. Proc. Natl. Acad. Sci. USA 2007, 104, 19613–19618. [Google Scholar] [CrossRef] [PubMed] [Green Version]
  44. Eisele, J.F.; Fäßler, F.; Bürgel, P.F.; Chaban, C. A Rapid and Simple Method for Microscopy-Based Stomata Analyses. PLoS ONE 2016, 11, e0164576. [Google Scholar] [CrossRef]
Figure 1. Characterization of ATL12 and the protein sequence and phylogenetic analysis of ATL12. (A) Schematic structure of ATL12; Amino acid sequence of ATL12. Red color fonts indicate signal peptide; Blue color fonts indicate transmembrane domain and purple color font show zinc finger RING domain. (B) Phylogenetic analysis of the ATL12 homologs. Bootstrap values from 1000 replicates are indicated at each node and the scale represents branch lengths. (C) In vitro ubiquitination assay of ATL12. ATL12 was assayed for E3 activity in the presence of E1 (ATL12), E2 (UBC8), and 6× His tagged ubiquitin. Samples were separated by 4–20% SDS-PAGE. Anti-ubiquitin antibody was used to detect in western blotting.
Ijms 23 07290 g001
Figure 2. Phenotypic analysis of ATL12 in response to salt stress. (A) Analyses of T-DNA mutants in the AT2G20030 gene. The locations of the T-DNA insertions in the AT2G20030 gene, SALK_066923C, SALK_095030C, and SALK_201056C, are shown by arrowheads. qRT-PCR analysis of ATL12 transcript expression in the atl12 mutant, Col-0 wild type, and ATL12 over-expression line. Error bars indicate mean ± SD of three independent experiments; (B) Images of Col-0 wild type, atl12 mutants, and overexpression line germinated in normal and 150 mM NaCl contained MS agar plates. (C) Images of Col-0 wild type, atl12 mutants, and overexpression line root length growth. (D) Germination rate analysis of Col-0 wild type, T-DNA insertional mutants of atl12, atl12a, and atl12b, and the overexpression (OE) line of ATL12 in response to salt stress. Error bars indicate mean ± SD of five independent experiments. (E) Primary root length growth analysis of Col-0 wild type, T-DNA insertional mutants of atl12, atl12a, and atl12b, and the overexpression (OE) line of ATL12 in response to salt stress. (F,G) Salt tolerance of Col-0 wild type, atl12 mutants, and overexpression line under normal condition and salt condition. NS: no significance; *** indicated p < 0.001, **** indicated p < 0.0001.
Ijms 23 07290 g002
Figure 3. Expression pattern of ATL12. (A) Histochemical staining analysis of pATL12:GUS seedlings at major organs of Col-0. (B) RT-PCR analysis of ATL12 expression in major organs. Beta-actin(ACT2) gene expression was used as an internal control. (C) Histochemical staining analysis of pATL12:GUS seedlings under normal conditions and 150 mM NaCl condition. (D) qRT-PCR analysis of ATL12 mRNA expression in response to salt at different time points. Asterisks indicate statistically significant differences between the samples treated and untreated, according to the One-way ANOVA analysis and multiple comparisons post-Tukey’s test. The error bar indicates means ± the SD of three independent biological replicates. **** indicates p < 0.0001, *** indicates p < 0.001, * indicated p < 0.05, and NS indicates not significant. The black line indicates that significant differences are present between datasets.
Ijms 23 07290 g003
Figure 4. qRT-PCR analysis of ATL12, SOS1, SOS2, RD29B, and CERK1 expression in Col-0, atl12, and OE-ATL12 under normal conditions and salt stress. (A) qRT-PCR analysis of salt responsive genes under normal conditions; (B) qRT-PCR analysis of salt responsive genes in response to salt. Asterisks indicate statistically significant differences between the samples, according to the One-way ANOVA analysis and multiple comparison post Tukey’s test. **** indicates p < 0.0001, *** indicates p < 0.001, and NS indicates not significant. The black line indicates that significant differences are present between datasets. The error bar indicates means ± the SD of three independent biological replicates.
Ijms 23 07290 g004
Figure 5. Detection of reactive oxygen species production in over-expression of ATL12 in response to NaCl stress. (A) DAB staining of wild-type, atl12 mutants and over-expression seedlings in response to salt treatment. DAB staining was performed to indicate areas of hydrogen peroxide production (brown stain indicated the location of hydrogen peroxide activity). The white scale bar indicates 1 mm. (B) Trypan blue staining of wild-type, atl12 mutants, and over-expression seedlings in response to salt treatment. (C) Germination rate assay in Col-0, atrbohd, and atrbohf in response to 150 mM NaCl. (D) Root length growth assay in Col-0, atrbohd, and atrbohf in response to 150 mM NaCl. (E) Germination rate analysis of Col-0 wild type, atrbohd, and atrbohf mutant in response to salt stress. (F) Root length growth of Col-0 wild-type, atrbohd, and atrbohf mutant in response to salt stress. Error bars indicate mean ± SD of five independent experiments; NS: no significance; ***: p < 0.001, ****: p < 0.0001. White scale bar indicates 1.3 cm. (G) qRT-PCR analysis of ATL12, AtRBOHD, and AtRBOHF expression in response to salt stress. (H) qRT-PCR analysis of AtRBOHD, AtRBOHF, and ATL12 expression in mutant of atl12, Col-0 WT, and ATL12 over-expression line under normal conditions. (I) qRT-PCR analysis of AtRBOHD, AtRBOHF, and ATL12 expression in mutant of atl12, Col-0 WT, and ATL12 over-expression line under salt conditions.
Ijms 23 07290 g005
Figure 6. Expression pattern of ATL12 and RD29B in response to ABA. (A) qRT-PCR analysis of ATL12, and RD29B mRNA expression in response to salt at different time points. (B) qRT-PCR analysis of ABA-responsive gene RD29B and RAB18 expression in Col-0, atl12, and overexpression ATL12 line under normal conditions in response to ABA. (C) qRT-PCR analysis of ABA-responsive gene RD29B and RAB18 expression in Col-0, atl12, and overexpression ATL12 line in response to ABA. Asterisks indicate statistically significant differences between the samples, according to the One-way ANOVA analysis and multiple comparison post-Tukey’s test. NS: no significance; ***: p < 0.001, ****: p < 0.0001.
Ijms 23 07290 g006
Figure 7. ATL12 modulates ABA response. (A) Images of Col-0 wild-type, atl12 mutants, and the overexpression line under normal, 0.75 μM, and 100 μM ABA contained MS agar plates. (B) Germination rate analysis. Error bars indicate mean ± SD of five independent experiments; (C) Images of Col-0 wild-type, atl12 mutants, and overexpression line root length growth under normal, 0.75 μM, and 100 μM ABA contained MS agar plates. (D) Primary root length analysis. Error bars indicate mean ± SD of five independent experiments; NS: no significance; *: p < 0.05, **: p < 0.01, ***: p < 0.001, ****: p < 0.0001. (E) SEM image of stomata aperture in Col-0 wild-type, atl12 mutants, and overexpression line under normal conditions and ABA treatment. (F,G) Stomatal aperture assay of Col-0, mutants atl12, and overexpression line ATL12 under control and ABA conditions. (H) Water loss assay of Col-0, mutants atl12, and overexpression line ATL12 under normal conditions. (I) Water loss assay of Col-0, mutants atl12, and overexpression line ATL12 under ABA treatment.
Ijms 23 07290 g007
Figure 8. Proposed model for ATL12’s function in salt stress response. ATL12 is induced by salt stress and positively regulates salt tolerance in Arabidopsis seedlings (Figure 1, Figure 2 and Figure 3). Then ATL12 modulates salt stress responses via AtRBOHD/F-mediated ROS signaling (Figure 5), SOS1/2 signaling (Figure 4), and ABA-dependent signaling (Figure 6 and Figure 7) in Arabidopsis thaliana. A solid arrow indicates confirmed regulation or interaction. Dashed lines indicate our putative interactions with pathways or molecules that are confirmed by results. The question mark indicates further study is required.
Ijms 23 07290 g008
Publisher’s Note: MDPI stays neutral with regard to jurisdictional claims in published maps and institutional affiliations.

