Article

DNA Demethylation Induces Tree Peony Flowering with a Low Deformity Rate Compared to Gibberellin by Inducing PsFT Expression under Forcing Culture Conditions

1
Key Laboratory of Biology and Genetic Improvement of Horticultural Crops, Institute of Vegetables and Flowers, Chinese Academy of Agricultural Sciences, Ministry of Agriculture and Rural Affairs, Beijing 100081, China
2
Institute for Medicinal Plants Research “Dr Josif Pančić”, 11000 Belgrade, Serbia
*
Authors to whom correspondence should be addressed.
These authors contributed equally to this work.
Int. J. Mol. Sci. 2022, 23(12), 6632; https://doi.org/10.3390/ijms23126632
Submission received: 8 May 2022 / Revised: 7 June 2022 / Accepted: 13 June 2022 / Published: 14 June 2022
(This article belongs to the Section Molecular Plant Sciences)

Abstract

:
Gibberellin (GA) is frequently used in tree peony forcing culture, but inappropriate application often causes flower deformity. Here, 5-azacytidine (5-azaC), an efficient DNA demethylating reagent, induced tree peony flowering with a low deformity rate by rapidly inducing PsFT expression, whereas GA treatment affected various flowering pathway genes with strong pleiotropy. The 5-azaC treatment, but not GA, significantly reduced the methylation level in the PsFT promoter with the demethylation of five CG contexts in a 369 bp CG-rich region, and eight light-responsive related cis-elements were also predicted in this region, accompanied by enhanced leaf photosynthetic efficiency. Through GO analysis, all methylation-closer differentially expressed genes (DEGs) were located in the thylakoid, the main site for photosynthesis, and were mainly involved in response to stimulus and single-organism process, whereas GA-closer DEGs had a wider distribution inside and outside of cells, associated with 12 categories of processes and regulations. We further mapped five candidate DEGs with potential flowering regulation, including three kinases (SnRK1, WAK2, and 5PTase7) and two bioactive enzymes (cytochrome P450 and SBH1). In summary, 5-azaC and GA may have individual roles in inducing tree peony flowering, and 5-azaC could be a preferable regulation approach; DNA demethylation is suggested to be more focused on flowering regulation with PsFT playing a core role through promoter demethylation. In addition, 5-azaC may partially undertake or replace the light-signal function, combined with other factors, such as SnRK1, in regulating flowering. This work provides new ideas for improving tree peony forcing culture technology.

1. Introduction

Tree peony (Paeonia suffruticosa Andr.), an original Chinese ornamental plant with a history longer than 3000 years, is well-received due to its large and colorful flower as well as high humanistic and economic values [1]. This species has spread across the world in half a century, e.g., in Japan, France, and the USA. Tree peony has a very short flowering period; thus, forcing culture is frequently used to prolong its market supply [2]. As a temperate plant, a certain amount of low temperature for buds is necessary for tree peony re-flowering in the next cycle, whereas under forcing culture conditions, gibberellin (GA) is commonly used to compensate for insufficient bud chilling, but excessive GA treatment often causes flower deformity, which seriously affects its ornamental value. DNA methylation regulates many biological processes, and in tree peony, DNA demethylation was reported to promote bud dormancy release [3]. However, the specific role of DNA methylation in regulating tree peony flowering, especially its interaction with various flowering pathways, remains unclear.
GA, one of the most important plant hormones, is involved in various development processes, such as seed germination, stem elongation, flowering, and fruit development [4,5]. GA includes a large category of compounds and intermediates, and more than 130 GA structures have been identified. Among them, only GA1, GA3, GA4, and GA7 are thought to function as bioactive hormones, whereas GA1 and GA4 are the major active GAs that promote plant growth and development [6]. GA biosynthesis is a complex and multifactor-regulated process, which can be divided into three steps: (i) catalysis of ent-kaurene from trans-geranylgeranyl diphosphate (GGPP), mainly regulated by copalyl diphosphate synthase (CPS) and ent-kaurene synthase (KS); (ii) oxidization of ent-kaurene to GA12-aldehyde, a general GA precursor, regulated by cytochrome P450 monooxygenases; and (iii) catalysis of GA12-aldehyde into bioactive GAs, regulated by GA20-oxidase (GA20ox) and GA3-oxidase (GA3ox). In this step, the biosynthesis of four functional GAs starts differentiation, the early-13-hydroxylation pathway catalyzes GA1 and GA3, and the non-13-hydroxylation pathway catalyzes GA4 and GA7. In addition, the bioactive GAs can be inactivated by GA2-oxidase (GA2ox) as a negative regulator after synthesis [7].
In higher plants, flowering is a complex and precisely regulated process, and a series of flowering-pathway regulatory genes have been identified with strong pleiotropy [8]. Among them, FLOWERING LOCUS T (FT) and SUPPRESSOR OF OVEREXPRESSION OF CONSTANS1 (SOC1) play major roles in inducing flowering, and both of them are induced by CONSTANS (CO) under a long-day photoperiod [9,10]. The increased expressions of FT and SOC1 activate the meristem identity genes APETALA1 (AP1) and LEAFY (LFY), respectively, and then irreversibly induce the turning of the floral meristem as well as flowering [11,12]. In addition, GA regulates SOC1 expression, but not FT, in meristematic tissue in two channels in the GA pathway: one is via the interaction of GA-INSENSITIVE DWARF1 (GID1) and GA-INSENSITIVE (GAI), two GA signaling genes, and the other is through the inhibition of SHORT VEGETATIVE PHASE (SVP). In addition, GA also promotes flowering by inducing LFY through SOC1 [13].
In addition to heritable regulation, DNA methylation, a reversible and efficient epigenetic modification, also regulates various biological processes in plants as well as environmental adaption [14,15,16,17,18]. Normally, methylation occurs in the promoter region of a gene, which inhibits its expression by decreasing the transcriptional activity, and vice versa. DNA methylation occurs in three sequence contexts: symmetric CG and CHG as well as asymmetric CHH (H presents A, T, or C). CG and CHG methylation are maintained by METHYLTRANSFERASE1 (MET1) and CHROMOMETHYLASE3 (CMT3), respectively, whereas CHH is maintained by DOMAINS REARRANGED METHYLTRANSFERASE2 (DRM2) [19,20]. DNA methylation influences the flowering process mainly by modulating related gene expression, and in Arabidopsis, this process is closely related to flowering time mainly by targeting the FT promoter [21,22]. In addition, TaFT1 in wheat (Triticum aestivum L.), CiLFY in precocious trifoliate orange (Poncirus trifoliata), and CpSVP and CpAP1 in papaya (Carica papaya L.) influence the flowering process by gene-specific DNA methylation [23,24,25].
In the forcing culture of tree peony, GA is frequently used to compensate for insufficient bud chilling. We previously found that PsFT and PsSOC1 played key roles in regulating tree peony flowering out of season with the interaction of other genes, such as PsCO, involved in the photoperiod, and PsGID1c and PsGAI, involved in GA pathways [26,27]. In this study, the tree peony ‘Luo Yang Hong’, one of the most applied forcing culture cultivars, was used as a test material. We treated the buds with 5-azacytidine (5-azaC), which is an efficient DNA demethylating reagent, as well as GA and the combination of 5-azaC and GA (A + G) for forcing culture assessment. We observed the morphological changes, measured the GA content, and determined flowering-pathway-related gene expression; we also assessed the DNA methylation level in the promoters of a candidate gene. Furthermore, we systematically analyzed the transcriptome data among different treatments and identified other candidate regulatory genes to explore more potential regulatory patterns or pathways. This work provides more evidence on flowering regulation of tree peony, which may also reveal new ways for improving annual flowering technology.

2. Results

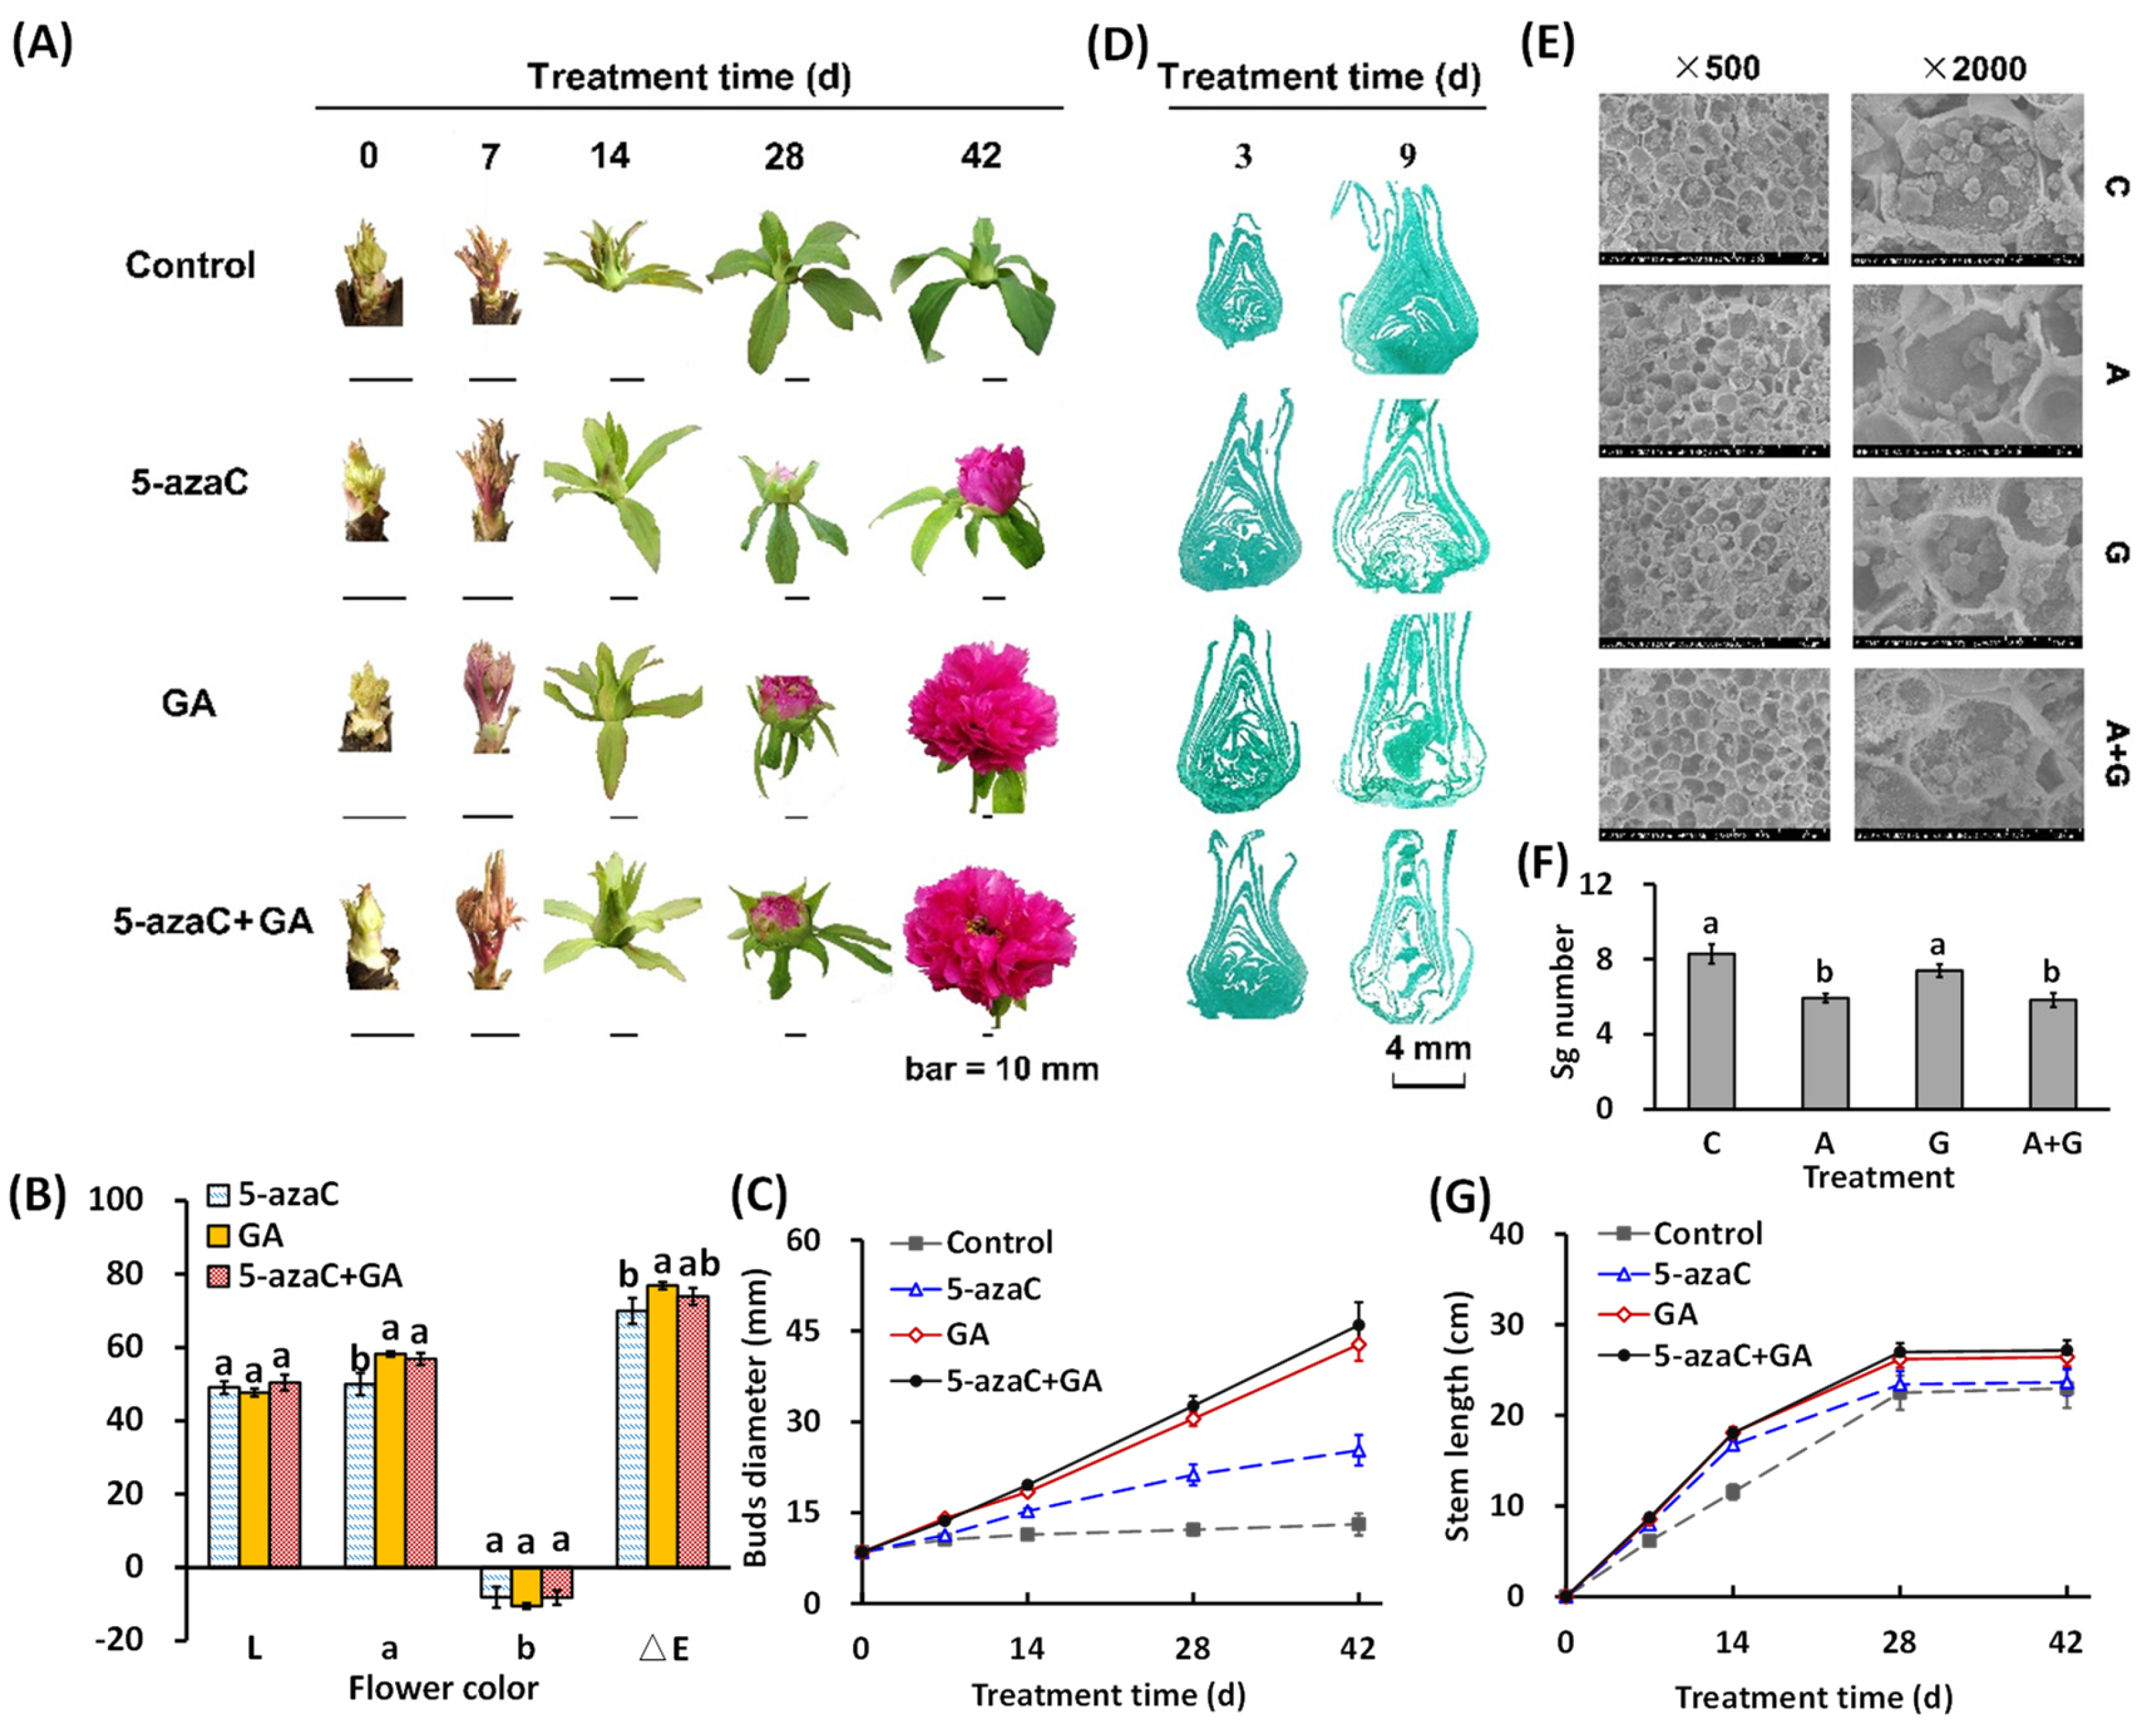
2.1. Effects of 5-azaC and GA Treatments on the Morphological Changes in Tree Peony

In this study, the bud in the control group developed slightly by 14 d but failed to show color or flowering at 42 d; 5-azaC treatment induced bud development with the petal showing color at 28 d and then finally flowering; GA treatment further accelerated this development, whose bud diameter enlarged to 1.2 and 1.4 times that of the 5-azaC treatment group at 14 and 28 d, respectively, and fully opened at 42 d with a deeper petal color. In the A + G treatment group, the flowering process, as well as petal color and bud diameter, were similar to that in the GA treatment group (Figure 1A–C and Figure S1A). We further determined the microscopic changes in the bud in the early stage and observed that both the 5-azaC and GA treatments significantly induced organ differentiation at 9 d, accompanied by a decrease in the starch grain number in both the 5-azaC and A + G treatment groups (Figure 1D–F). The branch length increased significantly in all three treatment groups at 7 and 14 d, but the value in the 5-azaC treatment did not differ from that in the control group at 28 and 42 d (Figure 1G).

2.2. Effects of 5-azaC and GA Treatments on Flowering Quality and GA Biosynthesis Regulation

GA supplementation often results in a certain ratio of deformed flowers in tree peony forcing culture. In this study, the 5-azaC treatment resulted in a 67.9% total flowering rate, and 58.9% of the flowers were normal. The GA treatment increased the total flowering rate to 95.4%, but 67.4% of the flowers were deformed at different levels, and 9.3% of them reached Mal III. In the A + G treatment group, the total flowering rate was similar to that observed in the GA treatment, but the normal flower rate was 1.8 times that of the GA treatment group (Figure 2A). In addition, the GA treatment reduced the petal number and area compared to the 5-azaC treatment, whereas the leaf area and chlorophyll content were not affected (Figure 2B–D).
We determined the contents of nine types of GAs in the buds. The GA1, GA3, GA29, and GA53 contents were dramatically induced or reduced by GA treatment, whereas the GA3, GA4, GA15, GA19, and GA53 levels were up- or downregulated by 5-azaC treatment. Interestingly, no superposition effect was detected for any of the GAs after A + G treatment (Figure 2E). At the transcriptional level, the expression of PsKS was reduced by both the 5-azaC and GA treatment as well as A + G at 14 and 21 d (Figure 2F). PsGA20ox expression showed a relatively high level in the control group, but the GA and A + G treatment rapidly reduced this expression from 7 d, followed by the 5-azaC treatment from 14 d (Figure 2G). PsGA2ox expression continuously increased in the control group from 7 d, and all three treatments inhibited this increase at a similar level, except the 5-azaC treatment at 21 d (Figure 2H).

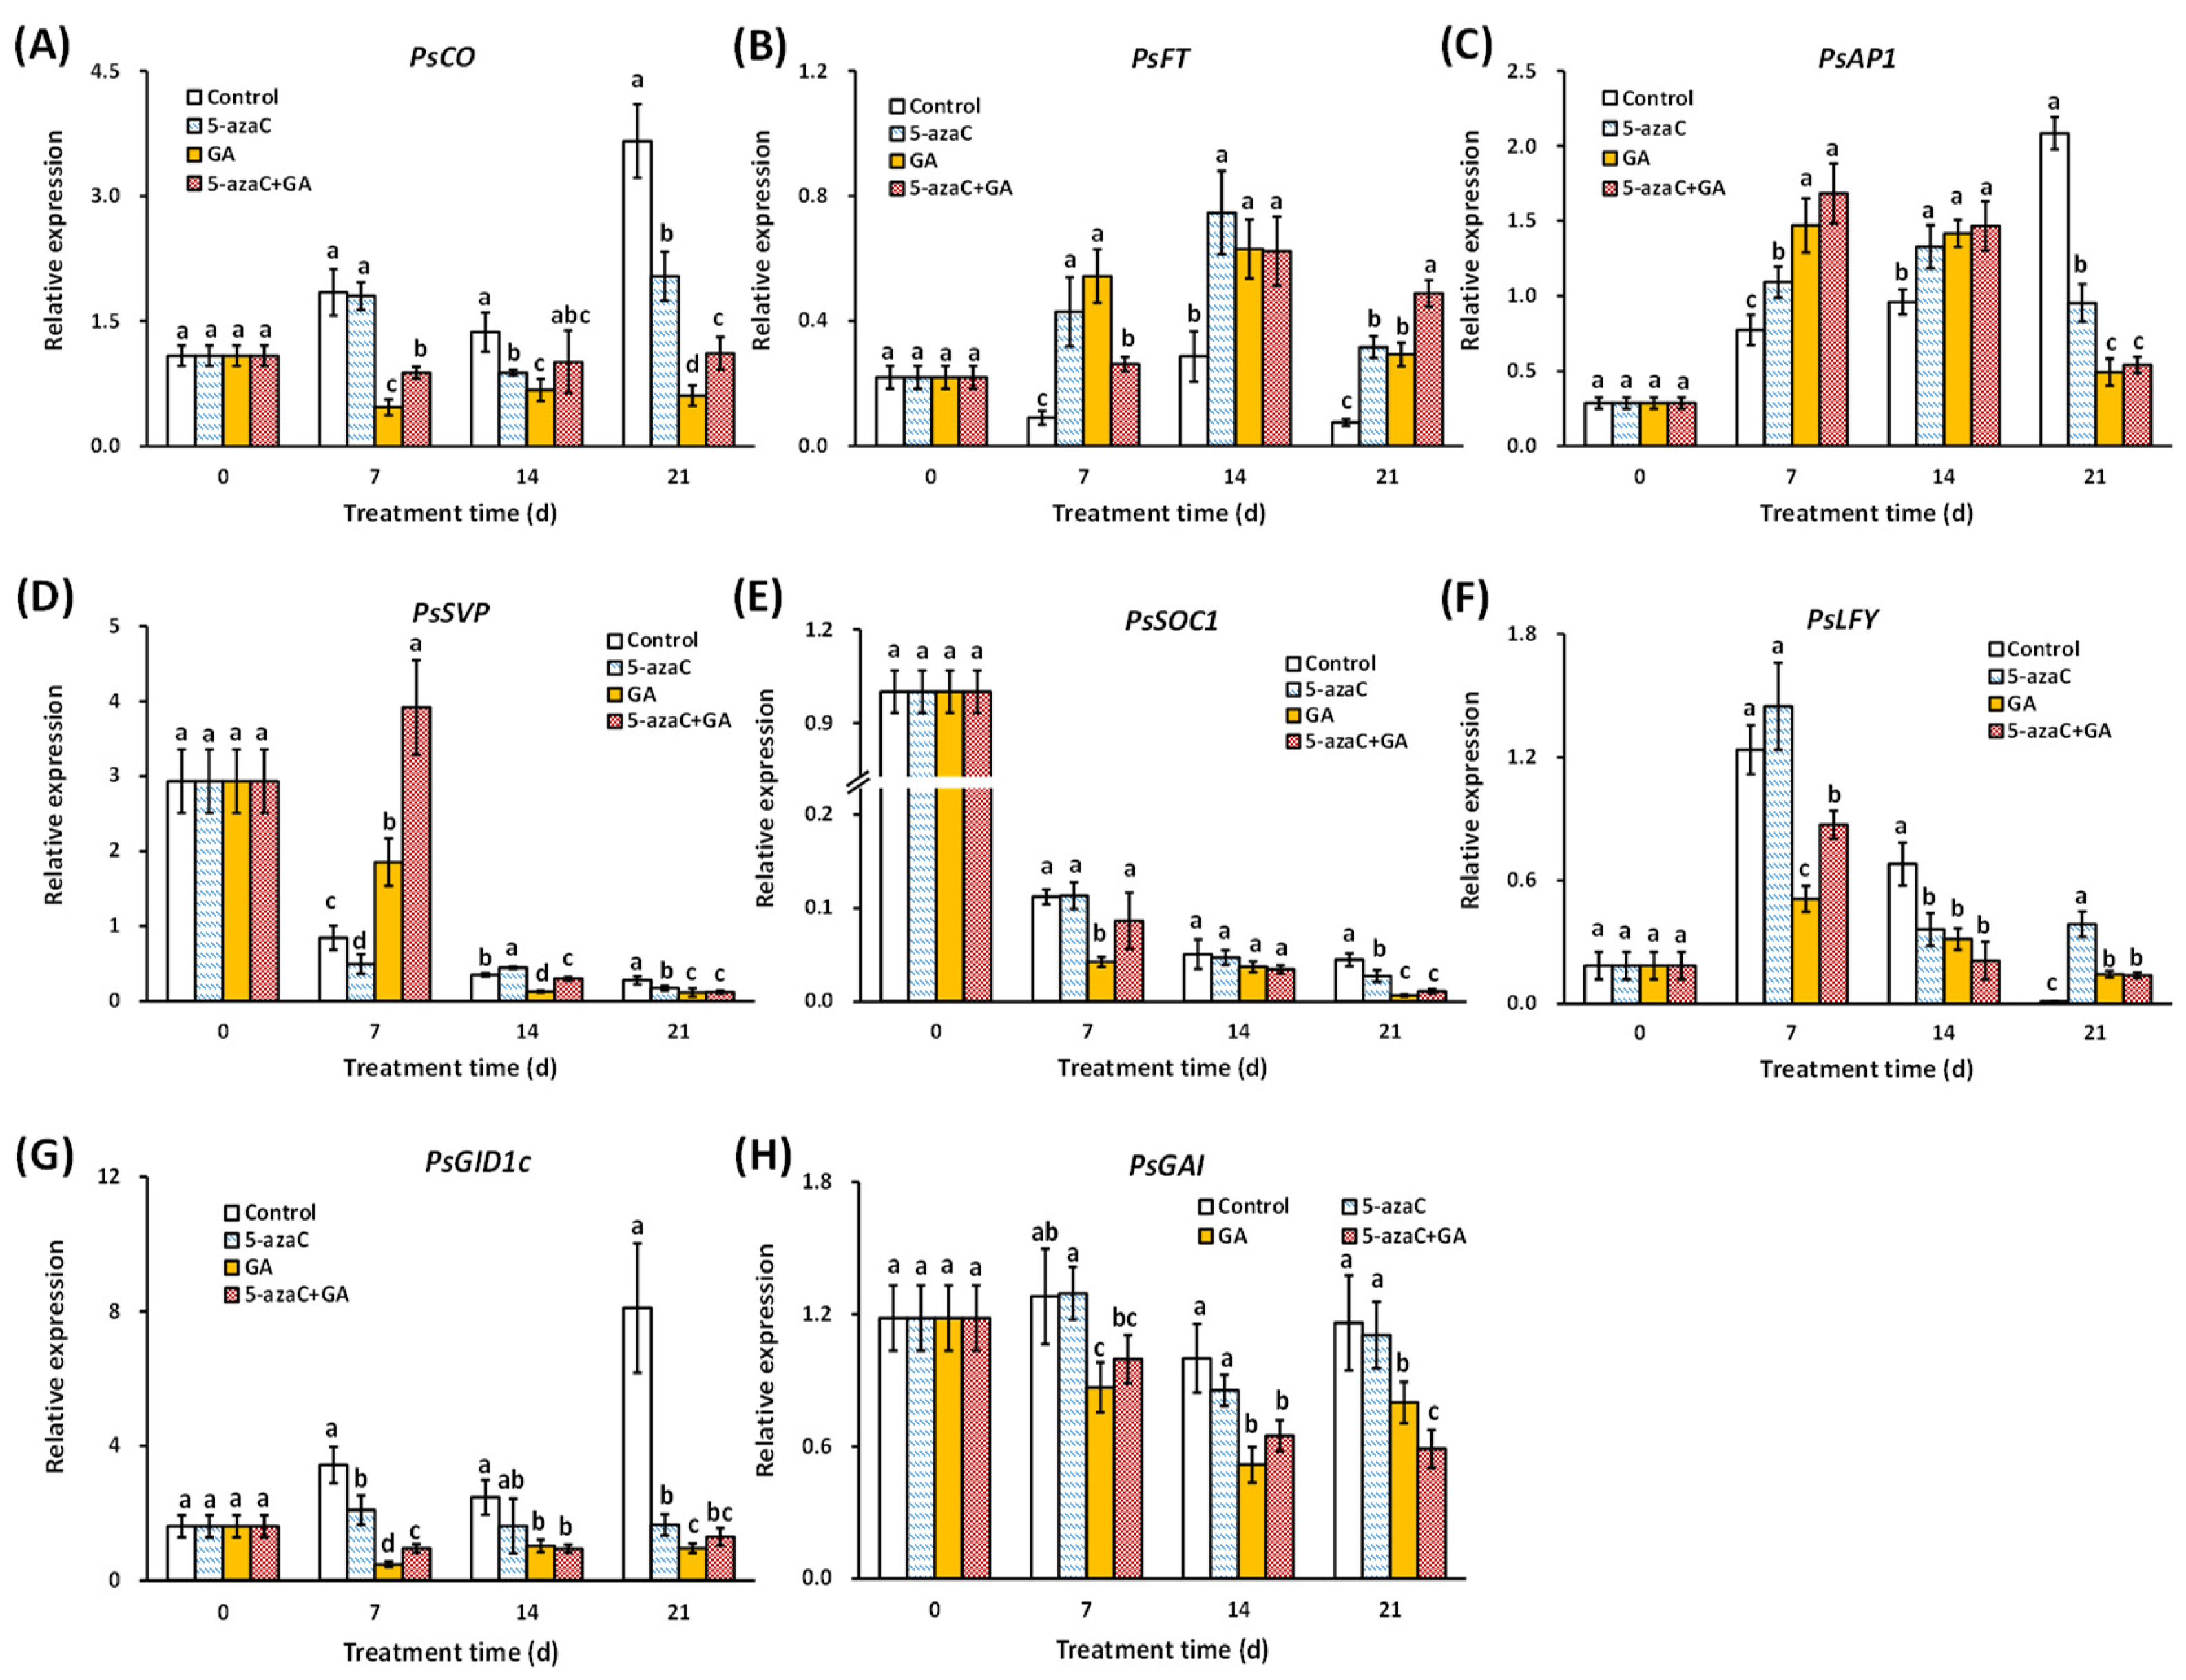
2.3. Effects of 5-azaC and GA Treatments on the Expression of Flowering-Pathway Genes

We determined the expression of flowering-pathway-related genes in buds, especially those involved in the photoperiod and GA pathways. The results showed that PsCO expression was dramatically reduced by GA treatment from 7 d, whereas the reduction by 5-azaC treatment was less intense and started at 14 d (Figure 3A). Both PsFT and PsAP1 were induced by the 5-azaC and GA treatments at 7 and 14 d, with a greater effect on PsAP1 in the GA treatment group at 7 d (Figure 3B,C). PsSVP expression continuously decreased in the control group, whereas the 5-azaC and GA treatments intensified and reduced this decrease, respectively, at 7 d (Figure 3D). PsSOC1 expression in the control group also decreased continuously, with an intensified effect of the GA treatment at 7 d (Figure 3E). The expression of PsLFY showed a single peak curve and peaked at 7 d in all groups, with the lowest level in the GA treatment group (Figure 3F). In the GA pathway, the expression of PsGID1c continuously increased in the control group; both the 5-azaC and GA treatments inhibited this increase, with the latter having a greater effect from 7 d (Figure 3G). The 5-azaC treatment had a limited effect on PsGAI expression, whereas the GA treatment reduced the expression from 7 d to 21 d (Figure 3H). Interestingly, similar to GA biosynthesis, little superposition effect was detected in all of the gene expressions in the A + G treatment group.

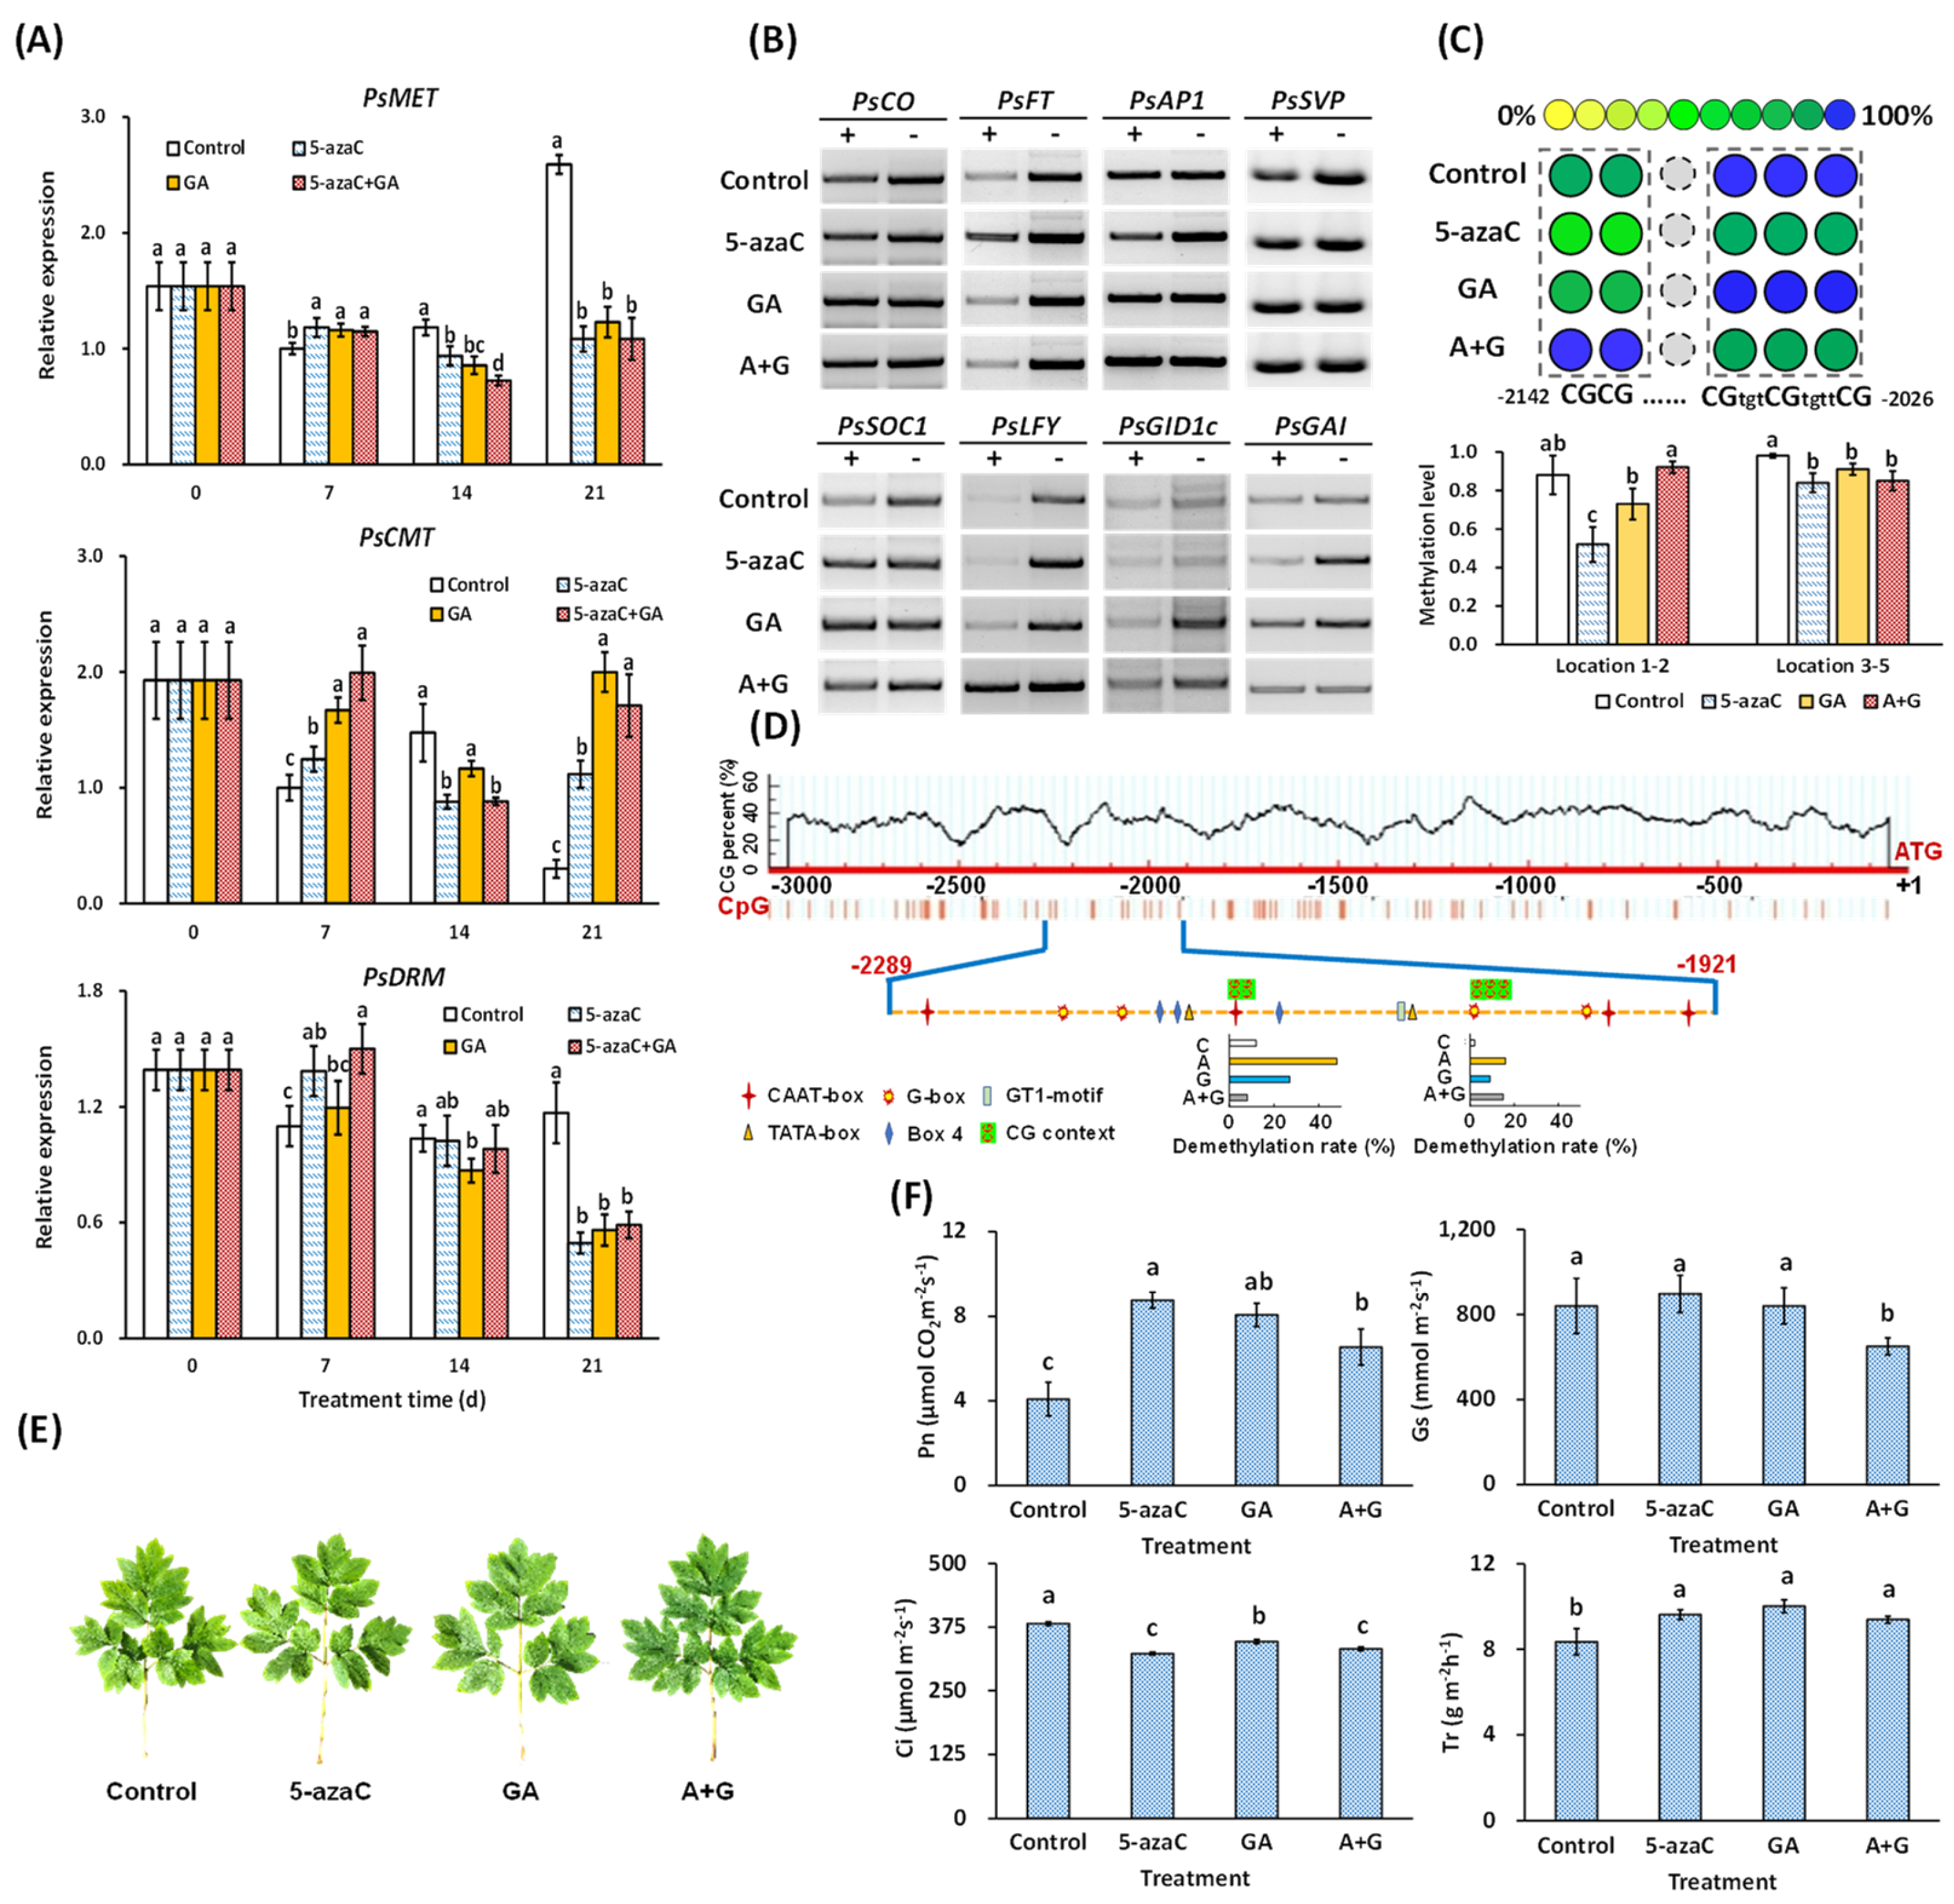
2.4. Effects of 5-azaC and GA Treatments on DNA Demethylation-Induced Flowering in Tree Peony

According to our results, the 5-azaC, GA, and A + G treatments induced PsMET expression in buds at 7 d but inhibited this increase at 21 d. PsCMT expression was also induced by all three treatments but to a lesser extent by the 5-azaC treatment at 7 d. PsDRM expression in the 5-azaC and A + G treatment groups remained at a high level at 7 d, and GA treatment reduced it to a similar level as that in the control at 7 d, with a further decrease at 14 d (Figure 4A).
We then measured the DNA methylation levels in the promoters of the eight flowering-pathway genes at 7 d (Figure S2). The results showed that the 5-azaC and GA treatments significantly reduced DNA methylation in the PsFT and PsGAI promoters, respectively, and GA also slightly reduced DNA methylation in the promoter of PsLFY (Figure 4B). We further screened the demethylation sites and identified five CG contexts in a 369 bp CG-rich segment in the PsFT promoter whose methylation levels were significantly reduced by the 5-azaC treatment at 7 d (Figure 4C). We predicted 14 cis-elements in this 369 bp segment, and interestingly, 8 of them were light-response related, including 4 G-boxes, 3 Box 4, and 1 GT1-motif element (Figure 4D); thus, we further measured the photosynthesis in the leaves of the four groups. Although no obvious morphological differences were observed in the leaves (Figure 4E and Figure S1B), both the 5-azaC and GA treatments increased the Pn and Tr levels, whereas the level of Gs was not affected by either treatment. In addition, both treatments decreased the Ci level with a stronger effect by the 5-azaC treatment (Figure 4F).

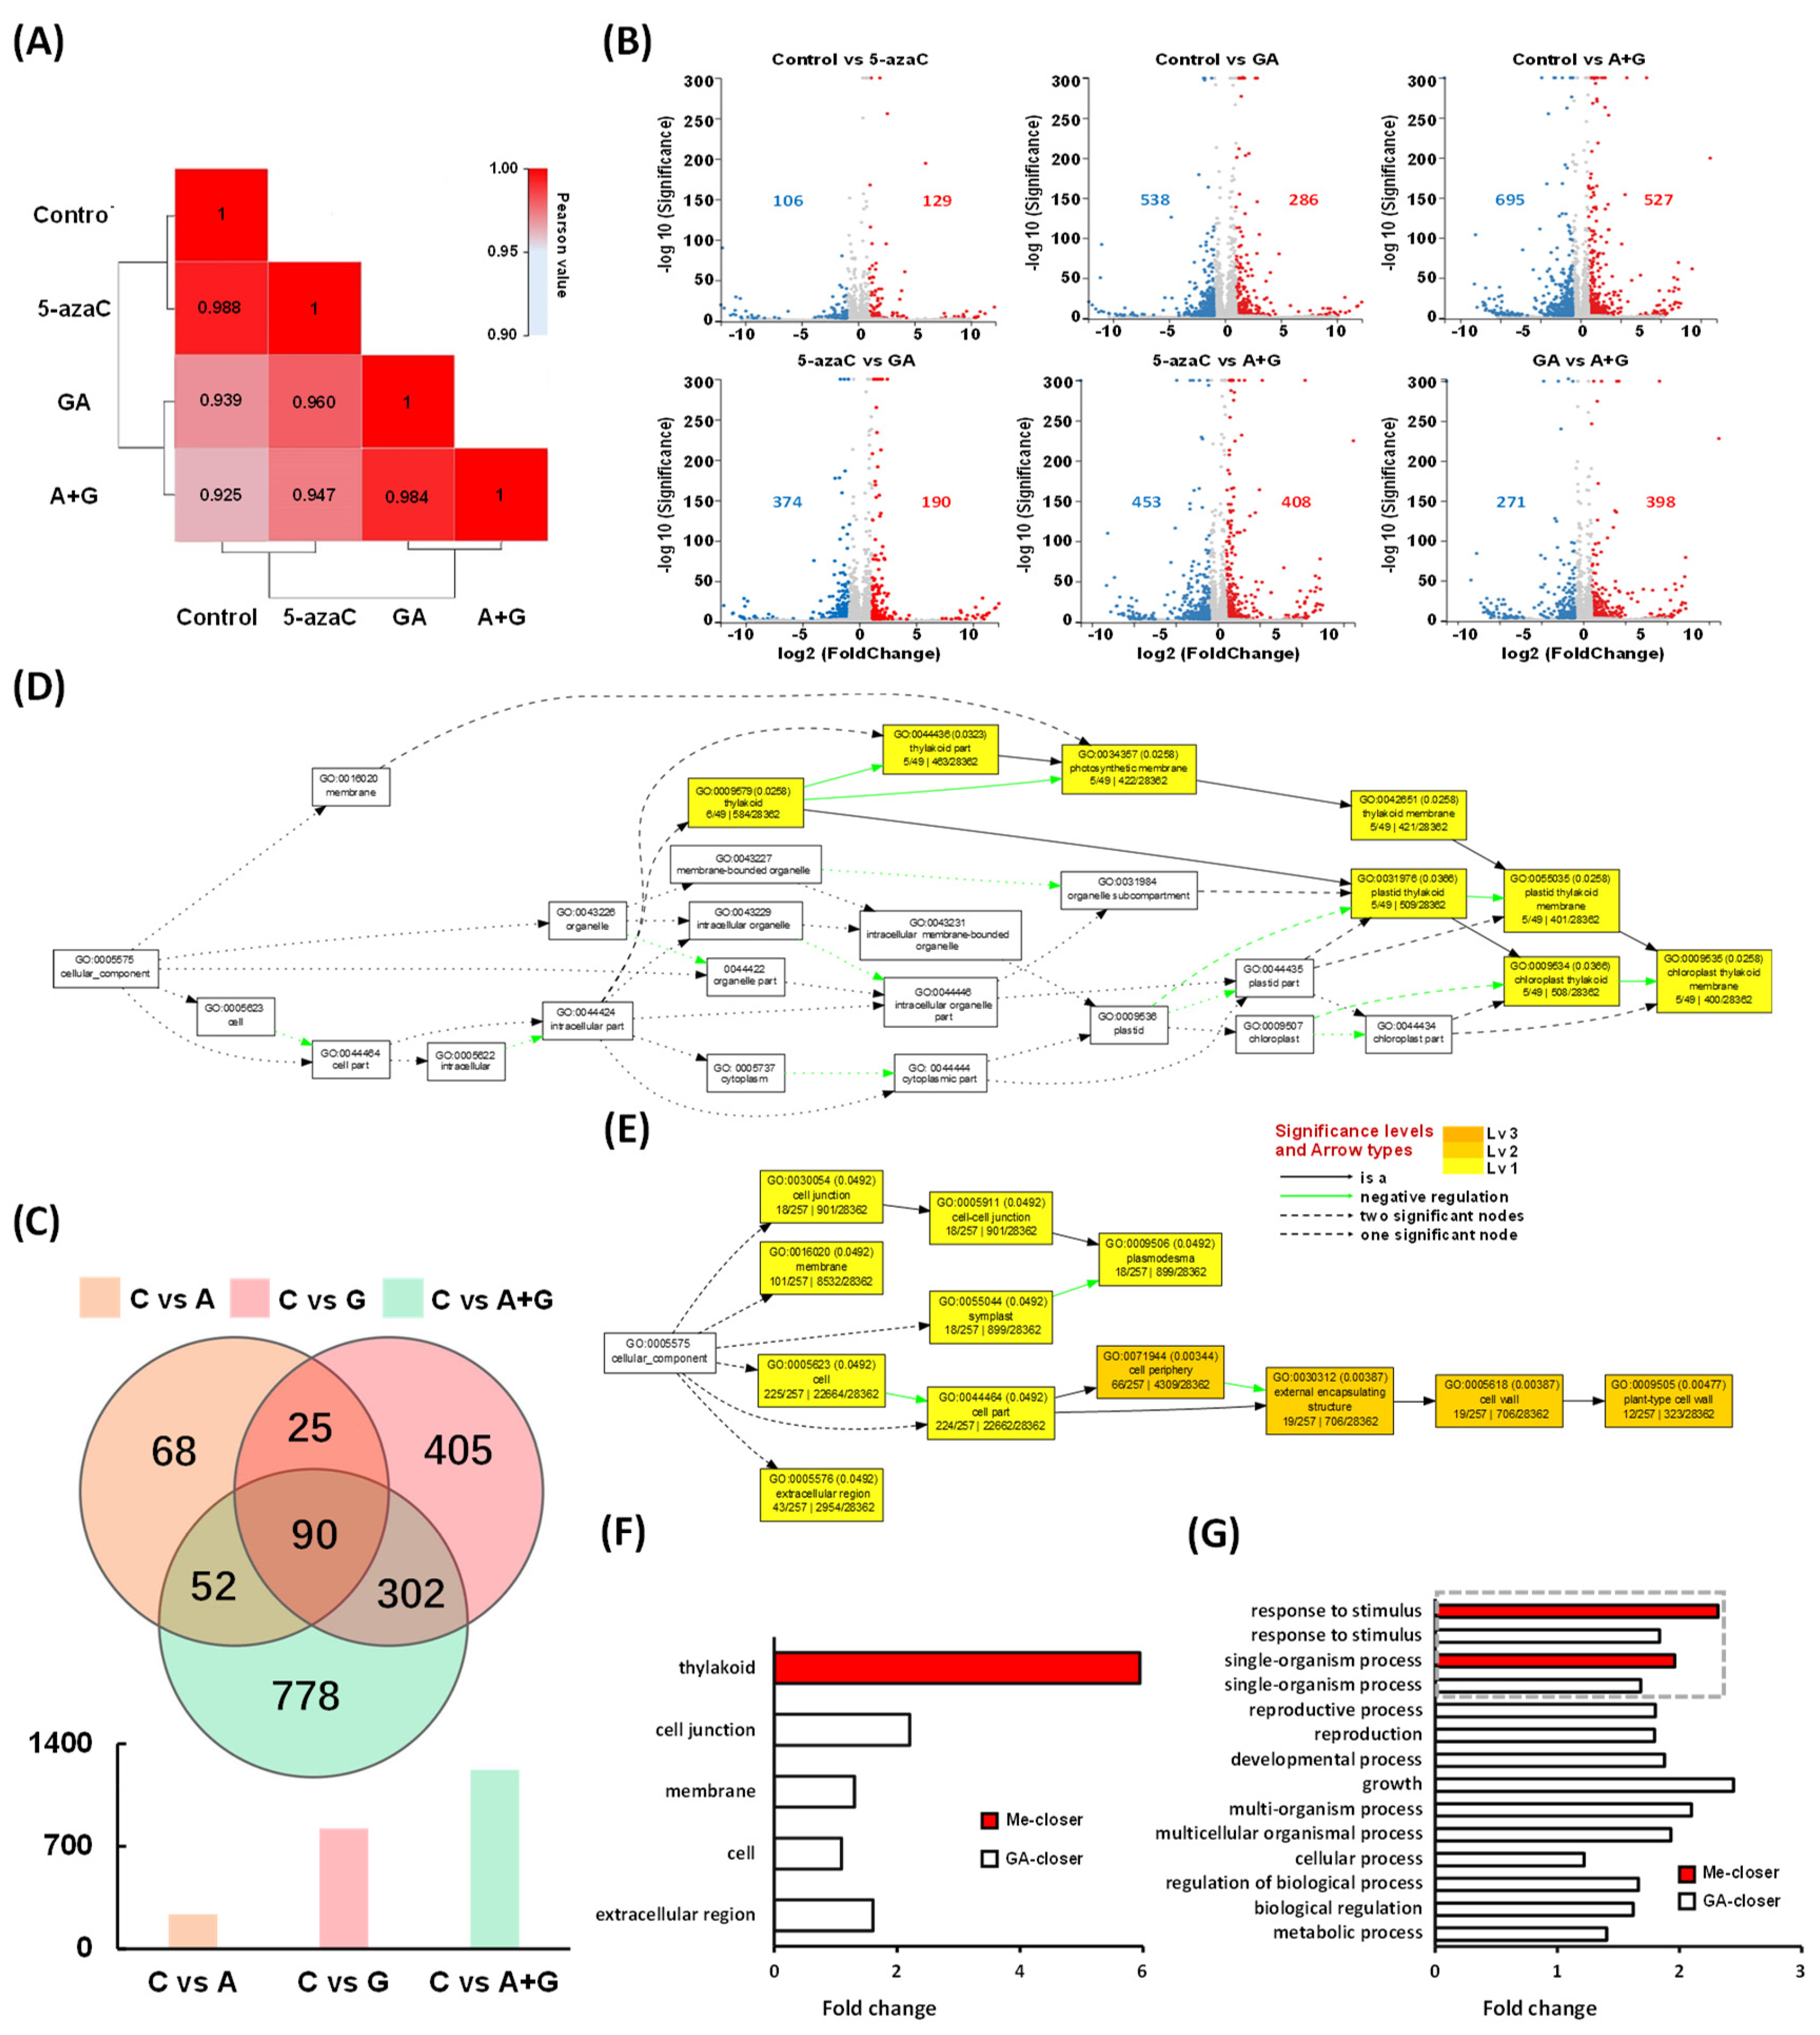
2.5. Transcriptome Data Analysis

To explore more potential regulatory factors or patterns during the flowering process, we performed transcriptome sequencing and obtained 19,746 genes. Among them, 15,889 genes were shared among all four groups with each group having a very similar gene quantity (Figure S3). The Pearson correlation heatmap of gene expression showed that the 5-azaC treatment had the highest ecoefficiency compared with the control, followed by the GA and A + G treatments (Figure 5A). We also compared the DEG patterns through pairwise comparison in different groups. The results showed that the 5-azaC treatment group had more upregulated genes than that of downregulated ones compared to other three groups, respectively, whereas the GA treatment had the opposite pattern to 5-azaC, which had more downregulated genes compared to other three treatments (Figure 5B). We further analyzed the DEG distribution in the control vs. 5-azaC, control vs. GA, and control vs. A + G treatment group. We obtained 235, 822, and 1222 DEGs, respectively. Among them, a total of 52 DEGs, including the overlap of the control vs. 5-azaC and control vs. A + G, but excluding the control vs. GA, were identified and were considered to be methylation-closer DEGs; by the same strategy, another 302 GA-closer DEGs were also identified (Figure 5C and Figure S4; Tables S1 and S2).
For the function category, we mapped the methylation- and GA-closer DEGs to the Arabidopsis GO enrichment pathway trees of the cellular component and biological process, respectively. In the cellular component, all methylation-closer DEGs were located in the thylakoid, whereas GA-closer DEGs were distributed in the cell junction, membrane, cell, and extracellular region (Figure 5D–F). Concerning the biological process, the methylation-closer DEGs were focused on the response to stimulus and single-organism process, whereas GA-closer DEGs were distributed more extensively and complexly with a total of 12 categories, including various processes and regulations as well as two categories related to methylation-closer DEGs, and among them, growth had the highest fold change compared to Arabidopsis (Figures S5 and S6 and Figure 5G).

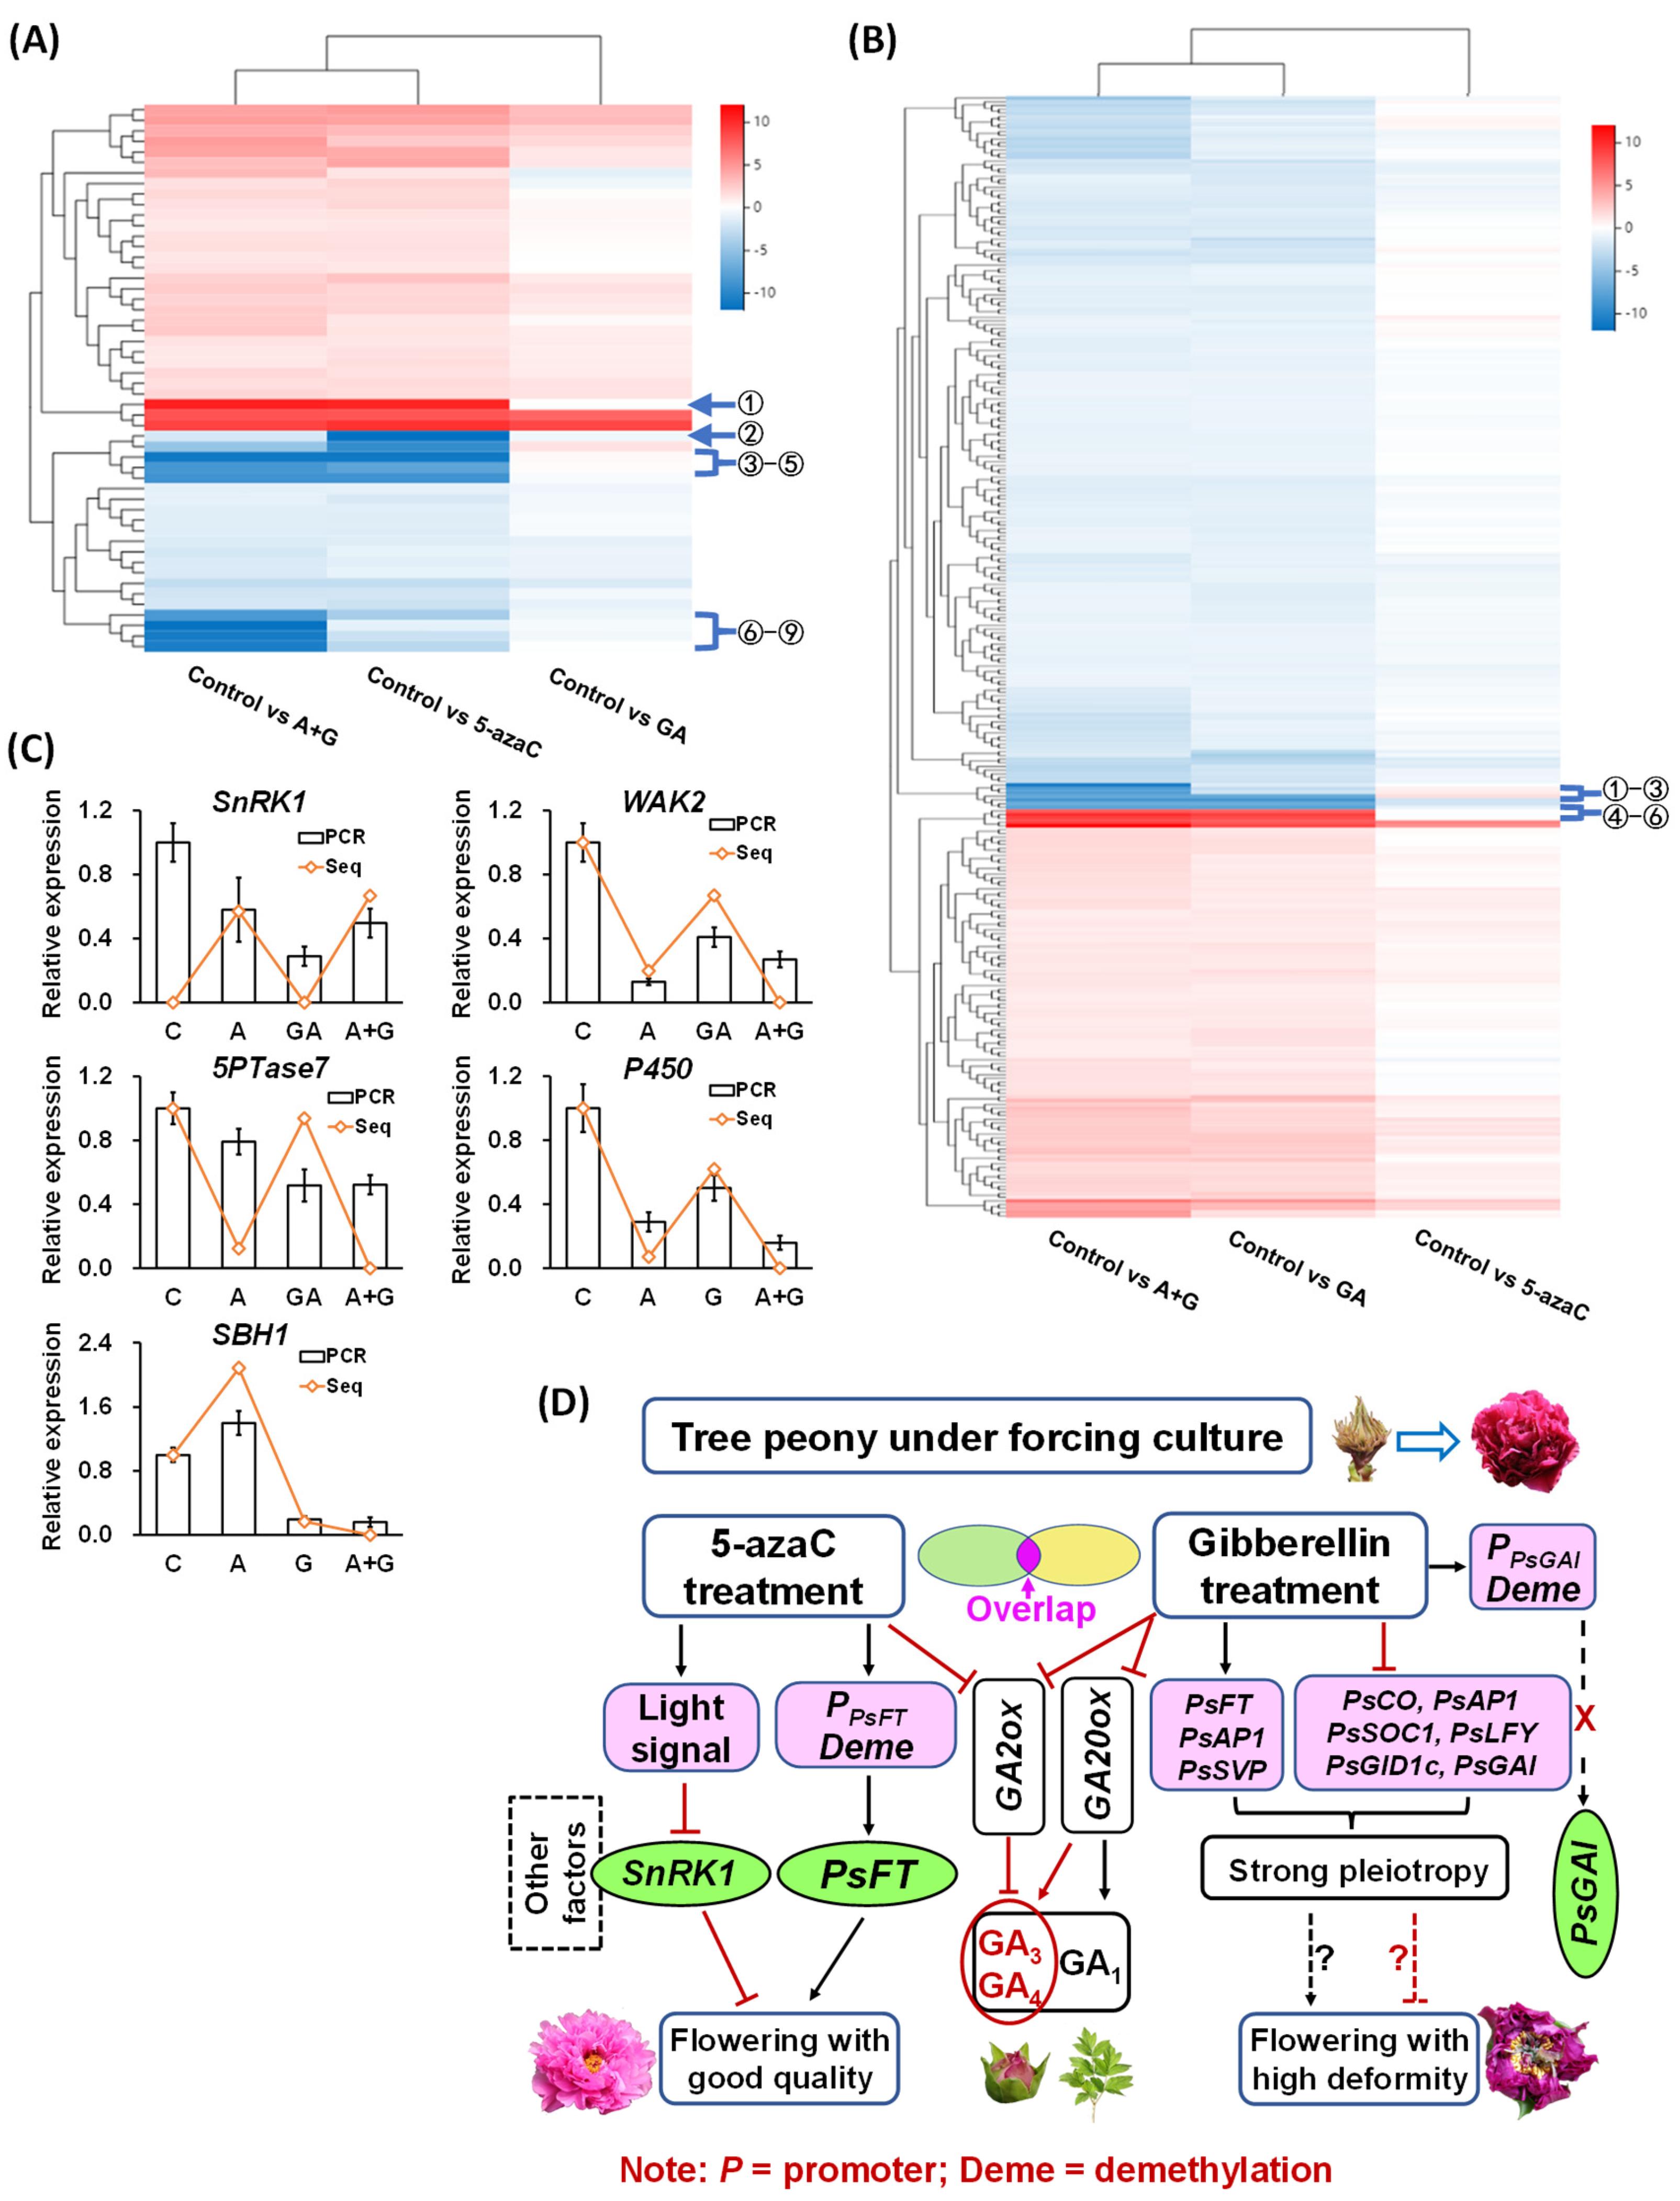
2.6. Correlation of Different DEGs and Identification of Potential Regulatory Genes

We constructed heatmaps of the methylation- and GA-closer DEGs according to their expression patterns. The methylation-closer DEGs had greater diversity than the GA-closer DEGs. In addition, about two-thirds of the methylation-closer DEGs were upregulated by 5-azaC treatment, and a similar proportion of GA-closer DEGs was downregulated by GA treatment (Figure 6A,B). We further chose nine and six genes with larger differences from the respective methylation- and GA-closer DEGs according to their heatmaps. Through function prediction, we mapped five candidate genes with potential flowering regulation, including three kinases, SNF1-related protein kinase1 (SnRK1), wall-associated receptor kinase2 (WAK2), and Type IV inositol polyphosphate 5-phosphatase7 (5PTase7), and two bioactive enzymes, cytochrome P450 and Sphingoid base hydroxylase1 (SBH1). The first four genes are methylation-closer DEGs and the last one is a GA-closer DEG. We then revalidated their expression by RT-qPCR and found that all four methylation-closer DEGs were reduced by both the 5-azaC and GA treatments at different levels, whereas the expression of SBH1 was induced and reduced by 5-azaC and GA treatment, respectively (Figure 6C).

2.7. Construction of the Potential Network Involved in Tree Peony Flowering Regulation

Based on these results, we constructed a potential network of DNA demethylation and GA-induced tree peony flowering. In this network, 5-azaC treatment rapidly induced PsFT expression by reducing its methylation level in the promoter region, thus initiating the flowering process. In addition, eight light-responsive related cis-elements were identified in the PsFT promoter, and all methylation-closer DEGs were located in the thylakoid, which is the main site of photosynthesis. Based on these results and the fact that the 5-azaC treatment increased the photosynthetic efficiency of tree peony leaves, we suggest that 5-azaC may partially undertake or replace the function of the light signal, which regulates other kinases and bioactive enzymes, such as SnRK1 and cytochrome P450, to induce tree peony flowering with good quality under forcing culture conditions. By contrast, GA treatment regulated a large number of flowering-pathway genes with strong pleiotropy, and GA-closer DEGs were also widely distributed in- and outside the cells and were associates with various processes and stimuli, which may result in flowers with a high level of deformity. In addition, the 5-azaC and GA treatments may induce tree peony flowering with limited synergism since no superposition effect on GA production or flowering-pathway gene expression was detected in the A + G treatment group, and limited overlap of GO tree categories was found between methylation- and GA-closer DEGs (Figure 6D).

3. Discussion

In plants, DNA methylation negatively regulates the flowering process, which is mainly associated with the photoperiod pathway. It was reported that 5-azaC induced flower opening in the long-day plant Silene armeria and short-day plant Perilla frutescens under non-inductive photoperiodic conditions [28]. Similarly, GA positively affects the flowering time in a range of species, and in Arabidopsis, GA is essential for floral induction under unsuitable photoperiods [29]. In our study, both the 5-azaC and GA treatments induced tree peony flowering, with a limited synergistic effect of the A + G group, indicating that DNA demethylation and GA may have individual roles in inducing tree peony flowering (Figure 1). In addition, a moderate GA concentration is very important for its function. We earlier observed that inappropriate GA supplementation readily caused tree peony flower deformity (data not shown). In the current results, GA treatment resulted in a higher rate of deformity than the 5-azaC treatment, which further affected the ornamental value partially due to the reduced petal number and area (Figure 2A,B). Thus, we suggest DNA demethylation could be a preferable regulation approach for tree peony forcing culture, although the flowering rate still needs to be improved.
GA regulation is associated with numerous and diverse intermediates as well as bioactive GAs. In Arabidopsis, GA4 is physiologically more active than GA1 and is more involved in the flowering process. In rice, GA1 and GA4 dominate during vegetative and flowering development, respectively [4], whereas in tree peony, GA3 is superior to GA4 in promoting bud endodormancy release under forcing culture conditions [30]. In Arabidopsis, overexpression of GA20ox induced GA production, whereas GA3 applied to a GA-deficient mutant increased GA2ox1 and GA2ox2 expression but decreased GA20ox2 and GA3ox1 expression, indicating both positive and negative feedback occurred in GA biosynthesis [4]. In addition, GA2ox2 also negatively regulated seed germination and root growth in response to environmental factors [31]. In our results, GA treatment induced the production of GA1, GA3, and GA4, which also rapidly inhibited the expression of PsGA20ox and PsGA2ox, whereas the 5-azaC treatment only induced GA3 and GA4 production together with a faster inhibition of PsGA2ox expression (Figure 2E–H). These results indicated that DNA demethylation may be more focused on flowering regulation, accompanied by the deactivation of synthesized GAs by PsGA2ox. Interestingly, GA3 is normally metabolized much lower than GA1 and GA4; thus, endogenous GA3 content is accumulated at very low levels and rarely detected in plants [32], but in our results, GA treatment dramatically induced the GA3 production in buds (Figure 2E). Since we applied GA3 for GA treatment (as well as A + G), the inducing of GA3 may be partially due to exogenous GA3, which should be carefully considered in our future work.
For most perennial temperate plants, flowering at the appropriate seasonal time is crucial for their annual cycling. During this process, various signals are integrated and function in multiple intersecting pathways with pleiotropic gene regulation. In aspen (Populus trichocarpa), the flowering timing is controlled by a CO/FT regulon in the photoperiod pathway, and PtCO2 induces PtFT1, which then results in flower opening [33]. In chrysanthemum, GA signaling predominates long-day flowering with the up- and downregulation of GID1 and GAI, respectively, thereby inducing the expression of SOC1 and LFY [34]. In grapefruit (Citrus paradist Macf.), overexpression of CsAP1 significantly shortens the flowering time, and CsLFY overexpression further shortens this period [35]. In our results, all of the detected flowering-pathway genes were rapidly induced or reduced by GA treatment at 7 d, including PsFT, which was not considered to be involved in the GA pathway [13] (Figure 3), indicating that GA has multiple and probably overlapping functions in regulating tree peony flowering.
In plants, 5-azaC inhibits DNA methyl transferase activity, and demethylation occurs globally on the genome after cell divisions [18]. Especially, DNA methylation regulated flower opening by affecting the related gene expression via demethylating the related promoter region. In Arabidopsis, DNA methylation in the FT promoter reduced its expression, and as a result, delayed the flowering process [22]. In wheat, disruption of DNA methylation in the TaFT1 promoter also changed its flowering time [23]. In papaya, early flowering was associated with the gene-specific demethylation of CpSVP and CpAP1 [25]. In potato (Solanum tuberosum L.), DNA demethylation induced photoperiod- and GA-pathway-related gene expression and then promoted tube initiation, which was similar to flowering regulation [36]. In our results, among the eight flowering-pathway-related genes, only PsFT was rapidly and intensely induced by 5-azaC treatment at 7 d, and its promoter was also significantly demethylated at 7 d with five related CG contexts being identified (Figure 3 and Figure 4). These findings indicate that PsFT may play a core role in DNA demethylation-induced tree peony flowering. In addition, we identified eight light-response-related cis-elements in the tested PsFT promoter segment, and 5-azaC enhanced the photosynthetic efficiency by increasing Pn and Tr in leaves (Figure 4D,F). In addition, GO enrichment analysis of cellular components indicated that all the Me-closer DEGs were located in the thylakoid, which is the main site for photosynthetic reactions. These results further indicated that 5-azaC may partially function as light or photoperiodic signal to induce PsFT expression as well as the flowering process.
In addition to flowering-pathway genes, DNA methylation also modulated numerous other genes with spatiotemporal expression during flowering regulation. In Arabidopsis, DNA methylation regulates flower opening in a complex manner, which has been correlated with more than 3000 DEGs [18]. In rice, DNA demethylation is critical for its reproductive development, and in a DNA hypermethylation mutant, 3898 downregulated and 2716 upregulated genes were identified [37]. In tree peony, 5-azaC treatment accelerated bud dormancy release, and more than 1800 DEGs were identified during this process [38]. In addition, DNA methylation regulates plant development in distinct ways among different genotypes, tissues, and other factors. In potato, photoperiod-sensitive and -insensitive genotypes had their own independent DNA methylation modes and shared a few differentially methylated genes [36]. In Taihangia rupestris, the DNA methylation patterns varied in staminate and perfect flowers [39]. According to our results, among the four groups, the 5-azaC and GA treatments had the highest number of up- and downregulated genes, respectively (Figure 5B). We also found that the GO cellular component and biological process categories shared no or very few DEGs between the 5-azaC and GA treatments (Figure 5F,G), thus providing more evidence for our suggestion that the mechanism through which these two treatments regulate tree peony flowering may vary.
According to the hierarchical clustering analysis of methylation- and GA-closer DEGs, we further mapped five potential flowering regulatory genes. Among them, SnRK1 is involved in sugar signaling for negative regulation of tree peony flowering as we reported previously [40]; WAK2 is a serine/threonine-protein kinase and may function in regulating cell expansion, morphogenesis, and development [41]; 5PTase7, a member of a large family of 5Ptase enzymes, acts in coordinating plant responses to different stresses [42]; cytochrome P450 is involved in many processes of plant primary metabolites, such as GA biosynthesis [43]; and SBH1 regulates the transformation from vegetative to reproductive stages, and the loss-of-function mutant fails to complete this transformation, accompanied by the induced expression of programmed cell death-associated genes [44]. These findings indicate that tree peony flowering regulation is a complex and multifactor-regulated process and can provide more ideas for supplementing our potential network (Figure 6D).

4. Conclusions

In this study, 5-azaC treatment regulated tree peony flowering with a low deformity rate by rapid induction of PsFT expression through a reduction in its methylation level in the promoter region, and eight light-responsive related cis-elements were predicted in a 369 bp CG-rich segment of this promoter. In addition, 5-azaC treatment enhanced the photosynthetic efficiency in leaves, and all of the methylation-closer DEGs were located in thylakoid, the main site for photosynthesis. Thus, we suggested that 5-azaC may partially undertake or replace the function of the light signal to induce tree peony flowering. Furthermore, we constructed a potential regulatory network for tree peony flowering, which may provide some new ideas for improving tree peony forcing culture technology.

5. Experimental Procedures

5.1. Plant Materials, Growth Conditions, and Sample Collection

In this study, the 5-year-old adult tree peony (P. suffruticosa Andr.) ‘Luo Yang Hong’ was used as a material, which was grown in the experimental field of the Chinese Academy of Agricultural Sciences, Beijing, China. All of the plants were placed in plastic pots (40 cm × 40 cm) immediately after being dug from the ground in mid-September and were then transferred into a greenhouse in early December for forcing culture. The experiment was repeated for 2 years, and in each year, a total of 100 plants with similar growth and health conditions were randomly selected and divided into four groups (25 plants for each group) for further use.
(1)
Control group: the plants were placed in a regular forcing culture environment with conventional water and fertilizer management according to [45]. The environmental condition is shown in Figure S7.
(2)
5-azaC treatment group: all buds were supplied with 5-azaC (100 μmol L−1, biological reagent grade, Shanghai Yuanye Bio-Technology Co., Ltd., Shanghai, China) 14, 16, and 18 d after the plants were transferred into the greenhouse.
(3)
GA treatment group: all buds were supplied with GA3 (600 mg L−1, analytical grade, Beijing Chemical Reagent Co., Ltd., Beijing, China) at the same time as the 5-azaC treatment group.
(4)
A + G treatment group: all buds were supplied with 5-azaC and GA3 at the same concentrations and times described above, and the processing interval was 2 h with 5-azaC as the first treatment.
All of the treatments were applied in the morning of a sunny day with the same management and environment as those in the control group. The first day of 5-azaC treatment was set as 0 d.

5.2. Observation of Morphological Changes

Ten buds from each group (one bud per plant) were randomly selected for the flowering process, which was recorded photographically at 0, 7, 14, 28, and 42 d, and all buds were used for flowering quality assessment at 28 d based on the following standards: (1) No flower: the bud stops to enlarge with no color showing; (2) Normal: the outer petals are tightly wrapped with the normal color showing; (3) Mal I: the top part of the outer petals is slightly expanded with a few anthers showing among the petals; (4) Mal II: the outer petals are half expanded with an irregular shape, more anthers can be seen, and the stigmas are still beneath the petals; (5) Mal III: most of the petals are expanded with an irregular shape, and both anthers and stigmas are almost completely exposed.
The histological observation of buds was through a Leica Microsystems DM5500B microscope (Wetzlar, Germany), and the micro-sections of the buds were prepared using a rotary microtome (RM2255, Leica, Germany). The Cold Field-Emission Scanning Electron Microscope (SEM) observation of starch grains was through a Hitachi SU-8010 SEM (Tokyo, Japan), and the sample preparation was according to the standard protocols. The CIE-LAB color parameters were measured using a Konica Minolta chromameter (CR-400; Minolta Co., Ltd., Osaka, Japan). The color parameters l (100 means white, 0 means black), a (redness (+) and greenness (−)_, and b (yellowness (+) and blueness (−)) were determined in the CIE Lab space under the illuminant D65/10 °C. ΔE indicates the total color difference.
The number of starch grains was calculated by ImageJ software (1.52a, National Institutes of Health, Bethesda, MD, USA), and the petal and leaf areas were measured using Plant Image Analyzer software (LA-S, Hangzhou Wanshen Testing Technology Co., Ltd., Hangzhou, China).

5.3. Measurement of Chlorophyll, GA Contents, and Photosynthetic Gas Exchange

For chlorophyll content measurement, the third leaf from the top of the plant was measured using a portable chlorophyll meter (TYS-B, Zhejiang Top Cloud-agri Technology Co., Ltd., Hangzhou, China) at 28 d. For GA content measurement, the pestle sample of buds without bracts at 14 d was dissolved in ACN/H2O (90:10, v/v), and an internal standard mixed solution was added. After centrifugation and the addition of triethylamine and 3-bromopropyltrimethylammonium bromide, the supernatant was incubated at 90 °C for 1 h and then evaporated to dryness. Then, the supernatant was redissolved in ACN/H2O and filtered for further UPLC-ESI-MS/MS (UPLC, ExionLC™ AD; MS, Applied Biosystems 6500 Triple Quadrupole) analysis based on the manufacturer’s instructions, and GA contents were detected by MetWare based on the AB Sciex QTRAP 6500 LC-MS/MS platform (Shanghai Ab Sciex Analytical Instrument Trading Co., Ltd., Shanghai, China).
Photosynthetic gas exchange was measured using the third leaf each plant at 28 d from 9:00 to 11:00 am; the net photosynthetic rate (Pn), stomatic conductance (Gs), intercellular CO2 concentration (Ci), and transpiration rate (Tr) were measured using a CIRAS-3 portable photosynthesis system (PP Systems, Amesbury, MA, USA) under ambient CO2 concentrations (380–420 μmol·mol−1, chemicals removed) at 25 °C, 1200 μmol (photon) m−2 s−1 light (90% red light and 10% blue light), and 80% relative humidity.

5.4. RNA Isolation and RT-qPCR Testing

The total RNA was isolated from flower buds using an RNA prep Pure Plant Kit (Aidlab, Beijing, China), and its quality and quantify were assessed by 1.2% agarose electrophoresis and NanoDrop 2000c spectrophotometer (Thermo Scientific, Waltham, MA, USA), respectively. The primers for RT-qPCR were designed using Primer 5.0 software. The relative gene expression was calculated by a double standard curve according to the CFX96 Real-Time system (Bio-Rad, Irvine, CA, USA). Actin was used as the reference gene, and the 2−ΔΔCt method was used for relative gene expression data analysis [46]. The primer and gene information are shown in Table S3.

5.5. Measurement of the DNA Methylation Level

For McrBC-PCR, the genomic DNA extracted from buds at 7 d was digested with McrBC (New England Biolabs Inc., Ipswich, MA, USA) according to the manufacturer’s recommendations for 4 h at 37 °C; the same reaction without GTP was used as a negative control. PCR was performed using 20 ng McrBC-treated DNA. The thermal cycling conditions were: 95 °C for 5 min followed by 28–30 cycles of 30 s at 95 °C, 30 s at 55–61 °C and 70 s at 72 °C, and finally 10 min at 72 °C. The primer sequences are listed in Table S3.
For MassARRAY analysis, bisulfite conversion of genomic DNA from the buds at 7 d was performed using the EZ DNA Methylation Kit (Zymo Research, Irvine, CA, USA) according to the instruction manual. Quantitative methylation analysis of bisulfite-treated genomic DNA was conducted through Agena’s MassARRAY EpiTYPER system (Agena Bioscience, San Diego, CA, USA). The mass spectra were obtained by MassARRAY MALDI-TOF-MS and analyzed by EpiTYPERTM software. Duplicate independent analyses of each bisulfite-treated sample were performed. Data of poor quality for the quantitative methylation detection of each CG site were excluded. The primer sequences are listed in Table S3.

5.6. Data Analysis and cis-Element Prediction

All of the experimental data were analyzed using SAS 9.4 (SAS Inc., Cary, NC, USA) and OriginPro 2019b (OriginLab Software Inc., Northampton, MA, USA) software. Differences in morphological, physiological, and gene expression characteristics were analyzed using one-way ANOVA with post hoc Duncan’s tests. p values ≤0.05 were considered to be statistically significant. The cis-elements on the gene promoter were predicted by PlantCARE [47].

5.7. Transcriptome Sequencing and Bioinformatics Analysis

Total RNA was extracted from the buds at 14 d and purified to mRNA by Oligo (dT)-attached magnetic beads. Single-stranded circular DNA was formatted as the final library, which was sequenced, generating 100 bp paired-end reads on the BGIseq500 platform (BGI-Shenzhen, China). The raw transcriptome data were deposited in the NGDC database (CRA006504, accessed on 31 March 2022, https://ngdc.cncb.ac.cn). The sequencing data were filtered with SOAPnuke (v1.5.2), and clean reads were mapped to the reference genome using HISAT2 (v2.0.4) [48]. Pearson’s correlations of all gene expression levels between different groups were analyzed by a heatmap according to their coefficients. The up- or downregulation of different genes between groups was presented using volcanic scatter plots. The crossing and overlapping of differentially expressed genes (DEGs) between different groups were shown in a Venn diagram. The Gene Ontology (GO) enrichment pathways of tree peony based on the gene function in Arabidopsis were constructed through agriGOv2 [49], and the fold change in different terms = (number of DEGs with a specific function in tree peony/number of total DEGs analyzed in tree peony)/(number of genes with a specific function in Arabidopsis/number of total genes in Arabidopsis). The heatmaps of selected DEGs were drawn by Pheatmap (v1.0.8), and the differential expression analysis was performed using PossionDis with a false discovery rate (FDR) ≤0.001 and |Log2Ratio| ≥1. The revalidation of candidate gene expression was performed using RT-qPCR, and the primer sequences are listed in Table S3.

Supplementary Materials

The following supporting information can be downloaded at: https://www.mdpi.com/article/10.3390/ijms23126632/s1.

Author Contributions

J.X. and X.Z. designed the research; K.S., Y.X. and S.W. performed the experiments; T.M., C.T. and Y.W. analyzed the data; Z.P. and J.X. wrote the paper. All authors have read and agreed to the published version of the manuscript.

Funding

This research was funded by the National Key R&D Program of China (2021YFE0110700), Ministry of Science and Technology of the Republic of Serbia (451-03-1202/2021-09), the Natural Science Foundation of China (31972455, 31972440), and Fundamental Research Funds for Chinese Academy of Agricultural Sciences (Y2022XK17).

Institutional Review Board Statement

Not applicable.

Informed Consent Statement

Not applicable.

Data Availability Statement

The data used to support the findings of this study are available from the corresponding authors upon request.

Conflicts of Interest

The authors declare no conflict of interest.

References

  1. Xue, Y.Q.; Liu, R.; Xue, J.Q.; Wang, S.L.; Zhang, X.X. Genetic diversity and relatedness analysis of nine wild species of tree peony based on simple sequence repeats markers. Hortic. Plant J. 2021, 7, 579–588. [Google Scholar] [CrossRef]
  2. Li, J.; Zhang, X.; Zhao, X. Tree Peony of China; Encyclopedia of China Publishing House: Beijing, China, 2011. [Google Scholar]
  3. Xin, H.; Zhang, Y.X.; Wang, X.T.; Liu, C.Y.; Feng, W.R.; Gai, S.P. Morphological, anatomical and DNA methylation changes of tree peony buds during chilling induced dormancy release. Plant Physiol. Biochem. 2019, 144, 64–72. [Google Scholar] [CrossRef] [PubMed]
  4. Lange, M.J.P.; Lange, T. Gibberellin biosynthesis and the regulation of plant development. Plant Biol. 2006, 8, 281–290. [Google Scholar] [CrossRef] [PubMed]
  5. Wu, K.; Xu, H.; Gao, X.H.; Fu, X.D. New insights into gibberellin signaling in regulating plant growth-metabolic coordination. Curr. Opin. Plant Biol. 2021, 63, 102074. [Google Scholar] [CrossRef] [PubMed]
  6. Hedden, P.; Sponsel, V. A Century of Gibberellin Research. J. Plant Growth Regul. 2015, 34, 740–760. [Google Scholar] [CrossRef] [Green Version]
  7. Katyayini, N.U.; Rinne, P.L.H.; Tarkowska, D.; Strnad, M.; van der Schoot, C. Dual Role of Gibberellin in Perennial Shoot Branching: Inhibition and Activation. Front. Plant Sci. 2020, 11, 736. [Google Scholar] [CrossRef] [PubMed]
  8. Auge, G.A.; Penfield, S.; Donohue, K. Pleiotropy in developmental regulation by flowering-pathway genes: Is it an evolutionary constraint? New Phytol. 2019, 224, 55–70. [Google Scholar] [CrossRef] [PubMed] [Green Version]
  9. Andres, F.; Coupland, G. The genetic basis of flowering responses to seasonal cues. Nat. Rev. Genet. 2012, 13, 627–639. [Google Scholar] [CrossRef]
  10. Samach, A.; Onouchi, H.; Gold, S.E.; Ditta, G.S.; Schwarz-Sommer, Z.; Yanofsky, M.F.; Coupland, G. Distinct roles of CONSTANS target genes in reproductive development of Arabidopsis. Science 2000, 288, 1613–1616. [Google Scholar] [CrossRef] [Green Version]
  11. Lee, J.; Oh, M.; Park, H.; Lee, I. SOC1 translocated to the nucleus by interaction with AGL24 directly regulates LEAFY. Plant J. 2008, 55, 832–843. [Google Scholar] [CrossRef]
  12. Wellmer, F.; Riechmann, J.L. Gene networks controlling the initiation of flower development. Trends Genet. 2010, 26, 519–527. [Google Scholar] [CrossRef] [PubMed]
  13. Conti, L. Hormonal control of the floral transition: Can one catch them all? Dev. Biol. 2017, 430, 288–301. [Google Scholar] [CrossRef] [PubMed]
  14. Bartels, A.; Han, Q.; Nair, P.; Stacey, L.; Gaynier, H.; Mosley, M.; Huang, Q.Q.; Pearson, J.K.; Hsieh, T.-F.; An, Y.-Q.C.; et al. Dynamic DNA Methylation in Plant Growth and Development. Int. J. Mol. Sci. 2018, 19, 2144. [Google Scholar] [CrossRef] [PubMed] [Green Version]
  15. Huang, H.; Liu, R.E.; Niu, Q.F.; Tang, K.; Zhang, B.; Zhang, H.; Chen, K.S.; Zhu, J.K.; Lang, Z.B. Global increase in DNA methylation during orange fruit development and ripening. Proc. Natl. Acad. Sci. USA 2019, 116, 1430–1436. [Google Scholar] [CrossRef] [PubMed] [Green Version]
  16. Meng, F.R.; Li, Y.C.; Yin, J.; Liu, H.; Chen, X.J.; Ni, Z.F.; Sun, Q.X. Analysis of DNA methylation during the germination of wheat seeds. Biol. Plant. 2012, 56, 269–275. [Google Scholar] [CrossRef]
  17. Song, Q.X.; Zhang, T.Z.; Stelly, D.M.; Chen, Z.J. Epigenomic and functional analyses reveal roles of epialleles in the loss of photoperiod sensitivity during domestication of allotetraploid cottons. Genome Biol. 2017, 18, 99. [Google Scholar] [CrossRef]
  18. Yang, H.X.; Chang, F.; You, C.J.; Cui, J.; Zhu, G.F.; Wang, L.; Zheng, Y.; Qi, J.; Ma, H. Whole-genome DNA methylation patterns and complex associations with gene structure and expression during flower development in Arabidopsis. Plant J. 2015, 81, 268–281. [Google Scholar] [CrossRef] [PubMed]
  19. Kong, X.F.; Hong, Y.C.; Hsu, Y.F.; Huang, H.; Liu, X.; Song, Z.; Zhu, J.K. SIZ1-Mediated SUMOylation of ROS1 Enhances Its Stability and Positively Regulates Active DNA Demethylation in Arabidopsis. Mol. Plant 2020, 13, 1816–1824. [Google Scholar] [CrossRef]
  20. Law, J.A.; Jacobsen, S.E. Establishing, maintaining and modifying DNA methylation patterns in plants and animals. Nat. Rev. Genet. 2010, 11, 204–220. [Google Scholar] [CrossRef]
  21. Burn, J.E.; Bagnall, D.J.; Metzger, J.D.; Dennis, E.S.; Peacock, W.J. DNA methylation, vernalization, and the initiation of flowering. Proc. Natl. Acad. Sci. USA 1993, 90, 287–291. [Google Scholar] [CrossRef] [Green Version]
  22. Zicola, J.; Liu, L.Y.; Tanzler, P.; Turck, F. Targeted DNA methylation represses two enhancers of FLOWERING LOCUS T in Arabidopsis thaliana. Nat. Plants 2019, 5, 300–307. [Google Scholar] [CrossRef] [PubMed]
  23. Finnegan, E.J.; Ford, B.; Wallace, X.; Pettolino, F.; Griffin, P.T.; Schmitz, R.J.; Zhang, P.; Barrero, J.M.; Hayden, M.J.; Boden, S.A.; et al. Zebularine treatment is associated with deletion of FT-B1 leading to an increase in spikelet number in bread wheat. Plant Cell Environ. 2018, 41, 1346–1360. [Google Scholar] [CrossRef] [PubMed]
  24. Zhang, J.Z.; Mei, L.; Liu, R.; Khan, M.R.G.; Hu, C.G. Possible Involvement of Locus-Specific Methylation on Expression Regulation of LEAFY Homologous Gene (CiLFY) during Precocious Trifoliate Orange Phase Change Process. PLoS ONE 2014, 9, e88558. [Google Scholar] [CrossRef] [PubMed]
  25. Zhou, P.; Zhang, X.; Fatima, M.; Ma, X.; Fang, H.; Yan, H.; Ming, R. DNA methylome and transcriptome landscapes revealed differential characteristics of dioecious flowers in papaya. Hortic. Res. 2020, 7, 81. [Google Scholar] [CrossRef]
  26. Guan, Y.R.; Xue, J.Q.; Xue, Y.Q.; Yang, R.W.; Wang, S.L.; Zhang, X.X. Effect of exogenous GA3 on flowering quality, endogenous hormones, and hormone- and flowering-associated gene expression in forcing-cultured tree peony (Paeonia suffruticosa). J. Integr. Agric. 2019, 18, 1295–1311. [Google Scholar] [CrossRef]
  27. Xue, J.Q.; Li, T.T.; Wang, S.L.; Xue, Y.Q.; Hu, F.R.; Zhang, X.X. Elucidation of the mechanism of reflowering in tree peony (Paeonia suffruticosa) ‘Zi Luo Lan’ by defoliation and gibberellic acid application. Plant Physiol. Biochem. 2018, 132, 571–578. [Google Scholar] [CrossRef]
  28. Kondo, H.; Shiraya, T.; Wada, K.C.; Takeno, K. Induction of flowering by DNA demethylation in Perilla frutescens and Silene armeria: Heritability of 5-azacytidine-induced effects and alteration of the DNA methylation state by photoperiodic conditions. Plant Sci. 2010, 178, 321–326. [Google Scholar] [CrossRef]
  29. Fleet, C.M.; Sun, T.P. A DELLAcate balance: The role of gibberellin in plant morphogenesis. Curr. Opin. Plant Biol. 2005, 8, 77–85. [Google Scholar] [CrossRef]
  30. Zhang, Y.X.; Yuan, Y.C.; Liu, Z.J.; Zhang, T.; Li, F.; Liu, C.Y.; Gai, S.P. GA3 is superior to GA4 in promoting bud endodormancy release in tree peony (Paeonia suffruticosa) and their potential working mechanism. BMC Plant Biol. 2021, 21, 323. [Google Scholar]
  31. Li, H.C.; Torres-Garcia, J.; Latrasse, D.; Benhamed, M.; Schilderink, S.; Zhou, W.K.; Kulikova, O.; Hirt, H.; Bisseling, T. Plant-Specific Histone Deacetylases HDT1/2 Regulate GIBBERELLIN 2-OXIDASE2 Expression to Control Arabidopsis Root Meristem Cell Number. Plant Cell 2017, 29, 2183–2196. [Google Scholar] [CrossRef] [Green Version]
  32. Spray, C.R.; Kobayashi, M.; Suzuki, Y. The dwarf-1 (dt) mutant of Zea mays blocks three steps in the gibberellin-biosynthetic pathway. Proc. Natl. Acad. Sci. USA 1996, 93, 10515–10518. [Google Scholar] [CrossRef] [PubMed] [Green Version]
  33. Bohlenius, H.; Huang, T.; Charbonnel-Campaa, L.; Brunner, A.M.; Jansson, S.; Strauss, S.H.; Nilsson, O. CO/FT regulatory module controls timing of flowering and seasonal growth cessation in trees. Science 2006, 312, 1040–1043. [Google Scholar] [CrossRef] [PubMed] [Green Version]
  34. Dong, B.; Deng, Y.; Wang, H.B.; Gao, R.; Stephen, G.K.; Chen, S.M.; Jiang, J.F.; Chen, F.D. Gibberellic Acid Signaling Is Required to Induce Flowering of Chrysanthemums Grown under Both Short and Long Days. Int. J. Mol. Sci. 2017, 18, 1259. [Google Scholar] [CrossRef] [PubMed] [Green Version]
  35. Orbovic, V.; Ravanfar, S.A.; Acanda, Y.; Narvaez, J.; Merritt, B.A.; Levy, A.; Lovatt, C.J. Stress-inducible Arabidopsis thaliana RD29A promoter constitutively drives Citrus sinensis APETALA1 and LEAFY expression and precocious flowering in transgenic Citrus spp. Transgenic Res. 2021, 30, 687–699. [Google Scholar] [CrossRef] [PubMed]
  36. Ai, Y.J.; Jing, S.L.; Cheng, Z.N.; Song, B.T.; Xie, C.H.; Liu, J.; Zhou, J. DNA methylation affects photoperiodic tuberization in potato (Solanum tuberosum L.) by mediating the expression of genes related to the photoperiod and GA pathways. Hortic. Res. 2021, 8, 181. [Google Scholar] [CrossRef] [PubMed]
  37. Zhou, S.L.; Li, X.; Liu, Q.; Zhao, Y.; Jiang, W.; Wu, A.Q.; Zhou, D.X. DNA demethylases remodel DNA methylation in rice gametes and zygote and are required for reproduction. Mol. Plant 2021, 14, 1569–1583. [Google Scholar] [CrossRef]
  38. Zhang, Y.X.; Si, F.H.; Wang, Y.Y.; Liu, C.Y.; Zhang, T.; Yuan, Y.C.; Gai, S.P. Application of 5-azacytidine induces DNA hypomethylation and accelerates dormancy release in buds of tree peony. Plant Physiol. Biochem. 2020, 147, 91–100. [Google Scholar] [CrossRef]
  39. Li, W.G.; Ma, Y.X.; Zheng, C.K.; Li, G. Variations of Cytosine Methylation Patterns between Staminate and Perfect Flowers within Andromonoecious Taihangia rupestris (Rosaceae) Revealed by Methylation-Sensitive Amplification Polymorphism. J. Plant Growth Regul. 2022, 41, 351–363. [Google Scholar] [CrossRef]
  40. Liu, Z.Y.; Shi, Y.T.; Xue, Y.Q.; Wang, X.P.; Huang, Z.; Xue, J.Q.; Zhang, X.X. Non-structural carbohydrates coordinate tree peony flowering both as energy substrates and as sugar signaling triggers, with the bracts playing an essential role. Plant Physiol. Biochem. 2021, 159, 80–88. [Google Scholar] [CrossRef]
  41. Wagner, T.A.; Kohorn, B.D. Wall-associated kinases are expressed throughout plant development and are required for cell expansion. Plant Cell 2001, 13, 303–318. [Google Scholar] [CrossRef] [Green Version]
  42. Kaye, Y.; Golani, Y.; Singer, Y.; Leshem, Y.; Cohen, G.; Ercetin, M.; Gillaspy, G.; Levine, A. Inositol Polyphosphate 5-Phosphatase7 Regulates the Production of Reactive Oxygen Species and Salt Tolerance in Arabidopsis. Plant Physiol. 2011, 157, 229–241. [Google Scholar] [CrossRef] [PubMed] [Green Version]
  43. Coon, M.J. Cytochrome P450: Nature’s most versatile biological catalyst. Annu. Rev. Pharmacol. Toxicol. 2005, 45, 1–25. [Google Scholar] [CrossRef] [PubMed]
  44. Chen, M.; Markham, J.E.; Dietrich, C.R.; Jaworski, J.G.; Cahoon, E.B. Sphingolipid long-chain base hydroxylation is important for growth and regulation of sphingolipid content and composition in Arabidopsis. Plant Cell 2008, 20, 1862–1878. [Google Scholar] [CrossRef] [PubMed] [Green Version]
  45. Xue, J.Q.; Li, T.; Wang, S.L.; Xue, Y.Q.; Liu, X.W.; Zhang, X.X. Defoliation and gibberellin synergistically induce tree peony flowering with non-structural carbohydrates as intermedia. J. Plant Physiol. 2019, 233, 31–41. [Google Scholar] [CrossRef]
  46. Livak, K.J.; Schmittgen, T.D. Analysis of relative gene expression data using real-time quantitative PCR and the 2(-Delta Delta C(T)) Method. Methods 2001, 25, 402–408. [Google Scholar] [CrossRef]
  47. Lescot, M.; Dehais, P.; Thijs, G.; Marchal, K.; Moreau, Y.; Van de Peer, Y.; Rouze, P.; Rombauts, S. PlantCARE, a database of plant cis-acting regulatory elements and a portal to tools for in silico analysis of promoter sequences. Nucleic Acids Res. 2002, 30, 325–327. [Google Scholar] [CrossRef]
  48. Lv, S.; Cheng, S.; Wang, Z.; Li, S.; Jin, X.; Lan, L.; Yang, B.; Yu, K.; Ni, X.; Li, N.; et al. Draft genome of the famous ornamental plant Paeonia suffruticosa. Ecol. Evol. 2020, 10, 4518–4530. [Google Scholar] [CrossRef]
  49. Tian, T.; Liu, Y.; Yan, H.Y.; You, Q.; Yi, X.; Du, Z.; Xu, W.Y.; Su, Z. agriGO v2.0: A GO analysis toolkit for the agricultural community, 2017 update. Nucleic Acids Res. 2017, 45, W122–W129. [Google Scholar] [CrossRef] [Green Version]
Figure 1. Effects of 5-azaC and GA treatments on the morphological changes in tree peony. (A) Morphological changes of buds during the flowering process. (B,C) Statistical analysis of the petal CIE-LAB color and bud diameter. For color parameters, L: 100 means white, 0 means black; a, redness (+) and greenness (−), and b, yellowness (+) and blueness (−). (D) Microstructure observation of buds. (E) Electron microscopic observation of buds. (F,G) Statistical analysis of the starch grain number and branch length. (All data were analyzed by Duncan’s test at p < 0.05 after analysis of variance; data are shown as the mean ± SD, for (B,C) and (G), n = 10; for (F), n = 5). note: C, A, and G represent the control, 5-azaC, and GA treatment, respectively.
Ijms 23 06632 g001
Figure 2. Effects of 5-azaC and GA treatments on flower quality and GA biosynthesis regulation. (A) The ratio of normal and malformed flowers in different treatments. The meaning of Mal I to III can be found in Section 5.2. (B) Statistical analysis of the petal number and area. (C,D) Statistics analysis of the chlorophyll content and leaf area. (E) GA content in buds at 14 d. (F,H) Relative expression of GA biosynthesis-related genes. (All of the data were analyzed by Duncan’s test at p < 0.05 after analysis of variance; data are shown as the mean ± SD, and the different letters indicates significant differences among different treatments, for (B,D), n = 10; for (C), n = 5; for (EH), n = 3). note: C, A, and G represent the control, 5-azaC, and GA treatment, respectively.
Ijms 23 06632 g002
Figure 3. Effects of the 5-azaC and GA treatments on the expression of flowering-pathway-related genes in buds determined using RT-qPCR. (A) PsCO. (B) PsFT. (C) PsAP1. (D) PsSVP. (E) PsSOC1. (F) PsLFY. (G) PsGID1c. (H) PsGAI. All experiments were performed with at least three biological replicates, and all expression levels were normalized to the Actin control. Error bars indicate the ±SD, and different letters for each day indicate significant differences at p < 0.05 (Duncan’s tests).
Ijms 23 06632 g003
Figure 4. Effect of 5-azaC and GA treatments on DNA methylation levels in the promoter regions of flowering-pathway-related genes and photosynthetic analysis. (A) Related expression of DNA methylation regulation genes PsDRM, PsCMT, and PsMET by RT-qPCR (Duncan’s test at p < 0.05, error bars indicate the ±SD and different letters for each day indicate significant differences, n = 3). (B) DNA methylation level in the promoter of flowering-pathway-related genes determined by McrBC-PCR; + and − indicate with and without GTP, respectively, in the digestion solution (n = 3, representative results shown here). (C) DNA methylation in the promoter of PsFT based on MassARRAY (Duncan’s test at p < 0.05, error bars indicate the ±SD and n = 3). (D) CG context prediction 3 kb before the ATG site in the PsFT promoter and the cis-element prediction in the tested region. The demethylation level in the above CGs 1–2 and 3–5 are also shown here. (E) Morphological levels used for photosynthetic determination. (F) Analysis of net photosynthetic rate (Pn), stomatic conductance (Gs), intercellular CO2 concentration (Ci), and transpiration rate (Tr) in the third leaf of each plant at 28 d. (Duncan’s test at p < 0.05 after analysis of variance; data are shown as the mean ±SD, and the different letters indicates significant differences among different treatments, n = 10).
Ijms 23 06632 g004
Figure 5. Transcriptome data analysis of differentially expressed genes (DEGs) in buds among different treatments at 14 d. (A) Pearson correlation heatmap of all gene expression levels between the treatment groups of each sample according to their coefficients. (B) Volcanic scatter plots based on pairwise comparisons of DEGs among different treatment groups; the red and blue plots represent up- and downregulated DEGs, respectively, and the gray plots represent non-DEGs. (C) Venn diagram of DEGs in the control vs. 5-azaC, control vs. GA, and control vs. A + G treatment. (D,E) GO terms of the cellular component in methylation- and GA-closer DEGs, respectively. (F,G) Quantification of GO terms of the cellular component and biological process in methylation- and GA-closer DEGs, respectively, compared to Arabidopsis. note: C, A, and G represent the control, 5-azaC, and GA treatment, respectively.
Ijms 23 06632 g005
Figure 6. Heatmap of correlations among different DEGs and the potential flowering regulatory network of tree peony. (A) Hierarchical clustering analysis of methylation-closer DEGs. The circles indicate candidate DEGs with a greater difference. 1. SNF1-related protein kinase1 (SnRK1); 2. Violaxanthin de-epoxidase; 3. Unknown; 4. G-type lectin S-receptor-like serine/threonine-protein kinase; 5. Ubiquitin carboxyl-terminal hydrolase23; 6. Cytochrome P450; 7. Unknown; 8. Wall-associated receptor kinase2 (WAK2); 9. Type IV inositol polyphosphate 5-phosphatase7 (5PTase7). (B) Hierarchical clustering analysis of GA-closer DEGs. The circles indicate candidate DEGs with a greater difference. 1. Unknown; 2. Unknown; 3. Sphingoid base hydroxylase1 (SBH1); 4. β-amylase2; 5. Polygalacturonase; 6. Rhodanese-like domain-containing protein11. (C) Expression of candidate flowering-regulated genes. PCR represents the RT-qPCR results, all expression levels were normalized to the Actin control, and error bars indicate the ±SD (n = 3); Seq represents transcriptome sequencing results. (D) Potential network construction of 5-azaC- and GA-induced tree peony flowering under forcing culture.
Ijms 23 06632 g006
Publisher’s Note: MDPI stays neutral with regard to jurisdictional claims in published maps and institutional affiliations.

