
Distinct Roles of NANOS1 and NANOS3 in the Cell Cycle and NANOS3-PUM1-FOXM1 Axis to Control G2/M Phase in a Human Primordial Germ Cell Model

 , , , , , , ,
  and
and 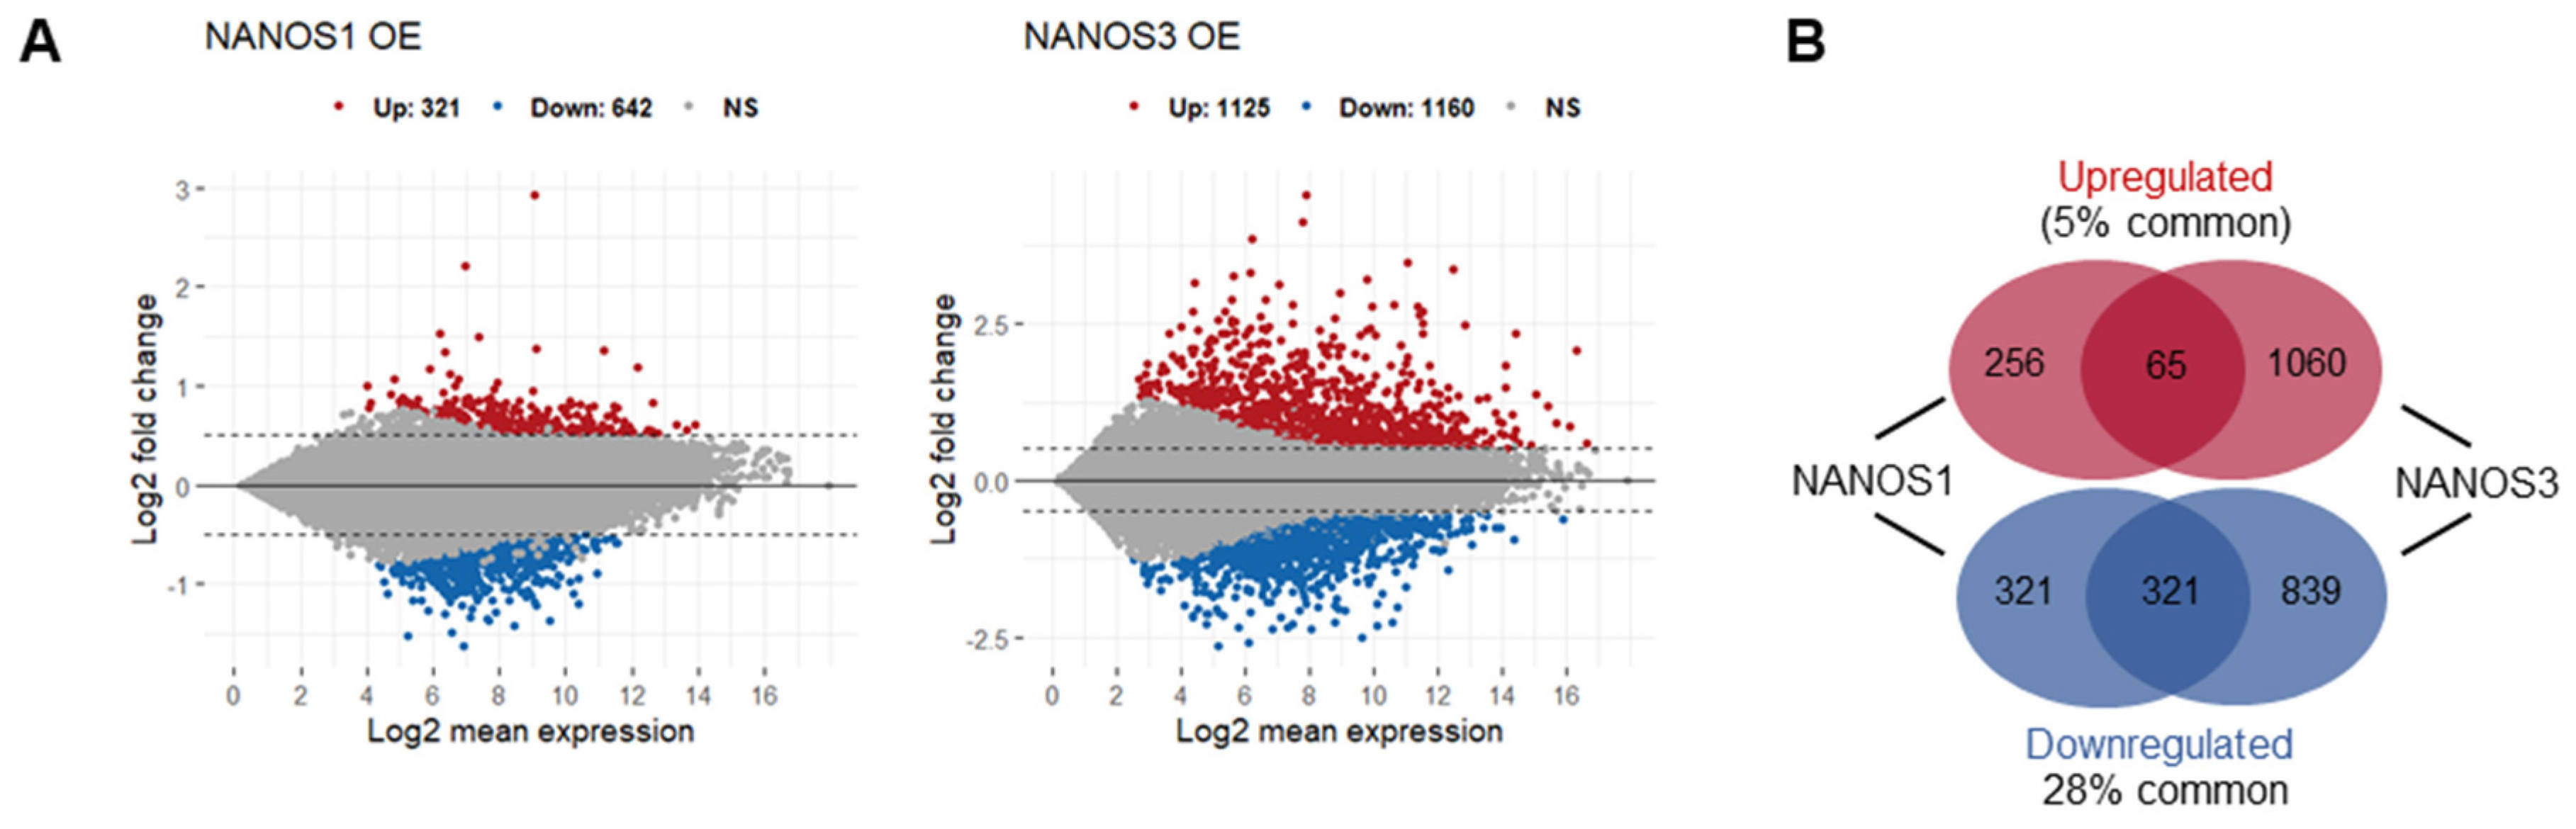
Abstract
1. Introduction
2. Results
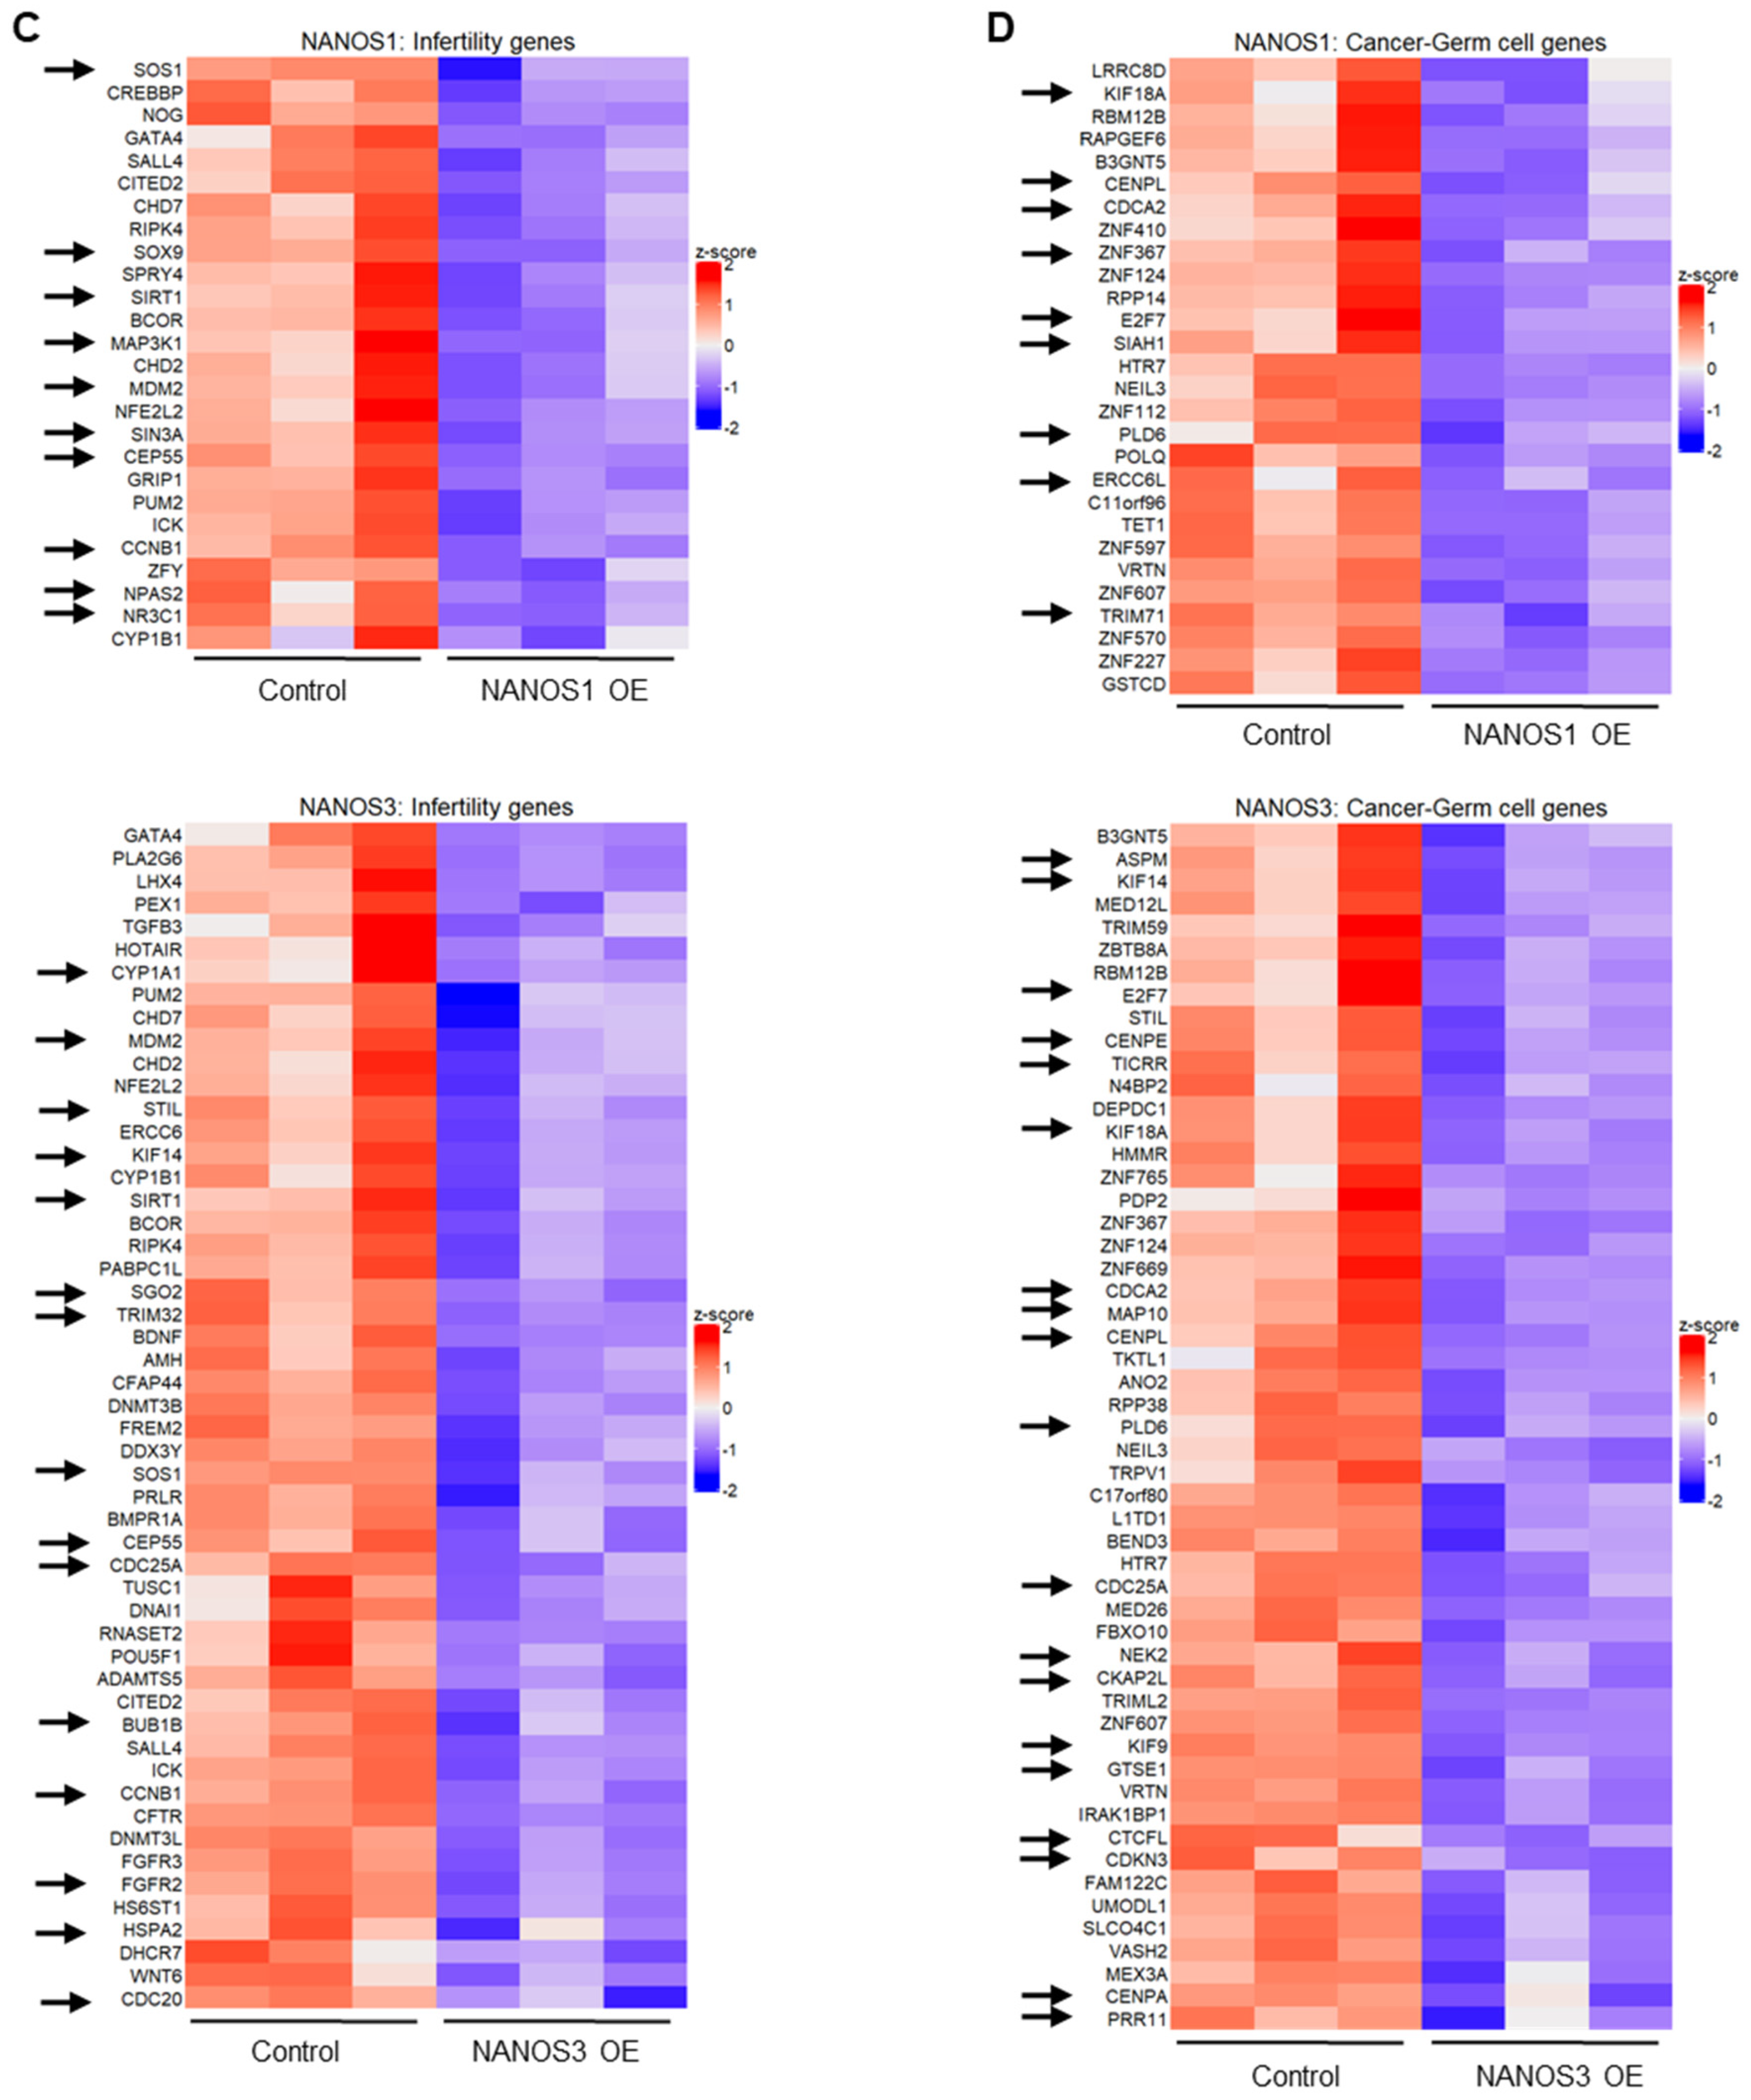
2.1. NANOS1 and NANOS3 Overexpression Cause Downregulation of Infertility and Cancer-Germ Cell Genes
2.2. Biological Clustering Analysis of NANOS1 and NANOS3 Downregulated Genes Reveals Cell Cycle Related Clusters Containing Infertility and Cancer-Germ Cell Genes
2.3. Distinct Phenotypic Effects of NANOS1 and NANOS3 on Cell Cycle
2.4. TAF1 and FOXM1 Are Transcriptional Regulators for NANOS1 and NANOS3 Downregulated Genes
2.5. NANOS3 and PUM1 Cooperate in Post-Transcriptional Repression of FOXM1-Regulated Genes
2.6. FOXM1 Is a Post-Transcriptional Target for NANOS3/PUM1 Complex
2.7. NANOS3-PUM1-FOXM1 Axis Coordinates Expression of G2/M Phase Cell Cycle Genes
3. Discussion
4. Materials and Methods
4.1. Cell Culture
4.2. Transfections
4.3. RNA-Sequencing
4.4. BCA (Biological Clustering Analysis)
4.5. Gene Overlap Analysis of ENCODE Chip-Seq and eCLIP Data
4.6. Motif Enrichment Analysis
4.7. Transcription Factor Prediction
4.8. Western Blot
4.9. Cell Cycle Assay
4.10. Apoptosis Assay
4.11. Luciferase Reporter Assay
4.12. GST Pull-Down
4.13. ChIP-qPCR
4.14. Differential Correlation Analysis
5. Conclusions
Supplementary Materials
Author Contributions
Funding
Institutional Review Board Statement
Data Availability Statement
Acknowledgments
Conflicts of Interest
References
- Mercer, M.; Jang, S.; Ni, C.; Buszczak, M. The Dynamic Regulation of mRNA Translation and Ribosome Biogenesis During Germ Cell Development and Reproductive Aging. Front. Cell Dev. Biol. 2021, 9, 710186. [Google Scholar] [CrossRef] [PubMed]
- Khalaj, K.; Miller, J.E.; Fenn, C.R.; Ahn, S.; Luna, R.L.; Symons, L.; Monsanto, S.P.; Koti, M.; Tayade, C. RNA-Binding Proteins in Female Reproductive Pathologies. Am. J. Pathol. 2017, 187, 1200–1210. [Google Scholar] [CrossRef] [PubMed]
- Pereira, B.; Billaud, M.; Almeida, R. RNA-Binding Proteins in Cancer: Old Players and New Actors. Trends Cancer 2017, 3, 506–528. [Google Scholar] [CrossRef] [PubMed]
- Yao, L.; Cong, R.; Ji, C.; Zhou, X.; Luan, J.; Meng, X.; Song, N. RNA-Binding Proteins Play an Important Role in the Prognosis of Patients with Testicular Germ Cell Tumor. Front. Genet. 2021, 12, 610291. [Google Scholar] [CrossRef]
- Lehmann, R.; Nusslein-Volhard, C. The maternal gene nanos has a central role in posterior pattern formation of the Drosophila embryo. Development 1991, 112, 679–691. [Google Scholar] [CrossRef]
- Hayashi, Y.; Hayashi, M.; Kobayashi, S. Nanos suppresses somatic cell fate in Drosophila germ line. Proc. Natl. Acad. Sci. USA 2004, 101, 10338–10342. [Google Scholar] [CrossRef]
- Forbes, A.; Lehmann, R. Nanos and Pumilio have critical roles in the development and function of Drosophila germline stem cells. Development 1998, 125, 679–690. [Google Scholar] [CrossRef]
- Kobayashi, S.; Yamada, M.; Asaoka, M.; Kitamura, T. Essential role of the posterior morphogen nanos for germline development in Drosophila. Nature 1996, 380, 708–711. [Google Scholar] [CrossRef]
- Sato, K.; Hayashi, Y.; Ninomiya, Y.; Shigenobu, S.; Arita, K.; Mukai, M.; Kobayashi, S. Maternal Nanos represses hid/skl-dependent apoptosis to maintain the germ line in Drosophila embryos. Proc. Natl. Acad. Sci. USA 2007, 104, 7455–7460. [Google Scholar] [CrossRef]
- Wang, Z.; Lin, H. Nanos maintains germline stem cell self-renewal by preventing differentiation. Science 2004, 303, 2016–2019. [Google Scholar] [CrossRef]
- Haraguchi, S.; Tsuda, M.; Kitajima, S.; Sasaoka, Y.; Nomura-Kitabayashid, A.; Kurokawa, K.; Saga, Y. nanos1: A mouse nanos gene expressed in the central nervous system is dispensable for normal development. Mech. Dev. 2003, 120, 721–731. [Google Scholar] [CrossRef]
- Jaruzelska, J.; Kotecki, M.; Kusz, K.; Spik, A.; Firpo, M.; Reijo Pera, R.A. Conservation of a Pumilio-Nanos complex from Drosophila germ plasm to human germ cells. Dev. Genes Evol. 2003, 213, 120–126. [Google Scholar] [CrossRef]
- Tsuda, M.; Sasaoka, Y.; Kiso, M.; Abe, K.; Haraguchi, S.; Kobayashi, S.; Saga, Y. Conserved role of nanos proteins in germ cell development. Science 2003, 301, 1239–1241. [Google Scholar] [CrossRef]
- Kobayashi, T.; Zhang, H.; Tang, W.W.C.; Irie, N.; Withey, S.; Klisch, D.; Sybirna, A.; Dietmann, S.; Contreras, D.A.; Webb, R.; et al. Principles of early human development and germ cell program from conserved model systems. Nature 2017, 546, 416–420. [Google Scholar] [CrossRef]
- Sybirna, A.; Tang, W.W.C.; Pierson Smela, M.; Dietmann, S.; Gruhn, W.H.; Brosh, R.; Surani, M.A. A critical role of PRDM14 in human primordial germ cell fate revealed by inducible degrons. Nat. Commun. 2020, 11, 1282. [Google Scholar] [CrossRef]
- Irie, N.; Weinberger, L.; Tang, W.W.; Kobayashi, T.; Viukov, S.; Manor, Y.S.; Dietmann, S.; Hanna, J.H.; Surani, M.A. SOX17 is a critical specifier of human primordial germ cell fate. Cell 2015, 160, 253–268. [Google Scholar] [CrossRef]
- Kusz, K.M.; Tomczyk, L.; Sajek, M.; Spik, A.; Latos-Bielenska, A.; Jedrzejczak, P.; Pawelczyk, L.; Jaruzelska, J. The highly conserved NANOS2 protein: Testis-specific expression and significance for the human male reproduction. Mol. Hum. Reprod. 2009, 15, 165–171. [Google Scholar] [CrossRef]
- Uhlen, M.; Fagerberg, L.; Hallstrom, B.M.; Lindskog, C.; Oksvold, P.; Mardinoglu, A.; Sivertsson, A.; Kampf, C.; Sjostedt, E.; Asplund, A.; et al. Proteomics. Tissue-based map of the human proteome. Science 2015, 347, 1260419. [Google Scholar] [CrossRef]
- Kusz-Zamelczyk, K.; Sajek, M.; Spik, A.; Glazar, R.; Jedrzejczak, P.; Latos-Bielenska, A.; Kotecki, M.; Pawelczyk, L.; Jaruzelska, J. Mutations of NANOS1, a human homologue of the Drosophila morphogen, are associated with a lack of germ cells in testes or severe oligo-astheno-teratozoospermia. J. Med. Genet. 2013, 50, 187–193. [Google Scholar] [CrossRef]
- Janecki, D.M.; Ilaslan, E.; Smialek, M.J.; Sajek, M.P.; Kotecki, M.; Ginter-Matuszewska, B.; Krainski, P.; Jaruzelska, J.; Kusz-Zamelczyk, K. Human NANOS1 Represses Apoptosis by Downregulating Pro-Apoptotic Genes in the Male Germ Cell Line. Int. J. Mol. Sci. 2020, 21, 3009. [Google Scholar] [CrossRef]
- Santos, M.G.; Machado, A.Z.; Martins, C.N.; Domenice, S.; Costa, E.M.; Nishi, M.Y.; Ferraz-de-Souza, B.; Jorge, S.A.; Pereira, C.A.; Soardi, F.C.; et al. Homozygous inactivating mutation in NANOS3 in two sisters with primary ovarian insufficiency. Biomed. Res. Int. 2014, 2014, 787465. [Google Scholar] [CrossRef]
- Wu, X.; Wang, B.; Dong, Z.; Zhou, S.; Liu, Z.; Shi, G.; Cao, Y.; Xu, Y. A NANOS3 mutation linked to protein degradation causes premature ovarian insufficiency. Cell Death Dis. 2013, 4, e825. [Google Scholar] [CrossRef]
- Kusz, K.; Tomczyk, L.; Spik, A.; Latos-Bielenska, A.; Jedrzejczak, P.; Pawelczyk, L.; Jaruzelska, J. NANOS3 gene mutations in men with isolated sterility phenotype. Mol. Reprod. Dev. 2009, 76, 804. [Google Scholar] [CrossRef]
- Bhandari, D.; Raisch, T.; Weichenrieder, O.; Jonas, S.; Izaurralde, E. Structural basis for the Nanos-mediated recruitment of the CCR4-NOT complex and translational repression. Genes Dev. 2014, 28, 888–901. [Google Scholar] [CrossRef]
- Sajek, M.; Janecki, D.M.; Smialek, M.J.; Ginter-Matuszewska, B.; Spik, A.; Oczkowski, S.; Ilaslan, E.; Kusz-Zamelczyk, K.; Kotecki, M.; Blazewicz, J.; et al. PUM1 and PUM2 exhibit different modes of regulation for SIAH1 that involve cooperativity with NANOS paralogues. Cell Mol. Life Sci. 2019, 76, 147–161. [Google Scholar] [CrossRef]
- Bohn, J.A.; Van Etten, J.L.; Schagat, T.L.; Bowman, B.M.; McEachin, R.C.; Freddolino, P.L.; Goldstrohm, A.C. Identification of diverse target RNAs that are functionally regulated by human Pumilio proteins. Nucleic Acids Res. 2018, 46, 362–386. [Google Scholar] [CrossRef]
- Mak, W.; Fang, C.; Holden, T.; Dratver, M.B.; Lin, H. An Important Role of Pumilio 1 in Regulating the Development of the Mammalian Female Germline. Biol. Reprod. 2016, 94, 134. [Google Scholar] [CrossRef]
- Xu, E.Y.; Chang, R.; Salmon, N.A.; Pera, R.R.A. A gene trap mutation of a murine homolog of the Drosophila stem cell factor Pumilio results in smaller testes but does not affect litter size or fertility. Mol. Reprod. Dev. 2007, 74, 912–921. [Google Scholar] [CrossRef]
- Smialek, M.J.; Ilaslan, E.; Sajek, M.P.; Swiercz, A.; Janecki, D.M.; Kusz-Zamelczyk, K.; Wozniak, T.; Kotecki, M.; Handschuh, L.; Figlerowicz, M.; et al. Characterization of RNP Networks of PUM1 and PUM2 Post-Transcriptional Regulators in TCam-2 Cells, a Human Male Germ Cell Model. Cells 2020, 9, 984. [Google Scholar] [CrossRef]
- Rappaport, N.; Twik, M.; Plaschkes, I.; Nudel, R.; Stein, T.I.; Levitt, J.; Gershoni, M.; Morrey, C.P.; Safran, M.; Lancet, D. MalaCards: An amalgamated human disease compendium with diverse clinical and genetic annotation and structured search. Nucleic Acids Res. 2017, 45, D877–D887. [Google Scholar] [CrossRef]
- Kanehisa, M.; Goto, S. KEGG: Kyoto encyclopedia of genes and genomes. Nucleic Acids Res. 2000, 28, 27–30. [Google Scholar] [CrossRef] [PubMed]
- Babbi, G.; Martelli, P.L.; Profiti, G.; Bovo, S.; Savojardo, C.; Casadio, R. eDGAR: A database of Disease-Gene Associations with annotated Relationships among genes. BMC Genom. 2017, 18 (Suppl. S5), 554. [Google Scholar] [CrossRef] [PubMed]
- Sayers, E.W.; Bolton, E.E.; Brister, J.R.; Canese, K.; Chan, J.; Comeau, D.C.; Connor, R.; Funk, K.; Kelly, C.; Kim, S.; et al. Database resources of the national center for biotechnology information. Nucleic Acids Res. 2022, 50, D20–D26. [Google Scholar] [CrossRef] [PubMed]
- Chen, Q.; Ke, H.; Luo, X.; Wang, L.; Wu, Y.; Tang, S.; Li, J.; Jin, L.; Zhang, F.; Qin, Y.; et al. Rare deleterious BUB1B variants induce premature ovarian insufficiency and early menopause. Hum. Mol. Genet. 2020, 29, 2698–2707. [Google Scholar] [CrossRef]
- Ji, Z.Y.; Sha, Y.W.; Ding, L.; Li, P. Genetic factors contributing to human primary ciliary dyskinesia and male infertility. Asian J. Androl. 2017, 19, 515–520. [Google Scholar]
- Bruggeman, J.W.; Koster, J.; Lodder, P.; Repping, S.; Hamer, G. Massive expression of germ cell-specific genes is a hallmark of cancer and a potential target for novel treatment development. Oncogene 2018, 37, 5694–5700. [Google Scholar] [CrossRef]
- Doncheva, N.T.; Morris, J.H.; Gorodkin, J.; Jensen, L.J. Cytoscape StringApp: Network Analysis and Visualization of Proteomics Data. J. Proteome Res. 2019, 18, 623–632. [Google Scholar] [CrossRef]
- Bader, G.D.; Hogue, C.W. An automated method for finding molecular complexes in large protein interaction networks. BMC Bioinform. 2003, 4, 2. [Google Scholar] [CrossRef]
- Barr, A.R.; Cooper, S.; Heldt, F.S.; Butera, F.; Stoy, H.; Mansfeld, J.; Novak, B.; Bakal, C. DNA damage during S-phase mediates the proliferation-quiescence decision in the subsequent G1 via p21 expression. Nat. Commun. 2017, 8, 14728. [Google Scholar] [CrossRef]
- Janky, R.; Verfaillie, A.; Imrichova, H.; Van de Sande, B.; Standaert, L.; Christiaens, V.; Hulselmans, G.; Herten, K.; Sanchez, M.N.; Potier, D.; et al. iRegulon: From a gene list to a gene regulatory network using large motif and track collections. PLoS Comput. Biol. 2014, 10, e1003731. [Google Scholar] [CrossRef]
- Li, H.H.; Li, A.G.; Sheppard, H.M.; Liu, X. Phosphorylation on Thr-55 by TAF1 mediates degradation of p53: A role for TAF1 in cell G1 progression. Mol. Cell 2004, 13, 867–878. [Google Scholar] [CrossRef]
- Wu, Y.; Lin, J.C.; Piluso, L.G.; Dhahbi, J.M.; Bobadilla, S.; Spindler, S.R.; Liu, X. Phosphorylation of p53 by TAF1 inactivates p53-dependent transcription in the DNA damage response. Mol. Cell 2014, 53, 63–74. [Google Scholar] [CrossRef]
- Fu, Z.; Malureanu, L.; Huang, J.; Wang, W.; Li, H.; van Deursen, J.M.; Tindall, D.J.; Chen, J. Plk1-dependent phosphorylation of FoxM1 regulates a transcriptional programme required for mitotic progression. Nat. Cell Biol. 2008, 10, 1076–1082. [Google Scholar] [CrossRef]
- Laoukili, J.; Kooistra, M.R.; Bras, A.; Kauw, J.; Kerkhoven, R.M.; Morrison, A.; Clevers, H.; Medema, R.H. FoxM1 is required for execution of the mitotic programme and chromosome stability. Nat. Cell Biol. 2005, 7, 126–136. [Google Scholar] [CrossRef]
- Park, H.J.; Wang, Z.; Costa, R.H.; Tyner, A.; Lau, L.F.; Raychaudhuri, P. An N-terminal inhibitory domain modulates activity of FoxM1 during cell cycle. Oncogene 2008, 27, 1696–1704. [Google Scholar] [CrossRef]
- Pagano, M.; Pepperkok, R.; Verde, F.; Ansorge, W.; Draetta, G. Cyclin A is required at two points in the human cell cycle. EMBO J. 1992, 11, 961–971. [Google Scholar] [CrossRef]
- Abaza, A.; Soleilhac, J.M.; Westendorf, J.; Piel, M.; Crevel, I.; Roux, A.; Pirollet, F. M phase phosphoprotein 1 is a human plus-end-directed kinesin-related protein required for cytokinesis. J. Biol. Chem. 2003, 278, 27844–27852. [Google Scholar] [CrossRef]
- Watrin, E.; Peters, J.M. The cohesin complex is required for the DNA damage-induced G2/M checkpoint in mammalian cells. EMBO J. 2009, 28, 2625–2635. [Google Scholar] [CrossRef]
- Matthews, H.K.; Bertoli, C.; de Bruin, R.A.M. Cell cycle control in cancer. Nat. Rev. Mol. Cell Biol. 2022, 23, 74–88. [Google Scholar] [CrossRef]
- Gordeeva, O. Cancer-testis antigens: Unique cancer stem cell biomarkers and targets for cancer therapy. Semin. Cancer Biol. 2018, 53, 75–89. [Google Scholar] [CrossRef]
- Nagirnaja, L.; Aston, K.I.; Conrad, D.F. Genetic intersection of male infertility and cancer. Fertil. Steril. 2018, 109, 20–26. [Google Scholar] [CrossRef]
- Kalin, T.V.; Ustiyan, V.; Kalinichenko, V.V. Multiple faces of FoxM1 transcription factor: Lessons from transgenic mouse models. Cell Cycle 2011, 10, 396–405. [Google Scholar] [CrossRef]
- Chaudhary, J.; Mosher, R.; Kim, G.; Skinner, M.K. Role of winged helix transcription factor (WIN) in the regulation of Sertoli cell differentiated functions: WIN acts as an early event gene for follicle-stimulating hormone. Endocrinology 2000, 141, 2758–2766. [Google Scholar] [CrossRef][Green Version]
- Ye, H.; Kelly, T.F.; Samadani, U.; Lim, L.; Rubio, S.; Overdier, D.G.; Roebuck, K.A.; Costa, R.H. Hepatocyte nuclear factor 3/fork head homolog 11 is expressed in proliferating epithelial and mesenchymal cells of embryonic and adult tissues. Mol. Cell Biol. 1997, 17, 1626–1641. [Google Scholar] [CrossRef]
- Joshi, A.; Beck, Y.; Michoel, T. Post-transcriptional regulatory networks play a key role in noise reduction that is conserved from micro-organisms to mammals. FEBS J. 2012, 279, 3501–3512. [Google Scholar] [CrossRef]
- Grelet, S.; Andries, V.; Polette, M.; Gilles, C.; Staes, K.; Martin, A.P.; Kileztky, C.; Terryn, C.; Dalstein, V.; Cheng, C.W.; et al. The human NANOS3 gene contributes to lung tumour invasion by inducing epithelial-mesenchymal transition. J. Pathol. 2015, 237, 25–37. [Google Scholar] [CrossRef]
- Smialek, M.J.; Ilaslan, E.; Sajek, M.P.; Jaruzelska, J. Role of PUM RNA-Binding Proteins in Cancer. Cancers 2021, 13, 129. [Google Scholar] [CrossRef]
- Strumane, K.; Bonnomet, A.; Stove, C.; Vandenbroucke, R.; Nawrocki-Raby, B.; Bruyneel, E.; Mareel, M.; Birembaut, P.; Berx, G.; van Roy, F. E-cadherin regulates human Nanos1, which interacts with p120ctn and induces tumor cell migration and invasion. Cancer Res. 2006, 66, 10007–10015. [Google Scholar] [CrossRef]
- Zhang, F.; Liu, R.; Liu, C.; Zhang, H.; Lu, Y. Nanos3, a cancer-germline gene, promotes cell proliferation, migration, chemoresistance, and invasion of human glioblastoma. Cancer Cell Int. 2020, 20, 197. [Google Scholar] [CrossRef]
- Barger, C.J.; Branick, C.; Chee, L.; Karpf, A.R. Pan-Cancer Analyses Reveal Genomic Features of FOXM1 Overexpression in Cancer. Cancers 2019, 11, 251. [Google Scholar] [CrossRef]
- Bolger, A.M.; Lohse, M.; Usadel, B. Trimmomatic: A flexible trimmer for Illumina sequence data. Bioinformatics 2014, 30, 2114–2120. [Google Scholar] [CrossRef] [PubMed]
- Langmead, B.; Salzberg, S.L. Fast gapped-read alignment with Bowtie 2. Nat. Methods 2012, 9, 357–359. [Google Scholar] [CrossRef] [PubMed]
- Liao, Y.; Smyth, G.K.; Shi, W. featureCounts: An efficient general purpose program for assigning sequence reads to genomic features. Bioinformatics 2014, 30, 923–930. [Google Scholar] [CrossRef] [PubMed]
- Love, M.I.; Huber, W.; Anders, S. Moderated estimation of fold change and dispersion for RNA-seq data with DESeq2. Genome Biol. 2014, 15, 550. [Google Scholar] [CrossRef] [PubMed]
- Bindea, G.; Mlecnik, B.; Hackl, H.; Charoentong, P.; Tosolini, M.; Kirilovsky, A.; Fridman, W.H.; Pages, F.; Trajanoski, Z.; Galon, J. ClueGO: A Cytoscape plug-in to decipher functionally grouped gene ontology and pathway annotation networks. Bioinformatics 2009, 25, 1091–1093. [Google Scholar] [CrossRef]
- Zhu, L.J. Integrative analysis of ChIP-chip and ChIP-seq dataset. Methods Mol. Biol. 2013, 1067, 105–124. [Google Scholar]
- Zhu, L.J.; Gazin, C.; Lawson, N.D.; Pages, H.; Lin, S.M.; Lapointe, D.S.; Green, M.R. ChIPpeakAnno: A Bioconductor package to annotate ChIP-seq and ChIP-chip data. BMC Bioinform. 2010, 11, 237. [Google Scholar] [CrossRef]
- Statham, A.L.; Strbenac, D.; Coolen, M.W.; Stirzaker, C.; Clark, S.J.; Robinson, M.D. Repitools: An R package for the analysis of enrichment-based epigenomic data. Bioinformatics 2010, 26, 1662–1663. [Google Scholar] [CrossRef]
- Patro, R.; Duggal, G.; Love, M.I.; Irizarry, R.A.; Kingsford, C. Salmon provides fast and bias-aware quantification of transcript expression. Nat. Methods 2017, 14, 417–419. [Google Scholar] [CrossRef]
- Lawrence, M.; Huber, W.; Pages, H.; Aboyoun, P.; Carlson, M.; Gentleman, R.; Morgan, M.T.; Carey, V.J. Software for computing and annotating genomic ranges. PLoS Comput. Biol. 2013, 9, e1003118. [Google Scholar] [CrossRef]
- Bailey, T.L. STREME: Accurate and versatile sequence motif discovery. Bioinformatics 2021, 37, 2834–2840. [Google Scholar] [CrossRef]
- Menegaut, L.; Thomas, C.; Jalil, A.; Julla, J.B.; Magnani, C.; Ceroi, A.; Basmaciyan, L.; Dumont, A.; Le Goff, W.; Mathew, M.J.; et al. Interplay between Liver X Receptor and Hypoxia Inducible Factor 1alpha Potentiates Interleukin-1beta Production in Human Macrophages. Cell Rep. 2020, 31, 107665. [Google Scholar] [CrossRef]
- McKenzie, A.T.; Katsyv, I.; Song, W.M.; Wang, M.; Zhang, B. DGCA: A comprehensive R package for Differential Gene Correlation Analysis. BMC Syst. Biol. 2016, 10, 106. [Google Scholar]


Publisher’s Note: MDPI stays neutral with regard to jurisdictional claims in published maps and institutional affiliations. |
© 2022 by the authors. Licensee MDPI, Basel, Switzerland. This article is an open access article distributed under the terms and conditions of the Creative Commons Attribution (CC BY) license (https://creativecommons.org/licenses/by/4.0/).
Share and Cite
Ilaslan, E.; Kwiatkowska, K.; Smialek, M.J.; Sajek, M.P.; Lemanska, Z.; Alla, M.; Janecki, D.M.; Jaruzelska, J.; Kusz-Zamelczyk, K. Distinct Roles of NANOS1 and NANOS3 in the Cell Cycle and NANOS3-PUM1-FOXM1 Axis to Control G2/M Phase in a Human Primordial Germ Cell Model. Int. J. Mol. Sci. 2022, 23, 6592. https://doi.org/10.3390/ijms23126592
Ilaslan E, Kwiatkowska K, Smialek MJ, Sajek MP, Lemanska Z, Alla M, Janecki DM, Jaruzelska J, Kusz-Zamelczyk K. Distinct Roles of NANOS1 and NANOS3 in the Cell Cycle and NANOS3-PUM1-FOXM1 Axis to Control G2/M Phase in a Human Primordial Germ Cell Model. International Journal of Molecular Sciences. 2022; 23(12):6592. https://doi.org/10.3390/ijms23126592
Chicago/Turabian StyleIlaslan, Erkut, Krystyna Kwiatkowska, Maciej Jerzy Smialek, Marcin Piotr Sajek, Zaneta Lemanska, Matisa Alla, Damian Mikolaj Janecki, Jadwiga Jaruzelska, and Kamila Kusz-Zamelczyk. 2022. "Distinct Roles of NANOS1 and NANOS3 in the Cell Cycle and NANOS3-PUM1-FOXM1 Axis to Control G2/M Phase in a Human Primordial Germ Cell Model" International Journal of Molecular Sciences 23, no. 12: 6592. https://doi.org/10.3390/ijms23126592
APA StyleIlaslan, E., Kwiatkowska, K., Smialek, M. J., Sajek, M. P., Lemanska, Z., Alla, M., Janecki, D. M., Jaruzelska, J., & Kusz-Zamelczyk, K. (2022). Distinct Roles of NANOS1 and NANOS3 in the Cell Cycle and NANOS3-PUM1-FOXM1 Axis to Control G2/M Phase in a Human Primordial Germ Cell Model. International Journal of Molecular Sciences, 23(12), 6592. https://doi.org/10.3390/ijms23126592