
Antagonistic Pharmacological Interaction between Sirtuin Inhibitor Cambinol and Paclitaxel in Triple-Negative Breast Cancer Cell Lines: An Isobolographic Analysis

 , ,
, ,
Abstract
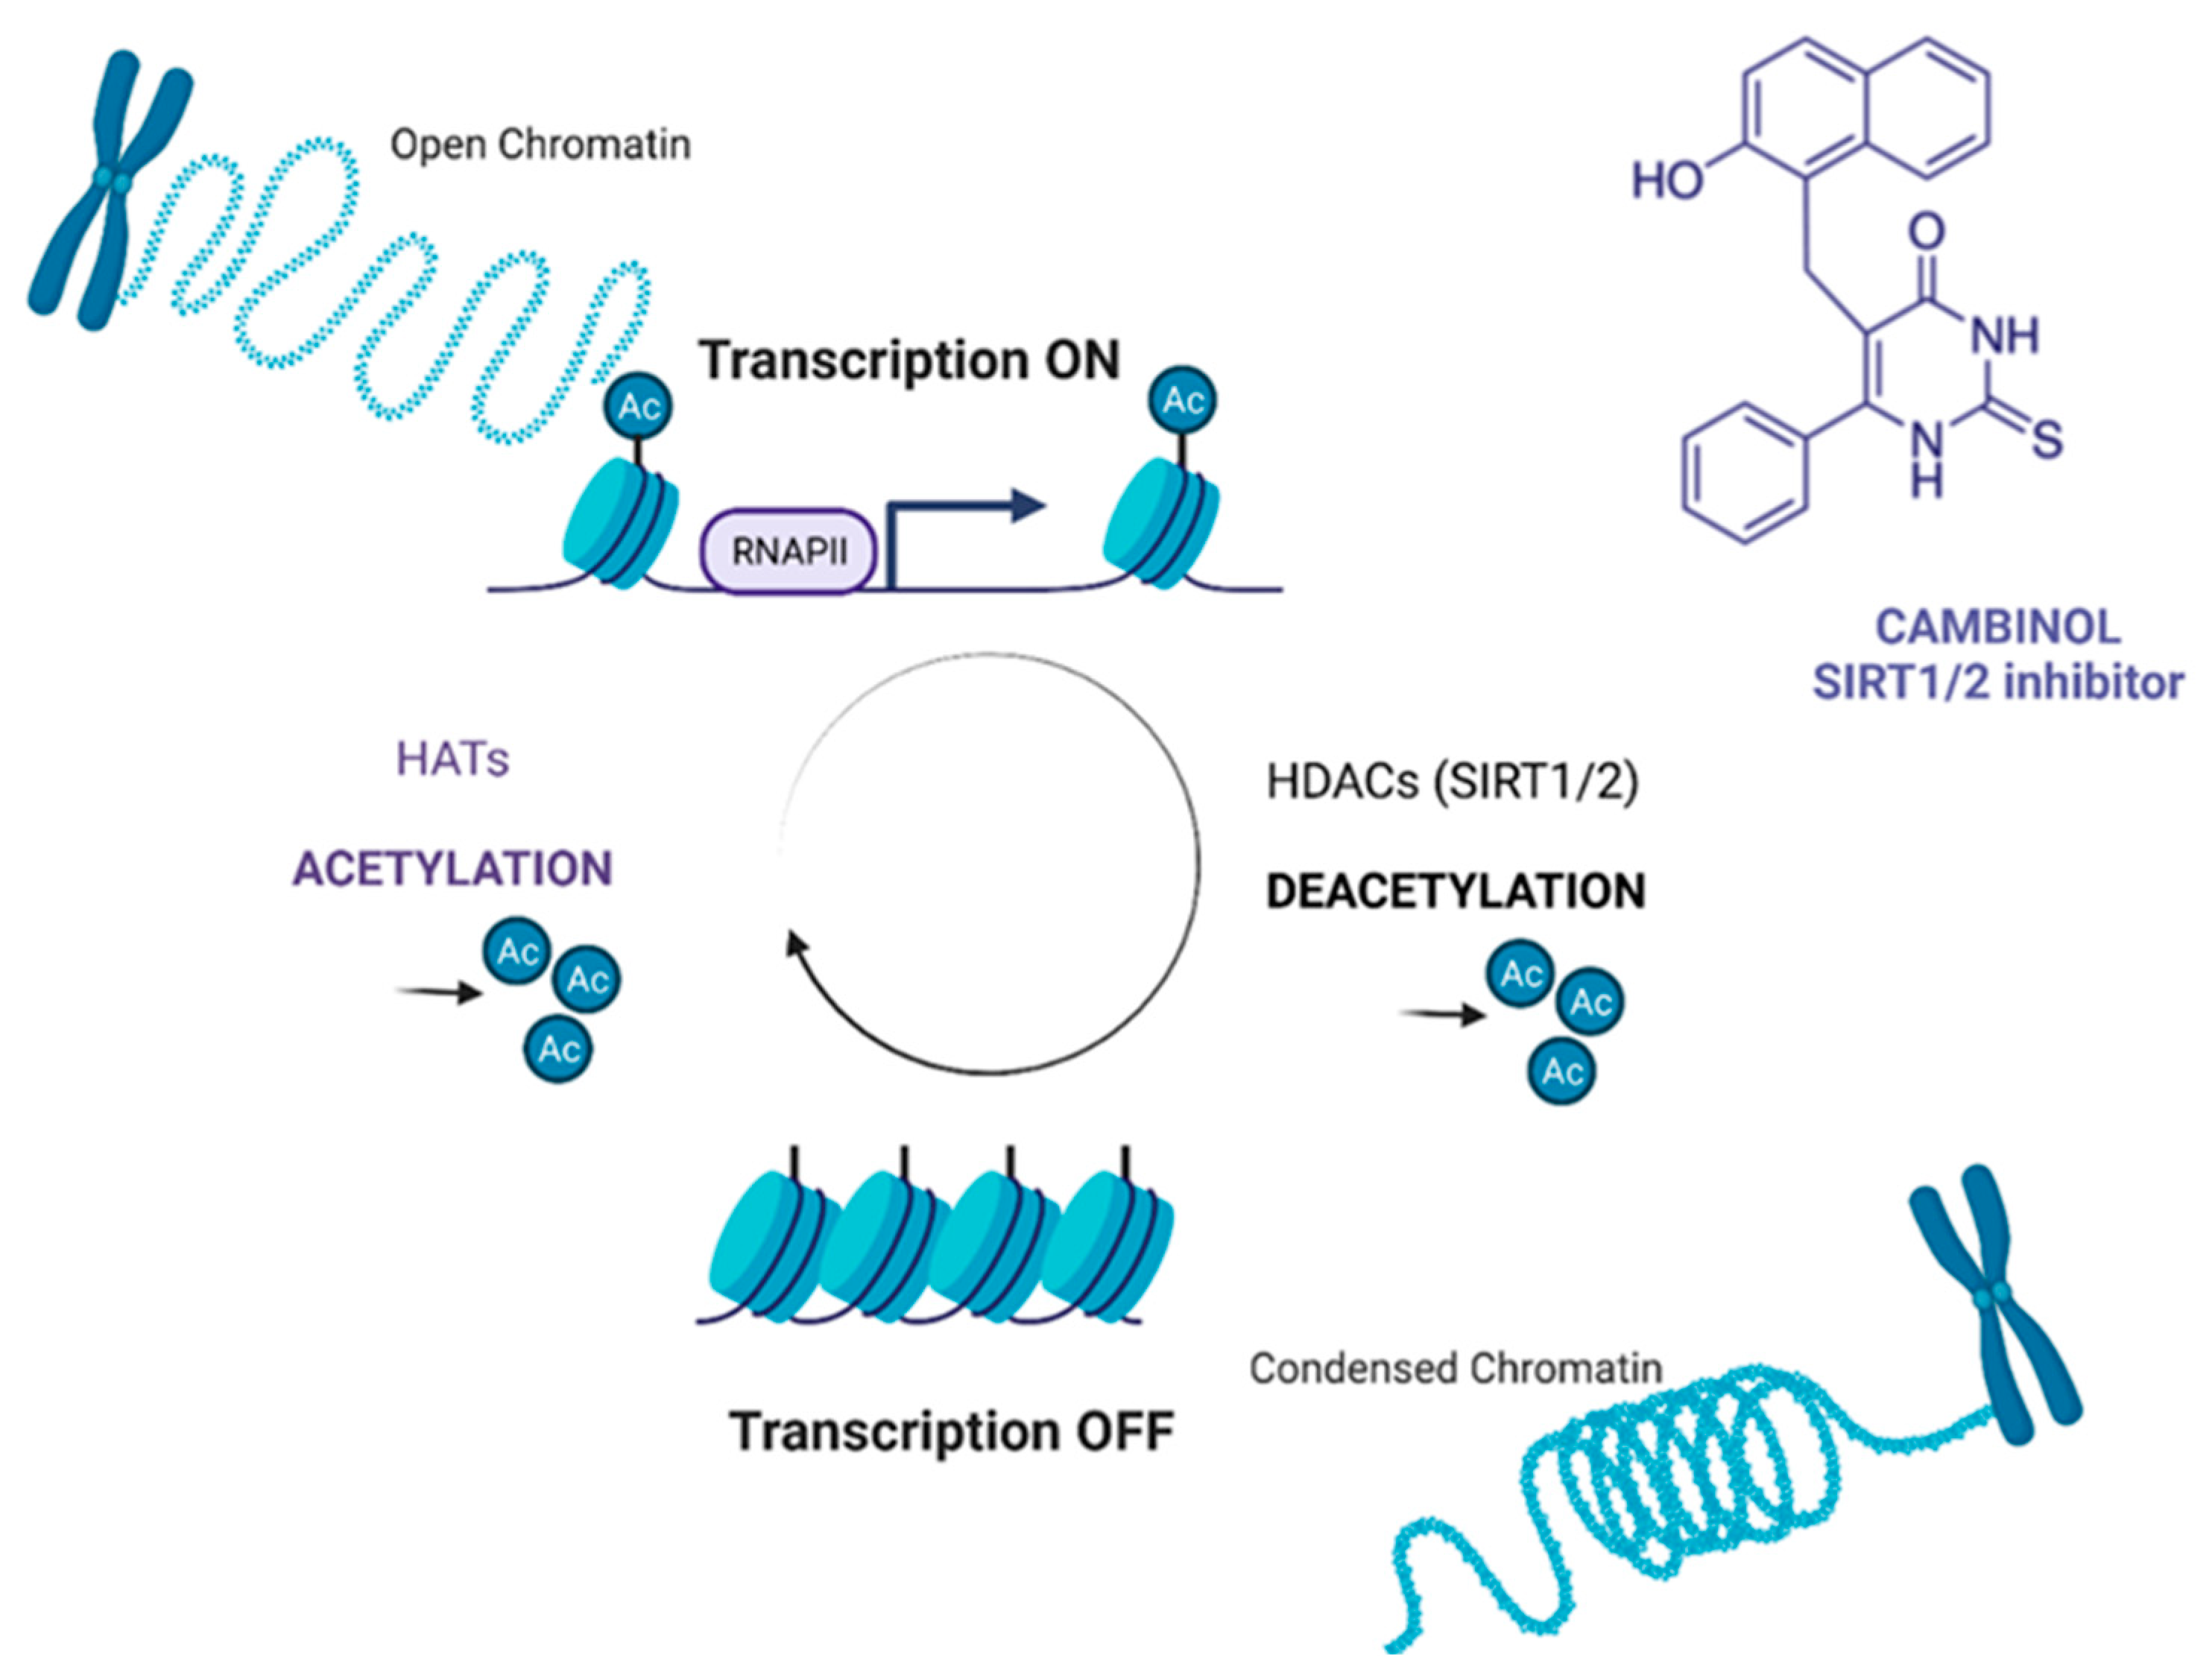
:1. Introduction
2. Results
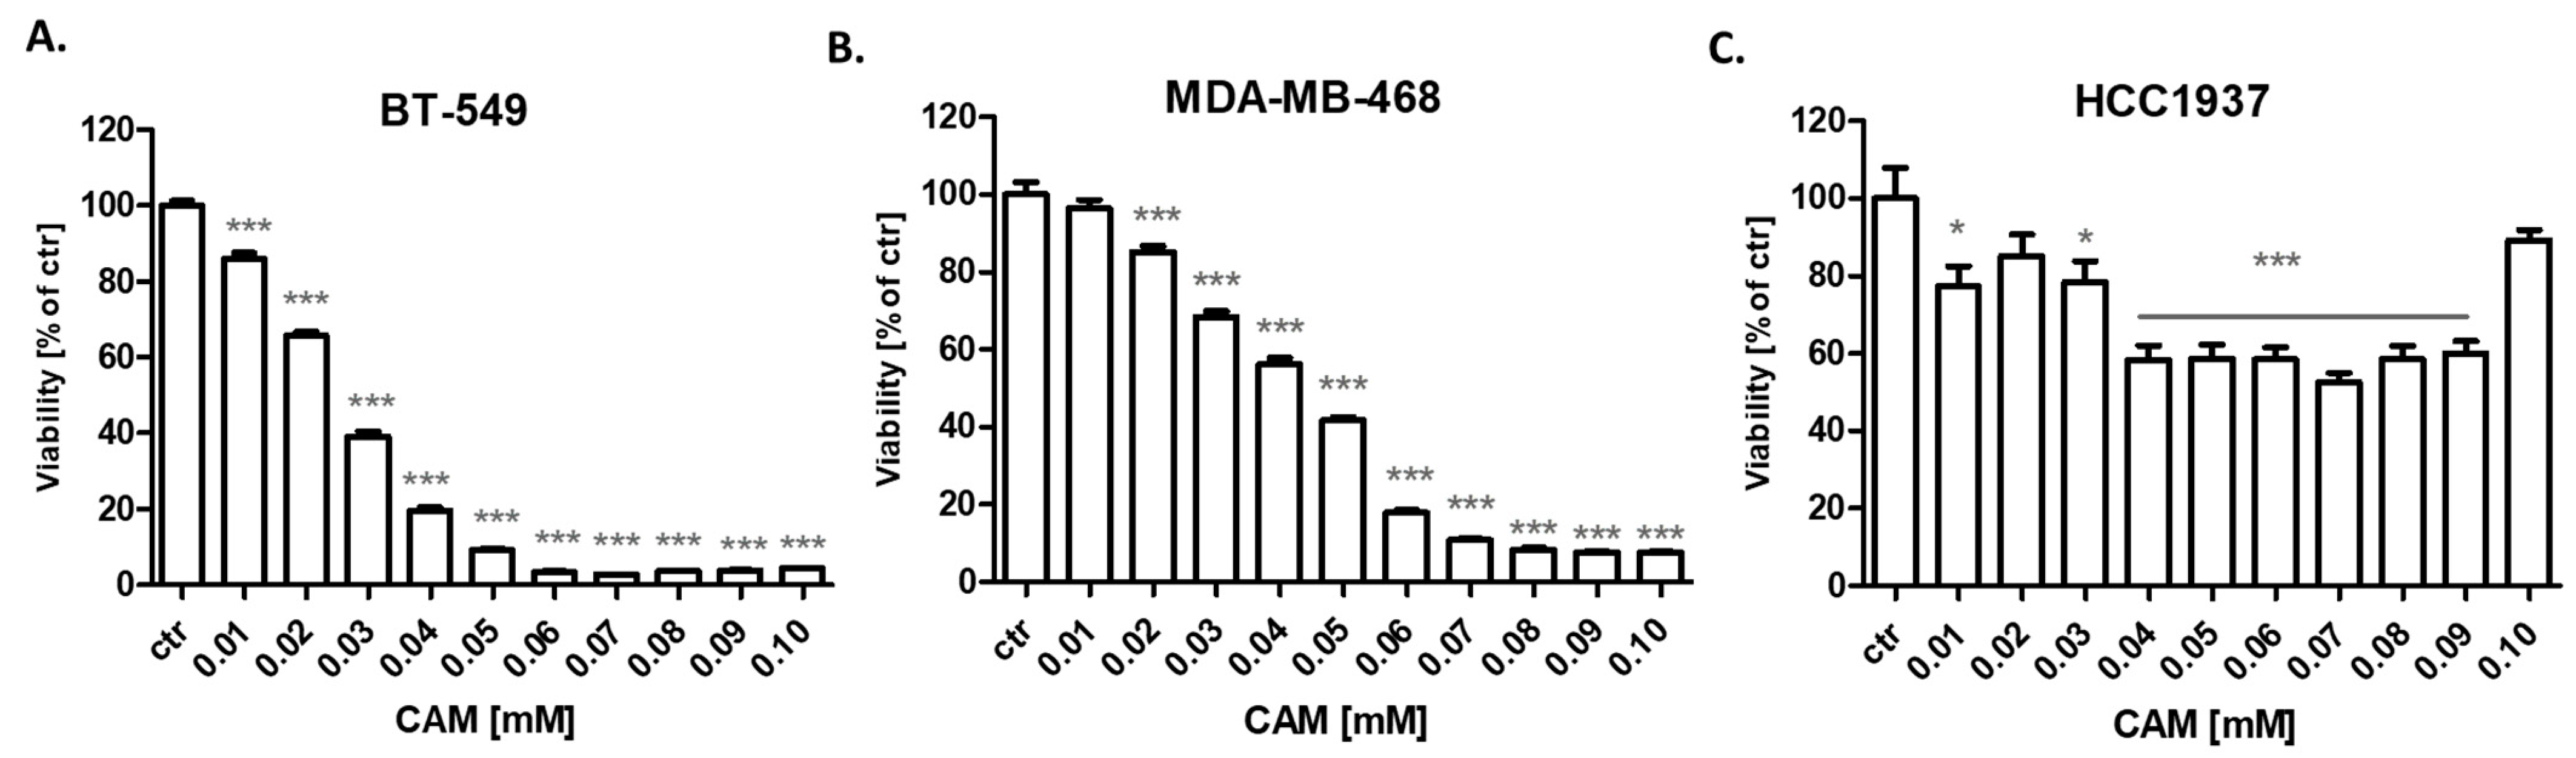
2.1. CAM and PAX Administered Alone or Combined Decrease Viability of BT-549 and MDA-MB-468 TNBC Cells
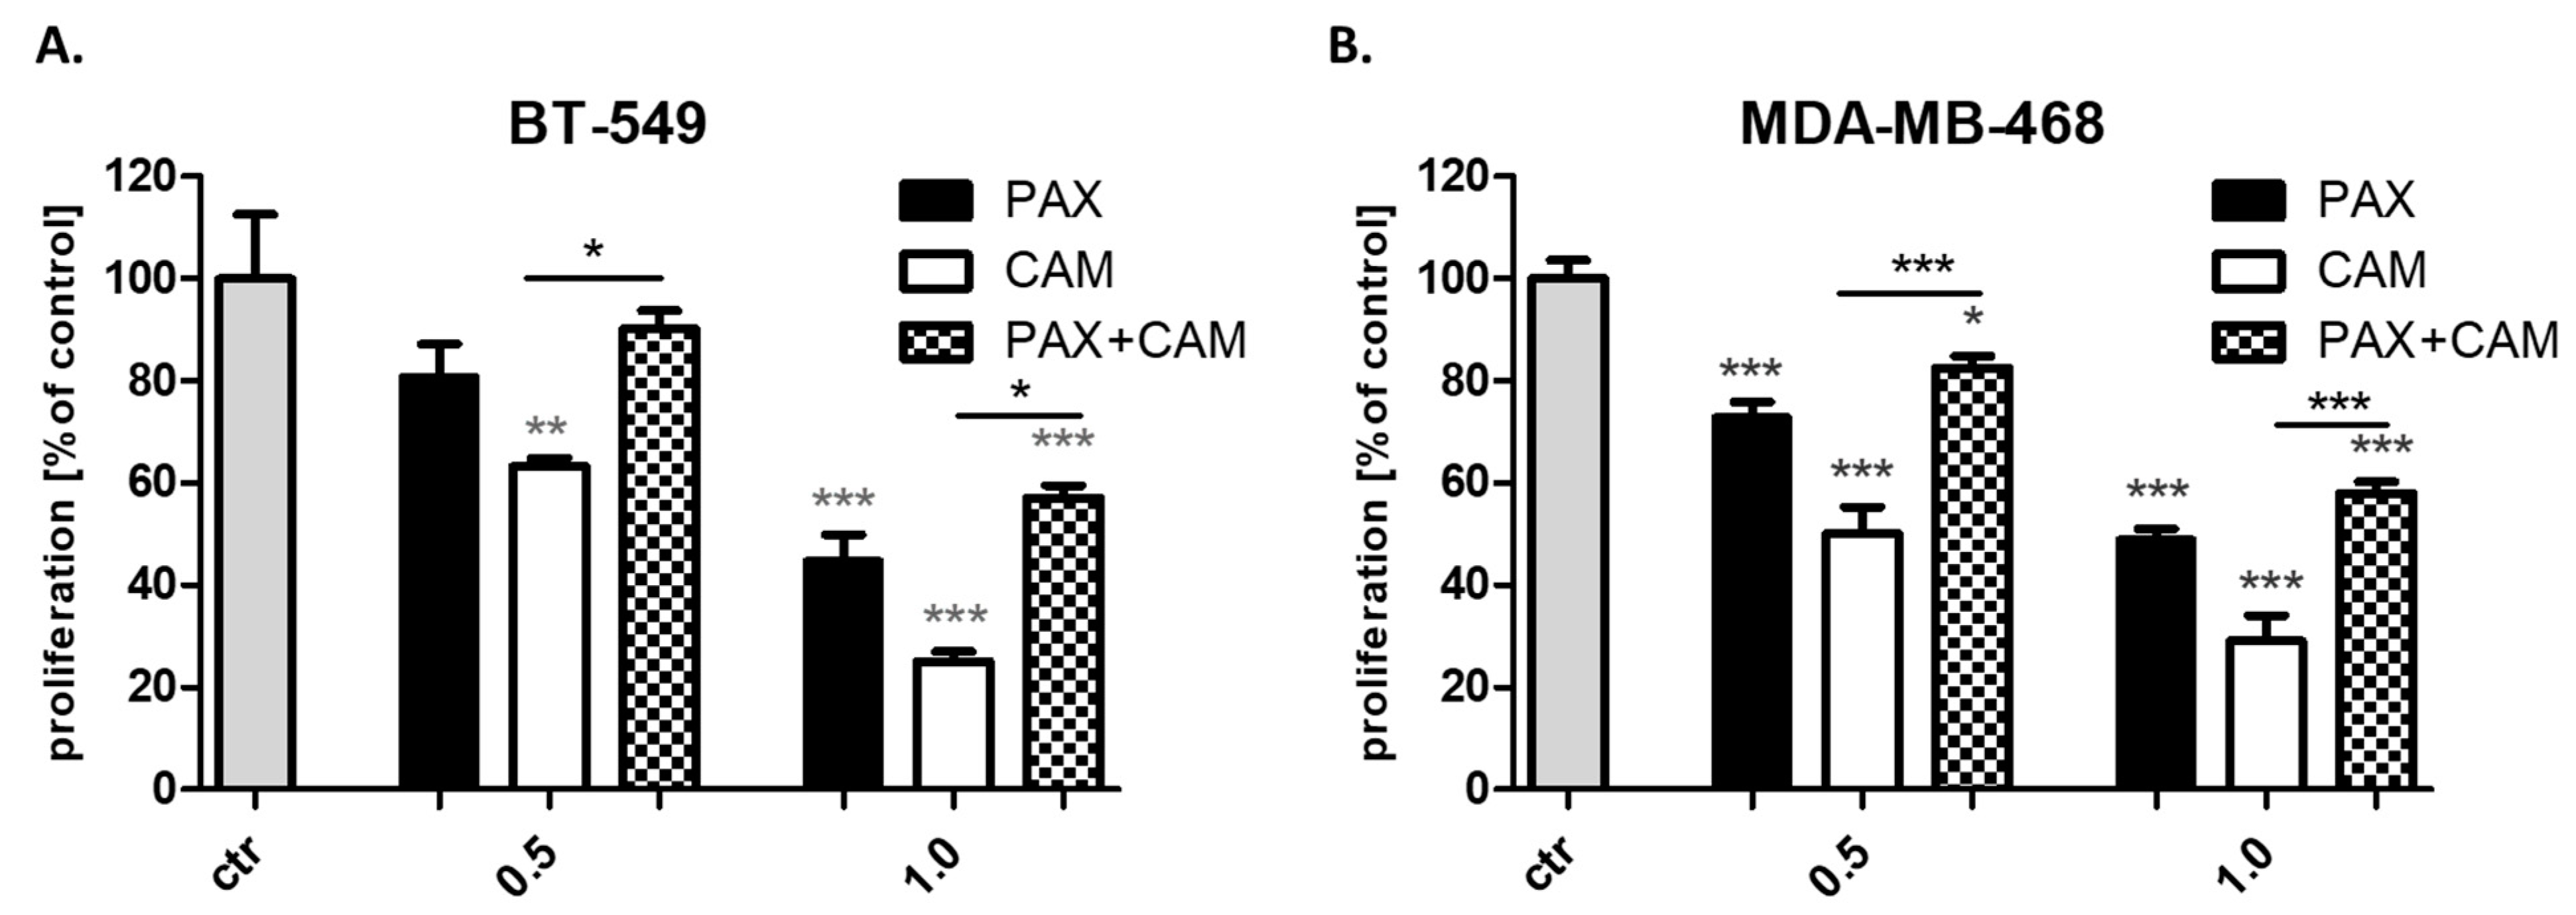
2.2. CAM and PAX Administered Alone or Combined Decrease Proliferation of BT-549, MDA-MB-468 and HCC1937 TNBC Cells
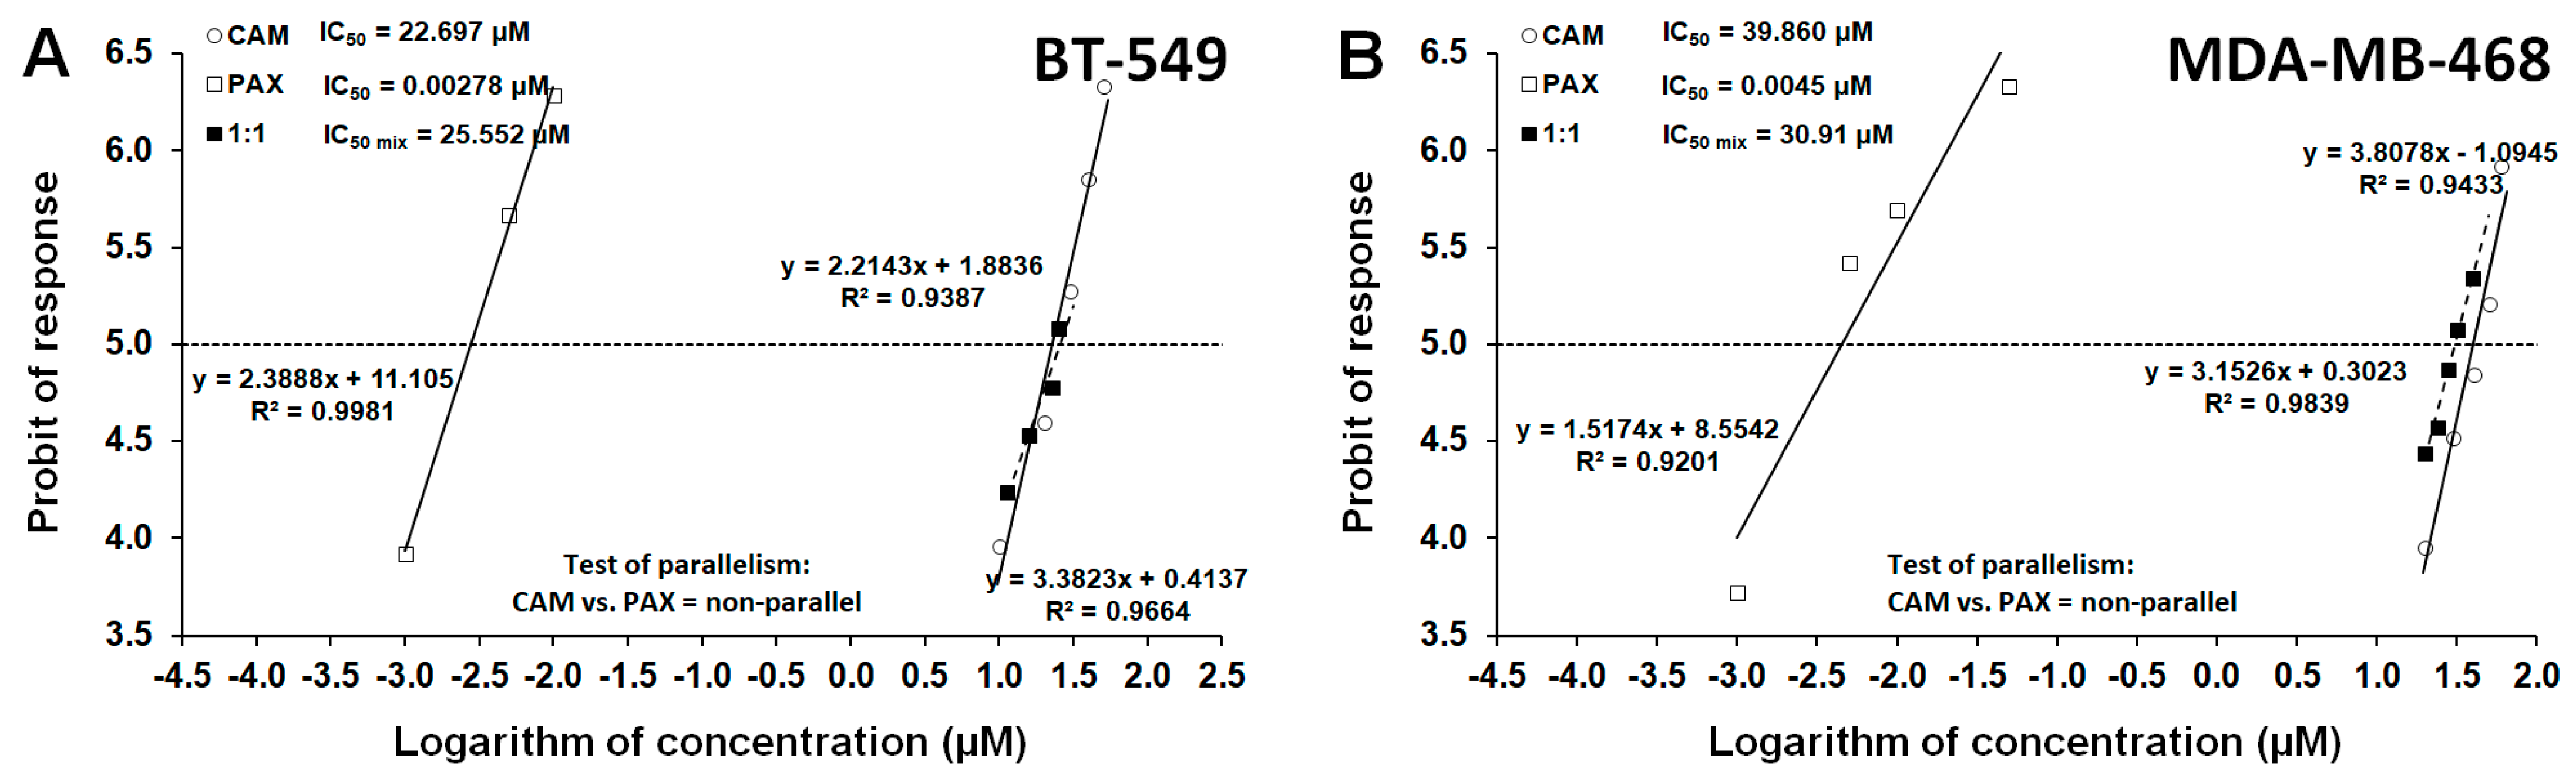
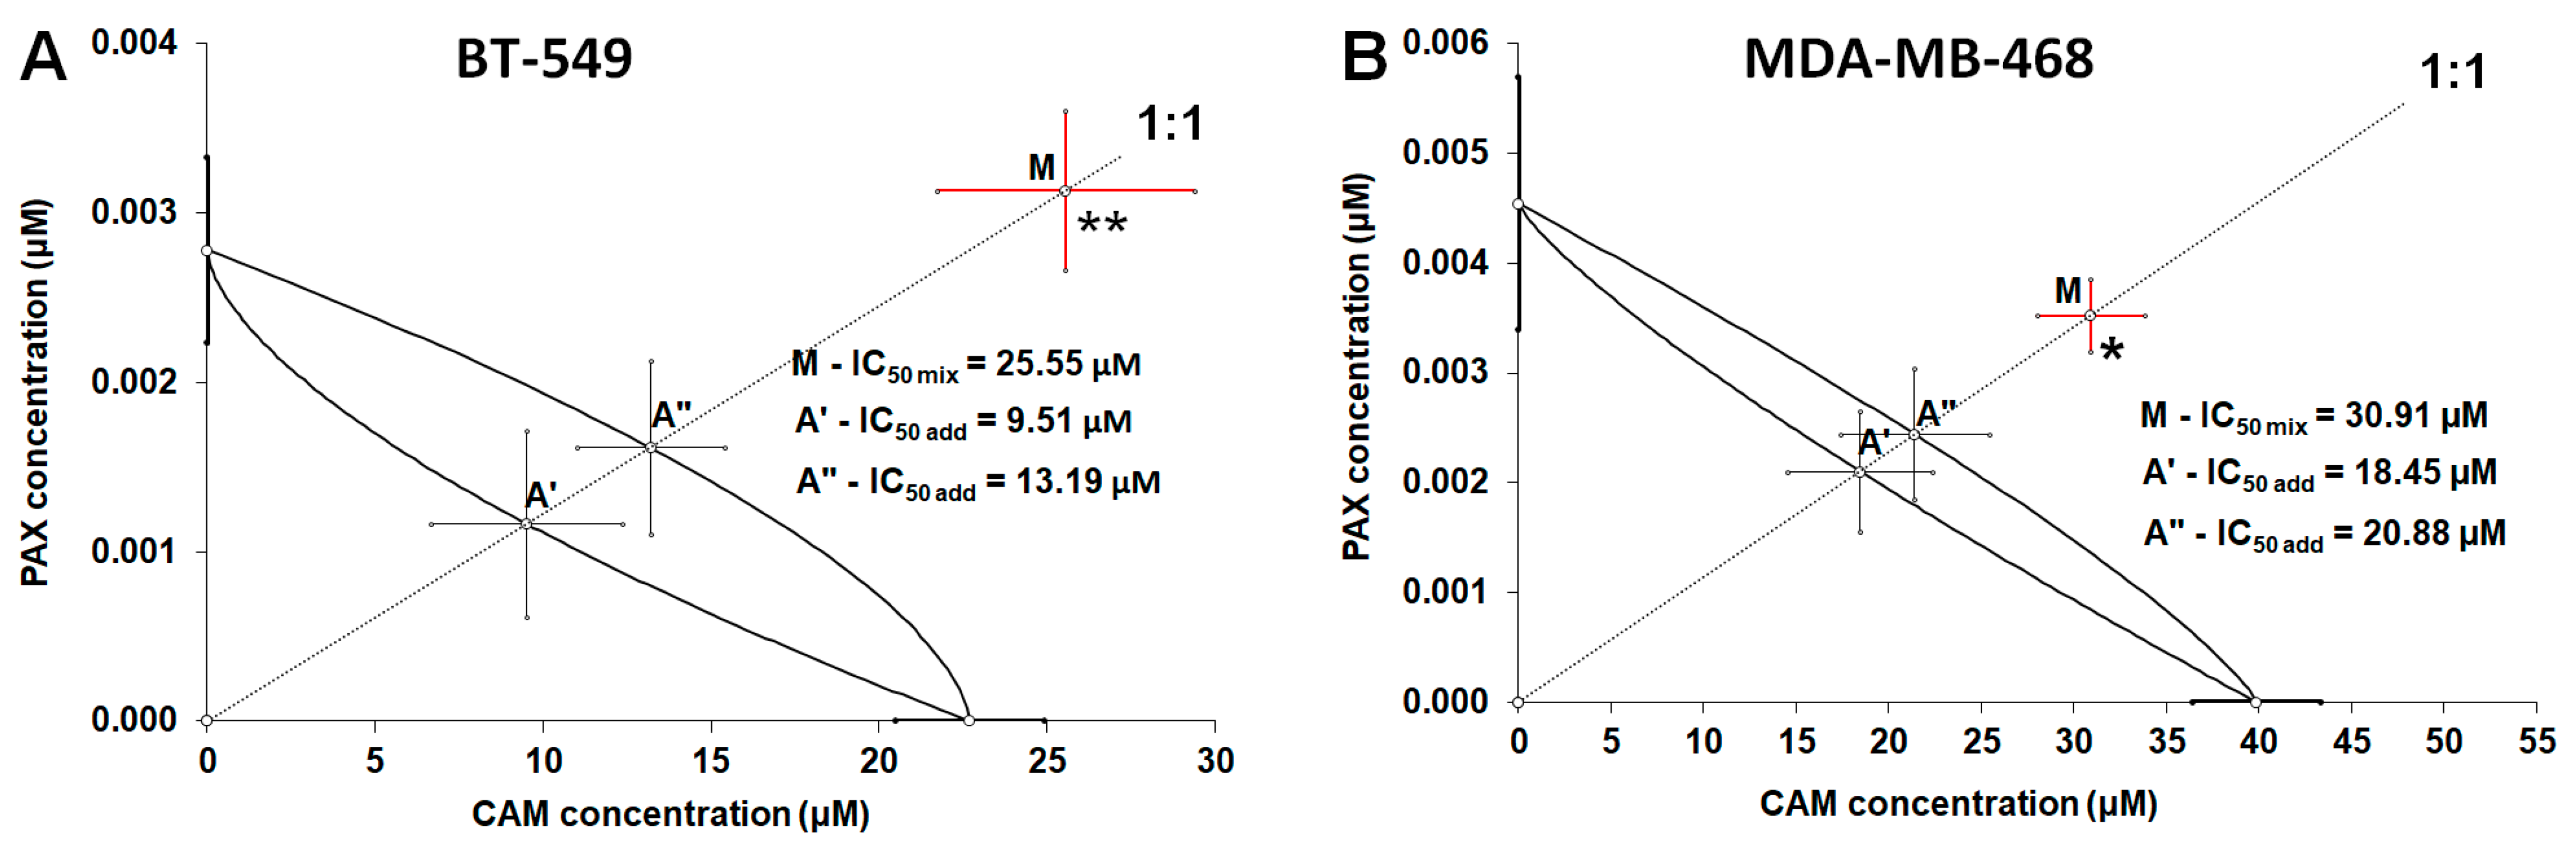
2.3. Isobolographic Analysis of Drug-Drug Pharmacological Interaction between CAM and PAX for Non-Parallel Concentration-Effect Curves in BT-549 and MDA-MB-468 TNBC Cells
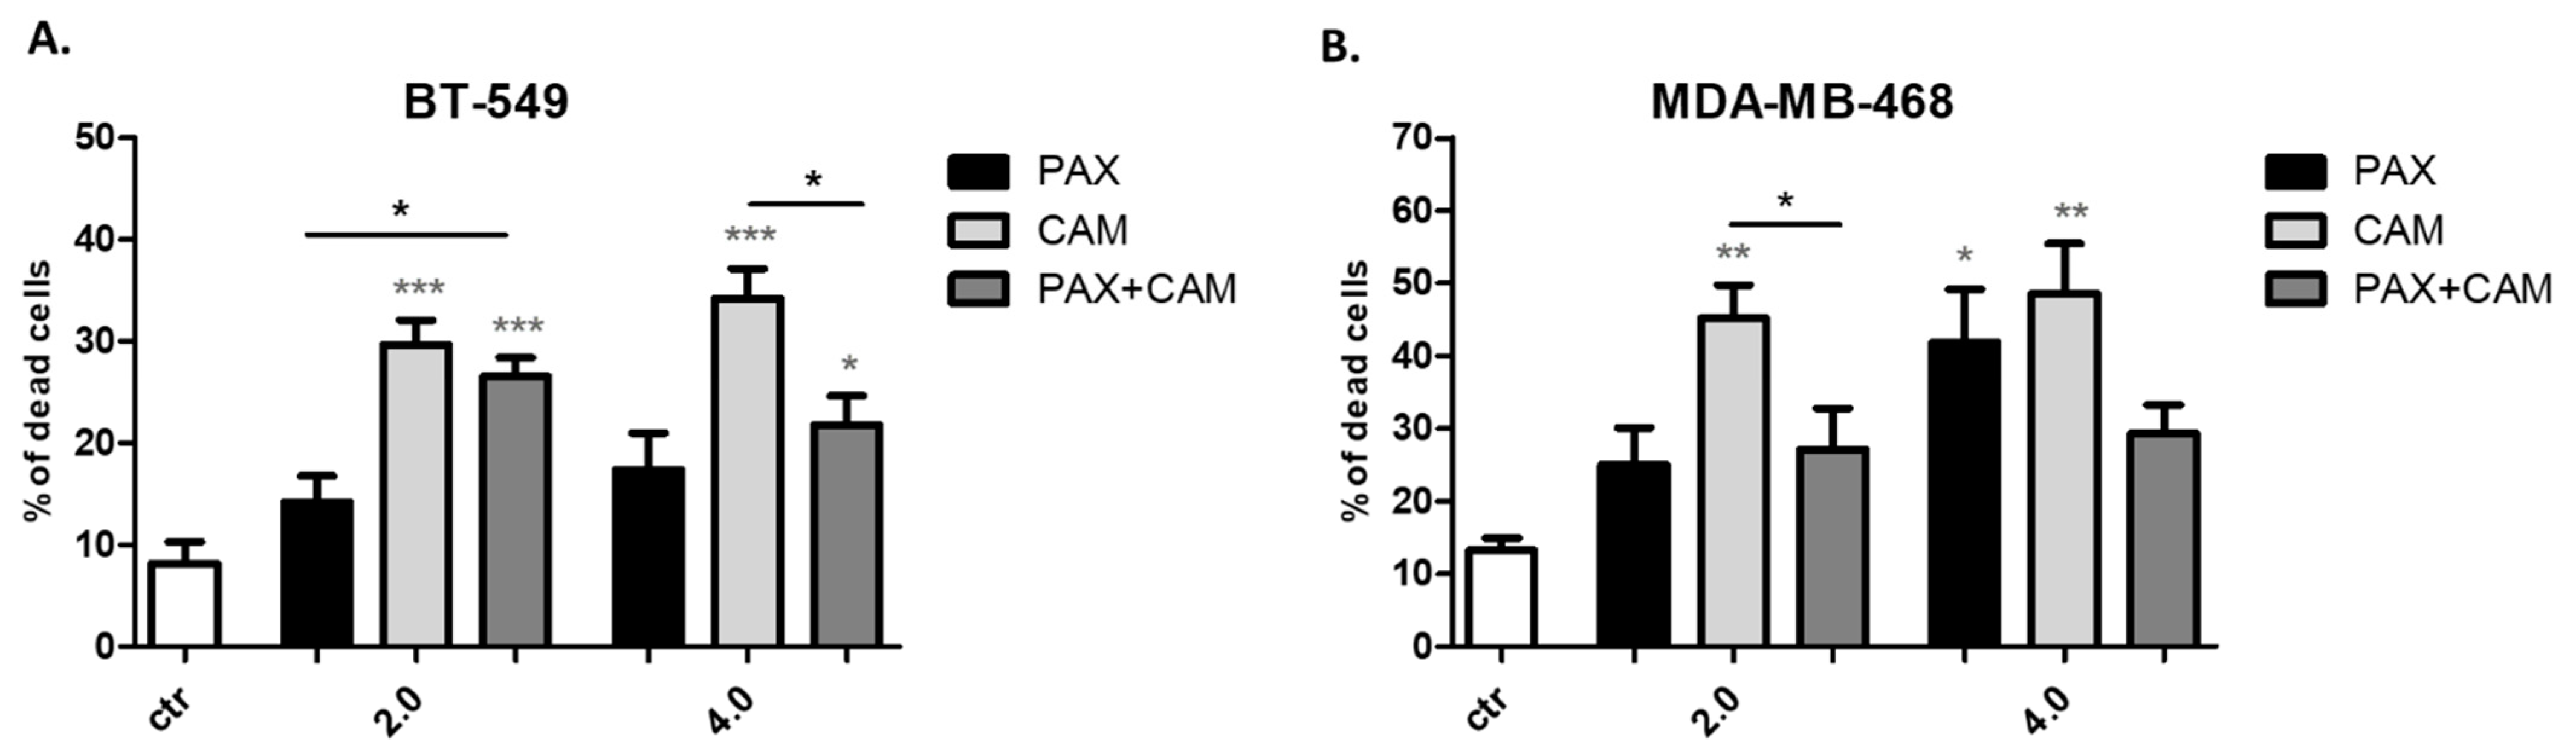
2.4. CAM and PAX Administered Individually Induce Cell Death, While the Administration in Combi-Nation Abolishes This Effect in BT-549 and MDA-MB-468 TNBC Cells
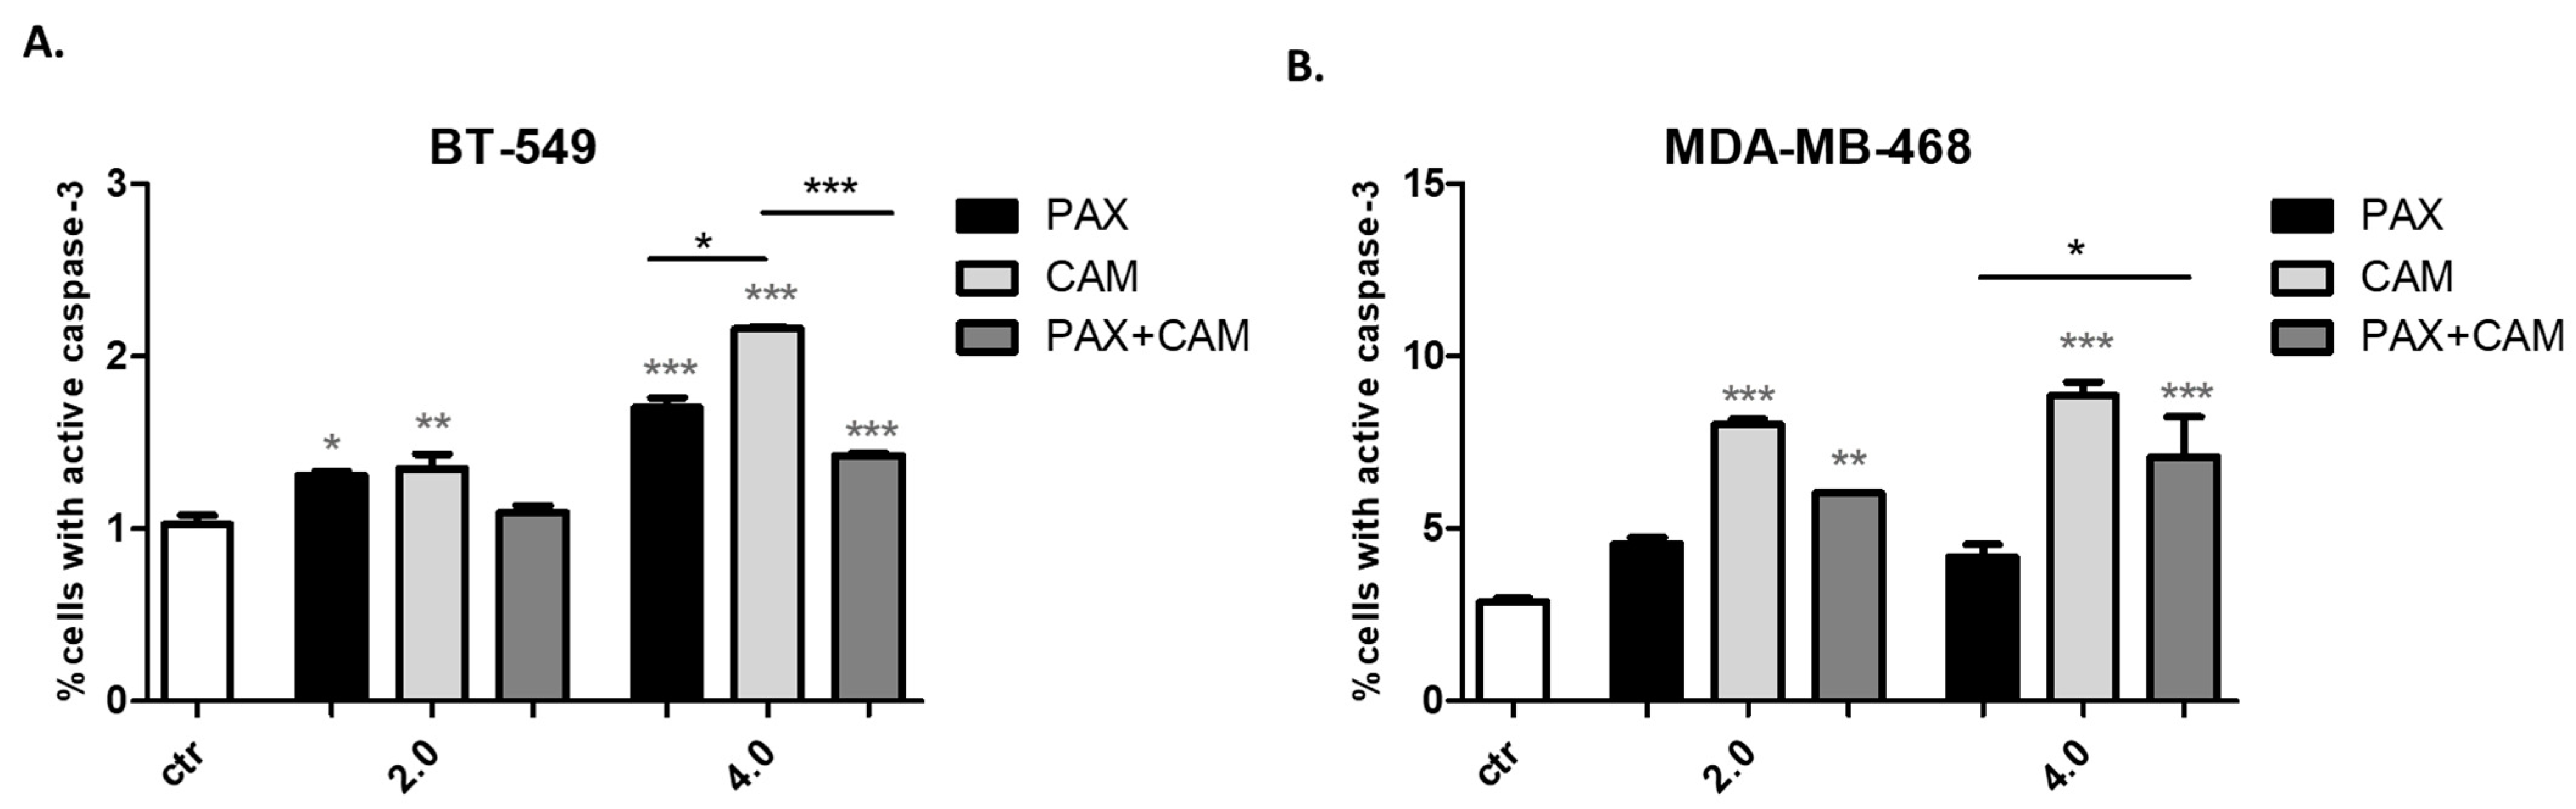
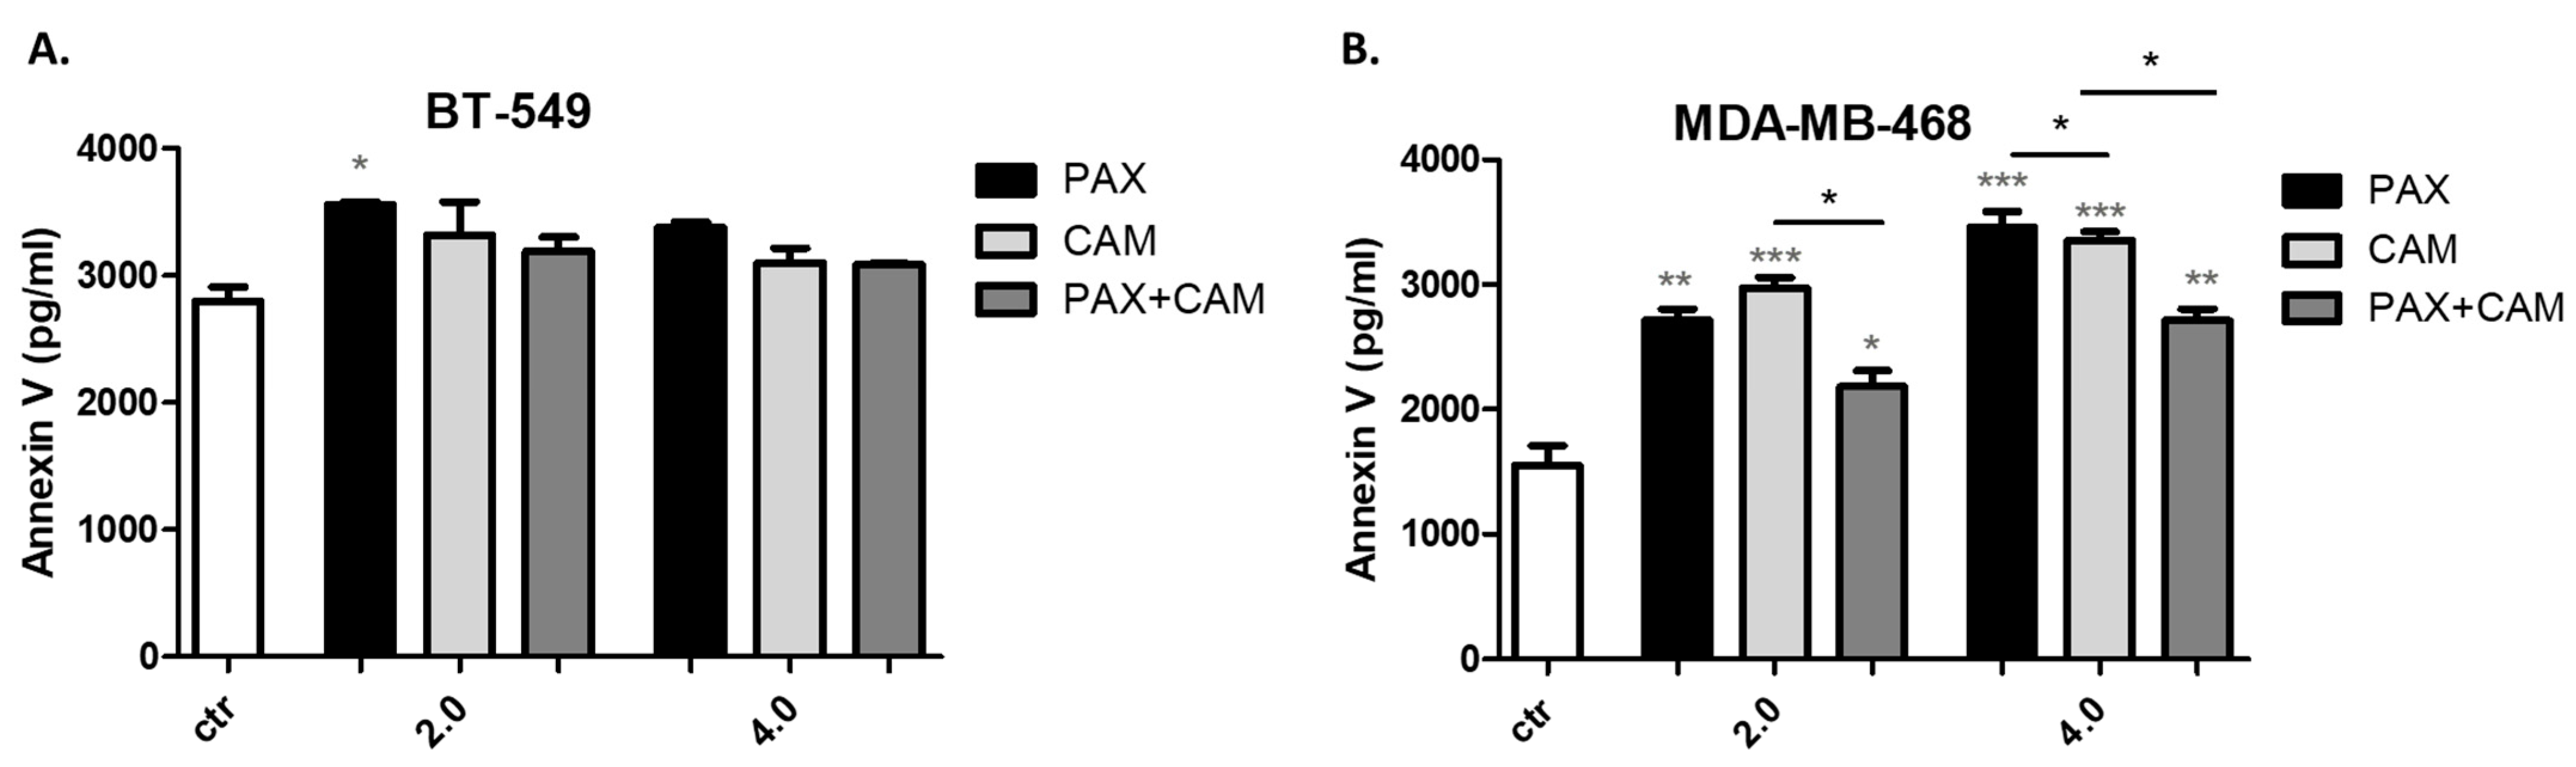
2.5. CAM and PAX Administered Individually Induce Apoptosis, While the Administration in Combination Abolishes This Effect in BT-549 and MDA-MB-468 TNBC Cells
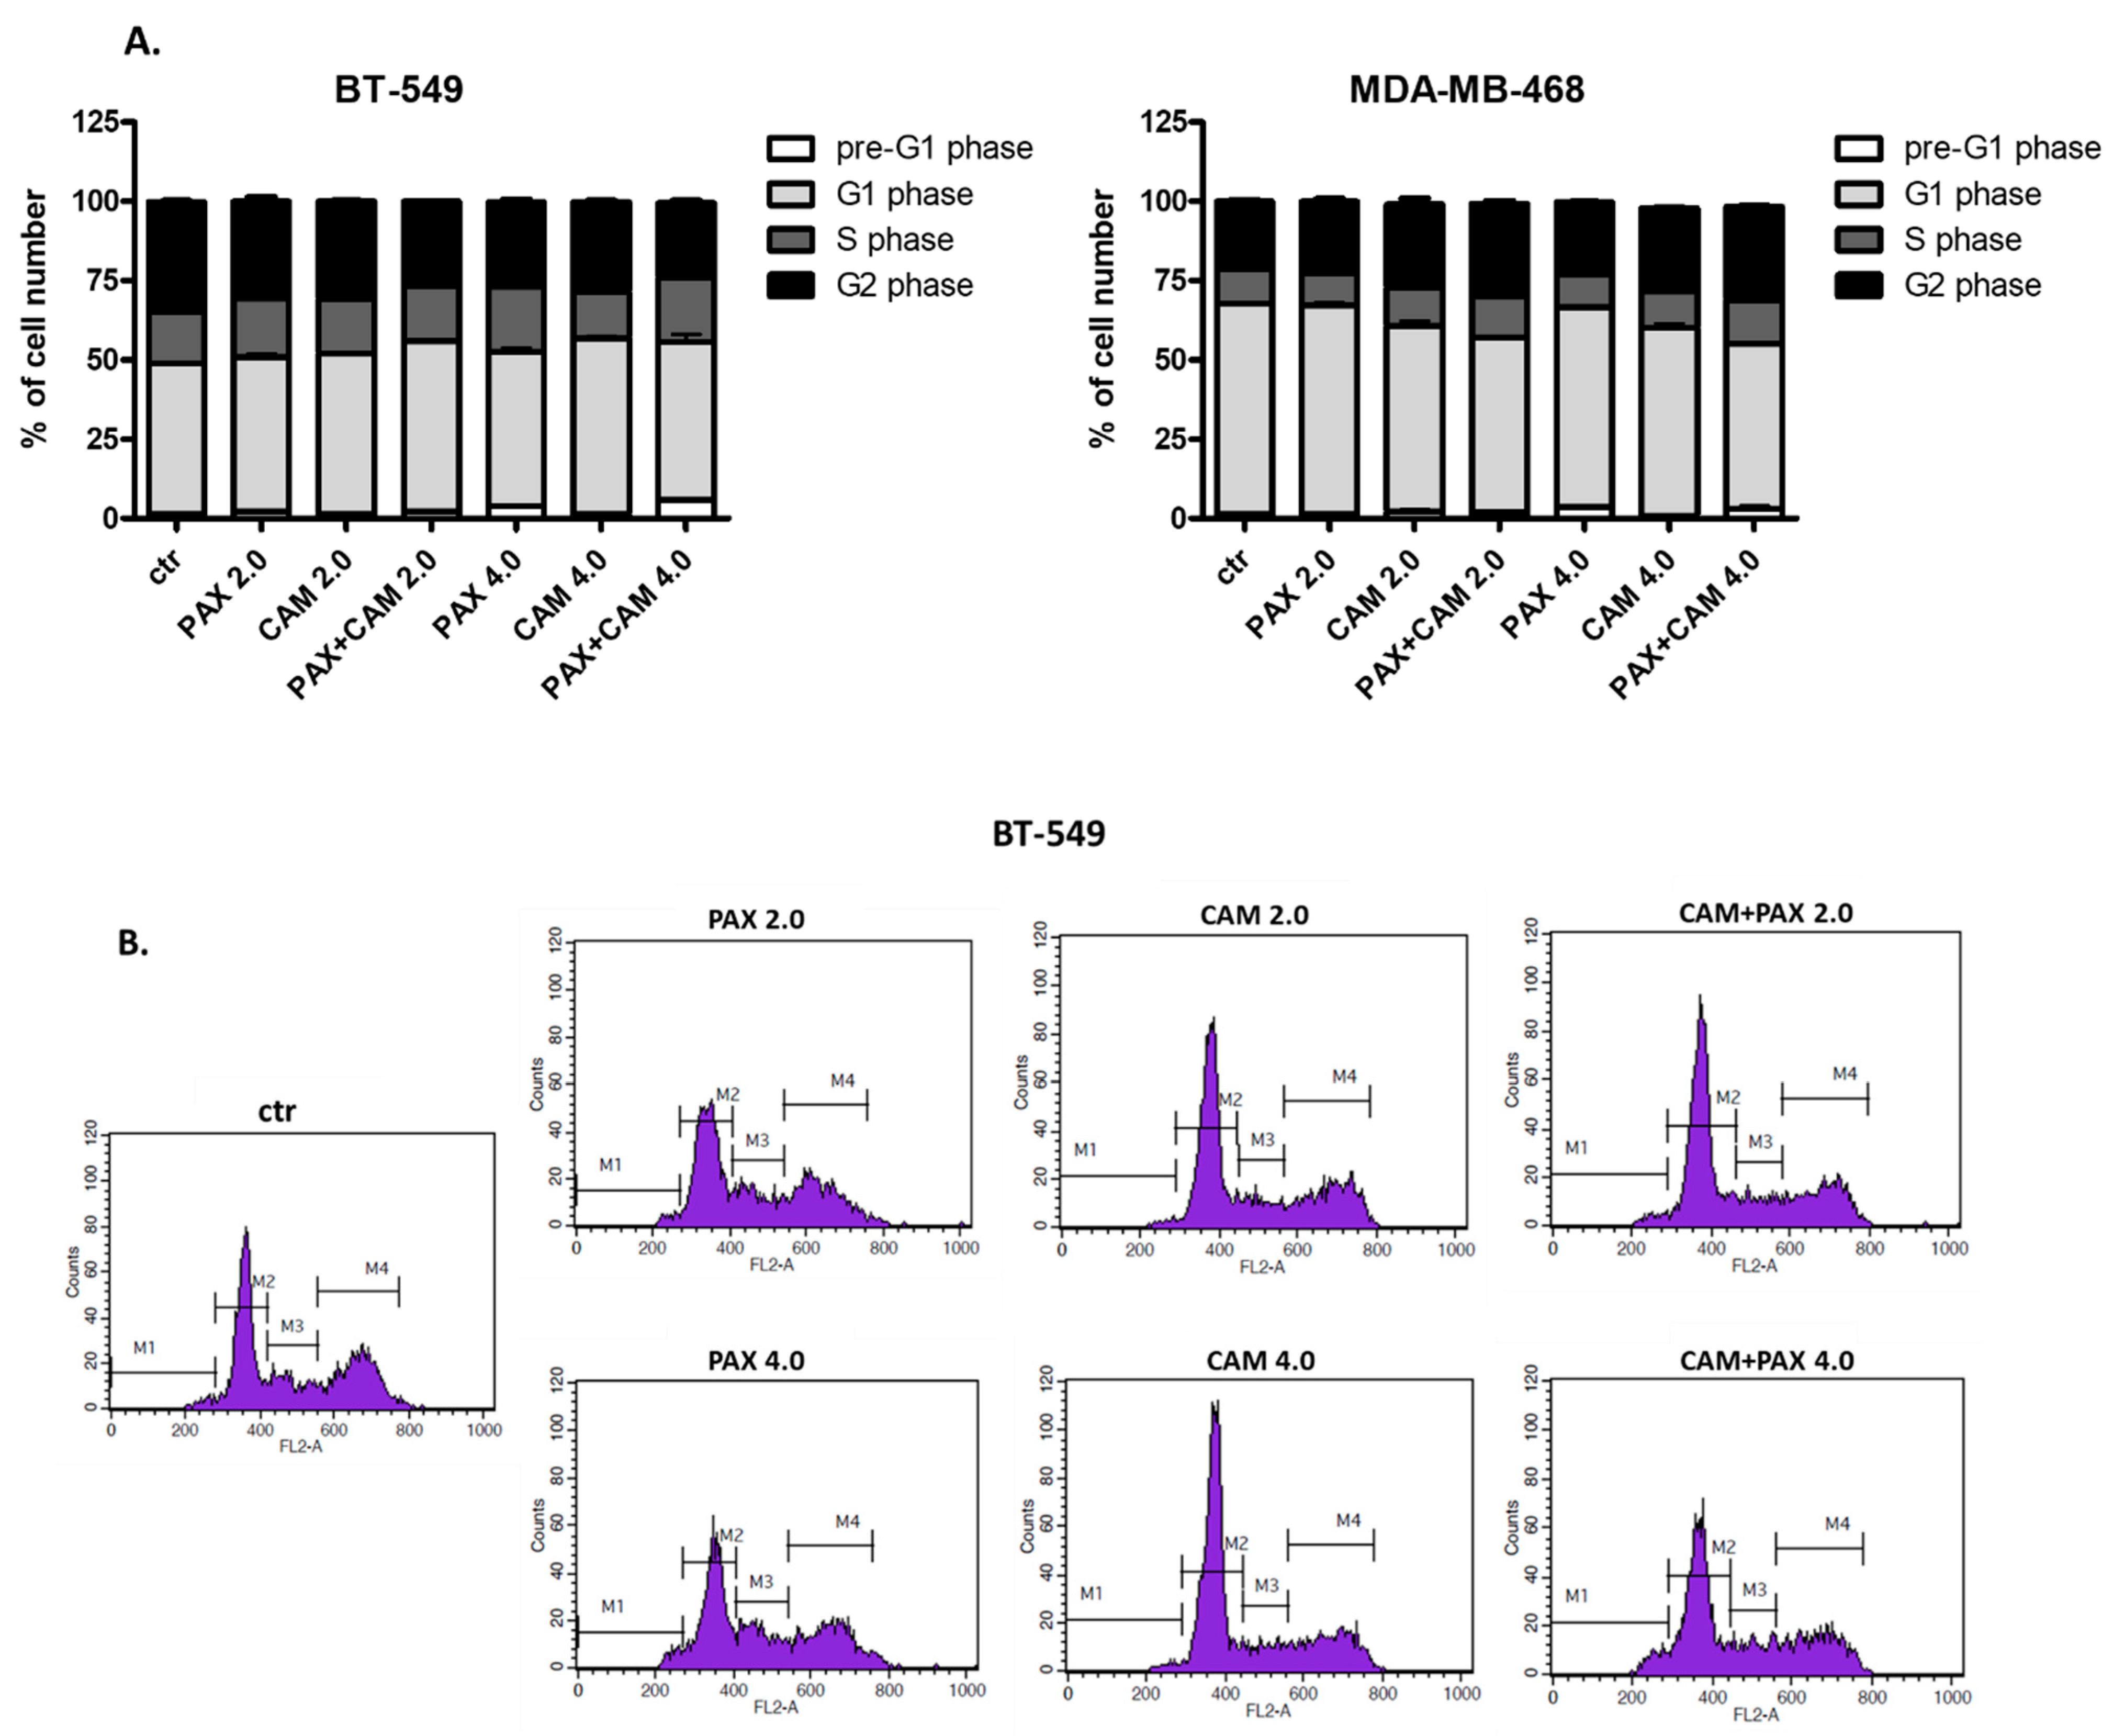
2.6. CAM and PAX Administered Singly and in Combination Induce Cell Cycle Arrest in the BT-549 and MDA-MB-468 BC Cells in a Cell-Dependent Manner
3. Discussion
4. Materials and Methods
4.1. Cell Culture
4.2. Cells Treatment
4.3. Cell Viability Assay (MTT)
4.4. Cell Proliferation Assay (ELISA BrdU)
4.5. Isobolographic Analysis
4.6. Trypan Blue Exclusion Assay
4.7. Assessment of Apoptosis (FACS Analysis)
4.8. Annexin V ELISA Assay
4.9. Cell Cycle Progression (FACS Analysis)
4.10. Statistics
Author Contributions
Funding
Institutional Review Board Statement
Informed Consent Statement
Data Availability Statement
Acknowledgments
Conflicts of Interest
References
- Tan, B.Y.; Lim, E.H.; Tan, P.H. Special Histologic Type and Rare Breast Tumors—Diagnostic Review and Clinico-Pathological Implications. Surg. Pathol. Clin. 2022, 15, 29–55. [Google Scholar] [CrossRef]
- Lau, K.H.; Tan, A.M.; Shi, Y. New and Emerging Targeted Therapies for Advanced Breast Cancer. Int. J. Mol. Sci. 2022, 23, 2288. [Google Scholar] [CrossRef]
- Yang, R.; Li, Y.; Wang, H.; Qin, T.; Yin, X.; Ma, X. Therapeutic progress and challenges for triple negative breast cancer: Targeted therapy and immunotherapy. Mol. Biomed. 2022, 3, 8. [Google Scholar] [CrossRef]
- Khasraw, M.; Bell, R.; Dang, C. Epirubicin: Is it like doxorubicin in breast cancer? A clinical review. Breast 2012, 21, 142–149. [Google Scholar] [CrossRef]
- Tian, H.; Ma, D.; Tan, X.; Yan, W.; Wu, X.; He, C.; Zhong, L.; Zhang, Y.; Yu, B.; Zhang, Y.; et al. Platinum and Taxane Based Adjuvant and Neoadjuvant Chemotherapy in Early Triple-Negative Breast Cancer: A Narrative Review. Front. Pharmacol. 2021, 12, 770663. [Google Scholar] [CrossRef]
- Mustacchi, G.; de Laurentiis, M. The role of taxanes in triple-negative breast cancer: Literature review. Drug Des. Dev. Ther. 2015, 9, 4303–4318. [Google Scholar] [CrossRef] [Green Version]
- Lynce, F.; Nunes, R. Role of Platinums in Triple-Negative Breast Cancer. Curr. Oncol. Rep. 2021, 23, 50. [Google Scholar] [CrossRef]
- Zhu, Y.; Hu, Y.; Tang, C.; Guan, X.; Zhang, W. Platinum-based systematic therapy in triple-negative breast cancer. Biochim. Biophys. Acta Rev. Cancer 2022, 1877, 188678. [Google Scholar] [CrossRef]
- Lemaitre, F.; Goirand, F.; Launay, M.; Chatelut, E.; Boyer, J.C.; Evrard, A.; Paludetto, M.N.; Guilhaumou, R.; Ciccolini, J.; Schmitt, A. 5-fluorouracil therapeutic drug monitoring: Update and recommendations of the STP-PT group of the SFPT and the GPCO-Unicancer. Bull. Cancer 2018, 105, 790–803. [Google Scholar] [CrossRef]
- Faruk, M. Breast cancer resistance to chemotherapy: When should we suspect it and how can we prevent it? Ann. Med. Surg. 2021, 70, 102793. [Google Scholar]
- Mandumpala, J.J.; Baby, S.; Tom, A.A.; Godugu, C.; Shankaraiah, N. Role of histone demethylases and histone methyltransferases in triple-negative breast cancer: Epigenetic mnemonics. Life Sci. 2022, 292, 715. [Google Scholar] [CrossRef]
- Idrissou, M.; Sanchez, A.; Penault-Llorca, F.; Bignon, Y.J.; Bernard-Gallon, D. Epi-drugs as triple-negative breast cancer treatment. Epigenomics 2020, 12, 725–742. [Google Scholar] [CrossRef]
- Daśko, M.; de Pascual-Teresa, B.; Ortín, I.; Ramos, A. HDAC Inhibitors: Innovative Strategies for Their Design and Applications. Molecules 2022, 27, 715. [Google Scholar] [CrossRef]
- Sinha, S.; Sharma, S.; Vora, J.; Shrivastava, N. Emerging role of sirtuins in breast cancer metastasis and multidrug resistance: Implication for novel therapeutic strategies targeting sirtuins. Pharmacol. Res. 2020, 158, 104880. [Google Scholar] [CrossRef]
- Kejík, Z.; Jakubek, M.; Kaplánek, R.; Králová, J.; Mikula, I.; Martásek, P.; Král, V. Epigenetic agents in combined anticancer therapy. Future Med. Chem. 2018, 10, 1113–1130. [Google Scholar] [CrossRef]
- Shen, M.; Pan, H.; Chen, Y.; Xu, Y.H.; Yang, W.; Wu, Z. A review of current progress in triple-negative breast cancer therapy. Open Med. 2020, 15, 1143–1149. [Google Scholar] [CrossRef]
- Heltweg, B.; Gatbonton, T.; Schuler, A.D.; Posakony, J.; Li, H.; Goehle, S.; Kollipara, R.; DePinho, R.A.; Gu, Y.; Simon, J.A.; et al. Antitumor Activity of a Small-Molecule Inhibitor of Human Silent Information Regulator 2 Enzymes. Cancer Res. 2006, 66, 4368–4377. [Google Scholar] [CrossRef] [Green Version]
- Wawruszak, A.; Luszczki, J.; Czerwonka, A.; Okon, E.; Stepulak, A. Assessment of Pharmacological Interactions between SIRT2 Inhibitor AGK2 and Paclitaxel in Different Molecular Subtypes of Breast Cancer Cells. Cells 2022, 11, 1211. [Google Scholar] [CrossRef]
- Florek-Luszczki, M.; Wlaz, A.; Luszczki, J.J. Interactions of levetiracetam with carbamazepine, phenytoin, topiramate and vigabatrin in the mouse 6Hz psychomotor seizure model—A type II isobolographic analysis. Eur. J. Pharmacol. 2014, 723, 410–418. [Google Scholar] [CrossRef]
- Huang, R.Y.; Pei, L.; Liu, Q.; Chen, S.; Dou, H.; Shu, G.; Yuan, Z.X.; Lin, J.; Peng, G.; Zhang, W.; et al. Isobologram analysis: A comprehensive review of methodology and current research. Front. Pharmacol. 2019, 10, 1222. [Google Scholar] [CrossRef]
- Sühnel, J. Parallel dose-response curves in combination experiments. Bull. Math. Biol. 1998, 60, 197–213. [Google Scholar] [CrossRef] [Green Version]
- Berenbaum, M.C. What is synergy? Pharmacol. Rev. 1989, 2, 93–141. [Google Scholar]
- Tallarida, R.J. Drug Combinations: Tests and Analysis with Isoboles. Curr. Protoc. Pharmacol. 2016, 72, 9.19.1–9.19.19. [Google Scholar] [CrossRef] [Green Version]
- Loewe, S. The problem of synergism and antagonism of combined drugs. Arzneimittelforschung 1953, 6, 285–290. [Google Scholar]
- Luszczki, J.J.; Ratnaraj, N.; Patsalos, P.N.; Czuczwar, S.J. Isobolographic analysis of interactions between loreclezole and conventional antiepileptic drugs in the mouse maximal electroshock-induced seizure model. Naunyn-Schmiedeberg’s Arch. Pharmacol. 2006, 373, 169–181. [Google Scholar] [CrossRef]
- Luszczki, J.J. Isobolographic analysis of interaction between drugs with nonparallel dose-response relationship curves: A practical application. Naunyn-Schmiedeberg’s Arch. Pharmacol. 2007, 375, 105–114. [Google Scholar] [CrossRef]
- Raha, P.; Thomas, S.; Thurn, K.T.; Park, J.; Munster, P.N. Combined histone deacetylase inhibition and tamoxifen induces apoptosis in tamoxifen-resistant breast cancer models, by reversing Bcl-2 overexpression. Breast Cancer Res. 2015, 17, 26. [Google Scholar] [CrossRef] [Green Version]
- Chiu, H.W.; Yeh, Y.L.; Wang, Y.C.; Huang, W.J.; Chen, Y.A.; Chiou, Y.S.; Ho, S.Y.; Lin, P.; Wang, Y.J. Suberoylanilide Hydroxamic Acid, an Inhibitor of Histone Deacetylase, Enhances Radiosensitivity and Suppresses Lung Metastasis in Breast Cancer In Vitro and In Vivo. PLoS ONE 2013, 8, e76340. [Google Scholar] [CrossRef] [Green Version]
- Wawruszak, A.; Luszczki, J.J.; Grabarska, A.; Gumbarewicz, E.; Dmoszynska-Graniczka, M.; Polberg, K.; Stepulak, A. Assessment of Interactions between Cisplatin and Two Histone Deacetylase Inhibitors in MCF7, T47D and MDA-MB-231 Human Breast Cancer Cell Lines—An Isobolographic Analysis. PLoS ONE 2015, 10, e0143013. [Google Scholar] [CrossRef] [Green Version]
- Simmons, G.E.; Pandey, S.; Nedeljkovic-Kurepa, A.; Saxena, M.; Wang, A.; Pruitt, K. Frizzled 7 expression is positively regulated by SIRT1 and β-catenin in breast cancer cells. PLoS ONE 2014, 9, e98861. [Google Scholar] [CrossRef]
- Lu, D.; Qu, L.; Wang, C.; Luo, H.; Li, S.; Yin, F.; Liu, X.; Chen, X.; Luo, Z.; Cui, N.; et al. Harmine-based dual inhibitors targeting histone deacetylase (HDAC) and DNA as a promising strategy for cancer therapy. Bioorg. Chem. 2022, 120, 105604. [Google Scholar] [CrossRef]
- Portmann, S.; Fahrner, R.; Lechleiter, A.; Keogh, A.; Overney, S.; Laemmle, A.; Mikami, K.; Montani, M.; Tschan, M.P.; Candinas, D.; et al. Antitumor effect of SIRT1 inhibition in human HCC tumor models in vitro and in vivo. Mol. Cancer Ther. 2013, 12, 499–508. [Google Scholar] [CrossRef] [Green Version]
- Stenzinger, A.; Endris, V.; Klauschen, F.; Sinn, B.; Lorenz, K.; Warth, A.; Goeppert, B.; Ehemann, V.; Muckenhuber, A.; Kamphues, C.; et al. High SIRT1 expression is a negative prognosticator in pancreatic ductal adenocarcinoma. BMC Cancer 2013, 13, 450. [Google Scholar] [CrossRef] [Green Version]
- Chowdhury, S.; Sripathy, S.; Webster, A.; Park, A.; Lao, U.; Hsu, J.H.; Loe, T.; Bedalov, A.; Simon, J.A. Discovery of Selective SIRT2 Inhibitors as Therapeutic Agents in B-Cell Lymphoma and Other Malignancies. Molecules 2020, 25, 455. [Google Scholar] [CrossRef] [Green Version]
- Hałasa, M.; Łuszczki, J.J.; Dmoszyńska-graniczka, M.; Baran, M.; Okoń, E.; Stepulak, A.; Wawruszak, A. Antagonistic Interaction between Histone Deacetylase Inhibitor: Cambinol and Cisplatin—An Isobolographic Analysis in Breast Cancer In Vitro Models. Int. J. Mol. Sci. 2021, 22, 8573. [Google Scholar] [CrossRef]
- Lautz, T.B.; Naiditch, J.A.; Clark, S.; Chu, F.; Madonna, M.B. Efficacy of class I and II vs class III histone deacetylase inhibitors in neuroblastoma. J. Pediatr. Surg. 2012, 47, 1267–1271. [Google Scholar] [CrossRef]
- Wawruszak, A.; Gumbarewicz, E.; Okon, E.; Jeleniewicz, W.; Czapinski, J.; Halasa, M.; Okla, K.; Smok-Kalwat, J.; Bocian, A.; Rivero-Muller, A.; et al. Histone deacetylase inhibitors reinforce the phenotypical markers of breast epithelial or mesenchymal cancer cells but inhibit their migratory properties. Cancer Manag. Res. 2019, 11, 8345–8358. [Google Scholar] [CrossRef] [Green Version]
- Tallarida, R.J. Revisiting the isobole and related quantitative methods for assessing drug synergism. J. Pharmacol. Exp. Ther. 2012, 342, 2–8. [Google Scholar] [CrossRef] [Green Version]
- Grabovsky, Y.; Tallarida, R.J. Isobolographic analysis for combinations of a full and partial agonist: Curved isoboles. J. Pharmacol. Exp. Ther. 2004, 310, 981–986. [Google Scholar] [CrossRef]

| Cell Line | Drug | IC50 (μM) | n | S | f Ratio S | Parallelism |
|---|---|---|---|---|---|---|
| BT-549 | PAX | 0.00278 ± 0.00055 [18] | 48 | 1.327 | 1.220 | NP |
| CAM | 22.696 ± 2.227 | 96 | ||||
| MDA-MB-468 | PAX | 0.00454 ± 0.00115 [18] | 72 | 2.491 | 1.265 | NP |
| CAM | 39.860 ± 3.475 | 96 | ||||
| HCC1937 | PAX | 0.0186 ± 0.0084 [18] | 72 | N.D. | N.D. | N.D. |
| CAM | N.D. | N.D. |
| Cell Line | IC50 mix (μM) | nmix | Lower-IC50 add (μM) | nadd | Upper-IC50 add (μM) | Interaction |
|---|---|---|---|---|---|---|
| BT-548 | 25.55 ± 3.83 ** | 96 | 9.51 ± 2.19 | 140 | 13.19 ± 2.86 | Antagonism |
| MDA-MB-468 | 30.91 ± 2.91* | 120 | 18.45 ± 3.91 | 164 | 20.88 ± 4.01 | Antagonism |
| Cell Line | Drug | Pre-G1 Phase [%] | G1 Phase [%] | S Phase [%] | G2 Phase [%] |
|---|---|---|---|---|---|
| BT-549 | Control | 1.2780 ± 0.38960 | 47.5600 ± 0.3742 | 16.4300 ± 0.5751 | 34.590 ± 0.7851 |
| PAX 2.0 | 2.1380 ± 0.32830 | 48.8100 ± 1.7220 | 18.5200 ± 0.9863 | 30.510 ± 2.9130 | |
| CAM 2.0 | 1.4680 ± 0.20320 | 50.6000 ± 0.8995 | 17.1700 ± 0.8412 | 30.790 ± 0.4281 | |
| PAX + CAM 2.0 | 2.3450 ± 0.10470 | 53.6100 ± 0.5734 | 17.3200 ± 0.5867 | 26.630 ± 0.4492 | |
| PAX 4.0 | 4.0600 ± 0.33380 | 48.4300 ± 2.7960 | 20.4600 ± 1.0240 | 26.920 ± 1.6980 | |
| CAM 4.0 | 1.2830 ± 0.12090 | 55.5900 ± 1.0830 | 14.6100 ± 0.2636 | 28.370 ± 0.8651 | |
| PAX + CAM 4.0 | 5.8450 ± 0.62700 | 49.7600 ± 4.9960 | 20.3900 ± 2.8960 | 23.480 ± 1.5260 | |
| MDA-MB-468 | Control | 1.5550 ± 0.24030 | 66.1400 ± 0.9984 | 10.8500 ± 0.3469 | 21.410 ± 1.0550 |
| PAX 2.0 | 1.4830 ± 0.43570 | 65.7800 ± 1.6210 | 10.0200 ± 0.2220 | 22.690 ± 1.8650 | |
| CAM 2.0 | 2.1150 ± 1.59600 | 58.5100 ± 3.2190 | 12.2600 ± 0.2891 | 26.200 ± 3.5080 | |
| PAX + CAM 2.0 | 1.9030 ± 0.43650 | 55.0600 ± 1.1350 | 13.0600 ± 0.4994 | 29.330 ± 1.6970 | |
| PAX 4.0 | 3.4900 ± 0.15100 | 63.2700 ± 0.3439 | 10.3300 ± 0.4325 | 22.720 ± 0.2868 | |
| CAM 4.0 | 0.7800 ± 0.03162 | 59.3000 ± 2.7610 | 11.5300 ± 1.7360 | 26.370 ± 0.4074 | |
| PAX + CAM 4.0 | 3.0900 ± 1.74900 | 51.8900 ± 1.2350 | 13.9600 ± 0.7807 | 29.440 ± 0.6453 |
Publisher’s Note: MDPI stays neutral with regard to jurisdictional claims in published maps and institutional affiliations. |
© 2022 by the authors. Licensee MDPI, Basel, Switzerland. This article is an open access article distributed under the terms and conditions of the Creative Commons Attribution (CC BY) license (https://creativecommons.org/licenses/by/4.0/).
Share and Cite
Wawruszak, A.; Luszczki, J.; Okon, E.; Czerwonka, A.; Stepulak, A. Antagonistic Pharmacological Interaction between Sirtuin Inhibitor Cambinol and Paclitaxel in Triple-Negative Breast Cancer Cell Lines: An Isobolographic Analysis. Int. J. Mol. Sci. 2022, 23, 6458. https://doi.org/10.3390/ijms23126458
Wawruszak A, Luszczki J, Okon E, Czerwonka A, Stepulak A. Antagonistic Pharmacological Interaction between Sirtuin Inhibitor Cambinol and Paclitaxel in Triple-Negative Breast Cancer Cell Lines: An Isobolographic Analysis. International Journal of Molecular Sciences. 2022; 23(12):6458. https://doi.org/10.3390/ijms23126458
Chicago/Turabian StyleWawruszak, Anna, Jarogniew Luszczki, Estera Okon, Arkadiusz Czerwonka, and Andrzej Stepulak. 2022. "Antagonistic Pharmacological Interaction between Sirtuin Inhibitor Cambinol and Paclitaxel in Triple-Negative Breast Cancer Cell Lines: An Isobolographic Analysis" International Journal of Molecular Sciences 23, no. 12: 6458. https://doi.org/10.3390/ijms23126458
APA StyleWawruszak, A., Luszczki, J., Okon, E., Czerwonka, A., & Stepulak, A. (2022). Antagonistic Pharmacological Interaction between Sirtuin Inhibitor Cambinol and Paclitaxel in Triple-Negative Breast Cancer Cell Lines: An Isobolographic Analysis. International Journal of Molecular Sciences, 23(12), 6458. https://doi.org/10.3390/ijms23126458