Abstract
To decipher the mediator role of the grape Abscisic acid, Stress, Ripening (ASR) protein, VvMSA, in the pathways of glucose signaling through the regulation of its target, the promoter of hexose transporter VvHT1, we overexpressed and repressed VvMSA in embryogenic and non-embryogenic grapevine cells. The embryogenic cells with organized cell proliferation were chosen as an appropriate model for high sensitivity to the glucose signal, due to their very low intracellular glucose content and low glycolysis flux. In contrast, the non-embryogenic cells displaying anarchic cell proliferation, supported by high glycolysis flux and a partial switch to fermentation, appeared particularly sensitive to inhibitors of glucose metabolism. By using different glucose analogs to discriminate between distinct pathways of glucose signal transduction, we revealed VvMSA positioning as a transcriptional regulator of the glucose transporter gene VvHT1 in glycolysis-dependent glucose signaling. The effects of both the overexpression and repression of VvMSA on glucose transport and metabolism via glycolysis were analyzed, and the results demonstrated its role as a mediator in the interplay of glucose metabolism, transport and signaling. The overexpression of VvMSA in the Arabidopsis mutant abi8 provided evidence for its partial functional complementation by improving glucose absorption activity.
1. Introduction
Soluble sugars are key metabolites of plant central metabolism, and also structural units for cell wall and reserve polysaccharides, which constitute the major stock of carbon storage. The transport of these primary photoassimilates over long distance is crucial for the establishment of source- and sink-organ relationships during plant development, and responses to abiotic and biotic constraints. In parallel, their transport over short distance between neighboring cells and their partitioning between different subcellular compartments implies an important role in maintaining osmotic pressure, and thereby cell turgidity and expansion. Some sugars are well-established metabolic signals (glucose, sucrose, fructose, trehalose/trehalose-6-P) [1,2,3,4,5,6], and their interplay with other metabolic, hormonal and environmental signals is involved in the regulation of cell proliferation and differentiation, plant growth and development [1,7,8,9]. Abscisic acid, Stress, Ripening-induced proteins (ASR) have been identified and characterized as regulated at the interface of glucose and ABA signaling pathways, at the transitions between development stages and in the responses to environmental cues relying on shifts of cell/organ sugar status [10,11,12,13,14,15,16,17,18].
1.1. ASR Proteins: Emergence, Molecular Features and Biological Functions
Since the discovery of the first ASR in Tomato [19], these proteins have been identified in a plethora of plant species. After having applied approaches of evolutionary genomics to 57 sequenced genomes, from Algae to Angiosperms, we identified 165 proteins belonging to 35 species, whose phylogenic tree is presented in Figure S1. It should be noted that we did not find any ASRs in Algae, Bryophytes and Lycophytes, whereas several ASRs have been identified in Pinus taeda, confirming those already described [20,21] and providing evidence for the early emergence of the ASRs in the common ancestor of Gymnosperms and Angiosperms. In addition, our phylogenic analysis confirmed the absence of ASR genes in the genomes of the Brassicaceae family, as that has already been suggested for Arabidopsis thaliana and the Arabidopsis-related species Thellungiella halophilla [22] and the crucifer heavy metal hyperaccumulator Thlaspi caerulescens [23]. When we compare the evolutionary history of ASRs with that of terrestrial plants, it is interesting to note that the emergence of ASRs is in accordance with the restriction of plants’ desiccation tolerance from the whole organism to some organs (seeds, pollen).
The description of several ASRs as intrinsically disordered proteins [24,25,26,27,28] perfectly matches with their ability to interact as chaperones with macromolecules, such as nucleic acids and enzymes [29,30,31]. ASR proteins can also act as transcription regulators able to recognize and bind to specific promoter sequences [32,33,34,35,36], as well as to form homodimers and heterodimers with other transcription factors [37,38,39,40]. All these molecular features in combination with their subcellular distribution, nuclear and cytosolic [32,33,34,35,41], contribute to their physiological functions at the transitions between plant developmental stages [18,19,32,42] and in the plant responses to abiotic and biotic constraints [12,15,16,36,43,44,45,46,47,48,49,50]. Furthermore, the deciphering of ASRs’ plausible involvement in the epigenetic mechanisms throughout their impact on microRNA expression, chromatin modifiers, and histone marks [27,51] may suggest a real biological role in the priming of plant responses to environmental cues.
1.2. Involvement of ASR Proteins in Glucose Signaling, Metabolism, and Transport
The results of the glucose signaling studies support three plausible transduction pathways: one dependent on the sensor function of hexokinase 1 (HXK1); a second one dependent on the catalytic function and independent of the sensor function of HXK1, referred to as the glycolysis dependent pathway; a third one independent of HXK1 and potentially initiated by a plasma membrane sensor [52]. It has been demonstrated that the metabolic activity of AtHXK1 is uncoupled from its role in signaling, and vice versa, the glucose-sensing function is found to be independent of its catalytic activity [53]. In Grape, we have demonstrated for the first time the involvement of an ASR, VvMSA (Vitis vinifera Maturation, Stress, Abscisic acid-induced), in the transcriptional regulation of the hexose transporter gene VvHT1 (Vitis vinifera Hexose Transporter 1) by its proper substrate, glucose [32]. Moreover, we deciphered the fine tuning of VvMSA gene expression at the crosstalk of glucose and ABA signaling, and built a model of this metabolic and hormonal interplay throughout the HXK1 and SnRK1 (Sucrose non-fermenting Related Kinase 1) interaction [54]. It has been reported that compared to wild-type plants, transgenic potatoes overexpressing tomato ASR1 increase their tuber number and reduce their glucose content, in a concomitant manner with expression inhibition of the hexose transporter homolog LeHT2 [55]. In the same context, the overexpression of maize ASR1 has been demonstrated to improve the yield and to modulate the expression of several genes and proteins involved in fatty acid metabolism [56]. The latter observation is specific for plants; after germination, the lipids stored in seeds are subsequently transformed in peroxisome and mitochondrion to malate, which after conversion to phosphoenolpyruvate in cytosol is metabolized via the gluconeogenic pathway to sucrose, in order to be reallocated by the phloem to the sink-organs. Furthermore, it has been reported that the constitutive expression of tomato ASR1 in antisense orientation in tobacco induces a marked dwarf genotype, corresponding to reduced ABA content, and inversely, to elevated glucose content in leaves [57]. That accumulation of glucose in leaves is concomitant with the repression of one hexose transporter, NtHT1, and the sucrose transporter NtSUT2. Similarly, the gene expression of HXK1 and SnRK1 (two protein-kinases involved in sugar signaling) displays an inverse relationship: when the first one is induced, the second one is inhibited. The effect of increased glucose content under ASR1 silencing perfectly corresponds to the HXK1 function as a cytosolic sensor responsible for repression of photosynthetic genes [57]. These overall data strongly imply the involvement of ASRs in the regulation of sugar metabolism and carbon allocation, as proteins acting at the crosstalk of glucose and hormonal signaling.
1.3. Regulation of Sugar Transporters by Their Own Substrates
Transcriptomic analyses have demonstrated that several genes of monosaccharide transporters [58,59,60,61,62] and disaccharide transporters [63,64,65,66,67,68] are regulated by sugars. In beans (Vicia faba), it has been reported that glucose and sucrose inhibit VfSUT1 gene expression at high concentration (150 mM), while this effect is not observed at low sugar concentration (10 mM) [63]. However, the signaling pathways involved in the regulation of sugar transporters at the protein level remain insufficiently elucidated. In the latter regard, some early studies have suggested the involvement of HXK1 in the activity regulation of certain monosaccharides transporters [60,69]. A more recent work has reported that the Arabidopsis Sugar Transporter1 (AtSTP1) is induced by sugar depletion and is inhibited by glucose in an HXK1-independent manner. Moreover, the glucose inhibition of AtSTP1 requires previous phosphorylation of glucose [70]. As the overexpression of the catalytic subunit of SnRK1, AtKIN10, has been reported to affect the expression of the AtSTP1 gene [70], SnRK1 should also regulate sugar transporters. However, the same authors did not observe any marked effect of AtKIN10 overexpression on the inhibition of AtSTP1 by glucose. The expression of VvHT1 is mediated by VvMSA [32], and the expression of VvMSA itself is controlled by glucose [54], which implies the role of grape ASRs in the transcriptional regulation of the hexose transporter VvHT1 by its proper substrate, glucose. In this regard, other studies also corroborate the idea that the ASR proteins could participate in the regulation of sugar transporters by glucose signaling [55,57].
In this study, we explored the biological functions of grape ASR, VvMSA, through its overexpression or repression in genetically transformed grape cell lines of both types, embryogenic (EC) and non-embryogenic (NEC). As previously described by us, the embryogenic cells have been characterized by organized cell proliferation, low intracellular glucose content and low glycolysis flux, while the non-embryogenic cells displayed anarchic cell proliferation, supported by high glucose content and high glycolysis flux [71]. In these well-characterized cell cultures, we deciphered VvMSA positioning as a transcriptional regulator of the glucose transporter gene VvHT1 in glucose signaling, using different glucose analogs to discriminate between distinct pathways of glucose signal transduction. Furthermore, the impacts of VvMSA repression on glucose transport and metabolism via glycolysis were analyzed and its role as mediator in the interplay of glucose metabolism, transport and signaling was demonstrated. We found that overexpression of VvMSA partially restored glucose and ABA sensitivity of seed germination in the Arabidopsis mutant abi8.
2. Results
2.1. Analysis of VvMSA Overexpression and Silencing in Grape Cells
After confirming the integration of the p35S::VvMSA and p35S::VvMSA-RNAi constructs in the grape embryogenic cell 41B genome, the gene overexpression and repression at day 8 after subculture were studied by Northern blot (Figure 1A,B) and RT-qPCR (Figure 1C). The level of VvMSA expression in the wild-type cells (WT) was sharply induced in p35S::VvMSA (VvMSA-OE), while it was strongly reduced in p35S::VvMSA-RNAi (VvMSA-RNAi) cells. The transgene impact was also studied at the protein level by Western blot (Figure 2A,B), using a custom made VvMSA specific antibody [42].
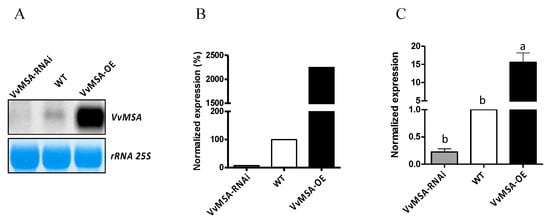
Figure 1.
Analysis of the VvMSA expression in WT, VvMSA-OE and VvMSA-RNAi embryogenic cells. (A) Northern blot obtained after hybridization of radiolabeled probe corresponding to cDNA of VvMSA. Lower panel shows methylene blue staining of the filter. (B) Quantitation of the Northern blot signals presented as percentage of VvMSA expression of the transgenic lines reported to that of the WT line (considered as 100%). (C) RT-qPCR: the relative expression of the VvMSA genes is calculated by the ΔΔCt method using VvGAPDH as a reference gene and VvMSA in WT as a control gene. The histograms show the mean of three independent experiments performed on 8-day-old cells (±SEM). The letters denote the groups that were found significantly different by ANOVA and Fisher LSD test (p < 0.05).
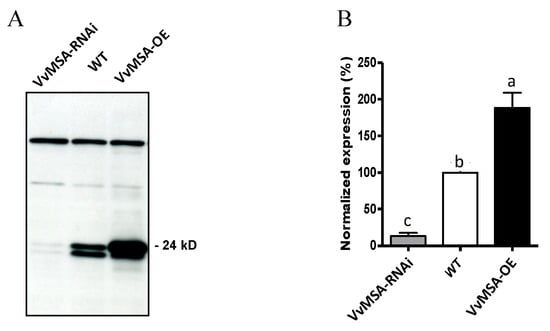
Figure 2.
Western blot analysis of the VvMSA expression in WT, VvMSA-OE and VvMSA-RNAi cell suspensions. (A) Immune detection of VvMSA proteins separated by SDS-PAGE of 20 µg total protein extract of each of the cell suspensions and transferred onto nitrocellulose membrane. The prominent higher MW non-specific bands with even intensity, that are immunorevealed by the polyclonal anti-VvMSA antibody, serve as a loading control. (B) Signal quantitation using ImageJ, v.1.4. The VvMSA expression of the transgenic lines is presented as a percentage of that of the WT (considered as 100%). The histograms show the mean of three independent experiments. The letters denote the groups that were found significantly different by ANOVA and Fisher LSD test (p < 0.05).
As shown in Figure 2A, the two grape ASR allelic forms, complete and deleted (lacking five amino acids, without frame shift [38]), were equally present in the WT, almost totally absent in the VvMSA-RNAi silenced cells, while the complete form was highly overexpressed in the VvMSA-OE cells.
These results raised the biological question regarding the overexpression/silencing impact of VvMSA as a transcription factor on its target gene encoding the hexose transporter VvHT1. As demonstrated by RT-qPCR analysis (Figure 3A), the expression level of VvHT1 remained almost at the same level between the WT and the VvMSA-OE cells. This implies that endogenous VvMSA is sufficient for maximal VvHT1 expression in OE cells, and additional response may be limited by a binding partner. Inversely, VvHT1 expression strongly decreased in the VvMSA-RNAi cells. This sharp reduction was estimated at about 75% and perfectly confirmed the role of VvMSA protein in VvHT1 gene expression regulation.
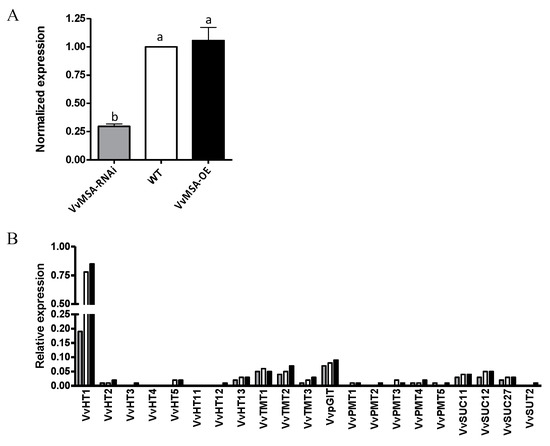
Figure 3.
Expression of sugar transporters in WT, VvMSA-OE and VvMSA-RNAi embryogenic cells (EC) after 8 days of culture. (A) RT-qPCR analysis of the VvHT1 expression. The relative expression of the VvHT1 gene is calculated by the ΔΔCt method using VvGAPDH as a reference gene and VvMSA in WT as a control gene. The histograms show the mean of three independent experiments performed on 8-day-old cells (±SEM). The letters denote the groups that were found significantly different by ANOVA and Fisher LSD test (p < 0.05). (B) Macroarray analysis of sugar transporter expression. The histograms show the mean of two independent experiments performed on 8-day-old cells. Expression values are normalized using four housekeeping genes VvGAPDH, VvActin, VvEF1a, VvEF1γ.
To explore the impact of grape ASR silencing beyond its target VvHT1 gene, a thematic macroarray representative for the grape subfamilies of hexose transporters VvHTs, tonoplast monosaccharide transporters TMT, polyol monosaccharide transporters PMT, plastid glucose transporters VvpGlT and sucrose carriers VvSUC, was hybridized with the mRNAs extracted at day 8 from each of the three embryogenic cell cultures (Figure 3B). Moreover, even though the VvHT1 expression in VvMSA-RNAi cells was strongly inhibited, it remained the largely dominant glucose transporter gene under heterotrophic conditions as compared to the other studied sugar transporter genes. The obtained results clearly demonstrated that only VvHT1 was strongly regulated by the grape ASR, and consequently, none of the other studied sugar transporter genes were able to compensate for the important reduction of VvHT1 expression in the grape embryogenic cells.
The next issue concerned the physiological effect of VvMSA silencing and reduced VvHT1 expression in terms of glucose absorption activity. As a first step, the absence of any phenotypic difference between the three types of embryogenic cells (WT, VvMSA-OE and VvMSA-RNAi) was confirmed by the perfect matching of their growth curves throughout the fourteen days of subculture period (Figure 4A). Overexpression and repression of VvMSA did not modify the osmolarity of the culture media of the three cell lines, whose greatest decrease from 140 mmol·kg−1 to 112 mmol·kg−1 corresponded to the exponential phase of cell growth (Figure 4B). Furthermore, while the comparison of the glucose absorption in these three cell suspensions revealed an absence of notable differences between the WT and VvMSA-OE cells, the glucose transport activity was significantly inhibited in the VvMSA-RNAi cells, consistent with the VvHT1 transcript data (Figure 4C).
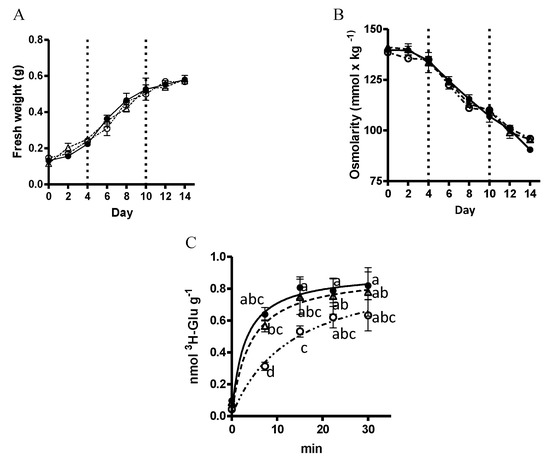
Figure 4.
(A) Cell growth kinetics of WT, VvMSA-OE and VvMSA-RNAi embryogenic cells (EC). The cell proliferation is expressed as a function of the cell fresh weight. ●-WT; △-VvMSA-OE; ◯-VvMSA-RNAi. (B) Osmolarity of the culture media of the WT, VvMSA-OE and VvMSA-RNAi cell lines. The dots represent the mean values (±SEM) that were obtained after measurement of 10 µL of medium by using Wescor VAPRO vapor pressure osmometer, model 5520. (C) Absorption of D-[3H]-glucose measured in WT, VvMSA-OE and VvMSA-RNAi cells grown at 0.2 mM glucose concentration. The D-[3H]-glucose absorption was reported to the dry weight of the cells. The nonlinear regression curves in (A–C) were generated from the mean values (±SEM) of three independent experiments and analysis by ANOVA and Fisher LSD test (p < 0.05). No significant differences were found between the groups that were compared either by fresh weight (A) or osmolarity (B), while the comparison by absorption of D-[3H]-glucose allowed us to discriminate between the groups (C). The letters on the dots in (C) indicate the level of significant difference between the groups at four time-points of 0, 10, 20 and 30 min.
2.2. Stability of VvMSA Silencing and VvHT1 Expression Evolution
An important observation concerned the disappearance of VvHT1 expression inhibition in VvMSA-RNAi cells at a long term (Figure S2), while the repression of VvMSA was perfectly confirmed in embryogenic cells (EC), the regenerated vitroplants and non-embryogenic cells (NEC) (Figure S3). To highlight this discrepancy between inhibition of VvHT1 expression by the VvMSA repression observed early after the transformation of EC cells with the VvMSA-RNAi construct, we performed in parallel two new independent transformations with the same VvMSA-RNAi construct and proceeded to the profiling of both concerned genes during and beyond the time period of culture stabilization.
The results perfectly confirmed the efficiency of VvMSA-RNAi transformation and the causal relationship between VvMSA repression and VvHT1-expression inhibition (Figure S4). The VvMSA repression was progressively imposed due to the selection of the VvMSA-RNAi transformed cells and became significant after four months, but without a very strong impact on VvHT1 expression. After six months, the VvMSA repression was definitely stabilized and produced significantly inhibited VvHT1 expression. Both transformed cell cultures exhibited the same level of VvMSA repression and a sustained VvHT1 inhibition between the sixth and the eighth month. However, after eight months and despite the stability of VvMSA repression in all subcultures, the expression of VvHT1 was progressively restored, as observed for the first genetic transformation (Figure S2).
2.3. Establishment of Treatment Conditions with Glucose and Its Analogs
Taking advantage of our recent demonstration of the differences in the glycolytic metabolism of embryogenic and non-embryogenic grape cells [71], we decided to study the positioning of the VvMSA/VvHT1 interaction in the different pathways of the glucose signaling. The analysis of grape ASR gene expression in embryogenic and non-embryogenic cells clearly confirmed the overexpression and the silencing of VvMSA gene compared to the wild type, and thus allowed us to compare six cellular models. (Figure S4).
In order to study the positioning of VvMSA impact on VvHT1 expression in the three well-identified pathways of glucose signaling, we applied a pharmacological approach using D-glucose and its analogs: D-mannose, 2-deoxyglucose (2DOG), 3-O-methylglucose (3OMG) and mannitol as osmotic pressure control, as well as the inhibitor of the hexokinase catalytic activity—the mannoheptulose. In this way, we studied, in parallel with VvHT1, the gene encoding VvHT5 hexose transporter, whose expression appeared also to be regulated under biotic and abiotic stresses.
To avoid mutual interference between sugar and nitrate signaling, all cell lines of EC and NEC type were subcultured in minimal media depleted of sugars and nitrates (Figure 5A–D). The profiles of both VvHT1 and VvHT5 genes in the presence or absence of nitrates unambiguously demonstrated that the sugar depletion most strongly induced VvHT1 and VvHT5 expression in the EC wild-type suspension. In agreement with the macroarray analysis of hexose transporter genes, the VvHT1 demonstrated a remarkably higher expression than that of VvHT5 (Figure 3B).
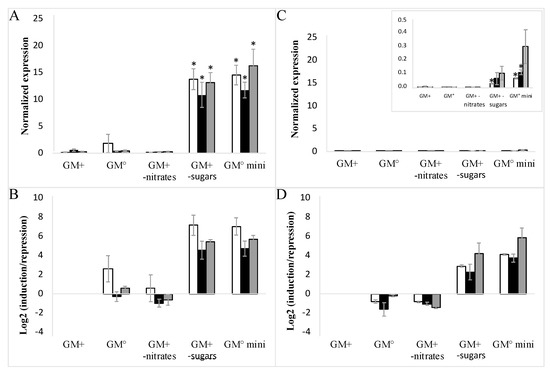
Figure 5.
Influence of cell culture media composition on the expression of VvHT1 and VvHT5 in embryogenic cells (EC). Complete medium (GM+), medium without auxins (GM°), medium without nitrates (GM+ w/o nitrates), medium without maltose and glycerol (GM+ w/o sugars), medium without auxins, nitrates, maltose and glycerol (GM° mini). □-WT; ■-VvMSA-OE; ■-VvMSA-RNAi. The gene expression of VvHT1 (A,B) and VvHT5 (C,D) is normalized to that of the housekeeping gene VvActin reported to the control condition used to calculate the ratio of induction/repression. Normalized expression (A,C) and induction/repression (B,D) are calculated by the methods of ΔCt and 2−ΔΔCT respectively. The presented results correspond to the mean values of three independent experiments (±SEM). The asterisks denote the groups that were found significantly different by Kruskal–Wallis test (* p < 0.05).
To further explore the glucose regulation of VvHT1 and VvHT5 expression, we analyzed the effects of 10 mM, 56 mM and 150 mM glucose in culture media supplemented or depleted for nitrates (Figure 6A–D). The repression of both monosaccharide transporter genes by 10 mM glucose was strongly enhanced by nitrate depletion, while the impacts at 56 mM and 150 mM glucose concentration appeared to be slightly improved in the presence or absence of nitrates, albeit without any significant difference between them. These data demonstrated that 10 mM glucose, a concentration corresponding to the higher glucose concentration throughout the growth cycle of embryogenic cells [71], is sufficient to explore the expression regulation of the two hexose transporter genes in the glucose signaling pathways.
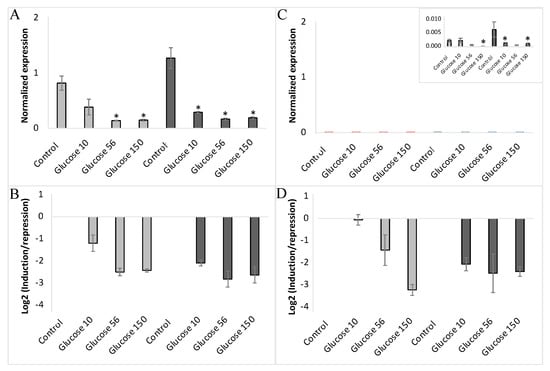
Figure 6.
Expression of VvHT1 and VvHT5 in non-embryogenic cells (NEC) of wild-type cultured at three concentrations of glucose (10 mM, 56 mM and 150 mM) either in presence (■) or absence (■) of nitrates. “Glucose10”-10 mM; “Glucose56”-56 mM; “Glucose150”-150 mM. The gene expression of VvHT1 (A,B) and VvHT5 (C,D) is normalized to that of the housekeeping gene VvActin reported to the control condition used to calculate the ratio of induction/repression. Normalized expression (A,C) and induction/repression (B,D) are calculated by the methods of ΔCt and 2−ΔΔCT, respectively. The presented results correspond to the mean values of three independent experiments (±SEM). The asterisks denote the groups that were found significantly different by Kruskal–Wallis test (* p < 0.05).
2.4. Positioning of VvMSA/VvHT1 Interaction in the Glucose Signaling Pathways
On day 8 of the subculture, corresponding to the exponential phase of cell growth, embryogenic and non-embryogenic cells (WT, VvMSA-OE and VvMSA-RNAi) were transferred after washing into minimal media depleted of nitrates and sugars. After 24 h of culture of embryogenic and non-embryogenic cell lines under such nutrient deficiency, the hexokinase inhibitor mannoheptulose, glucose, or its analogs (mannose, 3OMG and mannitol) were added at physiological concentrations of 10 mM each (except 2DOG that was applied at 0.9 mM). The expression of VvHT1 and VvHT5 was first normalized to that of the reference gene VvActin, and then reported to the respective gene expression in the corresponding minimal medium as control conditions (Figure 7A–D and Figure S5).
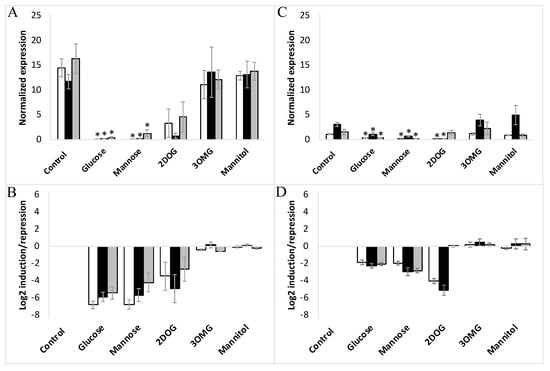
Figure 7.
Expression of VvHT1 in embryogenic cells (A,B) and non-embryogenic cells (C,D) in response to different treatments with glucose, mannose, 3OMG, mannitol (all applied at 10 mM concentration), and 2DOG (0.9 mM). □-WT; ■-VvMSA-OE; ■-VvMSA-RNAi. The embryogenic cells and the non-embryogenic cells were collected after 8 days of subculture and incubated for additional 24 h in their respective minimal media, i.e., GM° minimum (EC) and Gb minimum (NEC). Sugar effectors were added afterwards and the treatment of EC was extended for 6 h, while that of NEC for 24 h. The gene expression of VvHT1 is normalized to that of the housekeeping gene VvActin and reported to the control condition used to calculate the ratio of induction/repression. Normalized expression (A,C) and induction/repression (B,D) are calculated by the methods of ΔCt and 2−ΔΔCT, respectively. The presented results correspond to the mean values of three independent biological experiments (±SEM). The asterisks denote the groups that were found significantly different by Kruskal–Wallis test (* p < 0.05).
It is noteworthy, that in the above-mentioned control conditions, the VvHT1 expression level was at least ten-fold higher than that of VvHT5. The administration of 10 mM glucose imposed a very strong inhibition of VvHT1, which was 60-fold for EC and 4-fold for NEC, respectively (Figure 7A–D). However, the simultaneous treatment with 10 mM glucose and 10 mM mannoheptulose (presumed as HXK inhibitor) repressed VvHT1 expression in the same manner as the treatment with the glucose alone (Figure S5). The administration of mannoheptulose from two different providers (Glycoteam, Hamburg, Germany; Sigma Aldrich, St. Louis, MO, USA) did not allow to abrogate the repression of VvHT1 caused by the glucose.
Concerning VvHT5, its expression was reduced significantly by glucose (>16-fold) in the EC cells, but demonstrated just propensity for inhibition in the NEC cells, where its transcript level remained too weak under control conditions (Figure 8A–D). Mannose is known to be well transported into the cell and phosphorylated by HXK, but is a poorly metabolized analogue of glucose. This effector produced nearly the same reduction of VvHT1 expression as glucose in the three cell lines of each EC and NEC type. The inhibitory effect of mannose on VvHT5 expression was also similar to that of glucose on all three EC lines, but appeared more pronounced on NEC cells.
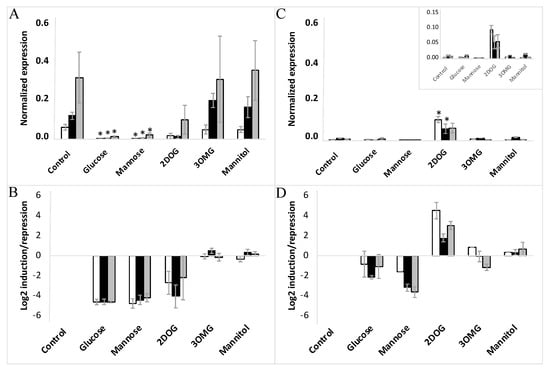
Figure 8.
Expression of VvHT5 in embryogenic cells (A,B) and non-embryogenic cells (C,D) in response to different treatments with glucose, mannose, 3OMG, mannitol (all applied at 10 mM concentration), and 2DOG (0.9 mM). □-WT; ■-VvMSA-OE; ■-VvMSA-RNAi. The embryogenic cells and the non-embryogenic cells were collected after 8 days of subculture and incubated for additional 24 h in their respective minimal media, i.e., GM° minimum (EC) and Gb minimum (NEC). Sugar effectors were added afterwards and the treatment of EC was extended for 6 h, while that of NEC for 24 h. The gene expression of VvHT1 is normalized to that of the housekeeping gene VvActin and reported to the control condition used to calculate the ratio of induction/repression. Normalized expression (A,B) and induction/repression (C,D) are calculated by the methods of ΔCt and 2−ΔΔCT, respectively. The presented results correspond to the mean values of three independent biological experiments (±SEM). The asterisks denote the groups that were found significantly different by Kruskal–Wallis test (* p < 0.05).
Keeping in mind that 3OMG is imported by the cell but negligibly phosphorylated by HXK, it is noteworthy that its supply did not trigger any significant effect on VvHT1 and VvHT5 expression in any of the studied cell lines. Mannitol, used as an osmotic control also failed to alter VvHT1 and VvHT5 expression. This excludes the transcriptional regulation of both transporter genes without hexose phosphorylation, and thereby the HXK-independent glucose signaling pathway (Figure 7 and Figure 8), confirming the role of HXK-dependent glucose- and mannose-signaling in all cell suspensions: WT, VvMSA-OE and VvMSA-RNAi (Figure 7 and Figure 8).
The unique and most remarkable difference between EC and NEC concerned the impact of 2DOG. This phosphorylatable, but not metabolizable, glucose analog repressed VvHT1 and VvHT5 to a little bit lesser extent than glucose or mannose in the three EC lines (WT, VvMSA-OE and VvMSA-RNAi) (Figure 7A,B and Figure 8A,B). Inversely, in NEC cells, 2DOG reduced VvHT1 expression in WT and VvMSA-OE cells more strongly than glucose and mannose (Figure 7C,D). Most markedly, this glycolysis inhibitor did not affect VvHT1 expression in VvMSA-RNAi non-embryogenic cells (Figure 7C,D). In addition, 2DOG induced VvHT5 expression more than three-fold in the three NEC cell lines (WT, VvMSA-OE and VvMSA-RNAi) when compared to that of the same cells grown in control medium and under supply with other effectors (Figure 8C,D).
2.5. Analysis of Intracellular Metabolites under Sugar and Nitrate Depletion
The intracellular metabolite comparison of the EC and NEC was achieved by quantitative proton NMR analysis of cells harvested on the eighth day of subculture (D8) and at D8 + 24 h of culture on the respective minimal media. As already described by us [71], 1H NMR enabled the detection of 42 metabolites, from which 36 were identified. Principal component analysis (PCA) was used to unravel the differences between both cell types (Figure 9). The first PCA axis, corresponding to 59.55% of the variance, allowed the discrimination between NEC (D8 and D8 + 24 h of depletion) and EC (D8 and D8 + 24 h depletion). The second PCA axis responsible for 23.83% of the variance (Figure 9A), revealed the difference between EC at D8 and the other three groups, namely NEC at D8, NEC at D8 + 24 h depletion and EC at D8 + 24 h depletion.
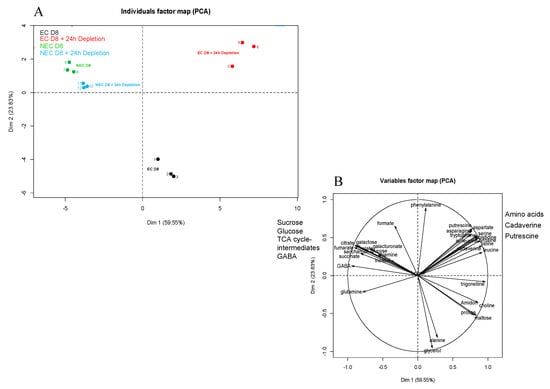
Figure 9.
Principal component analysis (PCA) of measured cellular metabolites in embryogenic cells (EC) and non-embryogenic cells (NEC) grown under two conditions: 8 days of culture (D8) and 8 days of culture followed by 24 h of depletion (D8 + 24 h). (A) Individual map. Black-EC at D8; Red-EC at D8 plus 24 h depletion; Green-NEC at D8; Blue-NEC at D8 plus 24 h depletion (B) Correlation circles. The overall data of metabolite measurements were used, except glutamate, whose quantitation turned out to be impossible in the non-embryogenic cells. The soluble metabolites were quantified by 1H NMR, while starch was determined by an enzymatic method. Metabolite quantitation was performed on cells from three independent biological replicates.
The EC at D8 were characterized by relatively high concentrations of glycerol and alanine, while those at D8 + 24 h depletion presented high concentrations of free amino acids and polyamines (cadaverine and putrescine) (Figure 10). At D8 + 24 h depletion, the NEC maintained higher concentrations of glucose and Krebs cycle intermediates (citrate, succinate, fumarate, malate, γ-aminobutyric acid, GABA), when compared to the EC under the same condition (Figure 9B and Figure S6). In EC, the 24 h depletion triggered a strong decrease of intracellular starch and sucrose concentrations, as well as moderate ones of succinate and malate. However, the concentrations of these metabolites were higher in NEC than in EC even after 24 h depletion: glucose > 6-fold; sucrose > 20-fold; succinate > 7-fold and malate > 20-fold (Figure 10 and Figure S6).
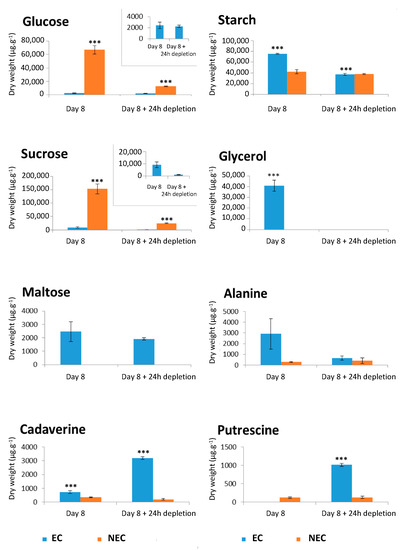
Figure 10.
Shifts in concentration of soluble metabolites in embryogenic cells (EC) and non-embryogenic cells (NEC) grown under two conditions: 8 days of culture (D8) and 8 days of culture followed by 24 h of depletion (D8 + 24 h). The soluble metabolites were measured by 1H NMR. Starch was quantitated by an enzymatic method. The presented results correspond to the mean values of three independent biological replicates (±SEM). The asterisks denote the groups that were found significantly different by ANOVA with Tukey’s multiple comparison test (*** p < 0.001).
2.6. Maximal Activities of Glycolysis Enzymes under Different Treatments
In an attempt to determine the impact of VvMSA repression on reprogramming glucose metabolism, we established maximal activities of glycolysis enzymes in embryogenic and non-embryogenic, WT and VvMSA-RNAi cells. These activities were measured under the conditions of a pharmacological approach, which allowed us to register the most marked effects on VvHT1 gene expression under “Depletion” (minimal medium), “Glucose” or “2DOG”-supply at D8 + 24 h deficiency for additional 6 h or 24 h of treatment, and compared to “Control” (complete medium) for the same time duration.
For embryogenic cells, the first axis of PCA with 45.51% variance allowed us to discriminate between the individual dots in “Control” and “Glucose” groups (Figure 11A), while those of “Depletion” and “2DOG” were scattered on the overall map. This suggests that the conditions “Depletion” and “2DOG” exerted little influence on the activity of the glycolysis enzymes in embryogenic cells. The first axis was correlated to the majority of the enzymes (PEPc; PK; ATP-PFK; PGI; PGM; FBP aldolase) (Figure 11B). It is therefore likely, that in a general manner, the cells of the “Control” group are characterized by stronger maximal activity of these enzymes than the cells of the “Glucose” group. The results of the ANOVA analysis imply that the VvMSA repression in embryogenic cells did not exert a significant effect on the activity of the different tested enzymes (Table S1). Inversely, there appeared to be a highly significant effect (p < 0.001), when the interaction between genotype and incubation time was extrapolated to the activity of FruK, and to a lesser extent to the activities of ATP-PFK, PGI and PGM (p < 0.05). This means that the activity of these enzymes evolved in a different manner after 6 h and 24 h of treatment of WT and VvMSA-RNAi cells (Figure 11B). Concerning FruK and PGM, their activities strongly decreased between 6 h and 24 h of treatment of wild-type cells, but not in VvMSA-RNAi cells in the “Depletion” condition. Likewise, the activities of PGI and PFK decreased between 6 h and 24 h in wild-type cells, but not in VvMSA-RNAi cells under the conditions “Depletion” and “2DOG”. The treatments produced a highly significant effect (p < 0.001) on the activities of ATP-PFK, PGM, PGI, enolase, and PEPc. Although at a less significant level, they also affected the activities of PK (p < 0.01) and FBP aldolase (p < 0.05) (Table S1). The activities of ATP-PFK, PGM, PGI and enolase were inhibited by glucose treatment (Figure 11B).
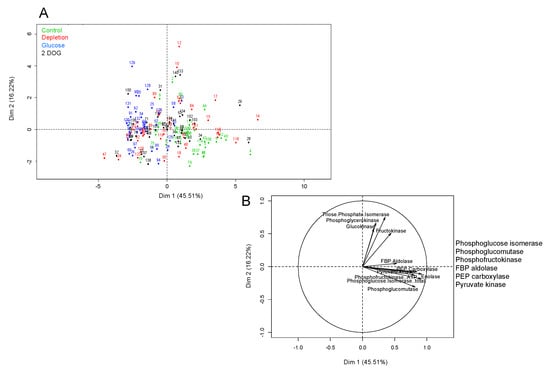
Figure 11.
Principal component analysis (PCA) of measured enzyme activities in embryogenic WT and 35S::VvMSA-RNAi cells. (A) Individual map. (B) Correlation circles. The overall data of enzyme activity measurements were used. Studied conditions: Control-cells that were transfected in the complete GM+ culture medium for 30 h or 48 h. Depletion-cells that were transfected in the minimal GM° culture medium for 30 h or 48 h. Glucose-and 2DOG-cells that were transfected in the minimal GM° culture medium for 24 h and treated with 10 mM glucose or 0.9 mM 2DOG for additional time periods of 6 or 24 h. Green-control; red-depletion; blue-glucose; black-2DOG. Three independent biological repetitions were carried out for each of the studied conditions, with at least three technical replicates per biological repetition.
For non-embryogenic cells, the first axis of PCA with 44.64% variance allowed us to discriminate between individual points corresponding to “Control” and “2DOG” on the one hand, and to “Depletion” and “Glucose” on the other (Figure 12). Even though separation was not totally clear-cut, this implied that the profile of the maximal enzyme activities of cells in the “Control” condition was closer to that of “2DOG” cells, while it displayed differences with the profiles of “Depletion” and “Glucose” groups. The first axis was positively correlated to the activities of almost all tested enzymes, except PGK and TPI. This means that most of the enzymes tended to display a higher level of maximal activity in “Control” and “2DOG” cells than in those of the “Depletion” and “Glucose” groups.
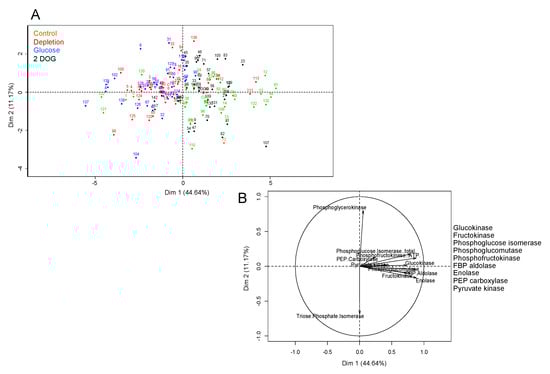
Figure 12.
Principal component analysis (PCA) of measured enzyme activities in non-embryogenic WT and 35S::VvMSA-RNAi cells. (A) Individual map. (B) Correlation circles. The overall data of enzyme activity measurements were used. Studied conditions: Control-cells that were transfected in the complete GM+ culture medium for 30 h or 48 h. Depletion-cells that were transfected in the minimal GM° culture medium for 30 h or 48 h. Glucose and 2DOG-cells that were transfected in the minimal GM° culture medium for 24 h and treated with 10 mM glucose or 0.9 mM 2DOG for additional time periods of 6 or 24 h. Three independent biological repetitions were carried out for each of the studied conditions, with at least three technical replicates per biological repetition. Green-control; red-depletion; blue-glucose; black-2DOG.
VvMSA repression in non-embryogenic cells exerted a significant effect on the maximal activity of GluK and PGI (p < 0.001), PGK (p < 0.01), and PFK (p < 0.05) (Table S1). The activities of GluK, PFK (Figure 13) and PGI (Figure S7) were higher in VvMSA-RNAi cells than in wild-type cells of the “Control” group after 6 h of culture. In contrast, no significant difference in activity of the last three enzymes was found between WT and VvMSA-RNAi cells grown under the conditions “Depletion”, “Glucose” and “2DOG”, after 6 h and 24 h of culture. The treatments significantly impacted the overall enzyme activities (p < 0.001), except for PGK and TPI (Table S1). The most marked differences were found after 24 h of treatment. FruK, and to lesser extent GluK, activities were inhibited only under the condition “Depletion” (Figure 13). The activities of PGM, aldolase and enolase were inhibited under the conditions “Depletion” and “Glucose”, but not in those of “2DOG” and “Control”. In contrast, the activities of PFK and PGI were induced by 2DOG treatment, while they remained not significantly affected in the other three conditions. The activity of PK was inhibited by treatments with glucose and 2DOG, and was not affected by the two other conditions. The activity of PEPc appeared lightly inhibited under the conditions of “Depletion” and “Glucose”, but not under the two other conditions.
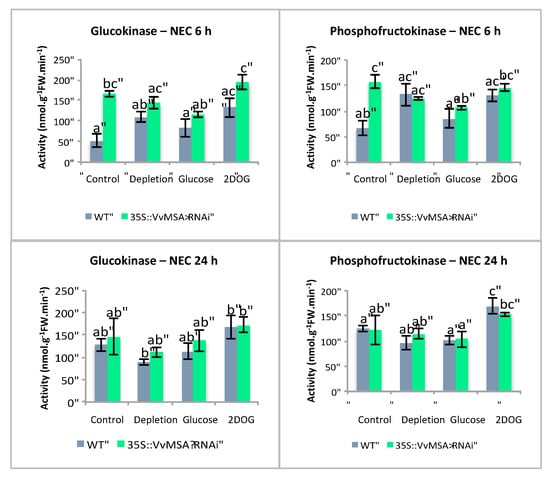
Figure 13.
Activities of glycolysis-related enzymes in non-embryogenic (NEC) wild-type and 35S::VvMSA-RNAi cells. Studied conditions: Control—cells that were transfected in the complete GM+ culture medium or the Gb medium for 30 h or 48 h; Depletion—cells that were transfected in the minimal GM° culture medium for 30 h or 48 h; Glucose and 2DOG—cells that were transfected in the minimal GM° culture medium for 24 h and treated with 10 mM glucose or 0.9 mM 2DOG for additional time periods of 6 or 24 h. Three independent biological repetitions were carried out for each of the studied conditions, with at least three technical replicates per biological repetition. The letters denote the groups that were found significantly different by ANOVA and Tukey’s HSD test (p < 0.05).
2.7. Glucose Absorption under Glucose and 2DOG Treatments
At the time point of 6 h, glucose absorption activity of embryogenic cells under control conditions was similar in both WT and VvMSA-RNAi cells (Figure 14A,B). It is likely that the treatment by glucose initiates light inhibition of absorption activity in both cell types at the time point of 6 h (20% and 31% respectively). The 2DOG treatment inhibited transport in WT cells (57% inhibition) more strongly than in VvMSA-RNAi cells, which remained the same as that under glucose treatment (31% inhibition). The inhibition propensity of glucose absorption in response to glucose administration appeared more marked after 24 h of treatment in wild-type cells (32% inhibition), while in VvMSA-RNAi cells the transport was already strongly reduced under control conditions (50%), and remained almost unchanged. Transport inhibition after 2DOG treatment of wild-type cells also remained practically unchanged between 6 h and 24 h time-points (57 vs. 56%, respectively). In VvMSA-RNAi cells, transport inhibition remained very close to that observed under control conditions (12% inhibition), which indicates that 2DOG has no effect on transport activity in those conditions.
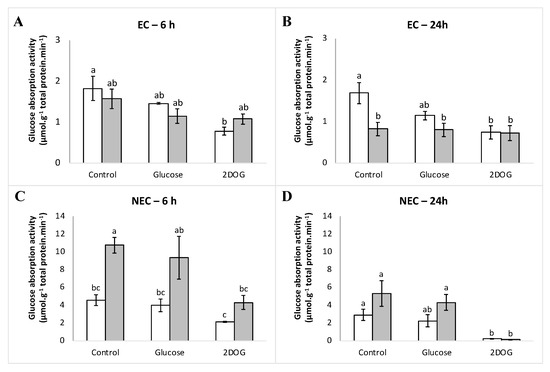
Figure 14.
(A–D) Glucose absorption activity in embryogenic cells (EC) and non-embryogenic (NEC) WT and VvMSA-RNAi cells. □-WT; ■-VvMSA-RNAi. The embryogenic cells and the non-embryogenic cells were collected after 8 days of subculture and incubated for an additional 24 h in their respective minimal media, i.e., GM° minimal (EC) and Gb minimal (NEC). Sugar effectors were added afterwards and the treatment of EC was extended for 6 h, while that of NEC for 24 h. 14C-glucose uptake was measured at the 20th minute after the effector supply. Three independent biological repetitions were carried out for each of the studied conditions, with at least three technical replicates per biological repetition. The letters denote the groups that were found significantly different by ANOVA and Tukey’s HSD test (p < 0.05).
For the glucose absorption activity of non-embryogenic cells under control conditions, we observed more transport (>two-fold) in VvMSA-RNAi cells compared to that of WT cells (Figure 14C,D). At the time point of 6 h, the glucose treatment triggered a weak inhibition of glucose absorption (decreased by 13 and 14%) in WT and VvMSA-RNAi cells, respectively). The treatment by 2DOG induced a more notable inhibition of the glucose transport (reduced by 54 and 60% in WT and VvMSA-RNAi cells, respectively). After the additional 24 h, the transport decreased in cells under control conditions, as well as in those treated either with glucose or 2DOG. It is noteworthy that the glucose transport in non-embryogenic VvMSA-RNAi cells was more strongly affected by extended depletion for 24 h (transport activity reduced by 50%) than in wild-type cells (reduction of 36% in transport activity). Transport inhibition under glucose treatment was slightly more marked after 24 h than that after 6 h (23% and 19% reduction of transport activity in WT and VvMSA-RNAi, respectively). In contrast, after 24 h, 2DOG triggered a nearly 100% inhibition of glucose absorption activity in both WT and VvMSA-RNAi cells.
In embryogenic cells, the part of passive transport represents ca. 25% and was very similar between the WT and VvMSA-RNAi cells analyzed at two time-points of 6 h and 24 h (Figure S8). Although passive transport also did not differ between non-embryogenic WT and VvMSA-RNAi cells, it was five-fold less than that in embryogenic cells—ca. 5%. The five-fold higher part of the passive transport in the embryogenic cells can probably be explained by their morphology and clumping propensity to form proembryonic aggregates. This hinders the washing efficacy and some portion of the radiolabelled glucose remains inside clumped cells.
2.8. Functional Complementation of the Arabidopsis Mutant abi8 with VvMSA
As the ASR VvMSA interferes in the cross-talk of glucose and ABA signaling, the Arabidopsis abi mutants (insensitive to both glucose and ABA) appear as an appropriate model to study its role in these signal transduction pathways. The confirmed absence of an ASR gene in the Arabidopsis thaliana genome allowed us to apply “functional complementation” of abi mutants by overexpression of grape ASR, thereby avoiding the risk of post-transcriptional gene silencing by co-suppression. Two different abi mutants, affecting the APETALA2 transcription factor ABI4, and ABI8 encoding a protein of unknown function, were transformed with p35S::VvMSA. While abi4 exists as a homozygous mutant, abi8 is a seedling lethal and must be maintained as a heterozygote [72,73]. Several homozygous VvMSA-overexpressing lines, T3 and T4 generations, were obtained for both abi4 and abi8 mutants. Although transformed abi4 + VvMSA enhanced its germination resistance to ABA and glucose (Figure S9), the overexpression of VvMSA partially restored the germination sensitivity of abi8 to ABA and glucose (Figure 15A), reducing both germination and eventual cotyledon greening (Figure S10).
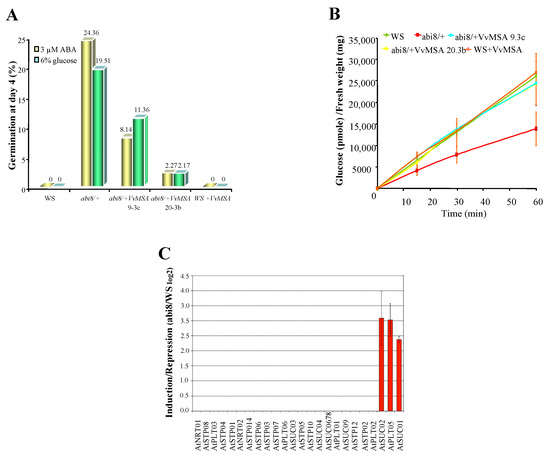
Figure 15.
Functional complementation of the Arabidopsis mutant abi8 by ectopic expression of VvMSA. (A) Sensitivity to ABA and glucose of wild ecotype WS, abi8/+ mutant and abi8/+VvMSA 9.3c, abi8/+VvMSA 20.3b and WS + VvMSA transgenic lines homozygous for VvMSA was assayed by measuring germination after 4 days of incubation on minimal medium supplemented with 3 µM ABA and 6% glucose, respectively. Only the 25% abi8 segregants show reduced sensitivity to ABA or glucose. (B) Glucose absorption activity of the same lines was measured on seedlings grown for 4 days on minimal medium to permit identification of abi8 segregants based on their stunted growth and then transferred to minimal medium with 1% glucose for 4 days before harvesting. 14C-glucose uptake was measured on ten seedlings at four time points (0, 15, 30 and 60 min) and expressed as pmoles of glucose per mg of fresh weight. Three independent biological repetitions were carried out for each of the studied lines, with at least three technical replicates per biological repetition. (C) Expression analysis by macroarray of sugar transporters (monosaccharide, disaccharide, polyol) in Arabidopsis abi8 mutant seedlings. The histograms show the mean of three independent experiments performed on 8-day-old seedlings (grown 4 days on minimal medium and an additional 4 days on minimal medium supplemented with 1% glucose). Expression values were initially normalized to those of three housekeeping genes of Arabidopsis thaliana, AtGAPDH (AT1G16300), AtActin 1 (AT2G37620), AtEF1β (AT1G30230), and then reported to those of the wild genotype WS, in order to calculate the ratio of induction/repression.
In order to unravel the mechanism of abi8 rescue by VvMSA ectopic expression, the analysis of glucose absorption activity was performed in wild ecotype WS, abi8, abi8 + VvMSA (line 9.3c and 20.3b), and revertant WS + VvMSA seedlings. Our results revealed an at least two-fold reduction of glucose transport activity in the mutant abi8 in comparison with that of the wild ecotype WS. In addition, the glucose absorption was almost not affected in the abi8 transgenic lines 9.3c and 20.3b overexpressing VvMSA (Figure 15B). Furthermore, the hybridization of our thematic macroarray specifically dedicated to grape sugar carriers [74] with WS and abi8 probes, revealed such low expression of hexose transporters in the wild ecotype WS, that no inhibition of any of the studied AtSTP genes was detectable in the mutant abi8 (Figure 15C). In contrast, a strong induction of gene expression of the sucrose transporters AtSUC1 and AtSUC2, as well as of the polyol transporter AtPLT5, was revealed in abi8.
3. Discussion
To decipher the mediator role of VvMSA in the pathways of glucose signaling through its target, the promoter of hexose transporter VvHT1, we successfully overexpressed and repressed this grape ASR in one embryogenic (EC) and one non-embryogenic (NEC) grapevine cell culture, thus creating a total of six cell lines: WT, VvMSA-OE and VvMSA-RNAi for each of them. Both EC and NEC have already been well characterized by us in terms of their cell fates, intracellular metabolites and enzyme activities of glycolysis [71]. The EC with organized cell proliferation coupled with predominant cytoplasmic growth, very low intracellular glucose concentration used with parsimony, and thereby low glycolysis flux, could represent a suitable model for high sensitivity to the glucose signal. Conversely, the NEC displaying anarchic cell proliferation coupled to cell expansion growth, supported both by important glycolysis flux and partial switch to fermentation, could be particularly sensitive to inhibitors of glucose metabolism.
The responsiveness of the two cellular models to glucose as a metabolic signal was studied throughout the expression of the grape ASR-target VvHT1 gene, in parallel with another non-target hexose transporter gene VvHT5 (Figure 8). It has been demonstrated by numerous pharmacological assays and global transcriptomic analyses that more than 2000 plant genes are regulated by glucose [75]. Keeping in mind that unlike phytohormones, sucrose, glucose and fructose are also basic substrates of different metabolic pathways, it appears difficult to discriminate between their function as signal molecules and their roles as the substrates/intermediates of plant metabolism [6,76]. The first clearly identified intracellular glucose sensor in plants is AtHXK1 of Arabidopsis thaliana, a cytosolic type B hexokinase associated with the external mitochondrion membrane [6,53,77,78,79]. The glucose sensor function of AtHXK1 has been confirmed by the characterization of the Arabidopsis gin2 (glucose insensitive 2) mutant [14], and is involved in the regulation of many processes [80,81].
In order to gain a deeper insight into the VvMSA positioning in glucose signaling, we have set up a pharmacological approach by the administration of glucose and its analogs, which permits discrimination among the three well established pathways of glucose signal transduction. Glucose, mannose, 3OMG and the HXK competitive inhibitor mannoheptulose were administered at the same physiological concentration of 10 mM, while 2DOG was applied at 0.9 mM, in order to avoid any potential toxicity [82]. It is worth mentioning that the viability of the different cell lines under treatments with distinct effectors was demonstrated by Trypan blue staining, as described in Materials and Methods (data not shown). The real challenge lied in the set-up of a 24 h period of sugar and nitrate depletion, which started at the end of the exponential phase of cell proliferation (day 8). Such depletion compels the cells to consume their soluble intracellular sugars, thereby allowing them to remain under culture conditions that are both physiological and sufficient to observe the impact of glucose signaling on VvHT1 expression.
The supply of glucose and mannoheptulose at equimolar concentrations of 10 mM in both EC and NEC cultures did not allow the inhibitor to override the repression of VvHT1 strongly imposed by glucose (Figure S5). These results call into question the observed effects of 10 mM mannoheptulose versus the high non-physiological concentrations of 150 mM glucose and 150 mM sucrose [69,83], and the saturable nature of HXK.
The profiling of VvHT1 and VvHT5 expression regulation by sugar effectors in all studied WT and transgenic lines of both cell types allowed us to outline the glucose signaling pathways involved in the regulation of the gene expression of these two hexose transporters. It should be noted that in the studied grape-cell suspensions, compared to glucose, mannose consistently produced the same repression effect on VvHT1 and more strongly inhibited the expression of VvHT5 (Figure 7 and Figure 8). This appears to confirm mannose metabolic breakdown by cultured grape cells, a particular feature that has already been observed [83]. Taken together, the similar effects of glucose and mannose allowed us to provide evidence that VvHT1 and VvHT5 were both negatively regulated by the HXK-dependent pathway of glucose signaling, despite the missing effect of the HXK-specific inhibitor, mannoheptulose. This assumption was further assessed by the absence of any impact of mannitol as osmotic control. In this regard, 3OMG displaying a negligible phosphorylation by HXK has been supposed as not perceived by this glucose sensor, and thereby considered for analysis of the HXK-independent pathway [84]. In our study, 3OMG did not affect the gene expression of either hexose transporter, which implies that their regulation by sugar signaling necessitates at least the phosphorylation of glucose and excludes the HXK-independent glucose signaling pathway.
Our analysis of the glucose-signaling pathway, which is dependent only on HXK catalytic activity and downstream glycolysis intermediates/products, revealed strong differences in the sensitivity of both cell models to 2DOG. It has been shown in animal cells that 2DOG strongly inhibits isomerization of G6P and F6P [85]. Because of the low flux in the upper part of glycolysis in EC, it is likely that 2DOG exerts an extremely weak effect on their metabolism, contrary to that in NEC. In fact, this phosphorylatable, but not metabolizable, glucose analog repressed VvHT1 and VvHT5 similarly to glucose or mannose in the three EC lines. In non-embryogenic cells, the perturbation of glycolysis by 2DOG imposes the inhibition of VvHT1 in WT and VvMSA-OE lines in the presence of grape ASR, while the repression of grape ASR in the VvMSA-RNAi cell line hinders the downregulation of VvHT1. These overall results provide a body of evidence for the regulation of VvHT1 by glucose signaling via a glycolysis-dependent pathway. This pathway of glycolysis-dependent glucose signaling does not necessitate the sensor function, but only the catalytic function of HXK, and requires the mediation of grape ASR.
Furthermore, 2DOG triggered the induction of VvHT5 expression in all NEC lines, and this was in a grape-ASR-independent manner. It is worth noting that the gene expression of some pathogenesis-related proteins is upregulated by glucose signaling through the glycolysis-dependent pathway [86,87]. Other studies have reported VvHT5 and its Arabidopsis homolog AtSTP13 as induced in response to biotrophic and necrotrophic fungal infections [88,89,90]. In addition, the latter authors have shown that the molecular dialogue between Arabidopsis cells and Botrytis cinerea triggers major changes in host metabolism, suggesting enhanced glycolysis activity [91]. In this regard, our results provide evidence for the transcriptional regulation of VvHT5 by glucose signaling via the glycolysis-dependent pathway, independently of grape ASR (Figure 16).
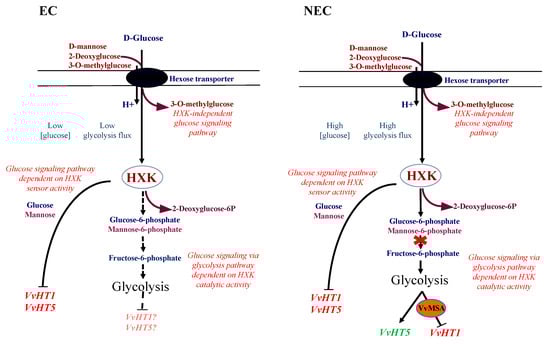
Figure 16.
Hypotheses for the regulation of VvHT1 and VvHT5 expression in glucose signaling pathways. In embryogenic cells (EC), characterized by low glucose content and low glycolysis flux, the HXK-dependent glucose signaling triggers the inhibition of both the studied genes. Mannose may be detected by the cytosolic sensor HXK, and produces the same effects as those of glucose. In grape, mannose may also be phosphorylated as a substrate of HXK catalytic activity, and the resulting mannose-6-P could be metabolized, thereby allowing a glucose signaling pathway dependent on glycolysis. The less pronounced effect of 2DOG-blocked isomerization of glucose-6-phosphate to fructose-6-phosphate could be explained by its minimal impact on low glycolysis activity. In non-embryogenic cells (NEC), by presenting a high glucose content and a high glycolysis flux, inhibition by 2DOG of glucose-6-phosphate to fructose-6-phosphate isomerization leads to metabolic disruption. This metabolic switch results in VvHT1 repression by glycolysis-dependent glucose signaling, which is mediated by its transcriptional regulator VvMSA. Inversely, the upregulation of the VvHT5 expression by glycolysis-dependent glucose signaling appears independent from VvMSA.
Metabolic analysis provided evidence that the sugar resources of EC at D8 were clearly more limited compared to those of NEC (Figure 10) [71]. During the depletion period, half of the starch content previously present in EC was consumed. Initially, very low contents of glucose and maltose were maintained nearly at the same level, allowing cells to assume moderate and synchronized cell proliferation. Inversely, alanine and glycerol were completely consumed. Alanine should be converted into pyruvate to provide carbon skeletons for the Krebs cycle. Glycerol was plausibly converted to DHAP (di-hydro acetone phosphate), which has to reintegrate into metabolism via either glycolysis or gluconeogenesis. Our overall results demonstrate that the profiles of intracellular metabolites of EC were more affected by the withdrawal of sugar and nitrates than those of NEC under deficiency [71].
Another important question is dealing with the issue of whether VvMSA repression could deeply affect the enzyme activities of glycolysis in response to the supplied sugars and sugar analogs. The study also gives support to our assumption of differential effects of the effectors between both cell types. Our analysis implies that the maximal activities of two enzymes, GluK and PFK, are significantly more increased in VvMSA-RNAi cells than in wild-type cells after 30 h of depletion (i.e., when comparing the effect of the transfer in a minimal medium to that of the control complete medium). The difference fades away 48 h after their transfer. Enzyme activities in embryogenic cells are mostly affected by glucose treatment (inhibition), but not by 2DOG. This shows that in cells which are adapted to low glucose levels and display weak flux in the upper part of the pathway, the addition of 10 mM glucose induces an important modification in the cell metabolism—the reprogramming of glycolysis enzymes. In non-embryogenic cells the activities of glycolysis enzymes are relatively similar under the conditions of “depletion” and “glucose”, but still significantly different from those under 2DOG treatment. This demonstrates that the treatment by 10 mM glucose is not likely to significantly influence the metabolism of these cells, which are habituated to high glucose concentrations. Conversely, the treatment by 2DOG induces the reprogramming of glycolytic enzymes, and probably reflects flux perturbation in glycolysis. This result appears to corroborate the assumption that VvMSA repression perturbs adaptive cell metabolism in response to sugar and nitrate starvation.
As glucose is not only a metabolic signal, but also the specific substrate of the VvHT1 transporter (target of the grape ASR), the analysis of its absorption activity in all cell lines of both EC and NEC types completed our study. In the latter context, as previously reported in yeast and grape cell cultures, VvHT1 operates as a high-affinity (Km = 50 mM Glc) and broad-specificity monosaccharide-proton cotransport system [69,92]. These VvHT1 features have been further corroborated by high-affinity absorption corresponding to similar Km values determined for hexose uptake in cell suspensions of tobacco [93], carrot [94], olive [59], in guard cell protoplasts of pea [95], as well as in yeast, lower and higher plants expressing monosaccharide transporters (MSTs) [58]. This high affinity measured for VvHT1 as an H+-dependent monosaccharide transporter may be important for cell growth in media where the sugar supply rapidly becomes limiting [69]. The latter assumption implies that the glucose transporter VvHT1 should be responsive to physiological concentrations of glucose (10 mM) at both levels, gene expression and protein activity, as already reported [77].
It is likely that the glucose supply at low physiological concentration (10 mM), which strongly inhibited VvHT1 and VvHT5, does not affect glucose transport in a significant manner. The transport was mainly affected by 2DOG treatment (0.9 mM), which implies that the latter is preferentially regulated in response to modifications in the cell energy metabolism. The comparison of the effects of glucose signaling on VvHT1 and VvHT5 expression and the impacts of this same signal on the global glucose uptake strongly suggest a decoupling in the regulation of gene expression and absorption activity of these hexose transporters. Our results are in accordance with the already reported lack of correspondence between transcript and protein steady-state levels of the VvHT1 transporter [69]. This assumption could be partially assessed by the relatively long half-life of these proteins compared to that of their transcripts. The authors of the latter have also demonstrated by immunoblot analysis the post-transcriptional repression of the VvHT1 protein in terms of reduced transporter presence on the plasma membrane at high 150 mM glucose concentration. Furthermore, it has been suggested that high glucose levels may repress glucose transport activity at the protein level, triggering inactivation, mistargeting, and/or proteolysis of VvHT1 [69]. Obviously, this phenomenon coping with glucose concentration as substrate, but not as metabolic signal, is common for rate-limiting proteins, such as transporters, and has been well demonstrated in yeast, where it is denoted as carbon inactivation [96,97,98].
The isolation of glucose-insensitive or glucose-hypersensitive mutants and the characterization of genes that are affected by these mutations has highlighted close relationships between glucose-signaling and ABA-dependent and ethylene-dependent signaling in the control of the early phases of plant development [99,100,101,102,103,104,105]. Several loci have been associated with both sugar- and ABA-responses, which implies a common transduction pathway of sugar and ABA signals. These mutants have been classified into two groups: the first ones are affected in key ABA biosynthetic enzymes (ABA1, ABA2/GIN1/ISI1/SIS4, and ABA3/GIN5/LOS5), and the second ones are affected in the sensitivity to ABA and act as transcription factors (ABI3, ABI4/GIN6/ISI3/SIS5/SUN6, ABI5) [103,106,107]. Because ABA3 is an ABA biosynthetic gene, it is likely that accumulation of ABA is a prerequisite for triggering a response to a perceived “glucose” signal [100]. The latter assumption has been corroborated by the finding of other glucose-insensitive aba mutants—aba1-1, aba2-1 and aba3-2 [100]. Moreover, the supplementation of ABA at a physiological concentration (100 nM) in the culture medium overrides the glucose insensitivity of the mutants gin5/aba3 [103]. Interestingly, the three ABI genes encoding different transcription factors (ABI3, ABI4 and ABI5) appear to function in the same signaling pathway for mediating seed germination and early seedling development in response to ABA [108]. In contrast, ABI8/ELD1/KOB1 appears to function downstream of EIN2 and EIN3 in ethylene-dependent signaling, and possibly in a separate pathway from those requiring action of ABI transcription factors to regulate ABA effects on germination [73].
The overexpression of tomato ASR, SlASR1, in Arabidopsis has been demonstrated to decrease germination sensitivity to ABA and glucose, and thereby to confer an abi mutant phenotype [109]. Through using chromatin immunoprecipitation assay with SlASR1 antibody, the same authors have reported that tomato ASR1 binds to the ABI4 promoter in vivo and specifically recognizes the CE1 element. The latter appears to be not only the binding sequence of ABI4 target genes, but also a cis-element of the proper promoter of ABI4, which is responsible for the positive feedback of its transcription autoregulation. The ABI4 gene encodes an APETALA 2 (AP2) domain transcription factor, which is involved in the fine-tuning of seed development and germination [72,110,111]. However, the ChIP approach has not revealed any SlASR1 binding activity to promoter sequences of genes that are directly regulated by ABI3 and ABI5 transcription factors. The proposed model suggests that tomato ASR1 may compete with ABI4 for the same binding sequence. Concerning our attempt for functional complementation of abi4 mutant, the ectopic expression of grape ASR failed to restore seed germination sensitivity to ABA and glucose. Despite the difference between the ABI4 binding sequence CE1 (CACCG), partially overlapping that of SlASR1 (C2-3(C/G)A, and that identified by us for VvMSA, as a combination of “Sucrose box 3” (AAATCA) and SURE1 (ATAGAAA) elements in the native context of VvHT1 promoter [32], both ASRs affect germination resistance phenotypes. A plausible explanation may be the high DNA-binding ability of ASR proteins, and their capacity to form protein heterodimers. VvMSA, an architectural type transcription factor, might affect the recruitment of ABI4 required for the induction of a subset of genes.
It is worth noting that VvMSA provides partial functional complementation of the Arabidopsis abi8 mutant. ABI8 appears to be regulated in an ABA- and ethylene-dependent signaling pathway, different from the strictly ABA-dependent one, which requires ABI3, ABI4 and ABI5 genes [73]. We provide evidence for a plausible molecular mechanism relying on a two-fold reduced glucose uptake by abi8 mutants compared to that of wild ecotype WS- and VvMSA-overexpressing lines. These results raise the question of whether glucose uptake in the abi8 mutant is sufficient to yield an intracellular signal. They are further corroborated by the very low gene expression of hexose transporters versus the strong upregulation of two sucrose carriers and one polyol transporter in the mutant. In fact, the mutants require glucose, but not sucrose to maintain root growth. Moreover, our previous studies have shown that abi8 growth is not only dependent on low concentrations of glucose, but is also resistant to the inhibitory effects of high glucose, suggesting a defect in sugar signaling and/or transport. We have already demonstrated that the expression of vacuolar and cytosolic invertases, as well as of another cytosolic sucrose-cleaving enzyme, sucrose synthase, was reduced in mutant roots [73]. Our unpublished results imply that ABI8 is involved in the Golgi trafficking of membrane proteins and thus may exert an indirect effect on glucose and ABA response. It is possible that they upregulate sucrose transporters as a response to being “starved” for sugars because they are inefficient at inserting the transporters into membranes. The presented results provide evidence for reduced glucose uptake of abi8, which combined with inefficient intracellular sucrose cleavage, caused its stunted root phenotype.
4. Materials and Methods
4.1. Embryogenic and Non-Embryogenic Cell Cultures
The grapevine embryogenic cells (EC) originate from the rootstock hybrid 41B, the most commonly used rootstock in the vineyards of Champagne (a hybrid between Vitis vinifera L. cv. Chasselas × Vitis berlandieri P.), and were used for genetic transformation via somatic embryogenesis and the subsequent regeneration of transgenic vitroplants, from which were derived the non-embryogenic cells (NEC). EC and NEC were cultured into their specific media permitting the maintenance of growth and metabolic specificity of each cell type, as previously described by us [71]. The 41B embryogenic cells were transformed with the 35S::VvMSA-RNAi construct via Agrobacterium tumefaciens strain EHA 105, coculture of the grape 41B cells with the bacteria, for 60 h on the above-mentioned solid medium, and selection of transformed cells on paromomycin (2 µg·mL−1) [112]. The somatic embryogenesis of 41B cells was induced by their subculture into the same fresh medium depleted of auxin and at 26 °C. The pretreatment of EC before the supply of effectors was carried out after 8 days of subculture by washing the cells three times in a minimal GM medium (i.e., 0.5× Murashige Skoog). The whole volume of the medium was aspirated without disturbing the cells that were immediately overlaid with an equivalent volume of the same medium. The cell suspension was then placed on an orbital shaker for 15 min at 110 rpm. After that, 0.2 mL of packed cell volume (PCV) was resuspended in 3 mL of minimal GM medium in a 6-well cell culture plate (Nunc). The pretreatment of non-embryogenic cells was carried out under the same procedure as that of the EC after 8 days of subculture, but with a minimal Gamborg medium. As a next step, 0.3 mL of the PCV cells were resuspended in 3 mL of minimal Gamborg medium in a 6-well cell culture plate (Nunc). After pretreatment, both embryogenic and non-embryogenic cells were incubated for 24 h under agitation at 110 rpm, in the dark, and at a constant temperature of 21 °C.
4.2. Treatment with Glucose and Glucose Analogs of Embryogenic and Non-Embryogenic Cells
The effectors were supplied by addition of 30 µL of 1M solutions of glucose, mannose, 3-O-methylglucose (3OMG) or mannitol, and of 27 µL of 100 mM 2-déoxyglucose (2DOG) per microplate well containing 3 mL of cell suspension (10 mM final concentration of glucose, mannose, 3OMG, mannitol, and 0.9 mM final concentration of 2DOG). The cells were incubated for an additional 24 h under agitation at 110 rpm, in the dark at a constant temperature of 21 °C. Our experimental protocol consisted of maintaining cells in a minimal medium devoid of sugars and nitrates for 24 h, just before initiating treatments with effectors for an additional 6 h and 24 h (for a total of 30 h or 48 h). In order to evaluate the impact of the transfer of cells in a minimal medium (Depletion), we comparatively analyzed enzyme activities of cells in complete medium (Control). The experimental conditions were denoted so far as “Control” (transfected cells in complete culture medium during 24 h plus an additional 6 h or 24 h), “Depletion” (transfected cells in minimal culture medium during 24 h plus an additional 6 h or 24 h), “Glucose” and “2DOG” (transfected cells in minimal culture medium during 24 h that were treated with 10 mM glucose or 0.9 M 2DOG for an additional 6 h or 24 h, respectively). The cells were collected under partial vacuum on glass microfiber filters (Fisherbrand) mounted in a filtration unit (Millipore) and then rinsed with 10 mL of the respective minimal medium for each of the two cell types. Before sample collection, cell viability was estimated by Trypan blue which stains dead cells only. One drop of cell suspension was directly mixed with equal volume of 0.4% Trypan blue solution in ddH2O in a Malassez cell-counting chamber and observed by microscope (Olympus BH; 100×).
4.3. Germination Assays
Germination assays were performed with seeds that were surface sterilized in 5% hypochlorite and 0.02% Triton X-100 and then rinsed several times with sterile water before plating on minimal medium containing 0.7% (w/v) agar supplemented with different concentrations of ABA or glucose [73]. The dishes were incubated for 3 days at 4 °C to break any residual dormancy and then transferred to 22 °C in continuous light (50 to 70 µE·m−2·s−1). Germination was scored as emergence of entire seedling from seed coat after 4 days. Transformation of WT, abi4-1 (AT2G40220), and abi8/+ (AT3G08550) mutants with 35S::VvMSA was performed using Agrobacterium tumefaciens by floral dip in planta transformation [113]. Independent transformants were selected on 40 µg/mL kanamycin-supplemented minimal medium in order to identify homozygous lines. Germination analyses were performed on 150–200 seeds per T3 homozygous line.
4.4. Glucose Uptake into Embryogenic and Non-Embryogenic Cells, and Arabidopsis Seedlings
For each of the studied conditions, 225 mg of EC or 450 mg of NEC, that had previously been filtered and rinsed, was resuspended in 12 mL of minimal GM medium or minimal Gb medium, respectively. The cells were incubated in equilibration buffer containing 0.2 M glucose for 30 min at 115 rpm orbital agitation. After equilibration, 14C glucose was added at 0.1 μCi·mL−1 specific radioactivity and aliquots were taken in triplicate every ten minutes, from 0 min to 30 min. The cells were collected by filtration onto glass microfiber filters (Fisherbrand, Houston, TX, USA) and washed three times with the respective equilibration medium. In parallel, the involvement of the proton-motive force in sugar uptake was evaluated by addition of 20 μM carbonyl cyanide m-chlorophenylhydrazone (CCCP) to the incubation buffer 10 min before the input of radiolabelled glucose.
Glucose absorption activity of the Arabidopsis wild ecotype WS (Wasilewskaja), abi8 mutant and their transgenic lines homozygous for grape ASR, VvMSA, was measured on seedlings grown for 4 days on minimal medium to permit identification of abi8 segregants based on their stunted growth and then transferred to minimal medium with 1% glucose for an additional 4 days before harvesting. 14C-glucose uptake was measured on ten seedlings, previously weighed to determine the exact fresh weight, and incubated after gentle infiltration into 200 µL of Gamborg B5 medium, for 30 min, at room temperature. In order to trigger absorption, the used incubation medium was replaced by 200 µL of a fresh one containing 50 µM glucose and 0.1 µCi 14C-glucose. Radioactivity was measured at four time points (0, 15, 30 and 60 min), after aspiration of reaction medium and five washes with cold Gamborg B5 medium without sugar. Absorption activity was expressed as pmoles of glucose per mg of fresh weight. At least three independent biological repetitions were carried out for each of the studied lines, with three technical replicates per biological repetition.
The samples were incubated in digestion buffer (13% perchloric acid (v/v), 12% hydrogen peroxide (v/v), 0.04% Triton X-100 (v/v)) for 24 h at 60 °C. Incorporated radioactivity was determined by liquid scintillation counting (Tri-Carb 2910 TR, PerkinElmer, Waltham, MA, USA).
4.5. Real-Time RT-qPCR Analysis
Reverse transcription was carried out on 2 µg of DNase-treated total RNA according to manufacturer protocol (Promega, Madison, WI, USA). RTqPCR was performed as described previously [15,71]. Accession numbers and primers of studied genes VvMSA (Q94G23_VITVI) F-GCATGTGTGCTTGTTGTGTAA and R-TCACAAGGACACACAGAGAGA; VvHT1 (E3VWT5_VITVI) F-TATATTGGTGTCGGATTGCT and R-AAGAAGAACATAGGGAAAGC; VvHT5 (Q3L7K6_VITVI) F-TAGTGATGCGTCCCTCTACTCA and R-CTTCCAGCAAGAGCAATCGAC, and the reference genes VvActin (Q94KC1_VITVI) F-GCATCCCTCAGCACCTTCCA and R-AACCCCACCTCAACACATCTCC; VvGAPDH (F6GSG7_VITVI) F-TTCTCGTTGAGGGCTATTCCA and R-CCACAGACTTCATCGGTGACA.
4.6. Macroarray Analysis
Total RNA isolation, cloning of specific cDNA fragments for genes of interest, reference genes, macroarray spotting and hybridization were performed as described previously [74]. In the latter publication, we provided the accession numbers and the primer sequences of all sugar transporter genes. After quantification (Typhoon TRIO Imager, GE Healthcare, UK), signals for each gene of interest were normalized using the mean of the four reference genes. Their accession numbers and primer sequences were: VvGAPDH (F6GSG7_VITVI) F-CGACCATTGTTACTGCTGT and R-GAAATCCAGGGGCAAAAC; VvActin (Q94KC1_VITVI) F-AGCTGGAAACTGCAAAGAGCAG and R-ACAACGGAATCTCTCAGCTCCA; VvEF1a (A5AFS1_VITVI) F-GAACTGGGTGCTTGATAGGC and R-AACCAAAATATCCGGAGTAAAAGA; VvEF1γ (A0A438CSH7_VITVI) F-AGCTTTTACCGCGGGCAAGAGATACC and R-TTTGGATAGGTAACGTATCACTTAAATAAC.
4.7. Metabolomic Analysis
For the 1H-NMR analysis, polar metabolites were extracted, titrated, lyophilized (EZ Dry-FTS system), solubilized and pretreated as described by [114]. 1H-NMR spectra were recorded at 500.16 MHz and 300 K on a Bruker Avance III spectrometer using a 5 mm inverse probe and an electronic reference for quantification (Digital ERETIC, Bruker TopSpin 3.0). The assignments of metabolites in the NMR spectra were made by comparing the proton chemical shifts with literature values [115,116,117], with the spectra of authentic compounds recorded under the same buffer conditions and by spiking the samples with standards. Metabolite concentrations in the NMR tube were calculated using Analytical Profiler mode of AMIX software (version 3.9.10, Bruker, Billerica, MA, USA) for calculation of resonance areas, followed by data export to Excel software. The 2D-homonuclear correlation spectroscopy (1H-1H COSY) experiments were carried out to verify the identity of known compounds and to check whether unknown signals really correspond to different compounds. Starch was determined as described previously [118].
4.8. Enzyme Activities
Extraction was performed as described previously [119]. All enzyme activities were carried out on a robotized platform [120], and assayed as described respectively: phosphoglucose isomerase—PGI [121]; enolase and triose phosphate isomerase—TPI [122]; phosphoglucomutase—PGM [123]; pyruvate kinase—PK, glucokinase—GK, fructokinase—FK, phosphoenolpyruvate carboxylase—PEPC and ATP-dependent phosphofructokinase—PFK [120]; phosphoglycerokinase—PGK [124]; aldolase [125]. Proteins were quantified by the method of Bearden [126].
5. Conclusions
We deciphered the mediator role of the grape ASR protein, VvMSA, in the pathways of glucose signaling through the regulation of its target, the promoter of hexose transporter VvHT1. By using different glucose analogs to discriminate between distinct pathways of glucose signal transduction, we revealed VvMSA positioning as a transcriptional regulator of the glucose transporter gene VvHT1 in a glycolysis-dependent glucose signaling pathway. The analysis of the effects of VvMSA overexpression/repression on glucose transport and the activities of glycolysis enzymes revealed its role as a mediator in the interplay of glucose metabolism, transport and signaling. Ectopic expression of VvMSA in the Arabidopsis mutant abi8 resulted in its partial functional complementation by improving glucose absorption activity, thereby suggesting common roles of these two proteins in the repression of seed germination through the regulation of metabolic trafficking. We revealed that, in grape cells under heterotrophic culture conditions, the repression of the major hexose transporter VvHT1 via the glycolysis-dependent glucose signaling requires VvMSA, while the expression inhibition of another hexose transporter VvHT5 is independent of VvMSA. The overall results permitted us to build a model for the differential regulation of gene expression of the hexose transporters VvHT1 and VvHT5 in HXK-dependent glucose signaling pathways.
Supplementary Materials
The following supporting information can be downloaded at: https://www.mdpi.com/article/10.3390/ijms23116194/s1.
Author Contributions
R.A., R.R.F., A.M., J.P., M.L., Y.G. and D.R. designed experiments and discussed the data. J.P., A.M., C.G., J.V., Y.G., D.R., M.L., R.R.F. and R.A. performed experiments. R.A. conceived the project and wrote the manuscript. All authors have read and agreed to the published version of the manuscript.
Funding
J.P. and A.M. were supported with PhD grants by the Region of Poitou-Charentes. Y.G. and D.R. were supported by MetaboHUB (ANR-11-INBS-0010). R.A. was supported by the Region of Poitou-Charentes with a grant of visiting professor in the UCSB, with partial support from United States Department of Energy grant DE-FG02-04ER15544.
Data Availability Statement
Not applicable.
Acknowledgments
We are grateful to Hristo Atanassov for fruitful discussion, critical reading, and help in manuscript preparation. We thank Lucie Slawinski for help in generation of the phylogenetic tree of the ASRs.
Conflicts of Interest
The authors declare no conflict of interest.
References
- Rolland, F.; Baena-Gonzalez, E.; Sheen, J. Sugar sensing and signaling in plants: Conserved and Novel Mechanisms. Annu. Rev. Plant Biol. 2006, 57, 675–709. [Google Scholar] [CrossRef] [PubMed]
- Ramon, M.; Rolland, F.; Thevelein, J.M.; Van Dijck, P.; Leyman, B. ABI4 mediates the effects of exogenous trehalose on Arabidopsis growth and starch breakdown. Plant Mol. Biol. 2007, 63, 195–206. [Google Scholar] [CrossRef] [PubMed]
- Paul, M.J.; Primavesi, L.F.; Jhurreea, D.; Zhang, Y. Trehalose Metabolism and Signaling. Annu. Rev. Plant Biol. 2008, 59, 417–441. [Google Scholar] [CrossRef] [PubMed]
- Ramon, M.; De Smet, I.; Vandesteene, L.; Naudts, M.; Leyman, B.; Van Dijck, P.; Rolland, F.; Beeckman, T.; Thevelein, J.M. Extensive expression regulation and lack of heterologous enzymatic activity of the Class II trehalose metabolism proteins from Arabidopsis thaliana. Plant Cell Environ. 2009, 32, 1015–1032. [Google Scholar] [CrossRef]
- Horacio, P.; Martínez-Noël, G. Sucrose signaling in plants: A world yet to be explored. Plant Signal. Behav. 2013, 8, e23316. [Google Scholar] [CrossRef]
- Sakr, S.; Wang, M.; Dédaldéchamp, F.; Perez-Garcia, M.-D.; Ogé, L.; Hamama, L.; Atanassova, R. The Sugar-Signaling Hub: Overview of Regulators and Interaction with the Hormonal and Metabolic Network. Int. J. Mol. Sci. 2018, 19, 2506. [Google Scholar] [CrossRef]
- Morkunas, I.; Borek, S.; Formela, M.; Ratajczak, L. Plant responses to sugar starvation. In Carbohydrates Comprehensive Studies on Glycobiology and Glycotechnology; Chang, C.-F., Ed.; IntechOpen: New York, NY, USA, 2012; pp. 409–438. [Google Scholar] [CrossRef]
- Eveland, A.L.; Jackson, D.P. Sugars, signalling, and plant development. J. Exp. Bot. 2012, 63, 3367–3377. [Google Scholar] [CrossRef]
- Lastdrager, J.; Hanson, J.; Smeekens, S. Sugar signals and the control of plant growth and development. J. Exp. Bot. 2014, 65, 799–807. [Google Scholar] [CrossRef]
- Arenhart, R.A.; De Lima, J.C.; Pedron, M.; Carvalho, F.; Da Silveira, J.A.G.; Rosa, S.B.; Caverzan, A.; Andrade, C.M.B.; Schünemann, M.; Margis, R.; et al. Involvement of ASR genes in aluminium tolerance mechanisms in rice. Plant Cell Environ. 2013, 36, 52–67. [Google Scholar] [CrossRef]
- De Vienne, D.; Leonardi, A.; Damerval, C.; Zivy, M. Genetics of proteome variation for QTL characterization: Application to drought-stress responses in maize. J. Exp. Bot. 1999, 50, 303–309. [Google Scholar] [CrossRef]
- Huang, K.; Zhong, Y.; Li, Y.; Zheng, D.; Cheng, Z.-M. Genome-wide identification and expression analysis of the apple ASR gene family in response to Alternaria alternata f. sp. mali. Genome 2016, 59, 866–878. [Google Scholar] [CrossRef] [PubMed]
- Jeanneau, M.; Gerentes, D.; Foueillassar, X.; Zivy, M.; Vidal, J.; Toppan, A.; Perez, P. Improvement of drought tolerance in maize: Towards the functional validation of the Zm-Asr1 gene and increase of water use efficiency by over-expressing C4–PEPC. Biochimie 2002, 84, 1127–1135. [Google Scholar] [CrossRef]
- Liu, H.; Dai, J.; Feng, D.; Liu, B.; Wang, H.; Wang, J. Characterization of a Novel Plantain Asr Gene, MpAsr, that is Regulated in Response to Infection of Fusarium oxysporum f. sp. cubense and Abiotic Stresses. J. Integr. Plant Biol. 2010, 52, 315–323. [Google Scholar] [CrossRef] [PubMed]
- Medici, A.; Laloi, M.; Atanassova, R. Profiling of sugar transporter genes in grapevine coping with water deficit. FEBS Lett. 2014, 588, 3989–3997. [Google Scholar] [CrossRef]
- Schneider, A.; Salamini, F.; Gebhardt, C. Expression Patterns and Promoter Activity of the Cold-Regulated Gene ci21A of Potato. Plant Physiol. 1997, 113, 335–345. [Google Scholar] [CrossRef][Green Version]
- Vaidyanathan, R.; Kuruvilla, S.; Thomas, G. Characterization and expression pattern of an abscisic acid and osmotic stress responsive gene from rice. Plant Sci. 1999, 140, 21–30. [Google Scholar] [CrossRef]
- Wang, C.-S.; Liau, Y.-E.; Huang, J.-C.; Wu, T.-D.; Su, C.-C.; Lin, C.H. Characterization of a Desiccation-Related Protein in Lily Pollen during Development and Stress. Plant Cell Physiol. 1998, 39, 1307–1314. [Google Scholar] [CrossRef]
- Iusem, N.; Bartholomew, D.M.; Hitz, W.D.; Scolnik, P.A. Tomato (Lycopersicon esculentum) Transcript Induced by Water Deficit and Ripening. Plant Physiol. 1993, 102, 1353–1354. [Google Scholar] [CrossRef]
- Padmanabhan, V.; Dias, D.M.; Newton, R.J. Expression analysis of a gene family in loblolly pine (Pinus taeda L.) induced by water deficit stress. Plant Mol. Biol. 1997, 35, 801–807. [Google Scholar] [CrossRef]
- Lecoy, J.; Garciá-Gil, M.R. Evolutionary analysis of LP3 gene family in conifers: An ASR homolog. bioRxiv 2020. [Google Scholar] [CrossRef]
- Wong, C.E.; Li, Y.; Labbe, A.; Guevara, D.; Nuin, P.; Whitty, B.; Diaz, C.; Golding, G.B.; Gray, G.R.; Weretilnyk, E.A.; et al. Transcriptional Profiling Implicates Novel Interactions between Abiotic Stress and Hormonal Responses in Thellungiella, a Close Relative of Arabidopsis. Plant Physiol. 2006, 140, 1437–1450. [Google Scholar] [CrossRef] [PubMed]
- Plessl, M.; Rigola, D.; Hassinen, V.; Aarts, M.G.M.; Schat, H.; Ernst, D. Transcription Profiling of the Metal-hyperaccumulator Thlaspi caerulescens (J. & C. PRESL). Z. Naturforsch. 2005, 60, 216–223. [Google Scholar] [CrossRef]
- Goldgur, Y.; Rom, S.; Ghirlando, R.; Shkolnik, D.; Shadrin, N.; Konrad, Z.; Bar-Zvi, D. Desiccation and Zinc Binding Induce Transition of Tomato Abscisic Acid Stress Ripening 1, a Water Stress- and Salt Stress-Regulated Plant-Specific Protein, from Unfolded to Folded State. Plant Physiol. 2007, 143, 617–628. [Google Scholar] [CrossRef] [PubMed]
- Dai, J.-R.; Liu, B.; Feng, D.-R.; Liu, H.-Y.; He, Y.-M.; Qi, K.-B.; Wang, H.-B.; Wang, J.-F. MpAsr encodes an intrinsically unstructured protein and enhances osmotic tolerance in transgenic Arabidopsis. Plant Cell Rep. 2011, 30, 1219–1230. [Google Scholar] [CrossRef]
- Hamdi, K.; Salladini, E.; O’Brien, D.P.; Brier, S.; Chenal, A.; Yacoubi, I.; Longhi, S. Structural disorder and induced folding within two cereal, ABA stress and ripening (ASR) proteins. Sci. Rep. 2017, 7, 15544. [Google Scholar] [CrossRef] [PubMed]
- Atanassov, H.; Parrilla, J.; Artault, C.; Verbeke, J.; Schneider, T.; Grossmann, J.; Roschitzki, B.; Atanassova, R. Grape ASR-Silencing Sways Nuclear Proteome, Histone Marks and Interplay of Intrinsically Disordered Proteins. Int. J. Mol. Sci. 2022, 23, 1537. [Google Scholar] [CrossRef]
- Wetzler, D.E.; Wightman, F.F.; Bucci, H.A.; Rinaldi, J.; Caramelo, J.J.; Iusem, N.D.; Ricardi, M.M. Conformational plasticity of the intrinsically disordered protein ASR1 modulates its function as a drought stress-responsive gene. PLoS ONE 2018, 13, e0202808. [Google Scholar] [CrossRef]
- Gilad, A.; Amitai-Zeigerson, H.; Bar-Zvi, D.; Scolnik, P.A. ASR1, a tomato water-stress regulated gene: Genomic organization, developmental regulation and dna-binding activity. Acta Hortic. 1997, 447, 447–454. [Google Scholar] [CrossRef]
- Rom, S.; Gilad, A.; Kalifa, Y.; Konrad, Z.; Karpasas, M.M.; Goldgur, Y.; Bar-Zvi, D. Mapping the DNA- and zinc-binding domains of ASR1 (abscisic acid stress ripening), an abiotic-stress regulated plant specific protein. Biochimie 2006, 88, 621–628. [Google Scholar] [CrossRef]
- Konrad, Z.; Bar-Zvi, D. Synergism between the chaperone-like activity of the stress regulated ASR1 protein and the osmolyte glycine-betaine. Planta 2008, 227, 1213–1219. [Google Scholar] [CrossRef]
- Çakir, B.; Agasse, A.; Gaillard, C.; Saumonneau, A.; Delrot, S.; Atanassova, R. A Grape ASR Protein Involved in Sugar and Abscisic Acid Signaling. Plant Cell 2003, 15, 2165–2180. [Google Scholar] [CrossRef] [PubMed]
- Kalifa, Y.; Gilad, A.; Konrad, Z.; Zaccai, M.; Scolnik, P.A.; Bar-Zvi, D. The water- and salt-stress-regulated Asr1 (abscisic acid stress ripening) gene encodes a zinc-dependent DNA-binding protein. Biochem. J. 2004, 381, 373–378. [Google Scholar] [CrossRef] [PubMed]
- Wang, H.-J.; Hsu, C.-M.; Jauh, G.Y.; Wang, C.-S. A lily pollen ASR protein localizes to both cytoplasm and nuclei requiring a nuclear localization signal. Physiol. Plant 2005, 123, 314–320. [Google Scholar] [CrossRef]
- Ricardi, M.; Guaimas, F.F.; González, R.M.; Burrieza, H.P.; López-Fernández, M.P.; Jares-Erijman, E.A.; Estevez, J.; Iusem, N. Nuclear Import and Dimerization of Tomato ASR1, a Water Stress-Inducible Protein Exclusive to Plants. PLoS ONE 2012, 7, e41008. [Google Scholar] [CrossRef] [PubMed]
- Li, N.; Wei, S.; Chen, J.; Yang, F.; Kong, L.; Chen, C.; Ding, X.; Chu, Z. OsASR2 regulates the expression of a defence-related gene, Os2H16, by targeting the GT-1cis-element. Plant Biotechnol. J. 2018, 16, 771–783. [Google Scholar] [CrossRef]
- Maskin, L.; Frankel, N.; Gudesblat, G.; Demergasso, M.J.; Pietrasanta, L.I.; Iusem, N.D. Dimerization and DNA-binding of ASR1, a small hydrophilic protein abundant in plant tissues suffering from water loss. Biochem. Biophys. Res. Commun. 2007, 352, 831–835. [Google Scholar] [CrossRef]
- Saumonneau, A.; Agasse, A.; Bidoyen, M.-T.; Lallemand, M.; Cantereau, A.; Medici, A.; Laloi, M.; Atanassova, R. Interaction of grape ASR proteins with a DREB transcription factor in the nucleus. FEBS Lett. 2008, 582, 3281–3287. [Google Scholar] [CrossRef]
- Arenhart, R.A.; Schünemann, M.; Neto, L.B.; Margis, R.; Wang, Z.-Y.; Margis-Pinheiro, M. RiceASR1andASR5are complementary transcription factors regulating aluminium responsive genes. Plant Cell Environ. 2016, 39, 645–651. [Google Scholar] [CrossRef]
- Yoon, J.S.; Seo, Y.W. BdERF96 interacts with BdASR1 to specifically respond to drought and oxidative stress in Brachypodium distachyon. J. Plant Biochem. Biotechnol. 2021, 30, 287–296. [Google Scholar] [CrossRef]
- Li, H.; Guan, H.; Zhuo, Q.; Wang, Z.; Li, S.; Si, J.; Zhang, B.; Feng, B.; Kong, L.-A.; Wang, F.; et al. Genome-wide characterization of the abscisic acid-, stress- and ripening-induced (ASR) gene family in wheat (Triticum aestivum L.). Biol. Res. 2020, 53, 1–16. [Google Scholar] [CrossRef]
- Zhao, B.; Yi, X.; Qiao, X.; Tang, Y.; Xu, Z.; Liu, S.; Zhang, S. Genome-Wide Identification and Comparative Analysis of the ASR Gene Family in the Rosaceae and Expression Analysis of PbrASRs During Fruit Development. Front. Genet. 2021, 12, 792250. [Google Scholar] [CrossRef] [PubMed]
- Hsu, Y.-F.; Yu, S.-C.; Yang, C.-Y.; Wang, C.-S. Lily ASR protein-conferred cold and freezing resistance in Arabidopsis. Plant Physiol. Biochem. 2011, 49, 937–945. [Google Scholar] [CrossRef] [PubMed]
- Zhang, L.; Hu, W.; Wang, Y.; Feng, R.; Zhang, Y.; Liu, J.; Jia, C.; Miao, H.; Zhang, J.; Xu, B.; et al. The MaASR gene as a crucial component in multiple drought stress response pathways in Arabidopsis. Funct. Integr. Genom. 2015, 15, 247–260. [Google Scholar] [CrossRef] [PubMed]
- Park, S.-I.; Kim, J.-J.; Shin, S.-Y.; Kim, Y.-S.; Yoon, H.-S. ASR Enhances Environmental Stress Tolerance and Improves Grain Yield by Modulating Stomatal Closure in Rice. Front. Plant Sci. 2020, 10, 1752. [Google Scholar] [CrossRef]
- Yacoubi, I.; Gadaleta, A.; Mathlouthi, N.; Hamdi, K.; Giancaspro, A. Abscisic Acid-Stress-Ripening Genes Involved in Plant Response to High Salinity and Water Deficit in Durum and Common Wheat. Front. Plant Sci. 2022, 13, 789701. [Google Scholar] [CrossRef]
- Liang, Y.; Jiang, Y.; Du, M.; Li, B.; Chen, L.; Chen, M.; Jin, D.; Wu, J. ZmASR3 from the Maize ASR Gene Family Positively Regulates Drought Tolerance in Transgenic Arabidopsis. Int. J. Mol. Sci. 2019, 20, 2278. [Google Scholar] [CrossRef]
- Lin, R.; Zou, T.; Mei, Q.; Wang, Z.; Zhang, M.; Jian, S. Genome-Wide Analysis of the Late Embryogenesis Abundant (LEA) and Abscisic Acid-, Stress-, and Ripening-Induced (ASR) Gene Superfamily from Canavalia rosea and Their Roles in Salinity/Alkaline and Drought Tolerance. Int. J. Mol. Sci. 2021, 22, 4554. [Google Scholar] [CrossRef]
- Zhang, J.; Zhu, Q.; Yu, H.; Li, L.; Zhang, G.; Chen, X.; Jiang, M.; Tan, M. Comprehensive Analysis of the Cadmium Tolerance of Abscisic Acid-, Stress- and Ripening-Induced Proteins (ASRs) in Maize. Int. J. Mol. Sci. 2019, 20, 133. [Google Scholar] [CrossRef]
- Shao, Y.; Cheng, Y.; Pang, H.; Chang, M.; He, F.; Wang, M.; Davis, D.J.; Zhang, S.; Betz, O.; Fleck, C.; et al. Investigation of Salt Tolerance Mechanisms Across a Root Developmental Gradient in Almond Rootstocks. Front. Plant Sci. 2021, 11, 2005. [Google Scholar] [CrossRef]
- Neto, L.B.; Arenhart, R.A.; De Oliveira, L.F.V.; De Lima, J.C.; Bodanese-Zanettini, M.H.; Margis, R.; Margis-Pinheiro, M. ASR5 is involved in the regulation of miRNA expression in rice. Plant Cell Rep. 2015, 34, 1899–1907. [Google Scholar] [CrossRef]
- Sheen, J.; Zhou, L.; Jang, J.-C. Sugars as signaling molecules. Curr. Opin. Plant Biol. 1999, 2, 410–418. [Google Scholar] [CrossRef]
- Moore, B.; Zhou, L.; Rolland, F.; Hall, Q.; Cheng, W.-H.; Liu, Y.-X.; Hwang, I.; Jones, T.; Sheen, J. Role of the Arabidopsis Glucose Sensor HXK1 in Nutrient, Light, and Hormonal Signaling. Science 2003, 300, 332–336. [Google Scholar] [CrossRef] [PubMed]
- Saumonneau, A.; Laloi, M.; Lallemand, M.; Rabot, A.; Atanassova, R. Dissection of the transcriptional regulation of grape ASR and response to glucose and abscisic acid. J. Exp. Bot. 2012, 63, 1495–1510. [Google Scholar] [CrossRef] [PubMed]
- Frankel, N.; Nunes-Nesi, A.; Balbo, I.; Mazuch, J.; Centeno, D.; Iusem, N.D.; Fernie, A.R.; Carrari, F. ci21A/Asr1 expression influences glucose accumulation in potato tubers. Plant Mol. Biol. 2007, 63, 719–730. [Google Scholar] [CrossRef] [PubMed]
- Virlouvet, L.; Jacquemot, M.-P.; Gerentes, D.; Corti, H.; Bouton, S.; Gilard, F.; Valot, B.; Trouverie, J.; Tcherkez, G.; Falque, M.; et al. The ZmASR1 Protein Influences Branched-Chain Amino Acid Biosynthesis and Maintains Kernel Yield in Maize under Water-Limited Conditions. Plant Physiol. 2011, 157, 917–936. [Google Scholar] [CrossRef]
- Dominguez, P.G.; Frankel, N.; Mazuch, J.; Balbo, I.; Iusem, N.; Fernie, A.R.; Carrari, F. ASR1 Mediates Glucose-Hormone Cross Talk by Affecting Sugar Trafficking in Tobacco Plants. Plant Physiol. 2013, 161, 1486–1500. [Google Scholar] [CrossRef]
- Büttner, M.; Sauer, N. Monosaccharide transporters in plants: Structure, function and physiology. Biochim. Biophys. Acta Biomembr. 2000, 1465, 263–274. [Google Scholar] [CrossRef]
- Oliveira, J.; Tavares, R.M.; Gerós, H. Utilization and transport of glucose in Olea Europaea cell suspensions. Plant Cell Physiol. 2002, 43, 1510–1517. [Google Scholar] [CrossRef]
- Maurel, K.; Sakr, S.; Gerbe, F.; Guilliot, A.; Bonhomme, M.; Rageau, R.; Pétel, G. Sorbitol uptake is regulated by glucose through the hexokinase pathway in vegetative peach-tree buds. J. Exp. Bot. 2004, 55, 879–888. [Google Scholar] [CrossRef]
- Price, J.; Laxmi, A.; Martin, S.K.S.; Jang, J.-C. Global Transcription Profiling Reveals Multiple Sugar Signal Transduction Mechanisms in Arabidopsis. Plant Cell 2004, 16, 2128–2150. [Google Scholar] [CrossRef]
- Villadsen, D.; Smith, S. Identification of more than 200 glucose-responsive Arabidopsis genes none of which responds to 3-O-methylglucose or 6-deoxyglucose. Plant Mol. Biol. 2004, 55, 467–477. [Google Scholar] [CrossRef] [PubMed]
- Weber, H.; Borisjuk, L.; Heim, U.; Sauer, N.; Wobus, U. A role for sugar transporters during seed development: Molecular characterization of a hexose and a sucrose carrier in fava bean seeds. Plant Cell 1997, 9, 895–908. [Google Scholar] [CrossRef] [PubMed]
- Chiou, T.-J.; Bush, D.R. Sucrose is a signal molecule in assimilate partitioning. Proc. Natl. Acad. Sci. USA 1998, 95, 4784–4788. [Google Scholar] [CrossRef] [PubMed]
- Aoki, N.; Hirose, T.; Takahashi, S.; Ono, K.; Ishimaru, K.; Ohsugi, R. Molecular Cloning and Expression Analysis of a Gene for a Sucrose Transporter in Maize (Zea mays L.). Plant Cell Physiol. 1999, 40, 1072–1078. [Google Scholar] [CrossRef] [PubMed][Green Version]
- Matsukura, C.-A.; Saitoh, T.; Hirose, T.; Ohsugi, R.; Perata, P.; Yamaguchi, J. Sugar Uptake and Transport in Rice Embryo. Expression of Companion Cell-Specific Sucrose Transporter (OsSUT1) Induced by Sugar and Light. Plant Physiol. 2000, 124, 85–94. [Google Scholar] [CrossRef] [PubMed]
- Vaughn, M.W.; Harrington, G.N.; Bush, D.R. Sucrose-mediated transcriptional regulation of sucrose symporter activity in the phloem. Proc. Natl. Acad. Sci. USA 2002, 99, 10876–10880. [Google Scholar] [CrossRef]
- Ransom-Hodgkins, W.D.; Vaughn, M.W.; Bush, D.R. Protein phosphorylation plays a key role in sucrose-mediated transcriptional regulation of a phloem-specific proton-sucrose symporter. Planta 2003, 217, 483–489. [Google Scholar] [CrossRef]
- Conde, C.; Agasse, A.; Glissant, D.; Tavares, R.; Gerós, H.; Delrot, S. Pathways of Glucose Regulation of Monosaccharide Transport in Grape Cells. Plant Physiol. 2006, 141, 1563–1577. [Google Scholar] [CrossRef]
- Cordoba, E.; Aceves-Zamudio, D.L.; Hernández-Bernal, A.F.; Ramos-Vega, M.; León, P. Sugar regulation of SUGAR TRANSPORTER PROTEIN 1 (STP1) expression in Arabidopsis thaliana. J. Exp. Bot. 2014, 66, 147–159. [Google Scholar] [CrossRef]
- Parrilla, J.; Gaillard, C.; Verbeke, J.; Maucourt, M.; Aleksandrov, R.A.; Thibault, F.; Fleurat-Lessard, P.; Gibon, Y.; Rolin, D.; Atanassova, R. Comparative metabolomics and glycolysis enzyme profiling of embryogenic and nonembryogenic grape cells. FEBS Open Bio 2018, 8, 784–798. [Google Scholar] [CrossRef]
- Finkelstein, R.R.; Wang, M.L.; Lynch, T.J.; Rao, S.; Goodman, H.M. The Arabidopsis Abscisic Acid Response Locus ABI4 Encodes an APETALA2 Domain Protein. Plant Cell 1998, 10, 1043–1054. [Google Scholar] [CrossRef] [PubMed]
- Brocard-Gifford, I.; Lynch, T.J.; Garcia, M.E.; Malhotra, B.; Finkelstein, R.R. The Arabidopsis thaliana ABSCISIC ACID-INSENSITIVE8 Locus Encodes a Novel Protein Mediating Abscisic Acid and Sugar Responses Essential for Growth. Plant Cell 2004, 16, 406–421. [Google Scholar] [CrossRef] [PubMed]
- Afoufa-Bastien, D.; Medici, A.; Jeauffre, J.; Coutos-Thévenot, P.; Lemoine, R.; Atanassova, R.; Laloi, M. The Vitis vinifera sugar transporter gene family: Phylogenetic overview and macroarray expression profiling. BMC Plant Biol. 2010, 10, 245. [Google Scholar] [CrossRef] [PubMed]
- Aguilera-Alvarado, G.P.; Sánchez-Nieto, S. Plant Hexokinases are Multifaceted Proteins. Plant Cell Physiol. 2017, 58, 1151–1160. [Google Scholar] [CrossRef] [PubMed]
- Fàbregas, N.; Fernie, A.R. The interface of central metabolism with hormone signaling in plants. Curr. Biol. 2021, 31, R1535–R1548. [Google Scholar] [CrossRef]
- Jang, J.C.; Sheen, J. Sugar sensing in higher plants. Plant Cell 1994, 6, 1665–1679. [Google Scholar] [CrossRef]
- Jang, J.C.; León, P.; Zhou, L.; Sheen, J. Hexokinase as a sugar sensor in higher plants. Plant Cell 1997, 9, 5–19. [Google Scholar] [CrossRef]
- Cho, Y.-H.; Yoo, S.-D.; Sheen, J. Regulatory Functions of Nuclear Hexokinase1 Complex in Glucose Signaling. Cell 2006, 127, 579–589. [Google Scholar] [CrossRef]
- Granot, D.; Kelly, G.; Stein, O.; David-Schwartz, R. Substantial roles of hexokinase and fructokinase in the effects of sugars on plant physiology and development. J. Exp. Bot. 2013, 65, 809–819. [Google Scholar] [CrossRef]
- Li, L.; Sheen, J. Dynamic and diverse sugar signaling. Curr. Opin. Plant Biol. 2016, 33, 116–125. [Google Scholar] [CrossRef]
- Klein, D.; Stitt, M. Effects of 2-deoxyglucose on the expression of rbc S and the metabolism of Chenopodium rubrum cell-suspension cultures. Planta 1998, 205, 223–234. [Google Scholar] [CrossRef]
- Vitrac, X.; Larronde, F.; Krisa, S.; Decendit, A.; Deffieux, G.; Mérillon, J.-M. Sugar sensing and Ca2+–calmodulin requirement in Vitis vinifera cells producing anthocyanins. Phytochemistry 2000, 53, 659–665. [Google Scholar] [CrossRef]
- Cortès, S.; Gromova, M.; Evrard, A.; Roby, C.; Heyraud, A.; Rolin, D.B.; Raymond, P.; Brouquisse, R.M. In Plants, 3-O-Methylglucose Is Phosphorylated by Hexokinase But Not Perceived as a Sugar. Plant Physiol. 2003, 131, 824–837. [Google Scholar] [CrossRef]
- Wick, A.N.; Drury, D.R.; Nakada, H.I.; Wolfe, J.B. Localization of the primary metabolic block produced by 2-deoxyglucose. J. Biol. Chem. 1957, 224, 963–969. [Google Scholar] [CrossRef]
- Sarowar, S.; Lee, J.Y.; Ahn, E.R.; Pai, H.S. A role of hexokinases in plant resistance to oxidative stress and pathogen infection. J. Plant Biol. 2008, 51, 341–346. [Google Scholar] [CrossRef]
- Kano, A.; Fukumoto, T.; Ohtani, K.; Yoshihara, A.; Ohara, T.; Tajima, S.; Izumori, K.; Tanaka, K.; Ohkouchi, T.; Ishida, Y.; et al. The rare sugar d-allose acts as a triggering molecule of rice defence via ROS generation. J. Exp. Bot. 2013, 64, 4939–4951. [Google Scholar] [CrossRef] [PubMed]
- Fotopoulos, V.; Gilbert, M.J.; Pittman, J.K.; Marvier, A.C.; Buchanan, A.J.; Sauer, N.; Hall, J.; Williams, L.E. The Monosaccharide Transporter Gene, AtSTP4, and the Cell-Wall Invertase, Atβfruct1, Are Induced in Arabidopsis during Infection with the Fungal Biotroph Erysiphe cichoracearum. Plant Physiol. 2003, 132, 821–829. [Google Scholar] [CrossRef]
- Hayes, M.A.; Feechan, A.; Dry, I.B. Involvement of Abscisic Acid in the Coordinated Regulation of a Stress-Inducible Hexose Transporter (VvHT5) and a Cell Wall Invertase in Grapevine in Response to Biotrophic Fungal Infection. Plant Physiol. 2010, 153, 211–221. [Google Scholar] [CrossRef]
- Lemonnier, P.; Gaillard, C.; Veillet, F.; Verbeke, J.; Lemoine, R.; Coutos-Thévenot, P.; La Camera, S. Expression of Arabidopsis sugar transport protein STP13 differentially affects glucose transport activity and basal resistance to Botrytis cinerea. Plant Mol. Biol. 2014, 85, 473–484. [Google Scholar] [CrossRef]
- Veillet, F.; Gaillard, C.; Lemonnier, P.; Coutos-Thévenot, P.; La Camera, S. The molecular dialogue between Arabidopsis thaliana and the necrotrophic fungus Botrytis cinerea leads to major changes in host carbon metabolism. Sci. Rep. 2017, 7, 17121. [Google Scholar] [CrossRef]
- Vignault, C.; Vachaud, M.; Cakir, B.; Glissant, D.; Dédaldéchamp, F.; Büttner, M.; Atanassova, R.; Fleurat-Lessard, P.; Lemoine, R.; Delrot, S. VvHT1 encodes a monosaccharide transporter expressed in the conducting complex of the grape berry phloem. J. Exp. Bot. 2005, 56, 1409–1418. [Google Scholar] [CrossRef]
- Verstappen, R.; Ranostaj, S.; Rausch, T. The hexose transporters at the plasma membrane and the tonoplast of transformed plant cells: Kinetic characterization of two distinct carriers. Biochim. Biophys. Acta Gen. Subj. 1991, 1073, 366–373. [Google Scholar] [CrossRef]
- Krook, J.; Vreugdenhil, D.; van der Plas, L.H. Uptake and phosphorylation of glucose and fructose in Daucus carota cell suspensions are differently regulated. Plant Physiol. Biochem. 2000, 38, 603–612. [Google Scholar] [CrossRef]
- Ritte, G.; Rosenfeld, J.; Rohrig, K.; Raschke, K. Rates of Sugar Uptake by Guard Cell Protoplasts of Pisum sativum L. Related to the Solute Requirement for Stomatal Opening. Plant Physiol. 1999, 121, 647–655. [Google Scholar] [CrossRef] [PubMed]
- Busturia, A.; Lagunas, R. Identification of two forms of the maltose transport system in Saccharomyces cerevisiae and their regulation by catabolite inactivation. Biochim. Biophys. Acta Biomembr. 1985, 820, 324–326. [Google Scholar] [CrossRef]
- Busturia, A.; Lagunas, R. Catabolite Inactivation of the Glucose Transport System in Saccharomyces cerevisiae. Microbiology 1986, 132, 379–385. [Google Scholar] [CrossRef]
- Horak, J.; Wolf, D.H. Catabolite inactivation of the galactose transporter in the yeast Saccharomyces cerevisiae: Ubiquitination, endocytosis, and degradation in the vacuole. J. Bacteriol. 1997, 179, 1541–1549. [Google Scholar] [CrossRef]
- Zhou, L.; Jang, J.-C.; Jones, T.L.; Sheen, J. Glucose and ethylene signal transduction crosstalk revealed by an Arabidopsis glucose-insensitive mutant. Proc. Natl. Acad. Sci. USA 1998, 95, 10294–10299. [Google Scholar] [CrossRef]
- Arenas-Huertero, F.; Arroyo, A.; Zhou, L.; Sheen, J.; León, P. Analysis of Arabidopsis glucose insensitive mutants, gin5 and gin6, reveals a central role of the plant hormone ABA in the regulation of plant vegetative development by sugar. Genes Dev. 2000, 14, 2085–2096. [Google Scholar] [CrossRef]
- Cheng, W.-H.; Endo, A.; Zhou, L.; Penney, J.; Chen, H.-C.; Arroyo, A.; Leon, P.; Nambara, E.; Asami, T.; Seo, M.; et al. A Unique Short-Chain Dehydrogenase/Reductase in Arabidopsis Glucose Signaling and Abscisic Acid Biosynthesis and Functions. Plant Cell 2002, 14, 2723–2743. [Google Scholar] [CrossRef]
- Arroyo, A.; Bossi, F.; Finkelstein, R.R.; León, P. Three Genes That Affect Sugar Sensing (Abscisic Acid Insensitive 4, Abscisic Acid Insensitive 5, and Constitutive Triple Response 1) Are Differentially Regulated by Glucose in Arabidopsis. Plant Physiol. 2003, 133, 231–242. [Google Scholar] [CrossRef] [PubMed]
- León, P. Sugar and hormone connections. Trends Plant Sci. 2003, 8, 110–116. [Google Scholar] [CrossRef]
- Rook, F.; Bevan, M.W. Genetic approaches to understanding sugar-response pathways. J. Exp. Bot. 2003, 54, 495–501. [Google Scholar] [CrossRef] [PubMed]
- Lin, P.-C.; Hwang, S.-G.; Endo, A.; Okamoto, M.; Koshiba, T.; Cheng, W.-H. Ectopic Expression of ABSCISIC ACID 2/GLUCOSE INSENSITIVE 1 in Arabidopsis Promotes Seed Dormancy and Stress Tolerance. Plant Physiol. 2007, 143, 745–758. [Google Scholar] [CrossRef] [PubMed]
- Finkelstein, R.R.; Gampala, S.S.L.; Rock, C.D. Abscisic Acid Signaling in Seeds and Seedlings. Plant Cell 2002, 14, S15–S45. [Google Scholar] [CrossRef] [PubMed]
- Finkelstein, R.R.; Gibson, I.S. ABA and sugar interactions regulating development: Cross-talk or voices in a crowd? Curr. Opin. Plant Biol. 2002, 5, 26–32. [Google Scholar] [CrossRef]
- Söderman, E.M.; Brocard, I.M.; Lynch, T.J.; Finkelstein, R.R. Regulation and Function of the Arabidopsis ABA-insensitive4 Gene in Seed and Abscisic Acid Response Signaling Networks. Plant Physiol. 2000, 124, 1752–1765. [Google Scholar] [CrossRef]
- Shkolnik, D.; Bar-Zvi, D. Tomato ASR1 abrogates the response to abscisic acid and glucose in Arabidopsis by competing with ABI4 for DNA binding. Plant Biotechnol. J. 2008, 6, 368–378. [Google Scholar] [CrossRef]
- Finkelstein, R.R. Mutations at two new Arabidopsis ABA response loci are similar to the abi3 mutations. Plant J. 1994, 5, 765–771. [Google Scholar] [CrossRef]
- Yang, C.-Y.; Chen, Y.-C.; Jauh, G.-Y.; Wang, C.-S. A Lily ASR Protein Involves Abscisic Acid Signaling and Confers Drought and Salt Resistance in Arabidopsis. Plant Physiol. 2005, 139, 836–846. [Google Scholar] [CrossRef]
- Coutos-Thévenot, P.; Poinssot, B.; Bonomelli, A.; Yean, H.; Breda, C.; Buffard, D.; Esnault, R.; Hain, R.; Boulay, M. In vitro tolerance to Botrytis cinerea of grapevine 41B rootstock in transgenic plants expressing the stilbene synthase Vst1 gene under the control of a pathogen-inducible PR 10 promoter. J. Exp. Bot. 2001, 52, 901–910. [Google Scholar] [CrossRef] [PubMed]
- Clough, S.J.; Bent, A.F. Floral dip: A simplified method for Agrobacterium-mediated transformation of Arabidopsis thaliana. Plant J. 1998, 16, 735–743. [Google Scholar] [CrossRef] [PubMed]
- Moing, A.; Maucourt, M.; Renaud, C.; Gaudillère, M.; Brouquisse, R.; Lebouteiller, B.; Gousset-Dupont, A.; Vidal, J.; Granot, D.; Denoyes-Rothan, B.; et al. Quantitative metabolic profiling by 1-dimensional 1H-NMR analyses: Application to plant genetics and functional genomics. Funct. Plant Biol. 2004, 31, 889–902. [Google Scholar] [CrossRef] [PubMed]
- Mounet, F.; Lemaire-Chamley, M.; Maucourt, M.; Cabasson, C.; Giraudel, J.-L.; Deborde, C.; Lessire, R.; Gallusci, P.; Bertrand, A.; Gaudillère, M.; et al. Quantitative metabolic profiles of tomato flesh and seeds during fruit development: Complementary analysis with ANN and PCA. Metabolomics 2007, 3, 273–288. [Google Scholar] [CrossRef]
- Deborde, C.; Maucourt, M.; Baldet, P.; Bernillon, S.; Biais, B.; Talon, G.; Ferrand, C.; Jacob, D.; Ferry-Dumazet, H.; De Daruvar, A.; et al. Proton NMR quantitative profiling for quality assessment of greenhouse-grown tomato fruit. Metabolomics 2009, 5, 183–198. [Google Scholar] [CrossRef]
- Allwood, J.W.; De Vos, R.C.; Moing, A.; Deborde, C.; Erban, A.; Kopka, J.; Goodacre, R.; Hall, R.D. Plant Metabolomics and Its Potential for Systems Biology Research. Meth. Enzymol. 2011, 500, 299–336. [Google Scholar] [CrossRef]
- Hendriks, J.H.; Kolbe, A.; Gibon, Y.; Stitt, M.; Geigenberger, P. ADP-Glucose Pyrophosphorylase Is Activated by Posttranslational Redox-Modification in Response to Light and to Sugars in Leaves of Arabidopsis and Other Plant Species. Plant Physiol. 2003, 133, 838–849. [Google Scholar] [CrossRef]
- Nunes-Nesi, A.; Carrari, F.; Gibon, Y.; Sulpice, R.; Lytovchenko, A.; Fisahn, J.; Graham, J.; Ratcliffe, R.G.; Sweetlove, L.J.; Fernie, A.R. Deficiency of mitochondrial fumarase activity in tomato plants impairs photosynthesis via an effect on stomatal function. Plant J. 2007, 50, 1093–1106. [Google Scholar] [CrossRef]
- Gibon, Y.; Blaesing, O.E.; Hannemann, J.; Carillo, P.; Höhne, M.; Hendriks, J.H.; Palacios, N.; Cross, J.; Selbig, J.; Stitt, M. A Robot-Based Platform to Measure Multiple Enzyme Activities in Arabidopsis Using a Set of Cycling Assays: Comparison of Changes of Enzyme Activities and Transcript Levels during Diurnal Cycles and in Prolonged Darkness. Plant Cell 2004, 16, 3304–3325. [Google Scholar] [CrossRef]
- Cross, J.M.; von Korff, M.; Altmann, T.; Bartzetko, L.; Sulpice, R.; Gibon, Y.; Palacios, N.; Stitt, M. Variation of Enzyme Activities and Metabolite Levels in 24 Arabidopsis Accessions Growing in Carbon-Limited Conditions. Plant Physiol. 2006, 142, 1574–1588. [Google Scholar] [CrossRef]
- Biais, B.; Bénard, C.; Beauvoit, B.; Colombié, S.; Prodhomme, D.; Ménard, G.; Bernillon, S.; Gehl, B.; Gautier, H.; Ballias, P.; et al. Remarkable Reproducibility of Enzyme Activity Profiles in Tomato Fruits Grown under Contrasting Environments Provides a Roadmap for Studies of Fruit Metabolism. Plant Physiol. 2014, 164, 1204–1221. [Google Scholar] [CrossRef] [PubMed]
- Manjunath, S.; Lee, C.-H.K.; Van Winkle, P.; Bailey-Serres, J. Molecular and Biochemical Characterization of Cytosolic Phosphoglucomutase in Maize. Plant Physiol. 1998, 117, 997–1006. [Google Scholar] [CrossRef] [PubMed]
- Huege, J.; Sulpice, R.; Gibon, Y.; Lisec, J.; Koehl, K.; Kopka, J. GC-EI-TOF-MS analysis of in vivo carbon-partitioning into soluble metabolite pools of higher plants by monitoring isotope dilution after 13CO2 labelling. Phytochemistry 2007, 68, 2258–2272. [Google Scholar] [CrossRef] [PubMed]
- Piques, M.; Schulze, W.X.; Höhne, M.; Usadel, B.; Gibon, Y.; Rohwer, J.; Stitt, M. Ribosome and transcript copy numbers, polysome occupancy and enzyme dynamics in Arabidopsis. Mol. Syst. Biol. 2009, 5, 314. [Google Scholar] [CrossRef]
- Bearden, J.C. Quantitation of submicrogram quantities of protein by an improved protein-dye binding assay. Biochim. Biophys. Acta Protein Struct. 1978, 533, 525–529. [Google Scholar] [CrossRef]
Publisher’s Note: MDPI stays neutral with regard to jurisdictional claims in published maps and institutional affiliations. |
© 2022 by the authors. Licensee MDPI, Basel, Switzerland. This article is an open access article distributed under the terms and conditions of the Creative Commons Attribution (CC BY) license (https://creativecommons.org/licenses/by/4.0/).