Article

Expression of Cellular and Extracellular TERRA, TERC and TERT in Hepatocellular Carcinoma

by
Michele Manganelli
1,†,
Ilaria Grossi
1,†,
Jessica Corsi
2,
Vito Giuseppe D’Agostino
2,
Katarina Jurikova
2,
Emilio Cusanelli
2,
Sarah Molfino
3,
Nazario Portolani
3,
Alessandro Salvi
1,* and
Giuseppina De Petro
1,*
1
Department of Molecular and Translational Medicine, Division of Biology and Genetics, University of Brescia, 25123 Brescia, Italy
2
Department of Cellular, Computational and Integrative Biology, CIBIO, University of Trento, 38123 Trento, Italy
3
Department of Clinical and Experimental Sciences, Surgical Clinic, University of Brescia, 25123 Brescia, Italy
*
Authors to whom correspondence should be addressed.
These authors contributed equally to this work.
Int. J. Mol. Sci. 2022, 23(11), 6183; https://doi.org/10.3390/ijms23116183
Submission received: 27 April 2022 / Revised: 26 May 2022 / Accepted: 29 May 2022 / Published: 31 May 2022

Abstract

:
Non-coding RNAs are transcribed from telomeres and the telomeric repeat-containing RNAs (TERRA) are implicated in telomere homeostasis and in cancer. In this study, we aimed to assess in hepatocellular carcinoma (HCC) the cellular and extracellular expression of TERRA, the telomerase RNA subunit (TERC) and the telomerase catalytic subunit (TERT). We determined by qPCR the expression level of TERRA 1_2_10_13q, TERRA 15q, TERRA XpYp, TERC and of TERT mRNA in HCC tissues and in the plasma of HCC patients. Further, we profiled the same transcripts in the HCC cell lines, HA22T/VGH and SKHep1C3, and in the extracellular vesicles (EVs) derived from their secretomes. We found that the expression of TERRA and TERT mRNA was significantly deregulated in HCC, being TERRA downregulated and TERT mRNA upregulated in HCC tissues vs. the peritumoral (PT) ones, and the receiver operating characteristic (ROC) curve analyses revealed a significant ability in discriminating HCC from PT tissue. Further, the determinations of circulating TERRA and TERC showed higher amounts of these transcripts in the plasma of HCC patients vs. controls and ROC analyses gave significant results. The expression characterization of the cultured HCC cells showed their ability to produce and secrete TERRA and TERC into the EVs; the ability to produce TERT mRNA that was not detectable in the EVs; and the ability to respond to sorafenib treatment increasing TERRA expression. Our results highlight that: (i) both cellular and extracellular expressions of TERRA and TERC are dysregulated in HCC as well as the cellular expression of TERT mRNA and (ii) the combined detection of TERRA and TERC in plasma may represent a promising approach for non-invasive diagnostic molecular indicators of HCC.

1. Introduction

The transcriptional activity of the human genome (>90% of the genome) produces long non-coding RNAs (lncRNAs) whose functions are mostly unknown. The extremities of linear chromosomes, or telomeres, actively synthesize a heterogeneous population of lncRNAs named TERRA (telomeric repeat-containing RNA) with various sizes (from 100 bases to 10 Kb) and containing the canonical telomeric repeat sequence UUAGGG, as well as sequences unique to the subtelomeric region of each chromosome [1,2]. TERRA transcripts localize at telomeres and interact with the telomerase RNA subunit (TERC) and with the telomerase catalytic subunit (TERT) [3,4]. Several studies have established the role of TERRA in telomere homeostasis and its implication in cancer. In this regard, TERRA has been shown to sustain the activation of DNA damage response pathways at dysfunctional telomeres [5,6] and to facilitate completion of telomere DNA replication in cancer cells [7]. Importantly, TERRA depletion associates with an increase of telomerase activity, supporting the notion that TERRA can negatively regulate telomerase in mammalian cells [2,3,4]. Expression studies conducted by various technologies have revealed the dysregulation of TERRA in various solid tumors, a frequent downregulation in specific tumor types vs. their normal tissue counterparts [8], but also its overexpression in medulloblastoma [9]. Moreover TERRA expression is increased upon the treatment of human cancer cell lines with chemotherapeutic agents, suggesting that TERRA transcripts may participate in the cellular response and/or resistance to chemotherapy [10,11,12]. For hepatocellular carcinoma (HCC), it is known that telomerase activation is a hallmark of this malignant condition [13] and that TERRA may participate in telomerase regulation in this cancer type [8]. HCC is the most common type of primary liver cancer and worldwide is the fifth cancer and the third cause of cancer mortality; it is a highly heterogeneous disease and it occurs most often in people with chronic liver diseases (liver hepatitis, alcohol hepatitis, viral B or C hepatitis, steatohepatitis, cirrhosis). Also for this reason, the HCC clinical management remains difficult: very often the diagnosis reveals an advanced HCC that usually is not submitted to surgical resection and a resectable HCC frequently leads to recurrent tumors [14,15,16,17]. To date, the treatment options are limited and advancing in the molecular characterization of HCC is a real challenge. Also, early diagnosis represents a critical step for the management of HCC and the identification of novel biomarkers of HCC will be of foremost importance.
The aim of the current study was to characterize TERRA expression in HCC, determining by qPCR its expression levels in HCC tissues and in HCC cell lines as well as its circulating amount in the plasma of HCC patients and in the cell secretomes. Further, we assessed in the same biological specimens the expression of TERC and of TERT mRNA in relation to TERRA. Our results highlight that both cellular and extracellular expressions of TERRA and TERC are dysregulated in HCC, as well as the cellular expression of TERT mRNA.

2. Results

2.1. Dysregulated Expression of TERRA, TERC and TERT mRNA in HCC Tissues

To characterize the expression of TERRA in HCC patients, we first examined TERRA levels in paired HCC and peritumoral tissues by RT qPCR. TERRA expression from different telomeres, analyzed using specific primer pairs (as described in the Materials and Methods, TERRA1 = 1_2_10_13q; TERRA2 = 15q; TERRA3 = XpYp), resulted to be significantly downregulated (Figure S1). TERRA expression was obtained as a mean of the different TERRA relative quantifications and, as shown in Figure 1a by the qPCR data, TERRA was significantly downregulated in HCC tissues compared with their matched peritumoral tissues (RQHCC average vs. RQPT average, p-value = 0.02).
The R values refer to the ratio RQHCC/RQPT and, among the HCC tested, 19/25 of cases (76%) showed downregulation of TERRA expression, whereas 6/25 cases (24%) showed its upregulation (Figure 1b). No correlation was observed between TERRA expression and the clinicopathological characteristics of HCC patients (Table S1). ROC curve analyses, generated for the different TERRA subpopulations considered, using the primer pairs mentioned above, revealed that each TERRA target had a significant capability in discriminating HCC from peritumoral tissues. Further logistic regression model of classifiers showed that the use of the combined TERRA molecules might represent a significant successful discriminating tool to distinguish HCC from peritumoral tissue (Figure 1c and Table 1) (AUC: 0.79; CI: 0.563–0.829; p-value = 0.0382).
Given the importance of telomerase in HCC, we also investigated the expression of TERC and TERT mRNA in the paired HCC and peritumoral tissues by qPCR. For TERC expression, the data obtained displayed a trend of upregulation in HCC tissues compared with the PT ones (Figure 2a, RQHCC average vs. RQPT average, p-value = ns) and receiver operating characteristic (ROC) curve analysis did not disclose a significant capability in distinguishing HCC from PT tissues (Figure 2c) (AUC:0.51; CI: 0.34–0.67; p-value = 0.89).
TERT mRNA expression (Figure 3a) was significantly upregulated (p-value = 0.019) at different orders of magnitude in HCC tissues compared to the PT ones (Figure 3b). ROC curve analysis of TERT mRNA expression revealed a successful significant ability in discriminating HCC from PT tissues (Figure 3c) (AUC: 0.716; CI: 0.57–0.86; p-value = 0.008). These findings suggest that quantification of TERRA and TERT mRNA may represent a discriminating tool to distinguish HCC from peritumoral tissue.

2.2. Determination of Circulating TERRA and TERC in the Plasma of HCC Patients

Since TERRA has been found in human blood plasma and in the culture medium of human cell lines [18,19], to characterize further TERRA expression in HCC, we measured its amount in the plasma of HCC patients and in healthy individuals; due to the lack of a known reference gene that would allow the normalization of circulating TERRA, we report qPCR data as the average raw cycle thresholds (Ct) in plasma samples [20,21]. As shown in Figure 4 and Table 2, circulating TERRA1 and TERRA3 amounts, corresponding to TERRA transcripts expressed from telomeres 1_2_10_13q (TERRA1) and telomeres XpYp (TERRA3), were significantly higher in the plasma of HCC patients compared to healthy subjects (Figure 4a,c, p-values = 0.0023 and 0.031, respectively) and TERRA2 amounts (corresponding to the 15q transcripts) revealed a trend of upregulation (Figure 4b, p-value = ns).
No correlation was observed between circulating levels of TERRA and the clinicopathological characteristics of HCC patients (Table S2). ROC curve analyses were generated for different TERRA subpopulations to inquire as to their capability to act as tools to successfully distinguish HCC from healthy subjects. In particular, the logistic regression model of TERRA classifiers evidenced the significant combined use of TERRA targets (Figure 4d and Table 2) (AUC: 0.765; CI: 0.624–0.873; p-value = 0.0004). To support these findings, we calculated the average Ct values of TERRA in the 2 groups of individuals and we obtained significantly higher levels in plasma from HCC patients in comparison to healthy control subjects (Figure S2, p-value = 0.038). Further, we evaluated the correlation by Spearman’s analysis of TERRA levels between the HCC tissues and the plasma samples from the same patients. The R-value was 0.3096 and the p-value was not significant (p value = 0.1410). Thus, in our cohort there was no correlation between TERRA levels in HCC solid biopsies and liquid biopsies (Figure S3). Further, as shown in Figure 5, the ddPCR determination of TERC in plasma revealed a significantly higher level in HCC patients vs. control subjects (2.118 vs. 0.826 copies/μL, p-value = 0.0019); and the ROC analysis gave an AUC value = 0.8120 with a p-value = 0.0002. On the contrary, TERT mRNA was not detectable in liquid biopsy specimens (data not shown). These findings suggest that the combined detection of circulating TERRA and TERC may represent a promising approach for the diagnosis of HCC.

2.3. Characterization of Cellular and Extracellular TERRA in HCC Cell Lines

Considering the evidence provided by the present study on the altered expression of TERRA, TERC and TERT mRNA in HCC tissues and on the detection of TERRA and TERC in the plasma of HCC patients, we aimed to explore the cellular and extracellular expression of these transcripts in human HCC cell lines in order to gain mechanistic insights on the function of TERRA in HCC. Since TERRA transcripts may participate in the cellular response to anticancer compounds [10,11,12], first we assessed the transcript expression in HA22T/VGH and SKHep1C3 cells (Figure 6) and monitored the possible expression variation following an anticancer drug treatment, in particular the sorafenib treatment in sensitive and resistant cells (sf and SR cells, respectively) [22,23]; this is because sorafenib is one of the drugs used by clinicians for the treatment of advanced HCC [14].
As shown in Figure 6a, the SK-Hep1 C3 cells express a very high amount of TERRA compared to HA22T/VGH cells (RQSKHep1C3 = 67.63 vs. RQHA22T/VGH = 1.03; fold increase, FI = 65.9) and a lower amount of TERC and TERT mRNA compared to HA22T/VGH cells (Figure 6b,c). These cell lines are both undifferentiated HCC cells and can be considered as models of the heterogeneity of HCC; in particular, the HA22T/VGH cells might represent a model of the HCC set with TERRA down-modulation and the SKHep1C3 may be a model of HCC with TERRA upregulation. Both cell lines responded similarly to sf treatment, enhancing TERRA expression and with the FI higher in the HA22T/VGH cells which are characterized by a low basal level (FITERRA = 7.70 and FITERRA = 1.91 in HA22T/VGH and SK-Hep1C3 cells, respectively). The expression variation does not seem to depend on the sensitivity or resistance of the cells to sf, since this effect of the drug appears similar in both conditions. Both cell lines also responded similarly to sf treatment enhancing TERC and TERT mRNA expression, for TERC with a low FI (FITERC = 1.3 and FITERC = 1.14 in HA22T/VGH and SKHep1C3 cells, respectively) and for TERT mRNA with a higher FI in HA22T/VGH cells (FITERT = 5.01 in HA22T/VGH cells and a FITERT = 1.3 in the SKHep1C3 cells). We then isolated extracellular vesicles (EV) from the secretome of both cell lines to determine the amounts of extracellular transcripts detectable in the EV fraction. For TERRA, the results shown in Figure 6d revealed that: (i) TERRA was detectable in the EVs of both HCC cell lines, the amount of TERRA ascertained in the EVs of HA22T/VGH cells being very high, and (ii) both cell lines displayed a lower amount of TERRA in the EVs of sf-treated cells, thus showing an opposite trend of expression variation compared to the intracellular one. The TERRA size detected in the EVs was in a size range of less than 500 nt as revealed by Northern analysis (Figure S4). For TERC, it was detectable (Figure 6e) in the EVs derived from HA22T/VGH cells and, in this case, sf treatment led to expression variations similar to the cellular one, that is, an increase of the TERC amount. TERC was not detectable in the EVs derived from SK-Hep1C3 cells even when ddPCR was employed to determine its amount and the EVs of both HCC cell lines did not display TERT mRNA molecules. In particular, these findings reveal that the HCC cells expressing low TERRA levels (HA22T/VGH) show a very high TERRA amount into the EVs. Nevertheless, in both cell lines the sf treatment leads to a cellular TERRA increase and at the same time causes a TERRA decrease in the EVs.

3. Discussion

The expression variations of the lncRNA TERRA in cancer has generated a growing interest on the biology of these telomeric transcripts in various solid tumors (larynx and colon cancer, medulloblastoma, glioblastoma, head and neck cancer, cervical and endometrial carcinoma) [2,9,24,25,26,27,28], but its real functional role in a given cancer type remains to be elucidated. In the present work, for the first time, we determined TERRA expression in HCC by qPCR, in HCC tissues and in the plasma of HCC patients. We used a qPCR assay that did not detect all TERRA transcripts, but it detected the most abundant ones. In particular, we used three primer pairs to quantify TERRA expression levels transcribed from seven telomeres (TERRA1: 1_2_10_13q; TERRA2: 15q; TERRA3: XpYp) [29]. Furthermore, Diman et al. [30] demonstrated that the primer pair named TERRA1 (1_2_10_13q) detected the transcripts expressed from the telomeres: 1_2_4_10_13_22q. Thus, according to Diman et al., our qPCR assay should recognize TERRA transcripts expressed from nine telomeres. Furthermore, Montero et al. [31] demonstrated that TERRA is mainly transcribed from the 20q subtelomere in human cells and the primer pairs able to detect this transcript were not included in our qPCR assay. Moreover, considering the role of TERRA in the telomere function and the importance of the telomerase enzyme in the biology of HCC, in the present study, we also assessed the RNA expression of the main components of the telomerase complex, the RNA subunit TERC and the telomerase catalytic subunit 
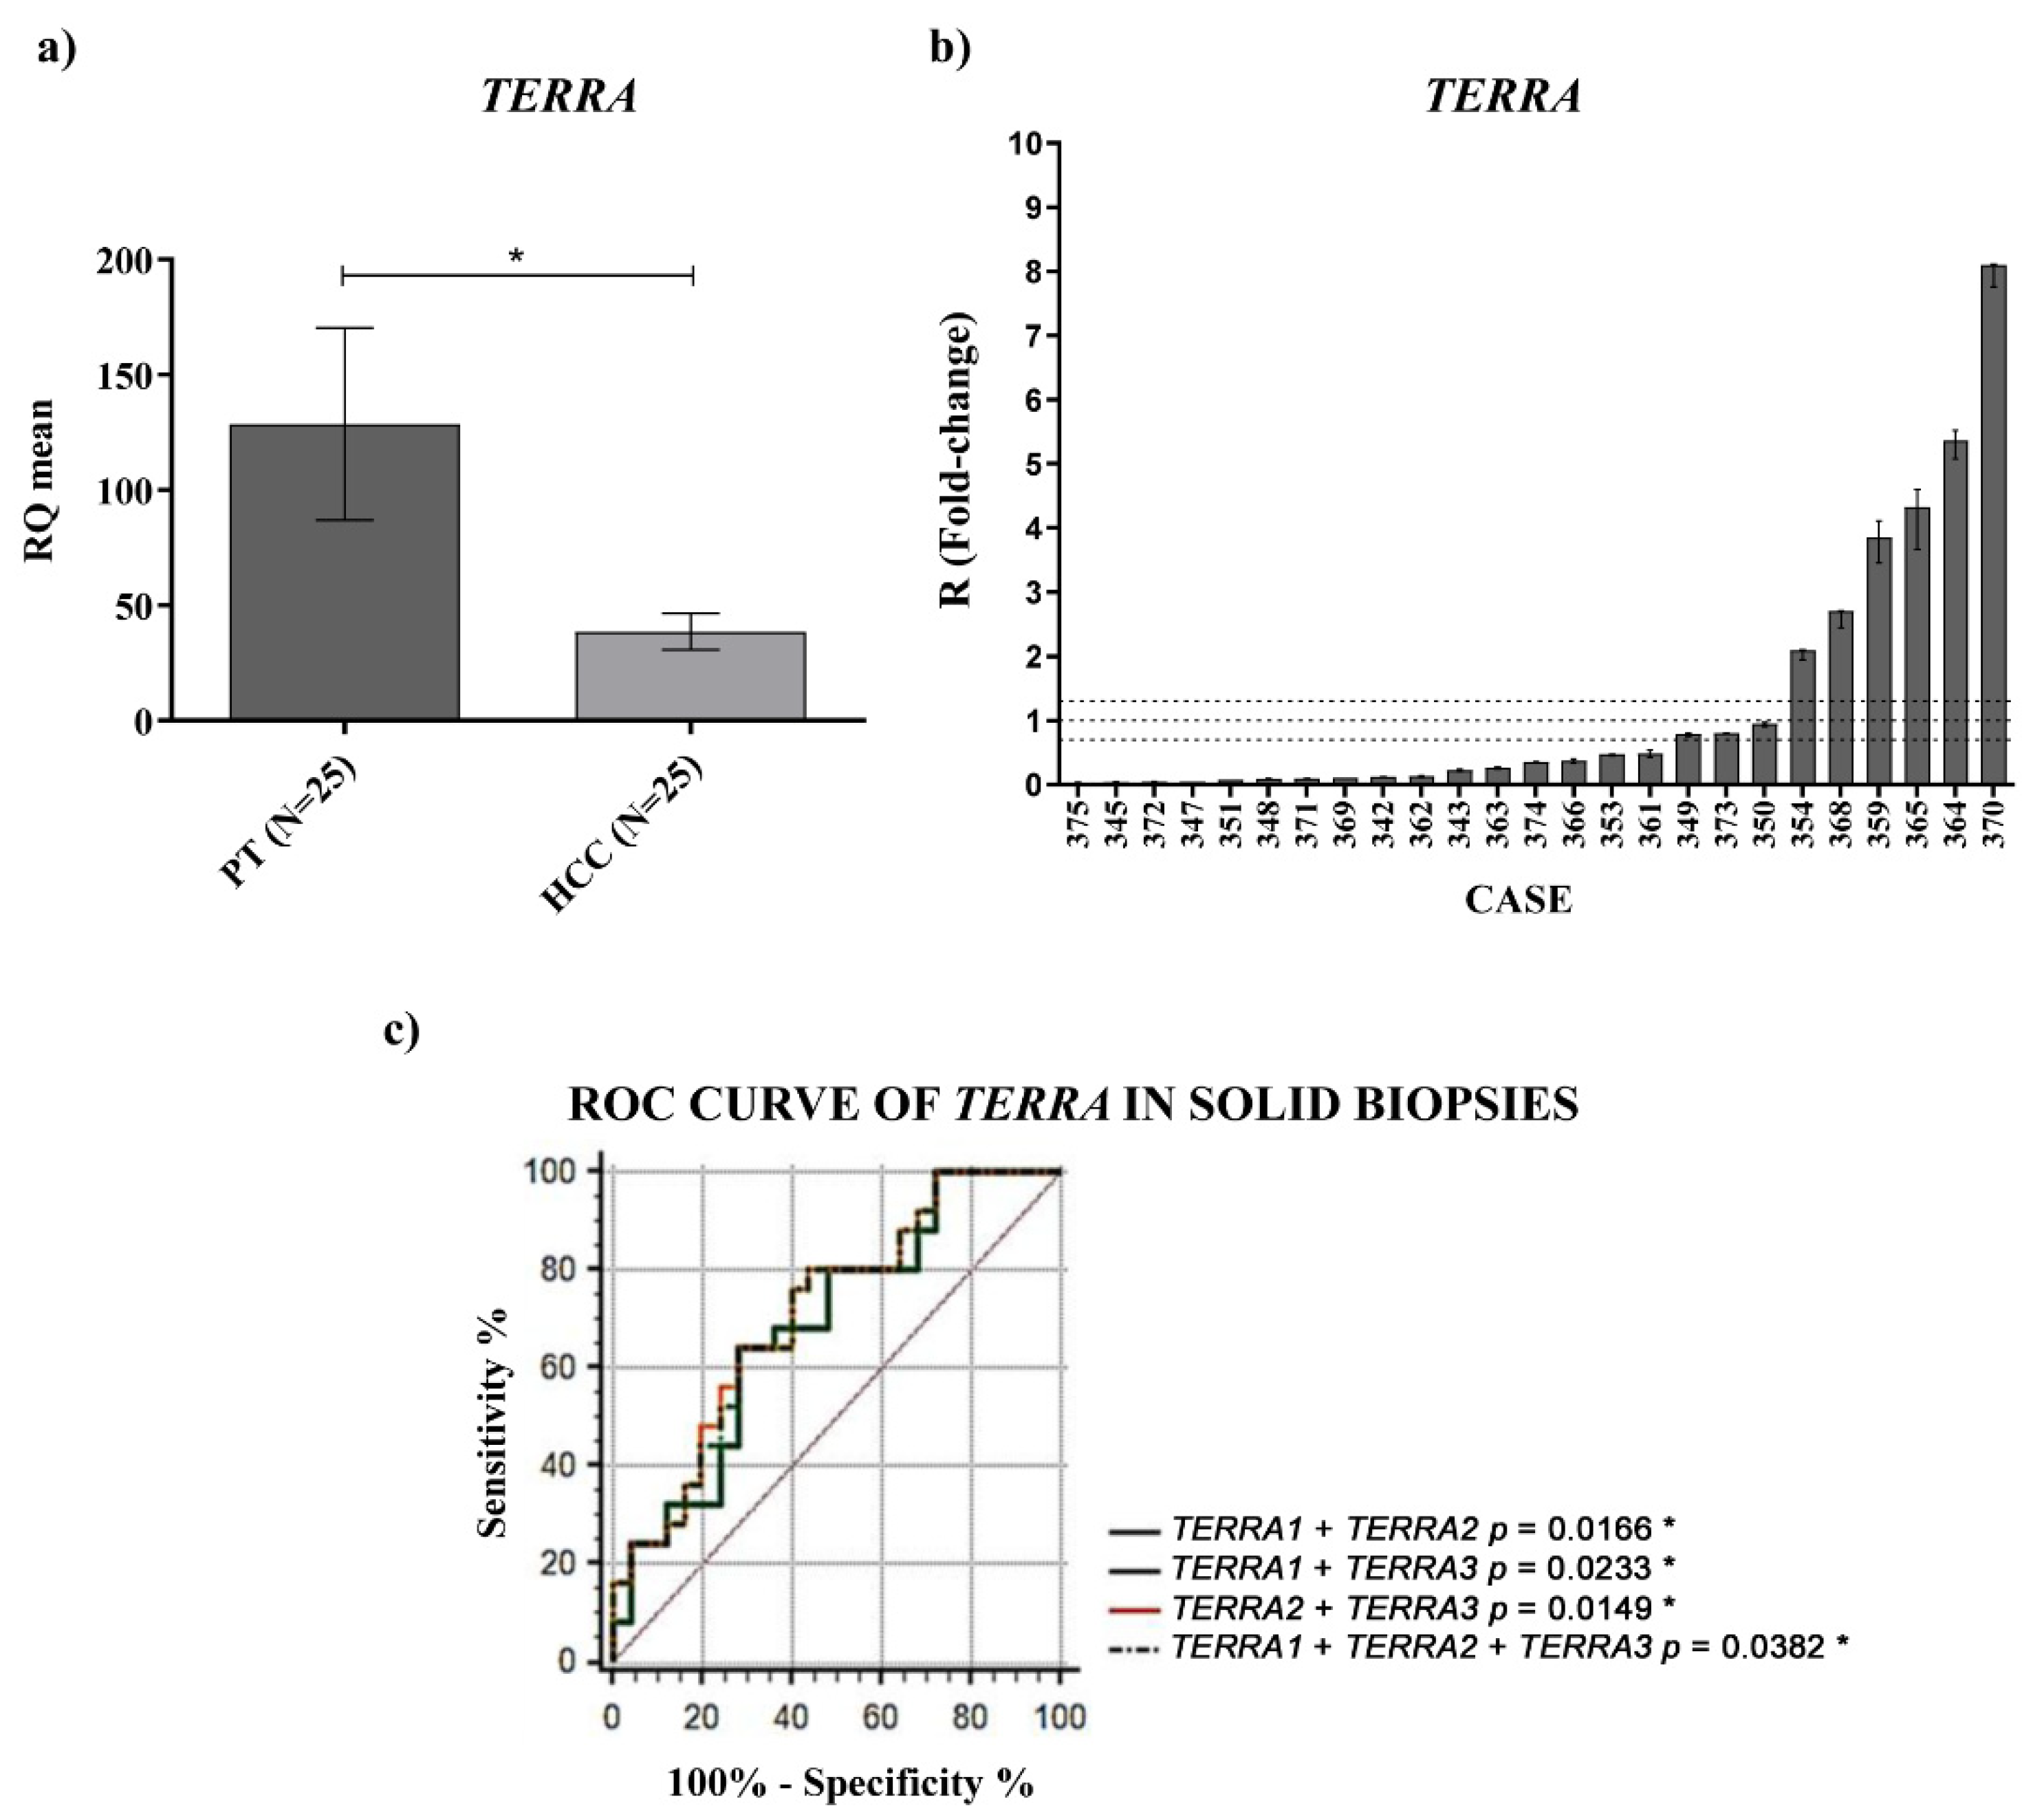
TERT mRNA. We found a significant 
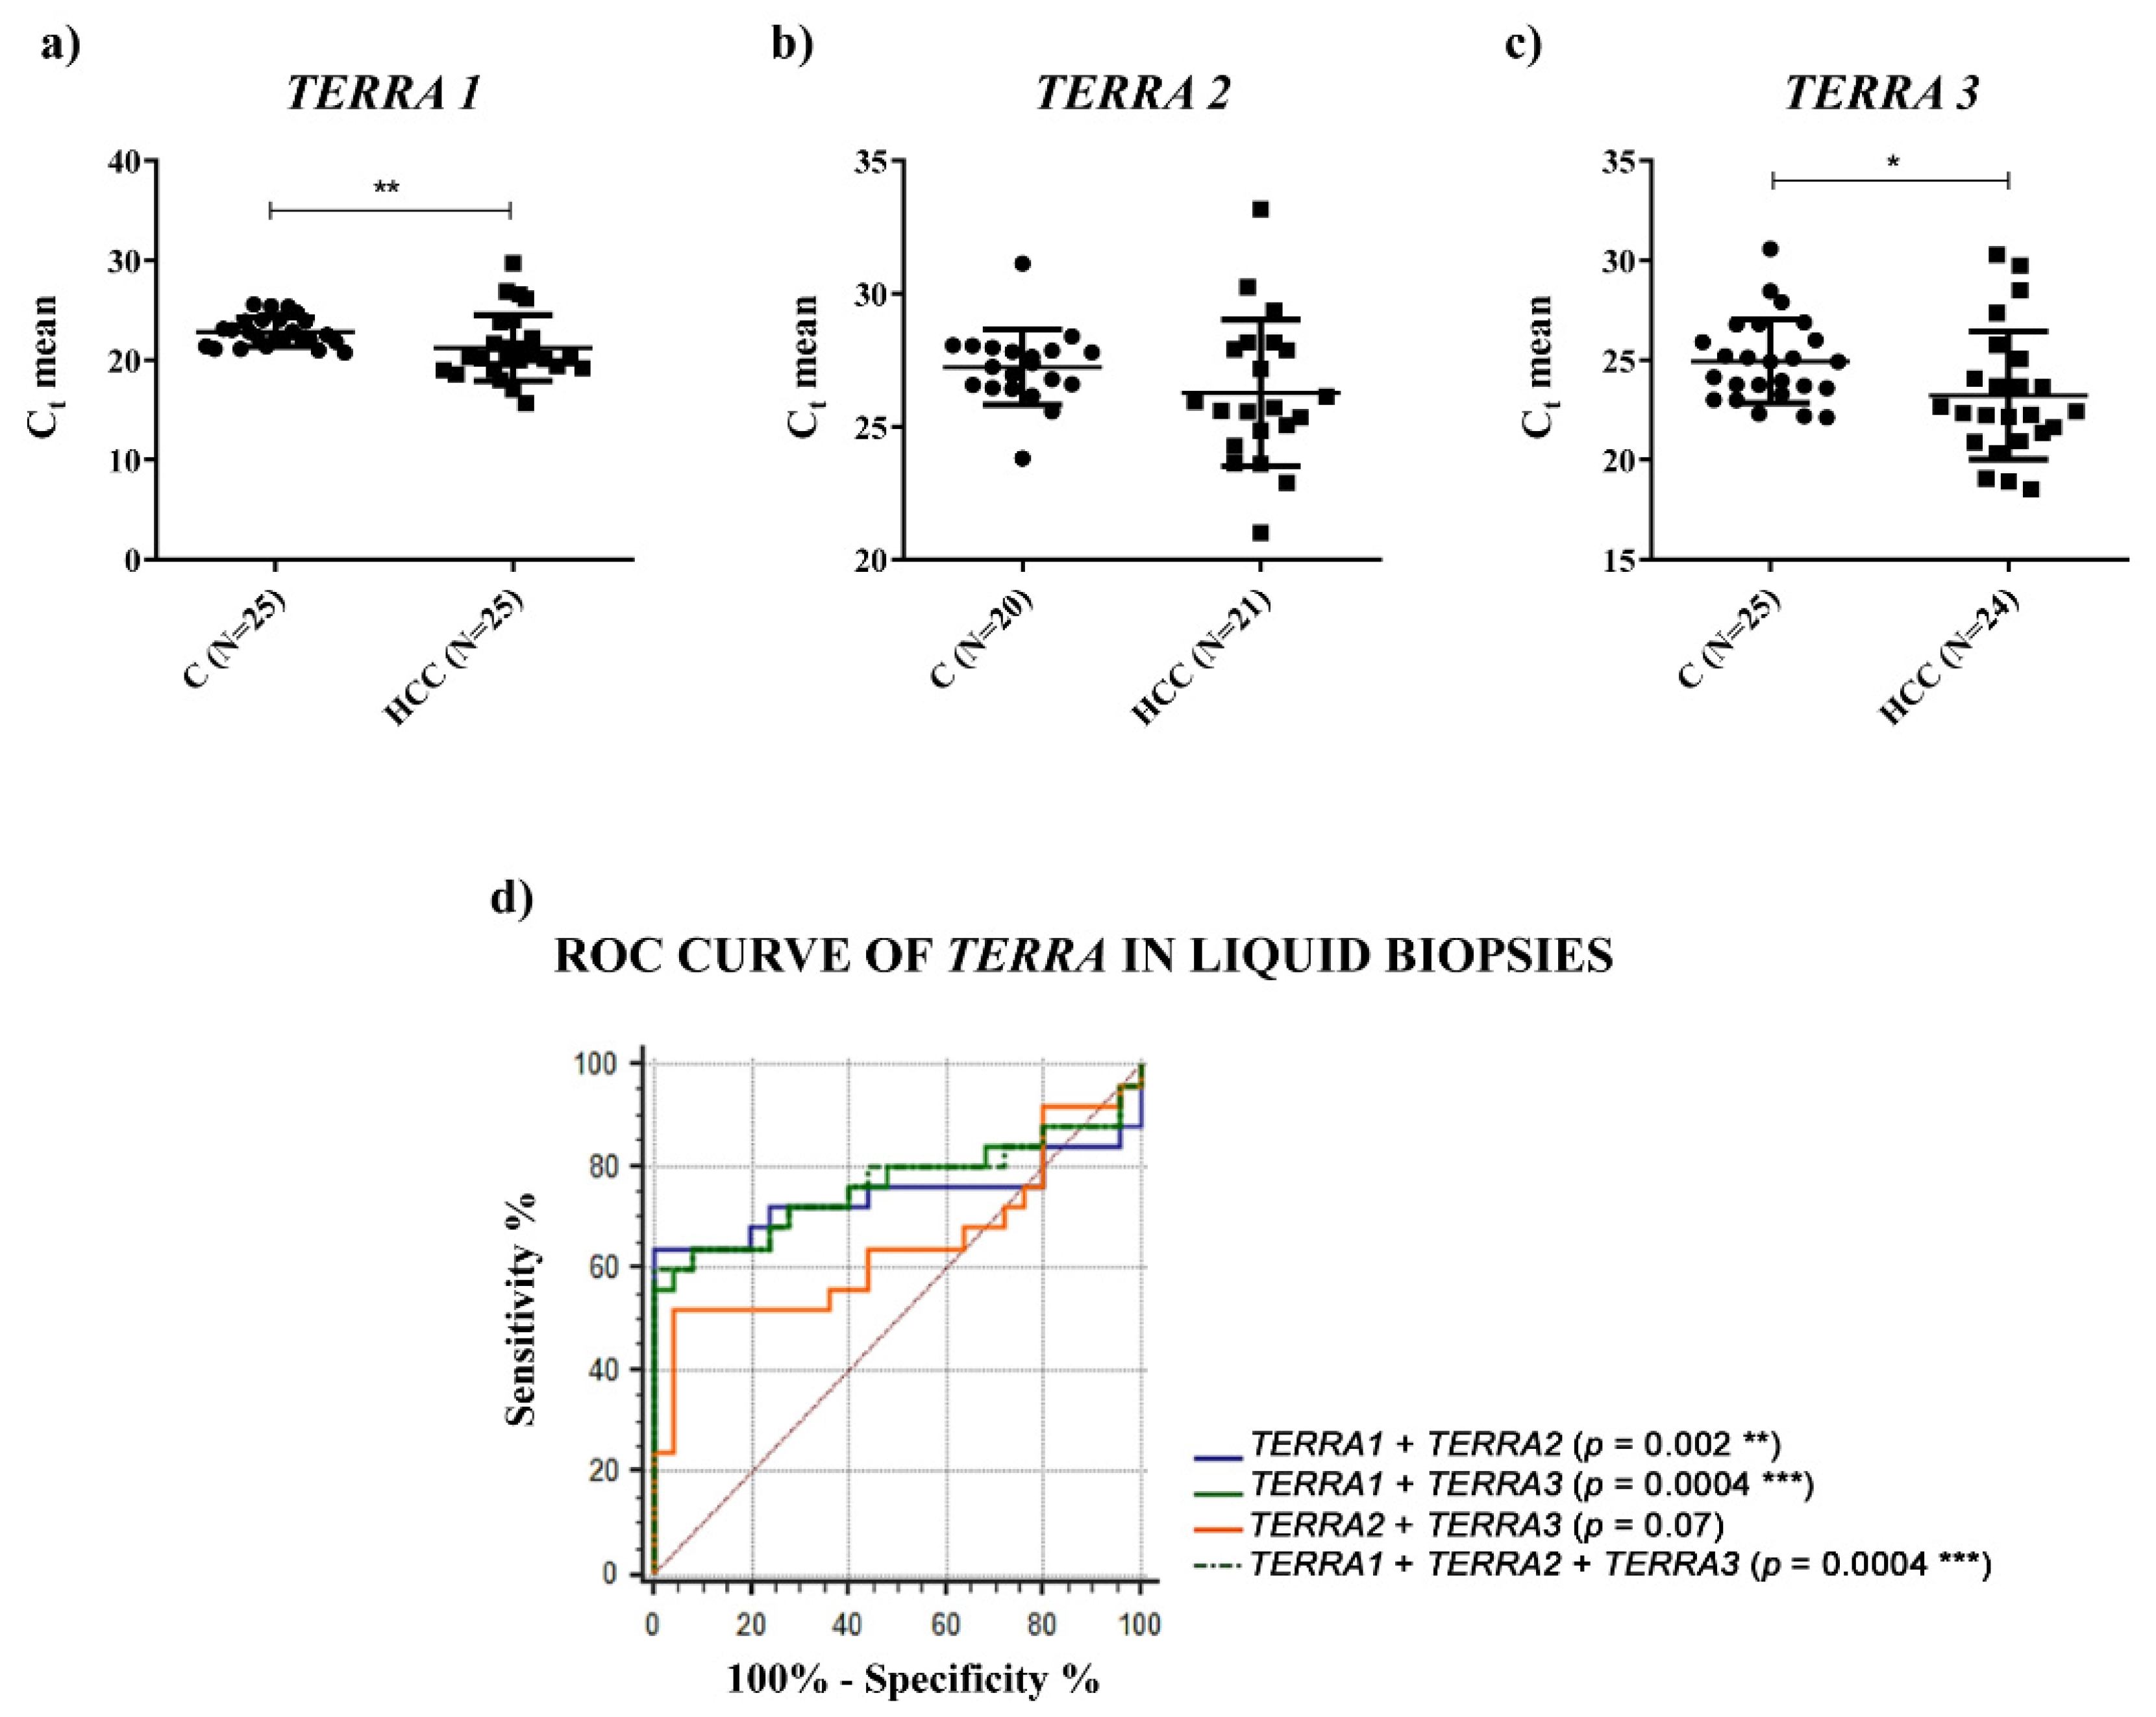
TERRA downregulation in HCC tissues vs. the corresponding PT ones and a significantly higher amount of TERRA in the plasma of HCC patients. In both cases, for the first time, ROC curves indicated significant capabilities in distinguishing HCC tissues from PT ones and HCC patients from control subjects. Further, the qPCR determinations of TERRA downregulation in HCC tissues, consistent with the in situ hybridization data reported by Cao et al. [8], could be utilized as specific characterization of the malignant tissue (of HCC or other cancer types), being the qPCR technique frequently used in research laboratories.
For TERRA transcripts in the plasma, an RNA-seq study [18] revealed the presence of TERRA molecules in the plasma of 2 normal subjects and of 19 patients with various cancer types (prostate, stomach, breast, colon, kidney, lung, duct, liver, melanoma, ovarian); however, to our knowledge, there are no reports on circulating TERRA in a small or large cohort of patients with the same type of cancer, or even reports on the PCR determinations of TERRA amounts in the plasma of cancer patients. Hence, the data reported in our study are the first concerning TERRA expression in the plasma of a cohort of patients with the same cancer type, HCC, in comparison to healthy individuals.
For the overexpressed amount of TERRA detected in the plasma of HCC patients, we cannot know the origin of the circulating forms of TERRA, if they derive from the malignant cells or not. Despite this, our data indicate that the plasma determination of TERRA amounts can be taken into account as a possible non-invasive molecular indicator of HCC diagnosis and, in order to ascertain this hypothesis, we are planning a multicenter study to examine a larger cohort of patients.
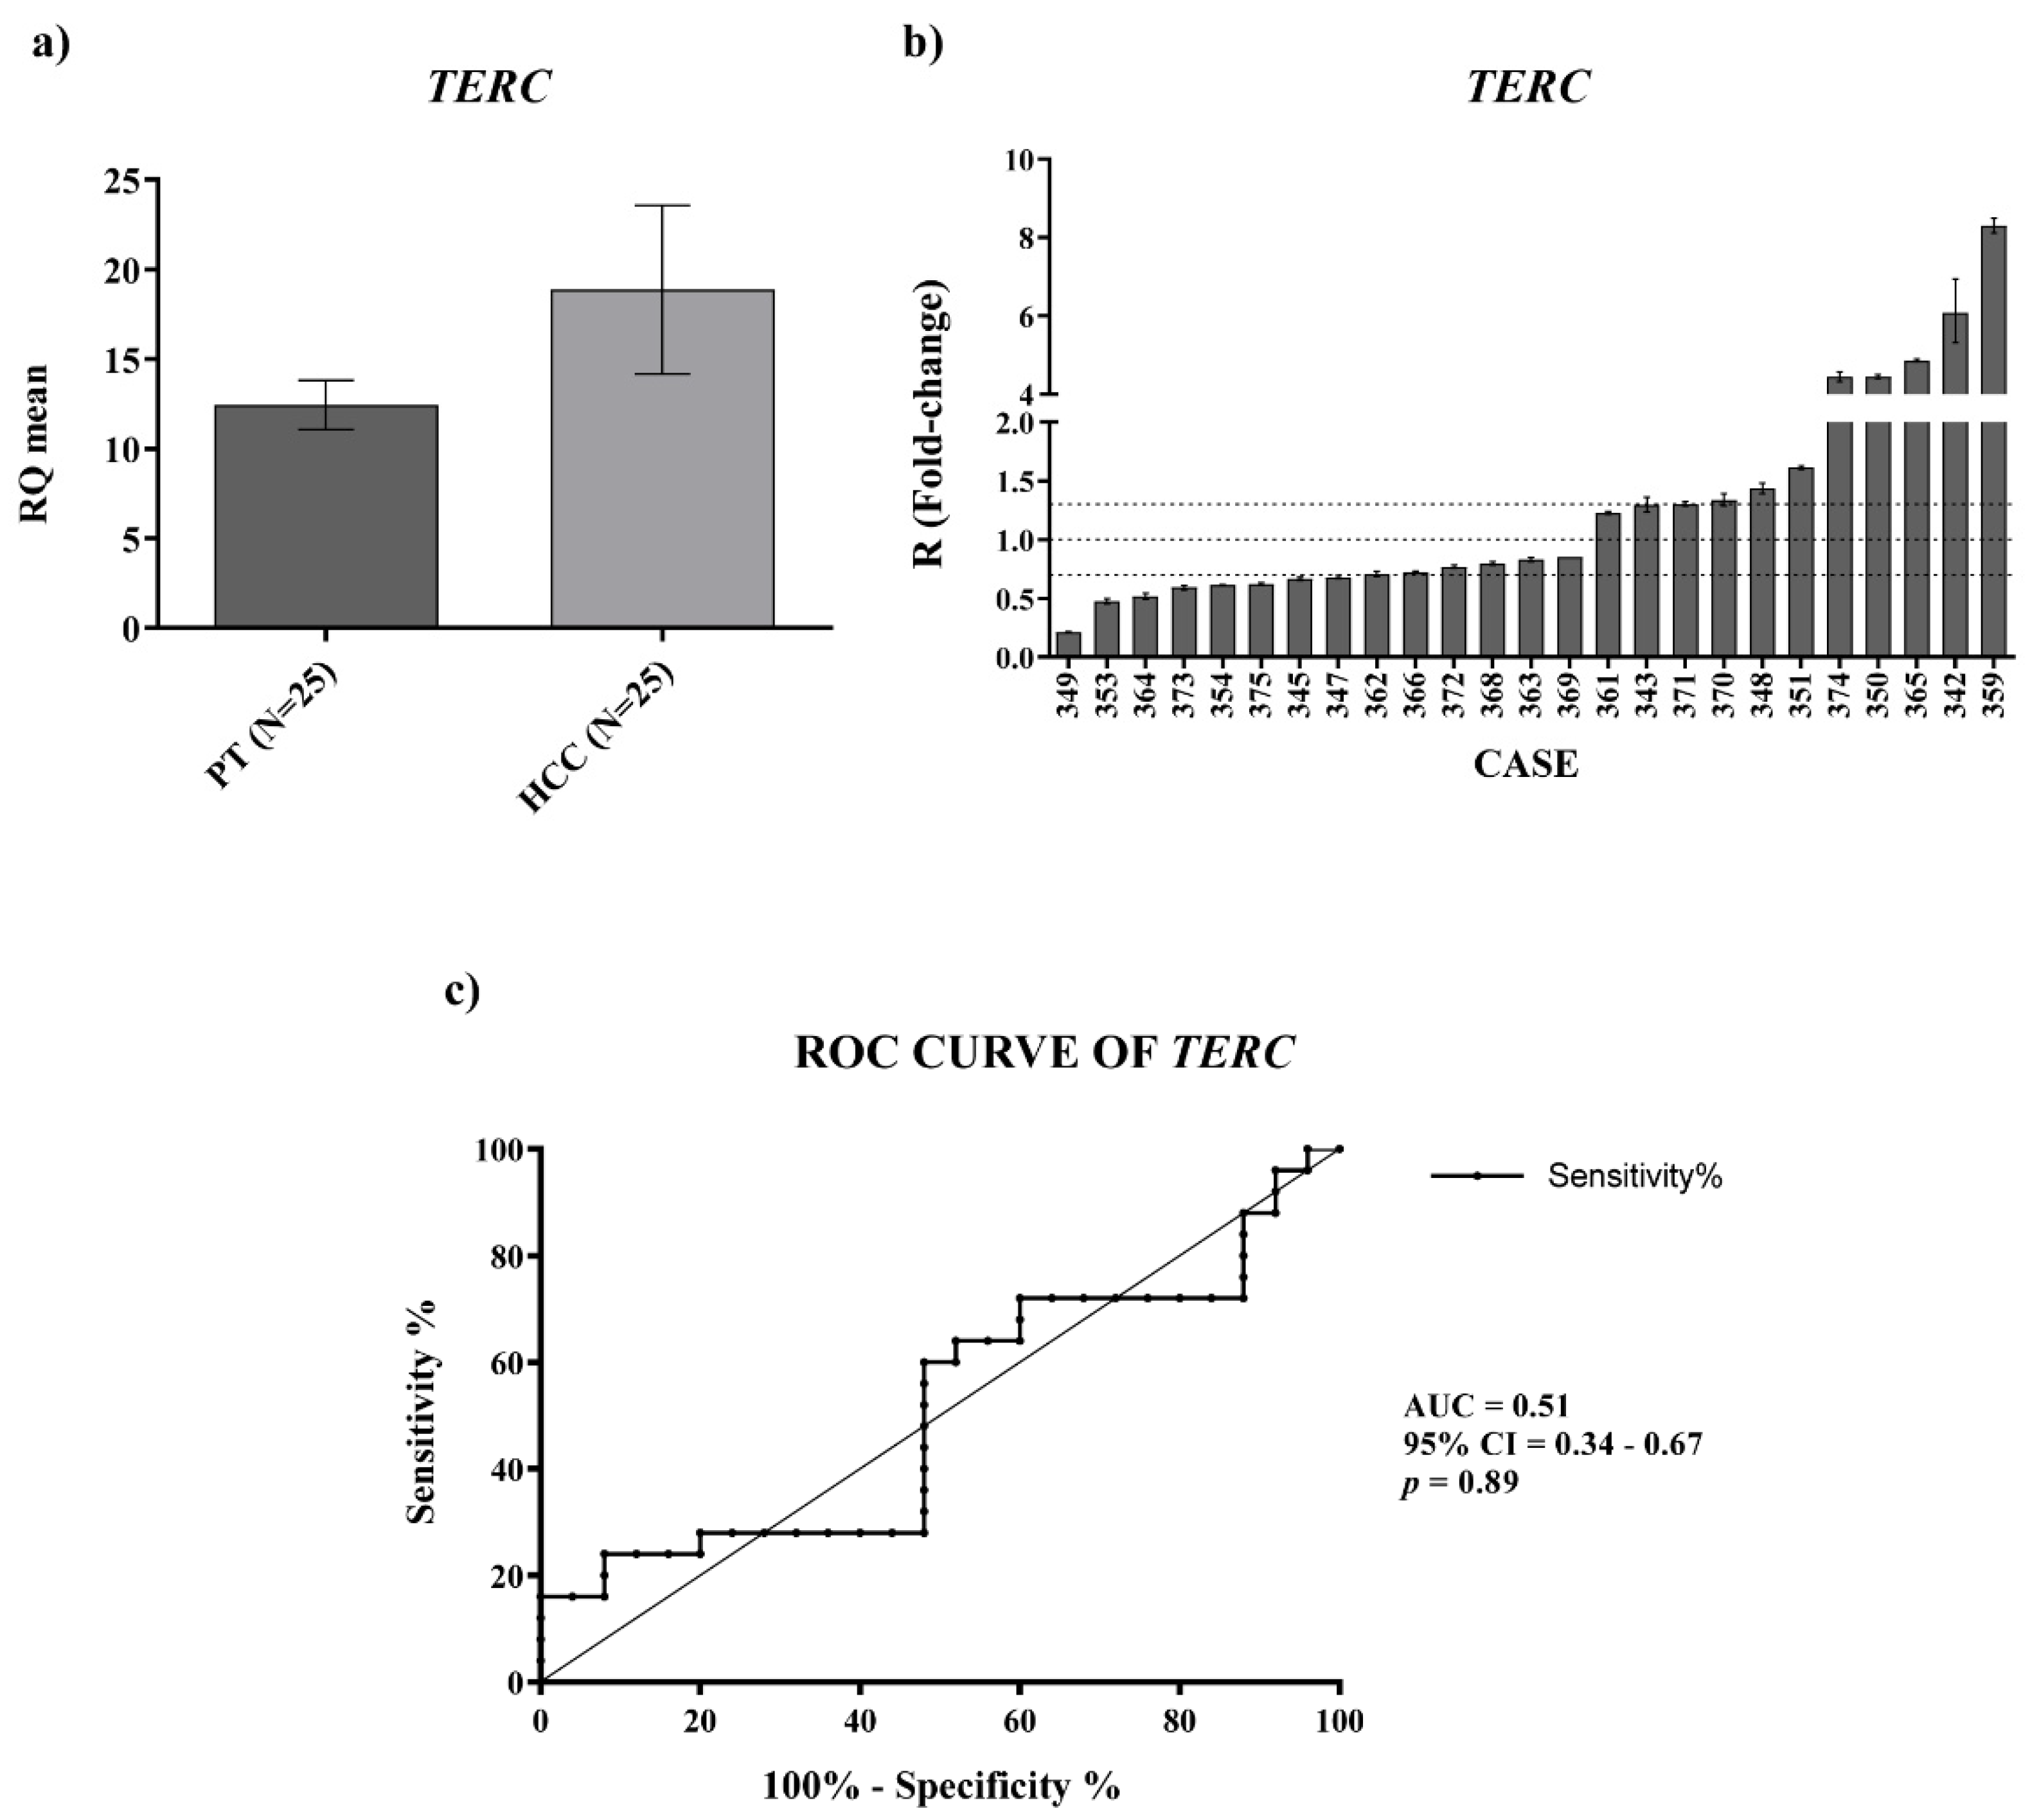
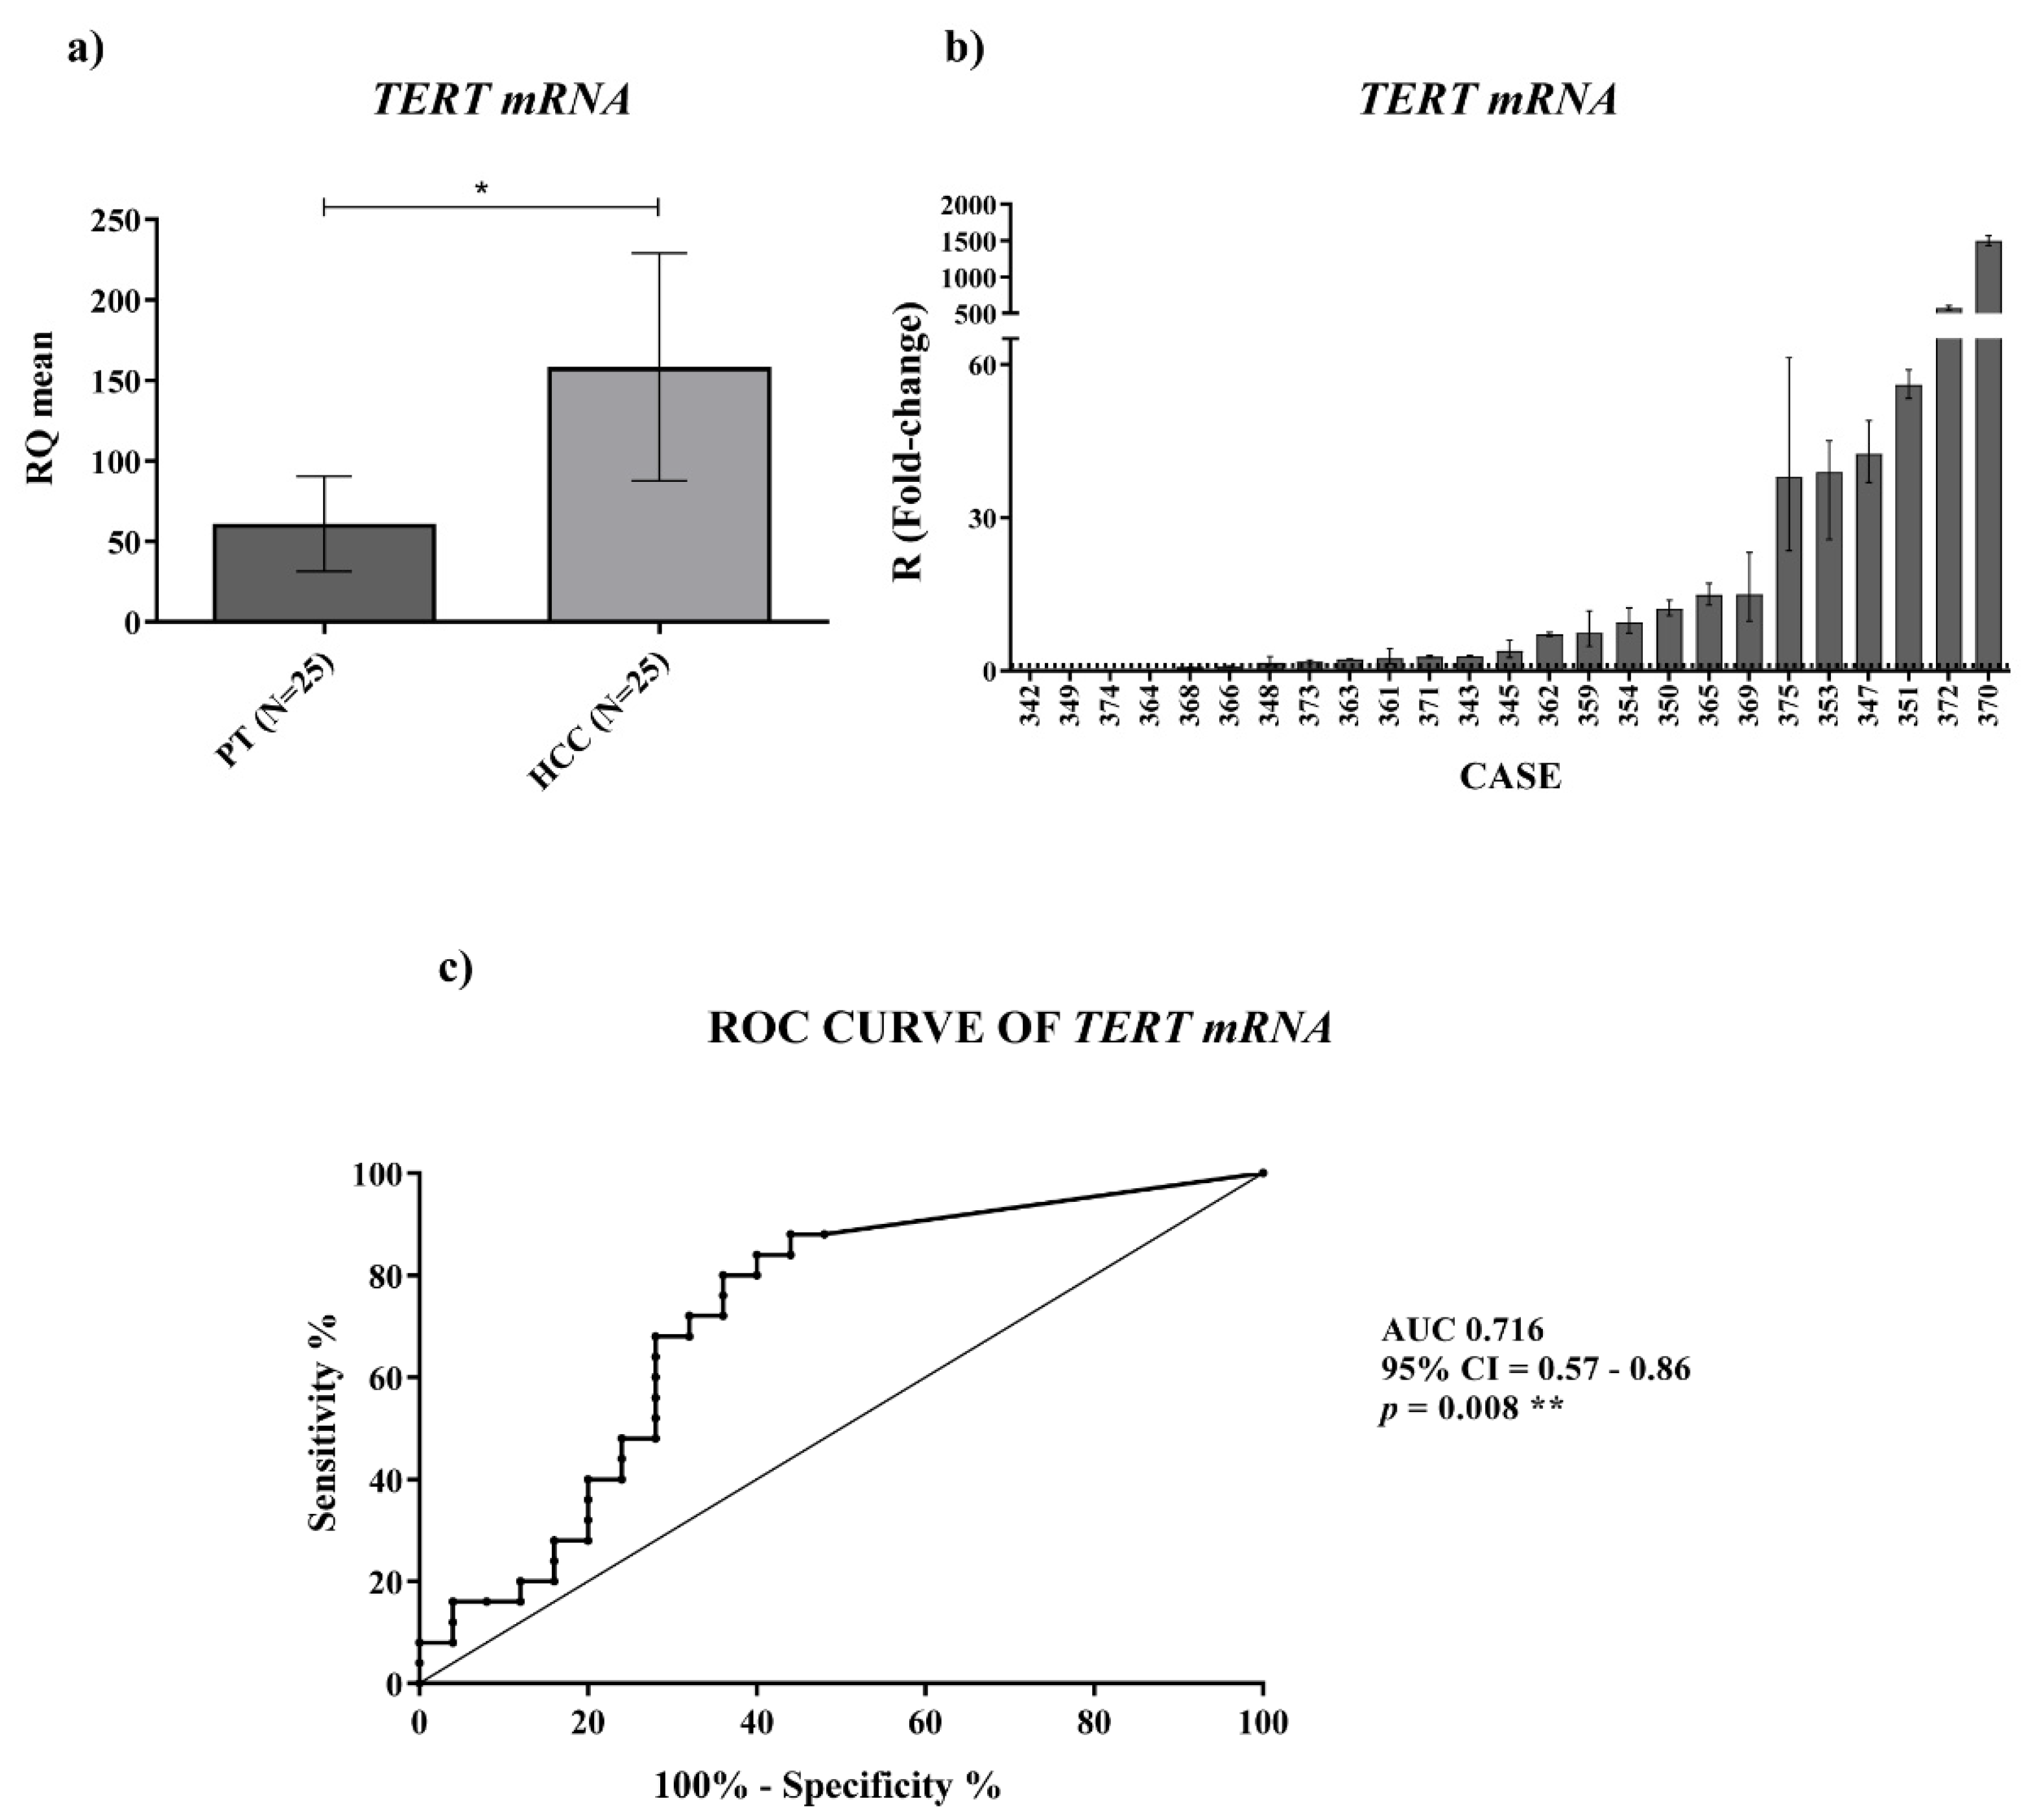
For TERC and TERT mRNA expression we found an upregulation in HCC tissues, which was significant for the TERT mRNA. For measuring the level of TERC and TERT mRNA in plasma, we used ddPCR, the best technology to assess absolute quantifications of transcripts, especially the circulating ones. The 
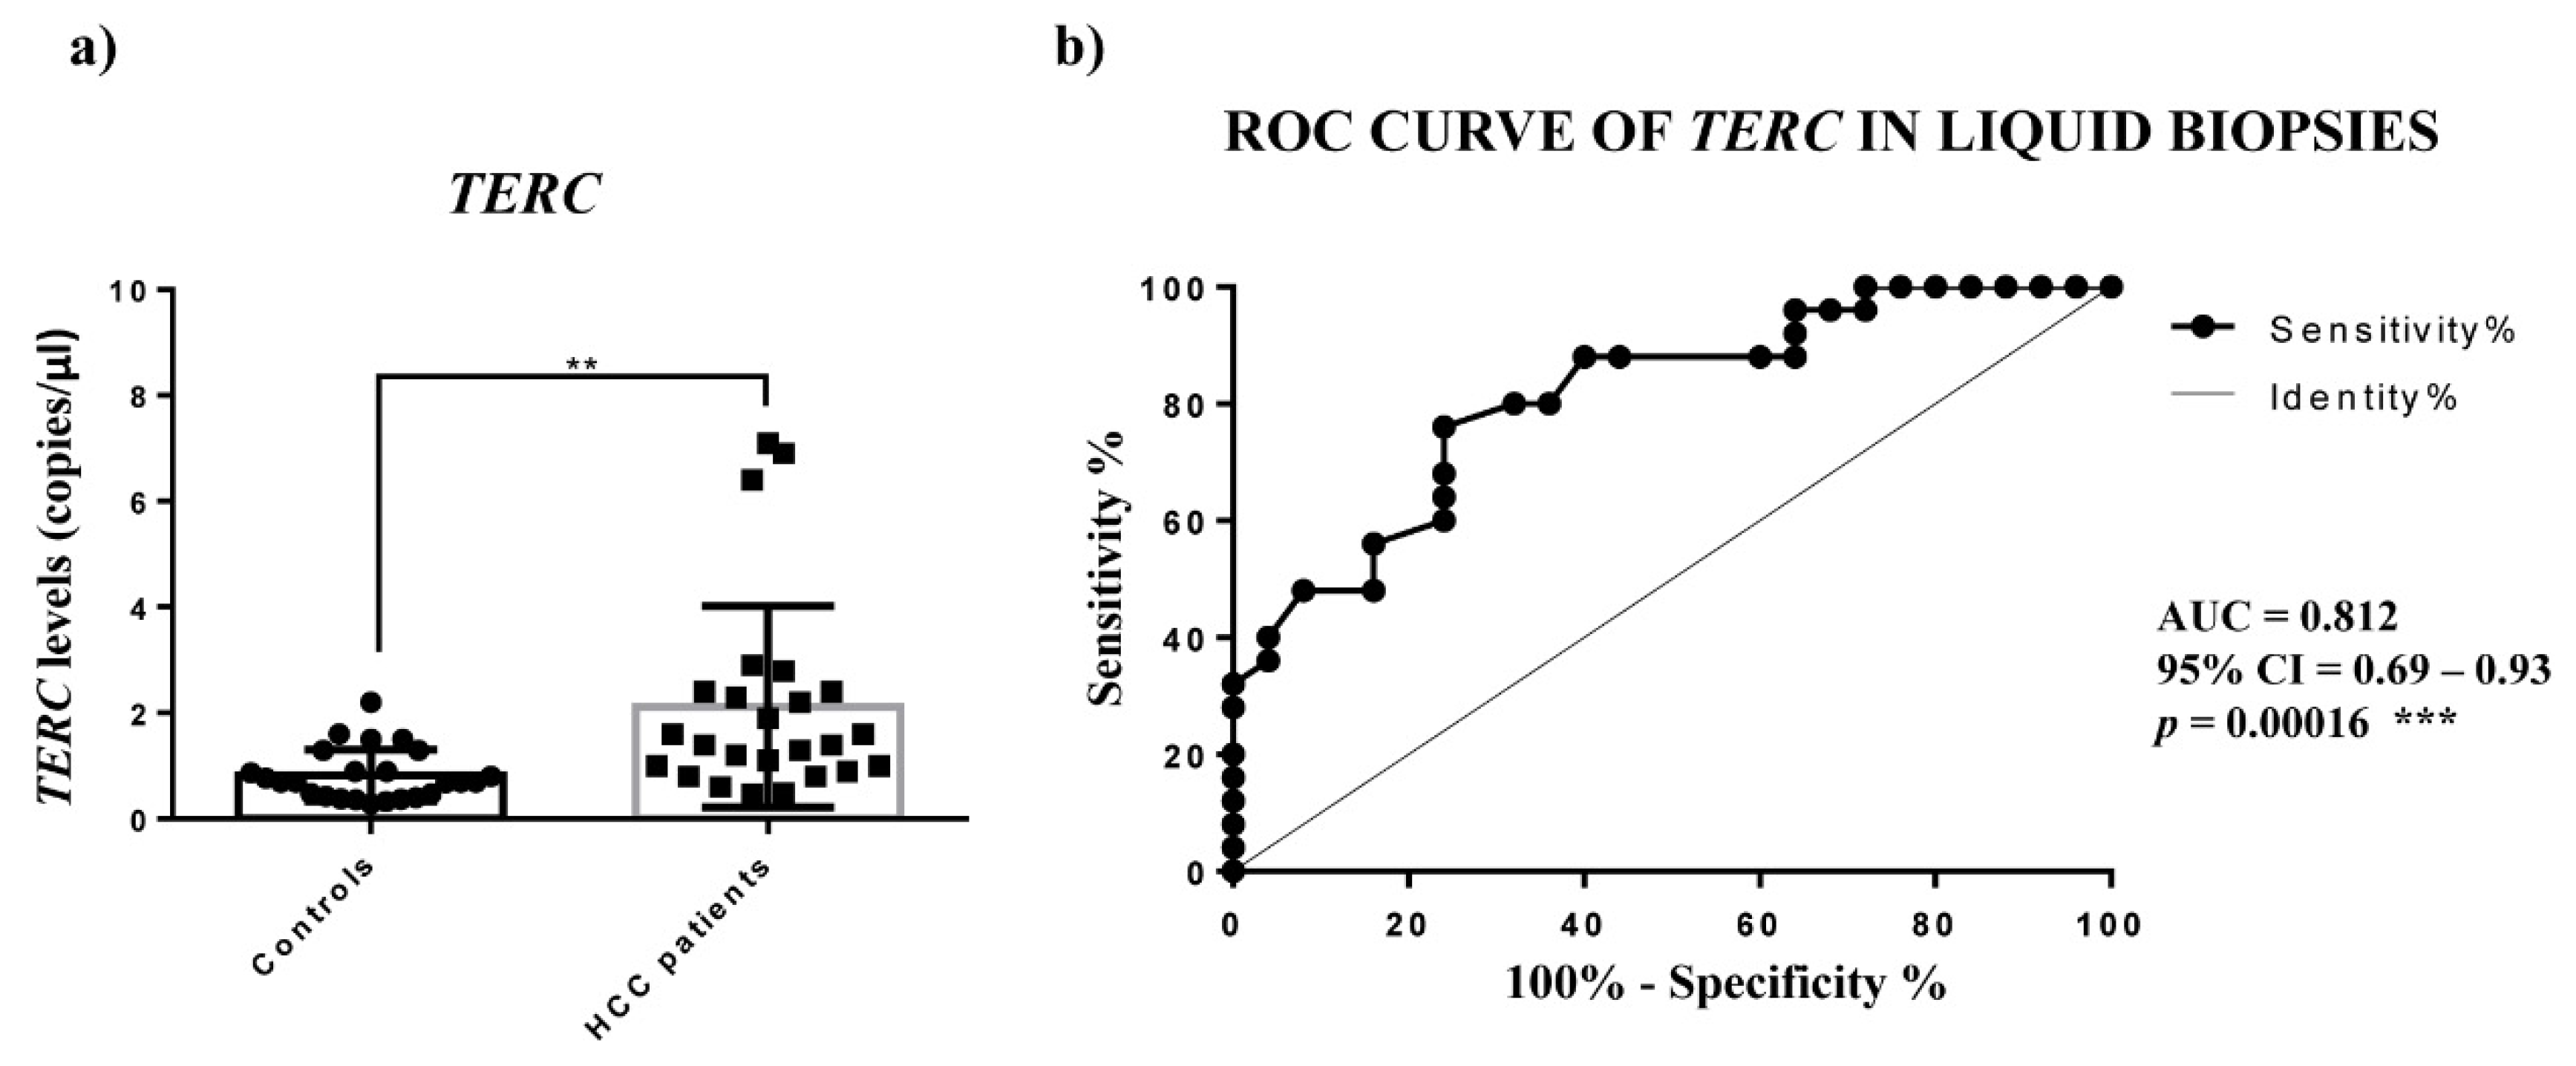
TERC amounts detected in the plasma of HCC patients were significantly higher, while TERT mRNA was not detectable, thus indicating that in HCC patients the cells do not secrete the detectable extracellular form of TERT mRNA. The ROC analysis of circulating TERC expression revealed a significant ability in discriminating HCC patients from controls. Concerning TERC in cancer, it is known from in situ and fluorescence hybridization data (ISH, FISH) that is overexpressed in lung, oral, prostate and cervix carcinoma [10]; further, only Novakovic et al., to our knowledge, reported nested-PCR data that revealed the presence of TERC in the plasma of healthy controls and of patients with breast cancer, melanoma and thyroid cancer, but did not allow the TERC amount to be considered as a tumor marker [29]. Hence, our findings would indicate the determination of circulating TERRA and TERC in HCC patients as specific non-invasive molecular indicators of this malignant condition.
Subsequently, in the present work, to address the problem of the dysregulation of TERRA, TERC and TERT mRNA in HCC from a biological point of view, we characterized two HCC cell lines for the expression of these transcripts and, for the first time, we report data on their expression both at the cellular and extracellular levels, indicating that the two HCC cell lines may represent the heterogeneity of HCC. In particular, the HA22T/VGH and SKHep1C3 cells, at low and very high TERRA expressions, respectively, may represent the HCC cases with TERRA downregulation and upregulation, respectively. HA22T/VGH cells producing low TERRA amounts expressed high levels of TERC and TERT mRNA, and this result is consistent with previous evidence indicating that TERRA depletion associates with increased levels of TERC [3]. Both HCC cell lines secrete TERRA molecules into the secretome-derived EVs. The HA22T/VGH cells secreted very high amounts of TERRA and low amounts of TERC. As expected, 
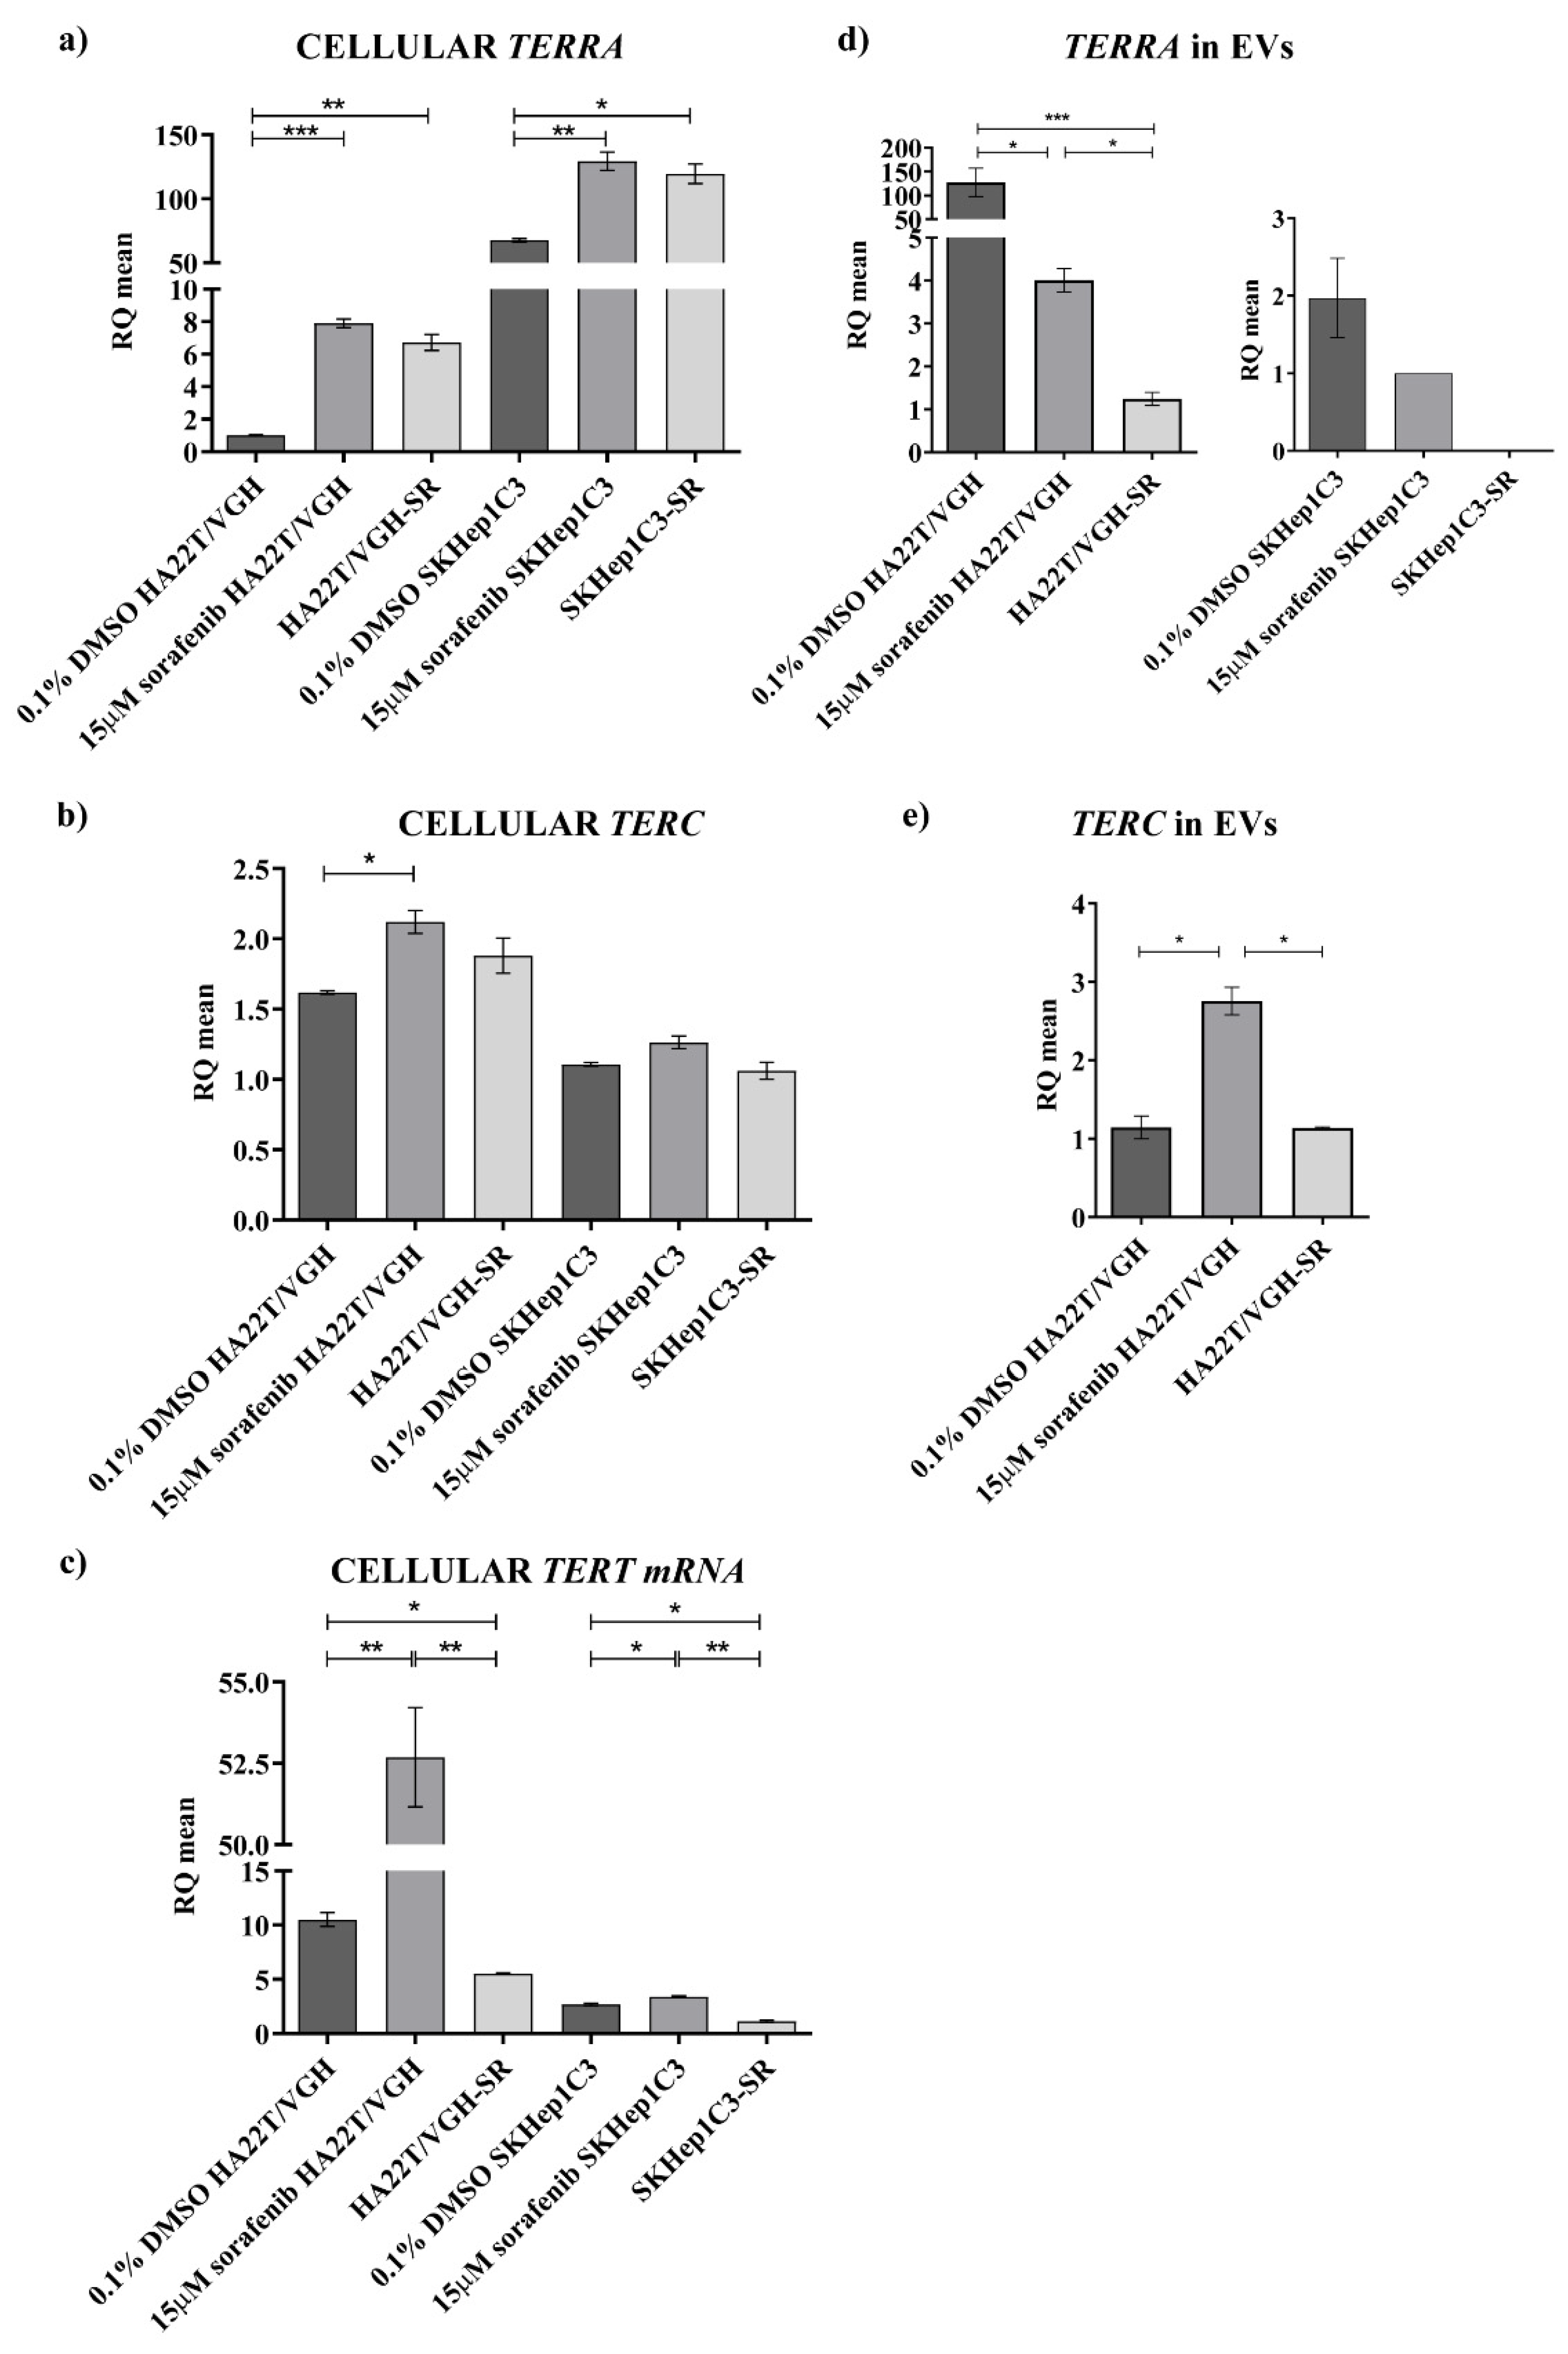
TERT mRNA was not detected as an extracellular form in any condition. Further, concerning the effect of an anticancer drug on TERRA expression, both cell lines similarly responded to sorafenib treatment enhancing the expression amount of TERRA, TERC and TERT mRNA at the cellular level. HA22T/VGH reacted to sf increasing the cellular expression of TERRA, TERC and TERT mRNA and decreasing the secretion of TERRA and TERC; SKHep1C3 cells reacted to sf increasing the cellular expression of TERRA, but much less TERC and TERT mRNA, and decreasing the secretion of TERRA and by not secreting both TERC and TERT transcripts. Sorafenib is a multikinase inhibitor exerting its antitumor activity mainly affecting the proliferation and apoptosis of cancer cells, known to influence gene expression at the level of mRNAs, ncRNAs and genome methylation with mechanisms that have not been elucidated [22,23,32]. Hence, further effort is needed to understand the intracellular events that led to an increase of TERRA in cells treated with sf. From a general point of view, it is known that TERRA is a heterogeneous group of ncRNAs generated from multiple different telomeres and with various size (from 100 to 10 Kb); it has been proposed that its upregulation can be regulated by stress inducing the processing of TERRA molecules into smaller fragments then secreted into the EVs. It seems that TERRA containing EVs are relatively stable and circulate in extracellular spaces, including plasma, but it is not known how the smaller extracellular forms are generated. As reported by Wang et al. [19], the extracellular molecules of TERRA can be breakdown products of full-length cellular TERRA or an alternative form that is encapsulated into the EVs and secreted in extracellular spaces. It is likely that TERRA containing EVs can transfer signaling information to surrounding cells impacting the extracellular microenvironment. The complex combination of factors that comprise EVs and the type of recipient cells sensing the EVs may determine the nature of the signaling and response.
Hence, this part of the present study is the first effort to characterize the cellular and extracellular expression of TERRA, TERC and TERT mRNA in HCC cell lines demonstrating the capability of these cells to secrete TERRA and TERC transcripts into the EVs and thus opening a new scenario in the biology of HCC cells. Novel issues will be addressed to understand the role of TERRA and TERC containing EVs in transferring signaling to surrounding cells in vitro and in an HCC tumor xenograft.
In conclusion, in the current work we have assessed the cellular and extracellular expression of TERRA, TERC and TERT mRNA studying HCC tissues, the plasma of HCC patients and the cells and secretomes of two HCC cell lines. Our novel findings obtained by qPCR show that HCC tissue is significantly characterized by TERRA downregulation and by TERT mRNA upregulation; the plasma of HCC patients revealed an overexpression of TERRA and TERC, thus indicating novel non-invasive indicators of HCC whose clinical diagnostic significance will be investigated further in a larger cohort of patients. It is clear that among HCC tissues there are two sets, one with TERRA down-modulation, the other with TERRA upregulation. Moreover, the characterization of two HCC cell lines, representative of this feature of HCC heterogeneity, has clearly shown the ability of HCC cells to produce and secrete TERRA and TERC into the EVs; the ability to produce TERT mRNA that is not secreted; and the ability to respond to sorafenib treatment increasing TERRA expression. From a general point of view, our findings contribute to the basic knowledge of the cellular and extracellular forms of TERRA and TERC produced by cultured cancer cell lines and those detectable in HCC tissues and in the plasma of HCC patients.

4. Materials and Methods

4.1. Tissue Samples and Liquid Biopsies Collection

All human HCC tissues as well as the corresponding peritumoral (PT) (resected 1–2 cm from the malignant tumor) and the peripheral blood were obtained from 25 HCC patients who underwent HCC resection at Spedali Civili, Surgical Clinic of Brescia, Italy (Table S3). The peripheral blood of healthy volunteers (n = 25) was collected at the Immunohematology and Transfusion Medicine Service at ASST Civili Hospital in Brescia, Italy. HCC tissues and the PT ones were subsequently preserved in RNA-Later (Invitrogen; Thermo Fisher Scientific, Inc., Waltham, MA, USA) for further investigation. The subjects consisted of 20 men and 5 women, ranging from 60 to 82 years of age. The subjects did not have any apparent distant metastases, and none of them had been previously treated for HCC. Each individual was screened for the presence of the hepatitis B virus (HBV) or hepatitis C virus (HCV): 3 patients were positive for HBV, 15 were positive for HCV and 8 were found to be negative for both HBV and HCV. Each biopsy specimen underwent a pathological examination as previously described [22] that revealed the presence of different background diseases: 3 steatosis, 14 cirrhosis, 6 chronic hepatitis, 1 von Meyenburg complex and 1 no apparent background pathology (normal hepatic parenchyma); for 1 sample, no information was available. Liquid biopsies were collected from the peripheral blood of each patient before HCC surgical resection in a VACUETTE® (Greiner Bio-One, S.r.l., Kremsmünster, Austria) EDTA-coated blood collection tubes. Plasma samples were obtained from 1 mL of peripheral blood with a first centrifugation step at 3000 rpm for 10 min at 4 °C followed by a second centrifugation step at 4000 rpm for 20 min at 4 °C. Samples showing hemolysis were excluded. The plasma was transferred to a new tube and stored at −80 °C until RNA extraction.
This study was approved by the ethical committee of ASST Civili Hospital of Brescia on 2 October 2012 (NP1230). Informed consent was obtained from all the subjects enrolled in this study. All methods were performed in accordance with the relevant guidelines and regulations.

4.2. Cell Cultures, Treatment with Sorafenib and EV Isolation

In the present study, human tumor cell lines derived from HCC (HA22T/VGH and SKHep1C3) were used. HA22T⁄VGH undifferentiated cells, kindly provided by N. D’Alessandro (University of Palermo, Palermo, Italy), were maintained in RPMI-1640 (Life Technologies; Thermo Fisher Scientific, Inc., Waltham, MA, USA) with 100 nM sodium pyruvate (Thermo Fisher Scientific, Inc., Waltham, MA, USA). SKHep1Clone3 (SKHep1C3), selected from human HCC-derived cells (SKHep1: ATCC HTB-52), was maintained in Earle’s MEM (Thermo Fisher Scientific, Inc., Waltham, MA, USA). All culture media were supplemented with 10% fetal bovine serum (FBS; Euroclone, S.p.a., Pero, Italy) and 10,000 U/mL penicillin/streptomycin (Thermo Fisher Scientific, Inc., Waltham, MA, USA). HA22T/VGH and SKHep1C3 sorafenib resistant cells (HA22T/VGH-SR and SKHep1C3-SR), produced in our lab, were maintained as previously described [22]. Cells were cultured at 37 °C with 5% CO2 in 10 cm Ø plates up to almost 90% of confluence. Sorafenib [N-(3-trifluoromethyl-4-chlorophenyl)-N-(4-(2-methylcarbamoylpyridin-4-yl) oxyphenyl) urea] was synthesized and provided by Bayer Corporation (West Haven, CT, USA). The compound was dissolved in 100% dimethyl sulfoxide (DMSO; Sigma-Aldrich; Merck, Inc., Darmstadt, Germany) and diluted with RPMI-1640 or MEM to the required concentration (10 µM, 15 µM). In in vitro experiments, 0.1% DMSO was added to cultures as a negative solvent control. In order to get extracellular vesicles (EVs)-containing media (named in this text as secretome), HA22T/VGH and SKHep1C3 cells were seeded in a 10 cm Ø plate (4 replicates/each condition) at a density of 5 × 10⁶ cells and maintained in complete media until they reached 75% of confluence. Then, after gentle washes with PBS, cells were subsequently supplied with serum-free medium for 24 h and treated with sorafenib at the specific concentrations (15 µM).
Before starting the nickel-based isolation (NBI) of EV, collected media were centrifuged at 2800× g for 10 min to remove cell debris and mixed to a nickel-based matrix of beads in order to capture EVs, which were subsequently analyzed by Q-NANO instrument (IZON Science, Ltd., Christchurch, New Zealand), as previously reported [33]. We recovered a particle concentration range between 1.63 × 10⁸ and 2.09 × 10⁸ EV/mL for HA22T/VGH cells, from 3.08 × 10⁸ to 11.01 × 10⁸ EV/mL for SKHep1C3 cells according to different cell densities and the amount of medium processed to further optimize the RNA recovery. The EV showed various sizes of the mean diameter, from 185 to 252 nm for HA22T/VGH cells and from 250 to 317 nm for the SKHep1C3 ones.

4.3. RNA Isolation

Total RNA was obtained from 10 cm Ø cells plates and by grinding ~1 cm3 of tumor and peritumor tissue with a TissueRupture (Qiagen, Inc., Hilden, Germany) in 1 mL of TRIzol Lysis Reagent (Qiagen, Inc., Hilden, Germany) according to the Chomczynski–Sacchi method [34]. RNA purity and concentration were assessed and measured by a NanoDrop™ 1000 Spectrophotometer (Thermo Fisher Scientific, Inc., Waltham, MA, USA), while the integrity was evaluated on 0.8% agarose gel stained with ethidium bromide. Extracellular total RNA was extracted from 200 µL of isolated EVs and 200 µL of plasma, using a miRNeasy Mini Kit (Qiagen, Inc., Hilden, Germany), according to the manufacturer’s instructions as previously reported [20].

4.4. Northern Blotting

The secretome RNA samples were extracted as described above, the control total RNA from HeLa (ATCC: CCL-2) and U2OS (ATCC: HTB-96) cell lines was extracted using TRIzol reagent (Thermo Fisher Scientific, Inc., Waltham, MA, USA) according to the manufacturers’ protocol.
U2OS (human osteosarcoma cell line) and HeLa (human cervical adenocarcinoma cell line) cells were obtained from ATCC (Manassas, VA, USA). The cells were grown in Dulbecco’s Modified Eagle Medium (Thermo Fisher Scientific, Inc., Waltham, MA, USA) supplemented with 2 mM L-glutamine, 1% penicillin-streptomycin and 10% fetal bovine serum at 37 °C and 5% CO2 to 50–70% confluency before harvesting for RNA extraction.
RNA purity and concentrations were assessed as stated in Section 4.3. RNA was mixed with RNA gel loading dye (Thermo Fisher Scientific, Inc., Waltham, MA, USA), denatured for 10 min at 65 °C and separated for 2 h at 9.5 V/cm in 1% agarose MOPS gel with 1.9% formaldehyde, then blotted onto the Amersham Hybond-N+ hybridization membrane (Cytiva) with the semi-dry Power Blotter System (Invitrogen; Thermo Fisher Scientific, Inc., Waltham, MA, USA) and cross-linked in the CL-1000 Ultraviolet Crosslinker (Fisher Scientific, Inc., Hampton, NH, USA) at the pre-set conditions. A probe consisting of five telomeric repeats (5′-CCCTAA-3′)5 was labeled with the DIG Oligonucleotide 3′-End Labeling Kit (F. Hoffmann-La Roche, Ltd.; Basel, Switzerland) according to the manufacturers’ instructions and denatured for 5 min at 95 °C before hybridization. The hybridization was performed at 50 °C overnight, the membrane was washed, blocked, incubated with anti-digoxygenin-AP (F. Hoffmann-La Roche, Ltd.; Basel, Switzerland; dilution 1:1500), visualized by incubation with CDP-Star Merck KGaA, Darmstadt, Germany and captured on the Chemidoc XRS+ (Bio-Rad Laboratories, Inc., Hercules, CA, USA).

4.5. RT-qPCR and Gene Expression Analysis

cDNA for TERC and TERT mRNA studies was synthesized from 1 μg of tissues and cells total RNA using M-MLV reverse transcriptase (Thermo Fisher Scientific, Inc., Waltham, MA, USA) with random hexamer (Thermo Fisher Scientific, Inc., Waltham, MA, USA), according to the manufacturer’s instructions. The reverse transcription (RT) reaction was performed at 37 °C for 60 min, followed by inactivation at 95 °C for 5 min in a T100 Thermal Cycler (Bio-Rad Laboratories, Inc., Hercules, CA, USA). TERRA first-strand cDNA was synthesized following Feretzaki’s protocol [35]. Briefly, 1 μg of tissues and cells total RNA was first partially denatured at 65 °C before RT. Then, a TERRA-cDNA-pool was synthesized in a final volume of 20 µL with RT-specific primers: lncRNA TERRA 5′-(CCCTAA)5-3′ and β-actin 5′-AGTCCGCCTAGAAGCATTTG-3′. cDNA for circulating lncRNA TERRA was synthesized from 2.5 µL of plasma total RNA using the iScript Explore One-Step RT and PreAmp Kit (Bio-Rad Laboratories, Inc., Hercules, CA, USA) in a final reaction volume of 25 µL, according to the manufacturer’s instructions. The pre-amplification step consisted of 14 cycles of temperature variation at 95 °C for 15 s and 60 °C for 4 min.
qPCR for TERC and TERT mRNA were carried out using TaqMan Universal PCR Master Mix 2X (Applied Biosystems; Thermo Fisher Scientific, Inc., Waltham, MA, USA) and the appropriate qPCR assays 20X, following the manufacturer’s instructions: TERC (assay ID: ID Hs03454202_s1; Thermo Fisher Scientific, Inc., Waltham, MA, USA), TERT (assay ID: Hs00972650_m1; Thermo Fisher Scientific, Inc., Waltham, MA, USA). GAPDH was used as endogenous control (assay ID: Hs99999905_m1; Thermo Fisher Scientific, Inc., Waltham, MA, USA). The thermocycling conditions were: initial denaturation at 95 °C for 10 min, followed by 40 cycles at 95 °C for 15 s then 60 °C for 1 min. qPCR for lncRNA TERRA was performed mixing 2 µL of TERRA-cDNA-pool (1:2 from tissues or cells) or 3 µL of TERRA-cDNA-pool (1:10 of pre-amplified product) and the specific forward/reverse primers with Power SYBR Green PCR Master Mix 2X (Applied Biosystems; Thermo Fisher Scientific, Inc., Waltham, MA, USA) in a final volume of 20 µL, according to the manufacturer’s instructions. TERRA qPCR was followed by the dissociation stage for melting curve analysis for each primer-pair used at 95 °C for 25 min, 60 °C for 1 min and 95 °C for 15 min. The sequence of the specific primers (Integrated DNA Technologies, Inc.) was: TERRA 1 (hTel_1_2_10_13q) 5′-GAATCCTGCGCACCGAGAT-3′ (forward) 5′-CTGCACTTGAACCCTGCAATAC-3′ (reverse); TERRA 2 (hTel_15q) 5′-CAGCGAGATTCTCCCAAGCTAAG-3′ (forward) 5′-AACCCTAACCACATGAGCAACG-3′ (reverse); TERRA 3 (hTel_XpYp) 5′-GCAAAGAGTGAAAGAACGAAGCTT-3′ (forward) 5′-CCCTCTGAAAGTGGACCAATCA-3′ (reverse). β-actin was used as endogenous control 5′-CCTCGCCTTTGCCGATCC-3′ (forward), 5′-GGATCTTCATGAGGTAGTCAGT-3′ (reverse). Each reaction was performed in triplicate. Data analysis was performed by the 7500 Real-Time PCR System (Applied Biosystems; Thermo Fisher Scientific, Inc., Waltham, MA, USA). In tissues and cells, gene expression was measured with the Livak–Schmittgen (2-ΔΔCq) method [36] and the TERRA expression was obtained as the mean of the relative quantification (RQ) values for TERRA 1, TERRA 2 and TERRA 3. When all 25 patients were analyzed, the plates were virtually merged by the 7500 Applied Biosystems software in order to determine the same calibrator per target (TERRA1, TERRA1, TERRA3) that was the sample with the lowest TERRA expression (in our cohort the sample HCC347). For all these reasons, RQ values of the different samples can be compared.
Due to the lack of a known reference gene that would allow the normalization of circulating TERRA, qPCR data were reported as the average raw cycle thresholds (Ct) in plasma samples.

4.6. ddPCR and Gene Expression Analysis

Total RNA from plasma was reverse-transcribed into cDNA by random hexamers using M-MLV reverse transcriptase (Thermo Fisher Scientific, Inc., Waltham, MA, USA). Then, 9 μL of the resulting cDNA was prepared for amplification in a 20 μL reaction volume containing 10 μL 2X ddPCR Supermix for probes (Bio-Rad Laboratories, Inc., Hercules, CA, USA) and 1 μL 20X TaqMan (Thermo Fisher Scientific, Inc., Waltham, MA, USA) PCR probe assay (TERT: assay ID Hs00972650_m1; TERC: assay ID Hs03454202_s1). Each ddPCR assay mixture (20 μL) was loaded into a disposable droplet generator cartridge (Bio-Rad Laboratories, Inc., Hercules, CA, USA). Then, 70 μL of droplet generation oil for probes (Bio-Rad Laboratories, Inc., Hercules, CA, USA) was loaded into each of the eight oil wells. The cartridge was then placed inside the QX200 droplet generator (Bio-Rad Laboratories, Inc., Hercules, CA, USA). When droplet generation was completed, the droplets were transferred to a 96-well PCR plate (Bio-Rad Laboratories, Inc., Hercules, CA, USA) using a multichannel pipette. The plate was heat-sealed with foil and placed in a conventional thermal cycler. Thermal cycling conditions were: 95 °C for 10 min, then 40 cycles of 94 °C for 30 s and 60 °C for 1 min (ramping rate reduced to 2%), with a final step at 98 °C for 10 min and a 4 °C indefinite hold. A no template control (NTC) and a negative control for each reverse transcription reaction (RT-neg) were included in every assay.

4.7. Statistical Analysis

Statistical analysis was carried out using GraphPad Prism v7.0 (GraphPad Software, Inc., San Diego, CA, USA) software. The Wilcoxon test was used to compare the expression levels of selected transcripts between peritumoral and tumoral tissues. An unpaired t-test was used to test the significant differences in the plasma levels of selected transcripts between HCC patients and healthy subjects and for in vitro results. Diagnostic performance was evaluated using receiver operating characteristic (ROC) curve analysis. To assess the diagnostic values of multi-assays, the logistic regression method was applied. The diagnostic performance of individual as well as combinations of classifiers was computed using MedCalc v19.1.7 (MedCalc Software, Ltd., Ostend, Belgium) software. To evaluate the correlation between the clinical pathological characteristics and TERRA levels in tissues or in plasma samples, the patients were divided into 2 groups with high and low TERRA levels by using R (RQHCC/RQPT) = 0.7 for tissue expression or Ct = 22.81 (the median value) for plasma levels. Fisher’s exact test was applied. Data were considered statistically significant when p-value ≤ 0.05.

Supplementary Materials

The following supporting information can be downloaded at www.mdpi.com/article/10.3390/ijms23116183/s1.

Author Contributions

Conceptualization, G.D.P. and A.S.; methodology, M.M., I.G., J.C. and K.J.; investigation, A.S., M.M., I.G., J.C., V.G.D., K.J. and E.C.; resources, N.P. and S.M.; data curation, G.D.P., A.S., V.G.D., E.C. and N.P.; writing—original draft preparation, G.D.P., A.S., M.M. and I.G.; writing—review and editing, G.D.P., A.S., V.G.D., E.C. and N.P.; supervision, G.D.P. and A.S.; funding acquisition, G.D.P., A.S., V.G.D., E.C. and N.P. All authors have read and agreed to the published version of the manuscript.

Funding

This research was supported by CIB (Biotechnology Interuniversity Consortium), the Lega Italiana Lotta ai Tumori (LILT), Fondazione EULO Brescia, Italy (to GDP); the Italian Ministry of University and Research (FFRB grant) (to AS); the University of Brescia (local grants) (to AS, GDP and NP); Fondazione Cassa di Risparmio Trento e Rovereto (to VGD); and Associazione Italiana Ricerca sul Cancro (AIRC), grant MFAG2019 ID 22840 (to EC). The funding bodies played no role in the design of the study; in the collection, analysis, and interpretation of data; or in writing the manuscript.

Institutional Review Board Statement

The study was conducted according to the guidelines of the Declaration of Helsinki, and approved by the Ethics Committees of ASST Civili Hospital of Brescia on 2 October 2012 (NP1230).

Informed Consent Statement

Informed consent was obtained from all subjects involved in the study.

Data Availability Statement

The data supporting the findings of this study are contained within the contents of this article. The datasets generated during this study will be freely provided by the corresponding author upon request.

Conflicts of Interest

The authors declare no conflict of interest.

References

  1. Azzalin, C.M.; Reichenbach, P.; Khoriauli, L.; Giulotto, E.; Lingner, J. Telomeric repeat containing RNA and RNA surveillance factors at mammalian chromosome ends. Science 2007, 318, 798–801. [Google Scholar] [CrossRef]
  2. Schoeftner, S.; Blasco, M.A. Developmentally regulated transcription of mammalian telomeres by DNA-dependent RNA polymerase II. Nat. Cell Biol. 2008, 10, 228–236. [Google Scholar] [CrossRef] [PubMed]
  3. Chu, H.P.; Cifuentes-Rojas, C.; Kesner, B.; Aeby, E.; Lee, H.-G.; Wei, C.; Oh, H.J.; Boukhali, M.; Haas, W.; Lee, J.T. TERRA RNA Antagonizes ATRX and Protects Telomeres. Cell 2017, 170, 86–101.e16. [Google Scholar] [CrossRef] [Green Version]
  4. Redon, S.; Reichenbach, P.; Lingner, J. The non-coding RNA TERRA is a natural ligand and direct inhibitor of human telomerase. Nucleic Acids Res. 2010, 38, 5797–5806. [Google Scholar] [CrossRef] [Green Version]
  5. Porro, A.; Feuerhahn, S.; Lingner, J. TERRA-reinforced association of LSD1 with MRE11 promotes processing of uncapped telomeres. Cell Rep. 2014, 6, 765–776. [Google Scholar] [CrossRef] [Green Version]
  6. Porro, A.; Feuerhahn, S.; Delafontaine, J.; Riethman, H.; Rougemont, J.; Lingner, J. Functional characterization of the TERRA transcriptome at damaged telomeres. Nat. Commun. 2014, 5, 5379. [Google Scholar] [CrossRef] [PubMed]
  7. Beishline, K.; Vladimirova, O.; Tutton, S.; Wang, Z.; Deng, Z.; Lieberman, P.M. CTCF driven TERRA transcription facilitates completion of telomere DNA replication. Nat. Commun. 2017, 8, 2114. [Google Scholar] [CrossRef] [PubMed]
  8. Cao, H.; Zhai, Y.; Ji, X.; Wang, Y.; Zhao, J.; Xing, J.; An, J.; Ren, T. Noncoding telomeric repeat-containing RNA inhibits the progression of hepatocellular carcinoma by regulating telomerase-mediated telomere length. Cancer Sci. 2020, 111, 2789–2802. [Google Scholar] [CrossRef] [PubMed]
  9. Deng, Z.; Wang, Z.; Xiang, C.; Molczan, A.; Baubet, V.; Conejo-Garcia, J.; Xu, X.; Lieberman, P.M.; Dahmane, N. Formation of telomeric repeat-containing RNA (TERRA) foci in highly proliferating mouse cerebellar neuronal progenitors and medulloblastoma. J. Cell Sci. 2012, 125, 4383–4394. [Google Scholar] [CrossRef] [PubMed] [Green Version]
  10. Gala, K.; Khattar, E. Long non-coding RNAs at work on telomeres: Functions and implications in cancer therapy. Cancer Lett. 2021, 502, 120–132. [Google Scholar] [CrossRef]
  11. Tutton, S.; Azzam, G.A.; Stong, N.; Vladimirova, O.; Wiedmer, A.; Monteith, J.A.; Beishline, K.; Wang, Z.; Deng, Z.; Riethman, H.; et al. Subtelomeric p53 binding prevents accumulation of DNA damage at human telomeres. EMBO J. 2016, 35, 193–207. [Google Scholar] [CrossRef] [PubMed] [Green Version]
  12. Sadhukhan, R.; Chowdhury, P.; Ghosh, S.; Ghosh, U. Expression of Telomere-Associated Proteins is Interdependent to Stabilize Native Telomere Structure and Telomere Dysfunction by G-Quadruplex Ligand Causes TERRA Upregulation. Cell Biochem. Biophys. 2018, 76, 311–319. [Google Scholar] [CrossRef] [PubMed]
  13. Nault, J.C.; Mallet, M.; Pilati, C.; Calderaro, J.; Bioulac-Sage, P.; Laurent, C.; Laurent, A.; Cherqui, D.; Balabaud, C.; Rossi, J.Z. High frequency of telomerase reverse-transcriptase promoter somatic mutations in hepatocellular carcinoma and preneoplastic lesions. Nat. Commun. 2013, 4, 2218. [Google Scholar] [CrossRef] [Green Version]
  14. Cucarull, B.; Tutusaus, A.; Rider, P.; Hernáez-Alsina, T.; Cuño, C.; de Frutos, P.G.; Colell, A.; Marí, M.; Morales, A. Hepatocellular Carcinoma: Molecular Pathogenesis and Therapeutic Advances. Cancers 2022, 14, 621. [Google Scholar] [CrossRef] [PubMed]
  15. Sas, Z.; Cendrowicz, E.; Weinhäuser, I.; Rygiel, T.P. Tumor Microenvironment of Hepatocellular Carcinoma: Challenges and Opportunities for New Treatment Options. Int. J. Mol. Sci. 2022, 23, 3778. [Google Scholar] [CrossRef]
  16. Raffetti, E.; Portolani, N.; Molfino, S.; Mentasti, S.; Baiocchi, G.L.; Magoni, M.; Donato, F. Is survival for hepatocellular carcinoma increasing? A population-based study on survival of hepatocellular carcinoma patients in the 1990s and 2000s. Clin. Res. Hepatol. Gastroenterol. 2021, 45, 101433. [Google Scholar] [CrossRef]
  17. Tian, Y.; Lei, Y.; Fu, Y.; Sun, H.; Wang, J.; Xia, F. Molecular Mechanisms of Resistance to Tyrosine Kinase Inhibitors Associated with Hepatocellular Carcinoma. Curr. Cancer Drug Targets 2022, 22. [Google Scholar] [CrossRef]
  18. Wang, Z.; Deng, Z.; Dahmane, N.; Tsai, K.; Wang, P.; Williams, D.R.; Kossenkov, A.V.; Showe, L.C.; Zhang, R.; Huang, Q.; et al. Telomeric repeat-containing RNA (TERRA) constitutes a nucleoprotein component of extracellular inflammatory exosomes. Proc. Natl. Acad. Sci. USA 2015, 112, E6293–E6300. [Google Scholar] [CrossRef] [Green Version]
  19. Wang, Z.; Lieberman, P.M. The crosstalk of telomere dysfunction and inflammation through cell-free TERRA containing exosomes. RNA Biol. 2016, 13, 690–695. [Google Scholar] [CrossRef] [Green Version]
  20. Grossi, I.; Radeghieri, A.; Paolini, L.; Porrini, V.; Pilotto, A.; Padovani, A.; Marengoni, A.; Barbon, A.; Bellucci, A.; Pizzi, M.; et al. MicroRNA-34a-5p expression in the plasma and in its extracellular vesicle fractions in subjects with Parkinson’s disease: An exploratory study. Int. J. Mol. Med. 2021, 47, 533–546. [Google Scholar] [CrossRef]
  21. Todeschini, P.; Salviato, E.; Paracchini, L.; Ferracin, M.; Petrillo, M.; Zanotti, L.; Tognon, G.; Gambino, A.; Calura, E.; Caratti, G.; et al. Circulating miRNA landscape identifies miR-1246 as promising diagnostic biomarker in high-grade serous ovarian carcinoma: A validation across two independent cohorts. Cancer Lett. 2017, 388, 320–327. [Google Scholar] [CrossRef] [PubMed]
  22. Faranda, T.; Grossi, I.; Manganelli, M.; Marchina, E.; Baiocchi, G.; Portolani, N.; Crosatti, M.; De Petro, G.; Salvi, A. Differential expression profiling of long non-coding RNA GAS5 and miR-126-3p in human cancer cells in response to sorafenib. Sci. Rep. 2019, 9, 9118. [Google Scholar] [CrossRef] [PubMed] [Green Version]
  23. Abeni, E.; Salvi, A.; Marchina, E.; Traversa, M.; Arici, B.; De Petro, G. Sorafenib induces variations of the DNA methylome in HA22T/VGH human hepatocellular carcinoma-derived cells. Int. J. Oncol. 2017, 51, 128–144. [Google Scholar] [CrossRef] [PubMed] [Green Version]
  24. Sampl, S.; Pramhas, S.; Stern, C.; Preusser, M.; Marosi, C.; Holzmann, K. Expression of telomeres in astrocytoma WHO grade 2 to 4: TERRA level correlates with telomere length, telomerase activity, and advanced clinical grade. Transl. Oncol. 2012, 5, 56–65. [Google Scholar] [CrossRef] [Green Version]
  25. Oh, B.K.; Keo, P.; Bae, J.; Ko, J.H.; Choi, J.S. Variable TERRA abundance and stability in cervical cancer cells. Int. J. Mol. Med. 2017, 39, 1597–1604. [Google Scholar] [CrossRef]
  26. Vitelli, V.; Falvo, P.; Nergadze, S.G.; Santagostino, M.; Khoriauli, L.; Pellanda, P.; Bertino, G.; Occhini, A.; Benazzo, M.; Morbini, P.; et al. Telomeric Repeat-Containing RNAs (TERRA) Decrease in Squamous Cell Carcinoma of the Head and Neck Is Associated with Worsened Clinical Outcome. Int. J. Mol. Sci. 2018, 19, 274. [Google Scholar] [CrossRef] [Green Version]
  27. Bae, S.U.; Park, W.J.; Jeong, W.K.; Baek, S.K.; Lee, H.W.; Lee, J.H. Prognostic impact of telomeric repeat-containing RNA expression on long-term oncologic outcomes in colorectal cancer. Medicine 2019, 98, e14932. [Google Scholar] [CrossRef]
  28. Adishesh, M.; Alnafakh, R.; Baird, D.M.; Jones, R.E.; Simon, S.; Button, L.; Kamal, A.M.; Kirwan, J.; Bridget Decruze, S.; Drury, J.; et al. Human Endometrial Carcinogenesis Is Associated with Significant Reduction in Long Non-Coding RNA, TERRA. Int. J. Mol. Sci. 2020, 21, 8686. [Google Scholar] [CrossRef]
  29. Novakovic, S.; Hocevar, M.; Zgajnar, J.; Besic, N.; Stegel, V. Detection of telomerase RNA in the plasma of patients with breast cancer, malignant melanoma or thyroid cancer. Oncol. Rep. 2004, 11, 245–252. [Google Scholar] [CrossRef]
  30. Diman, A.; Boros, J.; Poulain, F.; Rodriguez, J.; Purnelle, M.; Episkopou, H.; Bertrand, L.; Francaux, M.; Deldicque, L.; Decottignies, A. Nuclear respiratory factor 1 and endurance exercise promote human telomere transcription. Sci. Adv. 2016, 2, e1600031. [Google Scholar] [CrossRef] [Green Version]
  31. Montero, J.J.; López De Silanes, I.; Granã, O.; Blasco, M.A. Telomeric RNAs are essential to maintain telomeres. Nat. Commun. 2016, 7, 12537. [Google Scholar] [CrossRef] [PubMed] [Green Version]
  32. Cervello, M.; Bachvarov, D.; Lampiasi, N.; Cusimano, A.; Azzolina, A.; McCubrey, J.A.; Montalto, G. Molecular mechanisms of sorafenib action in liver cancer cells. Cell Cycle 2012, 11, 2843–2855. [Google Scholar] [CrossRef] [PubMed] [Green Version]
  33. Notarangelo, M.; Zucal, C.; Modelska, A.; Pesce, I.; Scarduelli, G.; Potrich, C.; Lunelli, L.; Pederzolli, C.; Pavan, P.; la Marca, G.; et al. Ultrasensitive detection of cancer biomarkers by nickel-based isolation of polydisperse extracellular vesicles from blood. EBioMedicine 2019, 43, 114–126. [Google Scholar] [CrossRef] [PubMed] [Green Version]
  34. Chomczynski, P.; Sacchi, N. Single-step method of RNA isolation by acid guanidinium thiocyanate-phenol-chloroform extraction. Anal. Biochem. 1987, 162, 156–159. [Google Scholar] [CrossRef]
  35. Feretzaki, M.; Lingner, J. A practical qPCR approach to detect TERRA, the elusive telomeric repeat-containing RNA. Methods 2017, 114, 39–45. [Google Scholar] [CrossRef]
  36. Livak, K.J.; Schmittgen, T.D. Analysis of relative gene expression data using real-time quantitative PCR and the 2(-Delta Delta C(T)) Method. Methods 2001, 25, 402–408. [Google Scholar] [CrossRef]
Figure 1. Tissue expression of TERRA. (a) TERRA relative quantification mean comparison between PT and HCC. Wilcoxon test was used. (b) TERRA fold-change. Histograms represent R-values and bars upper and lower limits. Histograms are ordered by increasing R-values. The corresponding cases are listed on x axis. Upper and lower dot lines define the range of gene expression variation. (c) ROC curve analysis of TERRA in tissues. Sensitivity: percent of correctly classified HCC patients. Specificity: percent of correctly classified non-HCC. AUC: area under the ROC curve; CI: confidence interval. * p < 0.05.
Ijms 23 06183 g001
Figure 2. Tissue expression of TERC. (a) TERC relative quantification mean comparison between PT and HCC. Wilcoxon test was used. (b) TERC fold-change. Histograms represent R-values and bars upper and lower limits. Histograms are ordered by increasing R-values. The corresponding cases are listed on x axis. Upper and lower dot lines define the range of gene expression variation. (c) ROC curve analysis of TERC to discriminate HCC from normal tissue. AUC: area under the ROC curve’ CI: confidence interval.
Ijms 23 06183 g002
Figure 3. Tissue expression of TERT mRNA. (a) TERT mRNA relative quantification mean comparison between PT and HCC. Wilcoxon test was used. (b) TERT mRNA fold-change. Histograms represent R-values and bars upper and lower limits. Histograms are ordered by increasing R-values. The corresponding cases are listed on x axis. Upper and lower dot lines define the range of gene expression variation. (c) ROC curve analysis to discriminate HCC from normal tissue. AUC: area under the ROC curve; CI: confidence interval. * p < 0.05; ** p < 0.01.
Ijms 23 06183 g003
Figure 4. Plasma levels of TERRA. (ac) TERRA levels in terms of Ct in plasma of healthy (C) and HCC individuals. TERRA expression from different telomers was analyzed using specific primers (TERRA 1 = hTel 1_2_10_13q; TERRA 2 = hTel 15q; TERRA 3 = hTel XpYp). Parametric unpaired two-tailed t-test. (d) ROC curve analysis of TERRA to discriminate HCC from healthy individuals. * p < 0.05, ** p < 0.01, *** p < 0.001.
Ijms 23 06183 g004
Figure 5. Plasma levels of TERC. (a) TERC levels in terms of copies/µL in plasma of control subjects (C) and HCC patients. Unpaired t-test was used. (b) ROC curve analysis of TERC to discriminate HCC from healthy individuals. ** p < 0.01; *** p < 0.001.
Ijms 23 06183 g005
Figure 6. Intra- and extracellular expression of TERRA and telomerase transcripts in HCC cell lines. The expression levels of TERRA (a), TERC (b) and TERT mRNA (c) were measured in HA22T/VGH and SKHep1C3 untreated, resistant to sorafenib (SR) and treated with 15 µM sorafenib. The levels of TERRA (d) and TERC (e) were measured in EVs from HA22T/VGH and SKHep1C3 cells untreated, resistant to sorafenib (SR) and treated with 15 µM sorafenib. As described in Materials and Methods, gene expression level was normalized to the number of particles released per each biological sample, respectively. The histograms represent the mean values of 2 experiments, bars are ± SEM. Unpaired two tailed t-test; * p < 0.05, ** p < 0.01, *** p < 0.001.
Ijms 23 06183 g006
Table 1. Diagnostic performance of TERRA in HCC tissues.
TARGETSensitivitySpecificityAUCSE95% CIp-Value
TERRA180%64%0.7060.0750.560–0.8260.0064 **
TERRA284%52%0.6980.0740.551–0.8190.008 **
TERRA384%52%0.7120.0720.567–0.8310.0036 **
TERRA1+TERRA252%80%0.6860.0750.540–0.8100.0166 *
TERRA1+TERRA352%80%0.710.0720.565–0.8300.0233 *
TERRA2+TERRA344%80%0.7120.0720.567–0.8310.0149 *
TERRA1+TERRA2+TERRA344%80%0.7090.0730.563–0.8290.0382 *
p < 0.05; ** p < 0.01.
Table 2. Diagnostic performance of circulating TERRA in plasma.
TARGETSensitivitySpecificityAUCSE95% CIp-Value
TERRA160%100%0.7470.0790.604–0.8590.001 **
TERRA252%92%0.6220.0840.474–0.7560.146
TERRA356%88%0.6860.080.540–0.8100.02 *
TERRA1+TERRA264%100%0.7420.0810.599–0.8560.002 **
TERRA1+TERRA364%92%0.7630.0740.622–0,8720.0004 ***
TERRA2+TERRA352%96%0.6480.0830.500–0.7780.07
TERRA1+TERRA2+TERRA360%100%0.7650.0740.624–0.8730.0004 ***
* p < 0.05; ** p < 0.01; *** p < 0.001.
Publisher’s Note: MDPI stays neutral with regard to jurisdictional claims in published maps and institutional affiliations.

