
Determination of IgG1 and IgG3 SARS-CoV-2 Spike Protein and Nucleocapsid Binding—Who Is Binding Who and Why?

 ,
,
Abstract
:
1. Introduction
2. Results
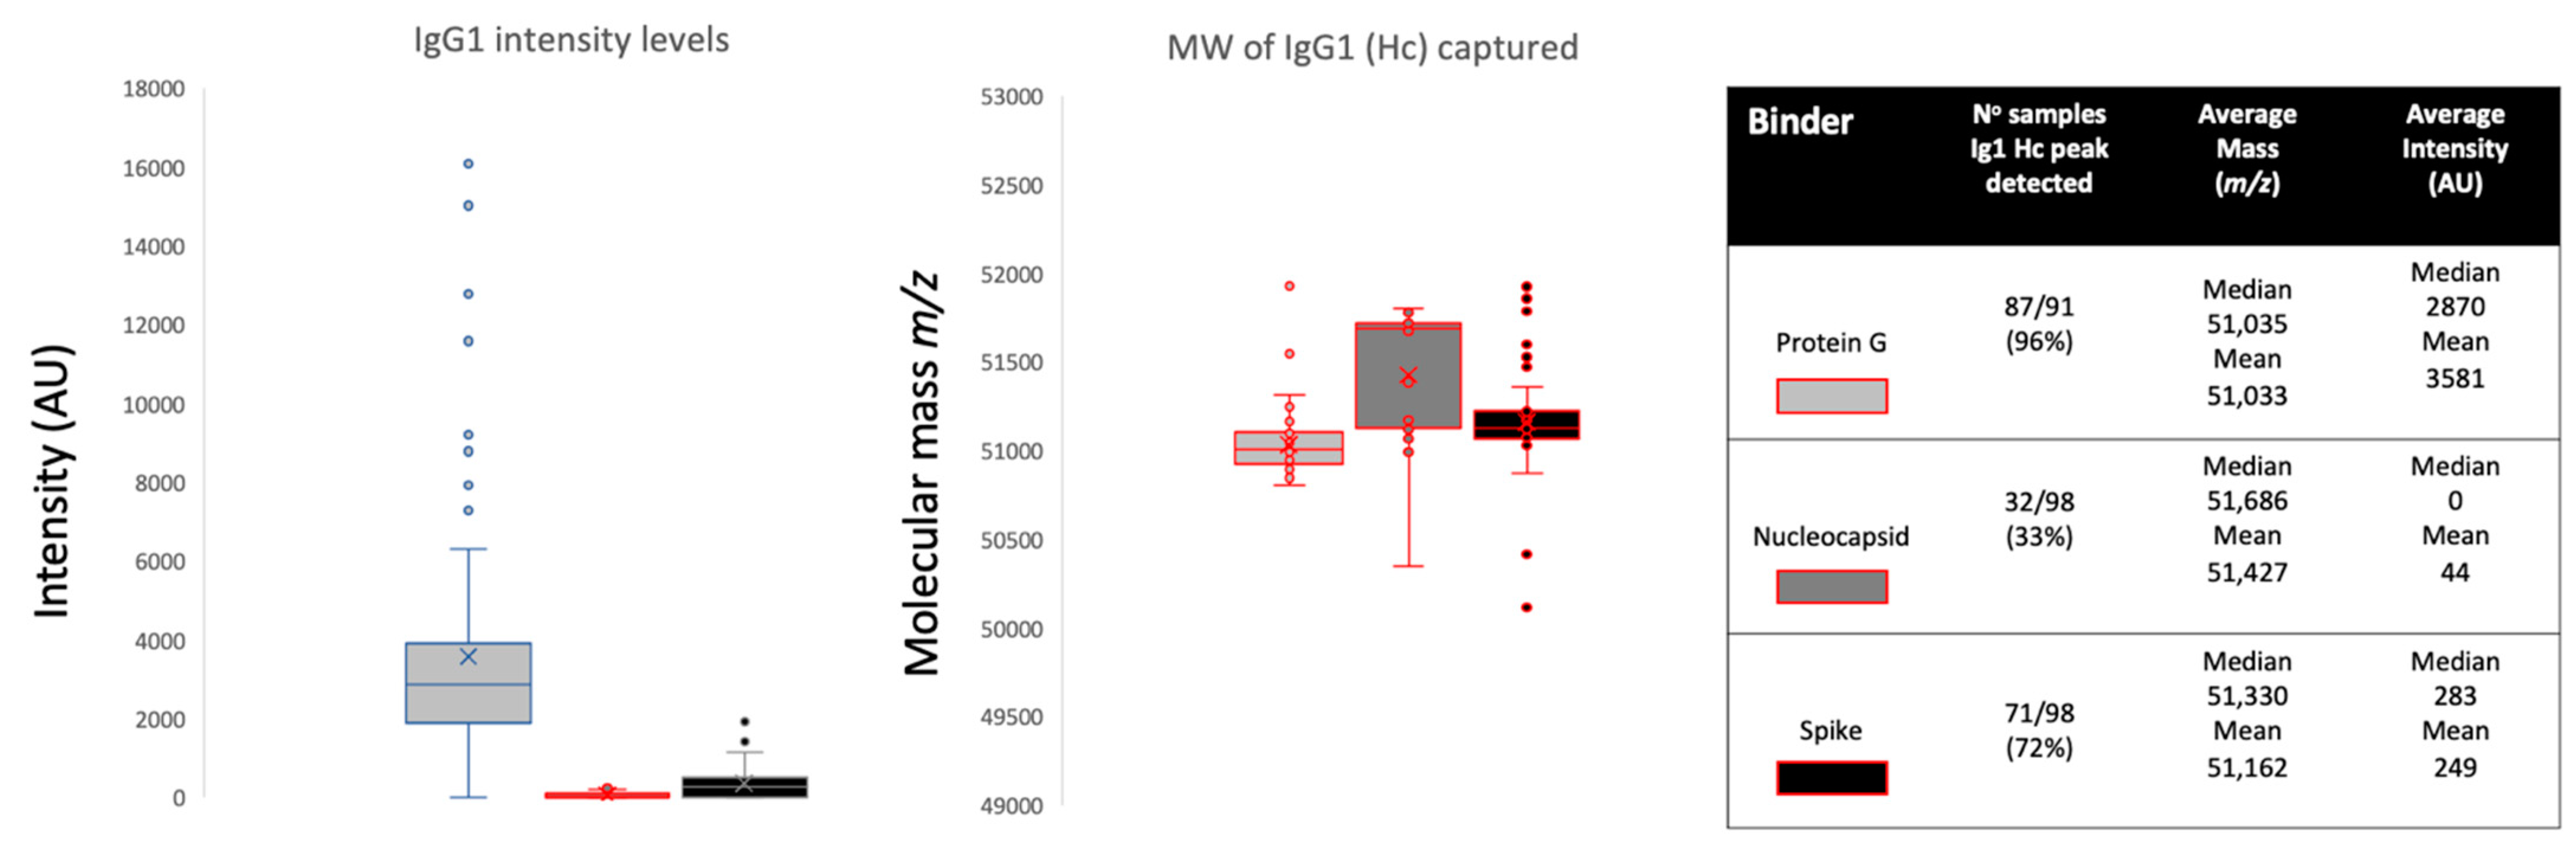
2.1. IgG1 Levels and Molecular Mass
2.2. IgG3 Levels and Molecular Mass
3. Discussion
4. Materials and Methods
4.1. Samples
4.2. Antigen-Coupled Magnetic Beads
4.3. Semi-Automated Magnetic Bead Capture Processing
4.4. Pre-Processing of the Magnetic Beads
4.5. Sample Processing and Binding Fraction Elution from the Magnetic Beads
4.6. Sample Analysis by MALDI-ToF Mass Spectrometry
4.7. Spectral Data Processing
4.8. Statistical Analysis
5. Conclusions
Supplementary Materials
Author Contributions
Funding
Institutional Review Board Statement
Informed Consent Statement
Data Availability Statement
Acknowledgments
Conflicts of Interest
Abbreviations
| AGE | Advanced glycation end products |
| ARDS | Acute respiratory distress syndrome |
| Asn | Asparagine N |
| AU | Arbitrary units |
| DPBS | Dulbecco’s phosphate-buffered saline |
| ECLIA | Electrochemiluminescence immunoassay |
| Fc | Fragment crystallizable |
| Hc | Heavy chain |
| HCWs | Health care workers |
| HSA | Human serum albumin |
| Ig | Immunoglobulin |
| MALDI-ToF | Matrix-assisted laser desorption ionization–time of flight |
| PCR | Polymerase chain reaction |
| RBD | Receptor binding domain |
| RSV | Respiratory syncytial virus |
| SA | Sinapinic acid |
| SDS-PAGE | Sodium dodecyl sulphate-polyacrylamide gel electrophoresis |
| TCEP | Tris(2-carboxyethyl)phosphine |
References
- Welker, C.; Huang, J.; Gil, I.J.N.; Ramakrishna, H. 2021 Acute respiratory distress syndrome update, with coronavirus disease 2019 focus. J. Cardiothorac. Vasc. Anesth. 2022, 36, 1188–1195. [Google Scholar] [CrossRef]
- Khadke, S.; Ahmed, N.; Ahmed, N.; Ratts, R.; Raju, S.; Gallogly, M.; De Lima, M.; Sohail, M.R. Harnessing the immune system to overcome cytokine storm and reduce viral load in COVID-19: A review of the phases of illness and therapeutic agents. Virol. J. 2020, 17, 154. [Google Scholar] [CrossRef]
- Cao, X. COVID-19: Immunopathology and its implications for therapy. Nat. Rev. Immunol. 2020, 20, 269–270. [Google Scholar] [CrossRef] [Green Version]
- Wang, W.; Xu, Y.; Gao, R.; Lu, R.; Han, K.; Wu, G.; Tan, W. Detection of SARS-CoV-2 in different types of clinical specimens. JAMA 2020, 323, 1843–1844. [Google Scholar] [CrossRef] [Green Version]
- Azkur, A.K.; Akdis, M.; Azkur, D.; Sokolowska, M.; Van De Veen, W.; Brüggen, M.-C.; O’Mahony, L.; Gao, Y.; Nadeau, K.; Akdis, C.A. Immune response to SARS-CoV-2 and mechanisms of immunopathological changes in COVID-19. Allergy 2020, 75, 1564–1581. [Google Scholar] [CrossRef]
- Post, N.; Eddy, D.; Huntley, C.; van Schalkwyk, M.C.; Shrotri, M.; Leeman, D.; Rigby, S.; Williams, S.V.; Bermingham, W.H.; Kellam, P.; et al. Antibody response to SARS-CoV-2 infection in humans: A systematic review. PLoS ONE 2020, 15, e0244126. [Google Scholar] [CrossRef]
- Galipeau, Y.; Greig, M.; Liu, G.; Driedger, M.; Langlois, M.A. Humoral responses and serological assays in SARS-CoV-2 infections. Front. Immunol. 2020, 11, 3382. [Google Scholar] [CrossRef]
- Voss, C.; Esmail, S.; Liu, X.; Knauer, M.J.; Ackloo, S.; Kaneko, T.; Lowes, L.E.; Stogios, P.J.; Seitova, A.; Hutchinson, A.; et al. Epitope-specific antibody responses differentiate COVID-19 outcomes and variants of concern. JCI Insight 2021, 6, e148855. [Google Scholar] [CrossRef]
- Robbiani, D.F.; Gaebler, C.; Muecksch, F.; Lorenzi, J.C.C.; Wang, Z.; Cho, A.; Agudelo, M.; Barnes, C.O.; Gazumyan, A.; Finkin, S.; et al. Convergent antibody responses to SARS-CoV-2 in convalescent individuals. Nature 2020, 584, 437–442. [Google Scholar] [CrossRef]
- Suthar, M.S.; Zimmerman, M.; Kauffman, R.; Mantus, G.; Linderman, S.; Vanderheiden, A.; Nyhoff, L.; Davis, C.; Adekunle, S.; Affer, M.; et al. Rapid generation of neutralizing antibody responses in COVID-19 patients. Cell Rep. Med. 2020, 1, 100040. [Google Scholar] [CrossRef]
- Atyeo, C.; Fischinger, S.; Zohar, T.; Slein, M.D.; Burke, J.; Loos, C.; McCulloch, D.J.; Newman, K.L.; Wolf, C.; Yu, J.; et al. Distinct early serological signatures track with SARS-CoV-2 survival. Immunity 2020, 53, 524–532. [Google Scholar] [CrossRef]
- Yates, J.L.; Ehrbar, D.J.; Hunt, D.T.; Girardin, R.C.; Dupuis, A.P., II; Payne, A.F.; Sowizral, M.; Varney, S.; Kulas, K.E.; Demarest, V.L.; et al. Serological analysis reveals an imbalanced IgG subclass composition associated with COVID-19 disease severity. Cell Rep. Med. 2021, 2, 100329. [Google Scholar] [CrossRef]
- Lucas, C.L.; Kuehn, H.S.; Zhao, F.; Niemela, J.E.; Deenick, E.K.; Palendira, U.; Avery, D.T.; Moens, L.; Cannons, J.L.; Biancalana, M.; et al. Dominant-activating germline mutations in the gene encoding the PI(3)K catalytic subunit p110δ result in T cell senescence and human immunodeficiency. Nat. Immunol. 2014, 15, 88–97. [Google Scholar] [CrossRef] [Green Version]
- Walker, M.R.; Eltahla, A.A.; Mina, M.M.; Li, H.; Lloyd, A.R.; Bull, R.A. Envelope-specific IgG3 and IgG1 responses are associated with clearance of acute hepatitis C virus infection. Viruses 2020, 12, 75. [Google Scholar] [CrossRef] [Green Version]
- Iles, J.; Zmuidinaite, R.; Sadee, C.; Gardiner, A.; Lacey, J.; Harding, S.; Ule, J.; Roblett, D.; Heeney, J.; Baxendale, H.; et al. SARS-CoV-2 spike protein binding of glycated serum albumin—Its potential role in the pathogenesis of the COVID-19 clinical syndromes and bias towards individuals with pre-diabetes/type 2 diabetes and metabolic diseases. Int. J. Mol. Sci. 2022, 23, 4126. [Google Scholar] [CrossRef]
- Pampati, P.K.; Suravajjala, S.; Dain, J.A. Monitoring nonenzymatic glycation of human immunoglobulin G by methylglyoxal and glyoxal: A spectroscopic study. Anal. Biochem. 2011, 408, 59–63. [Google Scholar] [CrossRef] [Green Version]
- Hoepel, W.; Chen, H.J.; Allahverdiyeva, S.; Manz, X.; Aman, J.; Bonta, P.; Brouwer, P.; de Taeye, S.; Caniels, T.; van der Straten, K.; et al. Anti-SARS-CoV-2 IgG from severely ill COVID-19 patients promotes macrophage hyper-inflammatory responses. BioRxiv 2020. [Google Scholar] [CrossRef]
- Larsen, M.D.; de Graaf, E.L.; Sonneveld, M.E.; Plomp, H.R.; Nouta, J.; Hoepel, W.; Chen, H.J.; Linty, F.; Visser, R.; Brinkhaus, M.; et al. Afucosylated IgG characterizes enveloped viral responses and correlates with COVID-19 severity. Science 2021, 371, eabc8378. [Google Scholar] [CrossRef]
- Chakraborty, S.; Gonzalez, J.; Edwards, K.; Mallajosyula, V.; Buzzanco, A.S.; Sherwood, R.; Buffone, C.; Kathale, N.; Providenza, S.; Xie, M.M.; et al. Proinflammatory IgG Fc structures in patients with severe COVID-19. Nat. Immunol. 2021, 22, 67–73. [Google Scholar] [CrossRef]
- Plomp, R.; Dekkers, G.; Rombouts, Y.; Visser, R.; Koeleman, C.A.; Lageveen-Kammeijer, G.; Jansen, B.C.; Rispens, T.; Hensbergen, P.; Vidarsson, G.; et al. Hinge-region O-glycosylation of human immunoglobulin G3 (IgG3). Mol. Cell. Proteom. 2015, 14, 1373–1384. [Google Scholar] [CrossRef] [Green Version]
- Kao, D.; Lux, A.; Schaffert, A.; Lang, R.; Altmann, F.; Nimmerjahn, F. IgG subclass and vaccination stimulus determine changes in antigen specific antibody glycosylation in mice. Eur. J. Immunol. 2017, 47, 2070–2079. [Google Scholar] [CrossRef] [PubMed] [Green Version]
- De Haan, N.; Reiding, K.R.; Krištić, J.; Ederveen, A.H.; Lauc, G.; Wuhrer, M. The N-glycosylation of mouse immunoglobulin G (IgG)-fragment crystallizable differs between IgG subclasses and strains. Front. Immunol. 2017, 8, 608. [Google Scholar] [CrossRef] [PubMed]
- Zaytseva, O.O.; Jansen, B.C.; Haniæ, M.; Mrèela, M.; Razdorov, G.; Stojkoviæ, R.; Erhardt, J.; Brizić, I.; Jonjić, S.; Pezer, M.; et al. MIgGGly (mouse IgG glycosylation analysis)—A high-throughput method for studying Fc-linked IgG N-glycosylation in mice with nanoU-PLC-ESI-MS. Sci. Rep. 2018, 8, 13688. [Google Scholar] [CrossRef] [PubMed]
- Wieczorek, M.; Braicu, E.I.; Oliveira-Ferrer, L.; Sehouli, J.; Blanchard, V. Immunoglobulin G subclass-specific glycosylation changes in primary epithelial ovarian cancer. Front. Immunol. 2020, 11, 654. [Google Scholar] [CrossRef]
- Costa, L.B.; Perez, L.G.; Palmeira, V.A.; Macedo e Cordeiro, T.; Ribeiro, V.T.; Lanza, K.; Silva, A.C.S.E. Insights on SARS-CoV-2 molecular interactions with the renin-angiotensin system. Front. Cell Dev. Biol. 2020, 8, 559841. [Google Scholar] [CrossRef]
- Sood, S.; Aggarwal, V.; Aggarwal, D.; Upadhyay, S.K.; Sak, K.; Tuli, H.S.; Kumar, M.; Kumar, J.; Talwar, S. COVID-19 Pandemic: From molecular biology, pathogenesis, detection, and treatment to global societal impact. Curr. Pharmacol. Rep. 2020, 6, 212–227. [Google Scholar] [CrossRef]
- Castillo-Olivares, J.; Wells, D.A.; Ferrari, M.; Chan, A.; Smith, P.; Nadesalingam, A.; Paloniemi, M.; Carnell, G.; Ohlendorf, L.; Cantoni, D.; et al. Towards internationally standardised humoral immune correlates of protection from SARS-CoV-2 infection and COVID-19 disease. medRxiv 2021. [Google Scholar] [CrossRef]
- Song, W.; Gui, M.; Wang, X.; Xiang, Y. Cryo-EM structure of the SARS coronavirus spike glycoprotein in complex with its host cell receptor ACE2. PLoS Pathog. 2018, 14, e1007236. [Google Scholar] [CrossRef]
- Carnell, G.W.; Ciazynska, K.A.; Wells, D.A.; Xiong, X.; Aguinam, E.T.; McLaughlin, S.H.; Mallery, D.; Ebrahimi, S.; Ceron-Gutierrez, L.; Asbach, B.; et al. SARS-CoV-2 spike protein stabilized in the closed state induces potent neutralizing responses. J. Virol. 2021, 95, e00203-21. [Google Scholar] [CrossRef]
- Strohalm, M.; Kavan, D.; Novák, P.; Volný, M.; Havlíček, V. mMass 3: A cross-platform software environment for precise analysis of mass spectrometric data. Anal. Chem. 2010, 82, 4648–4651. [Google Scholar] [CrossRef]


 , nucleocapsid
  and prefusion complete spike protein
  . Further delineation is done by sample infection status: blue represents data from SARS-CoV-2 sero-negative HCWs, orange from SARS-CoV-2 sero-positive HCWs having recovered from mild symptoms and red sample data from convalescent patients recovering from COVID-19 ARDS.
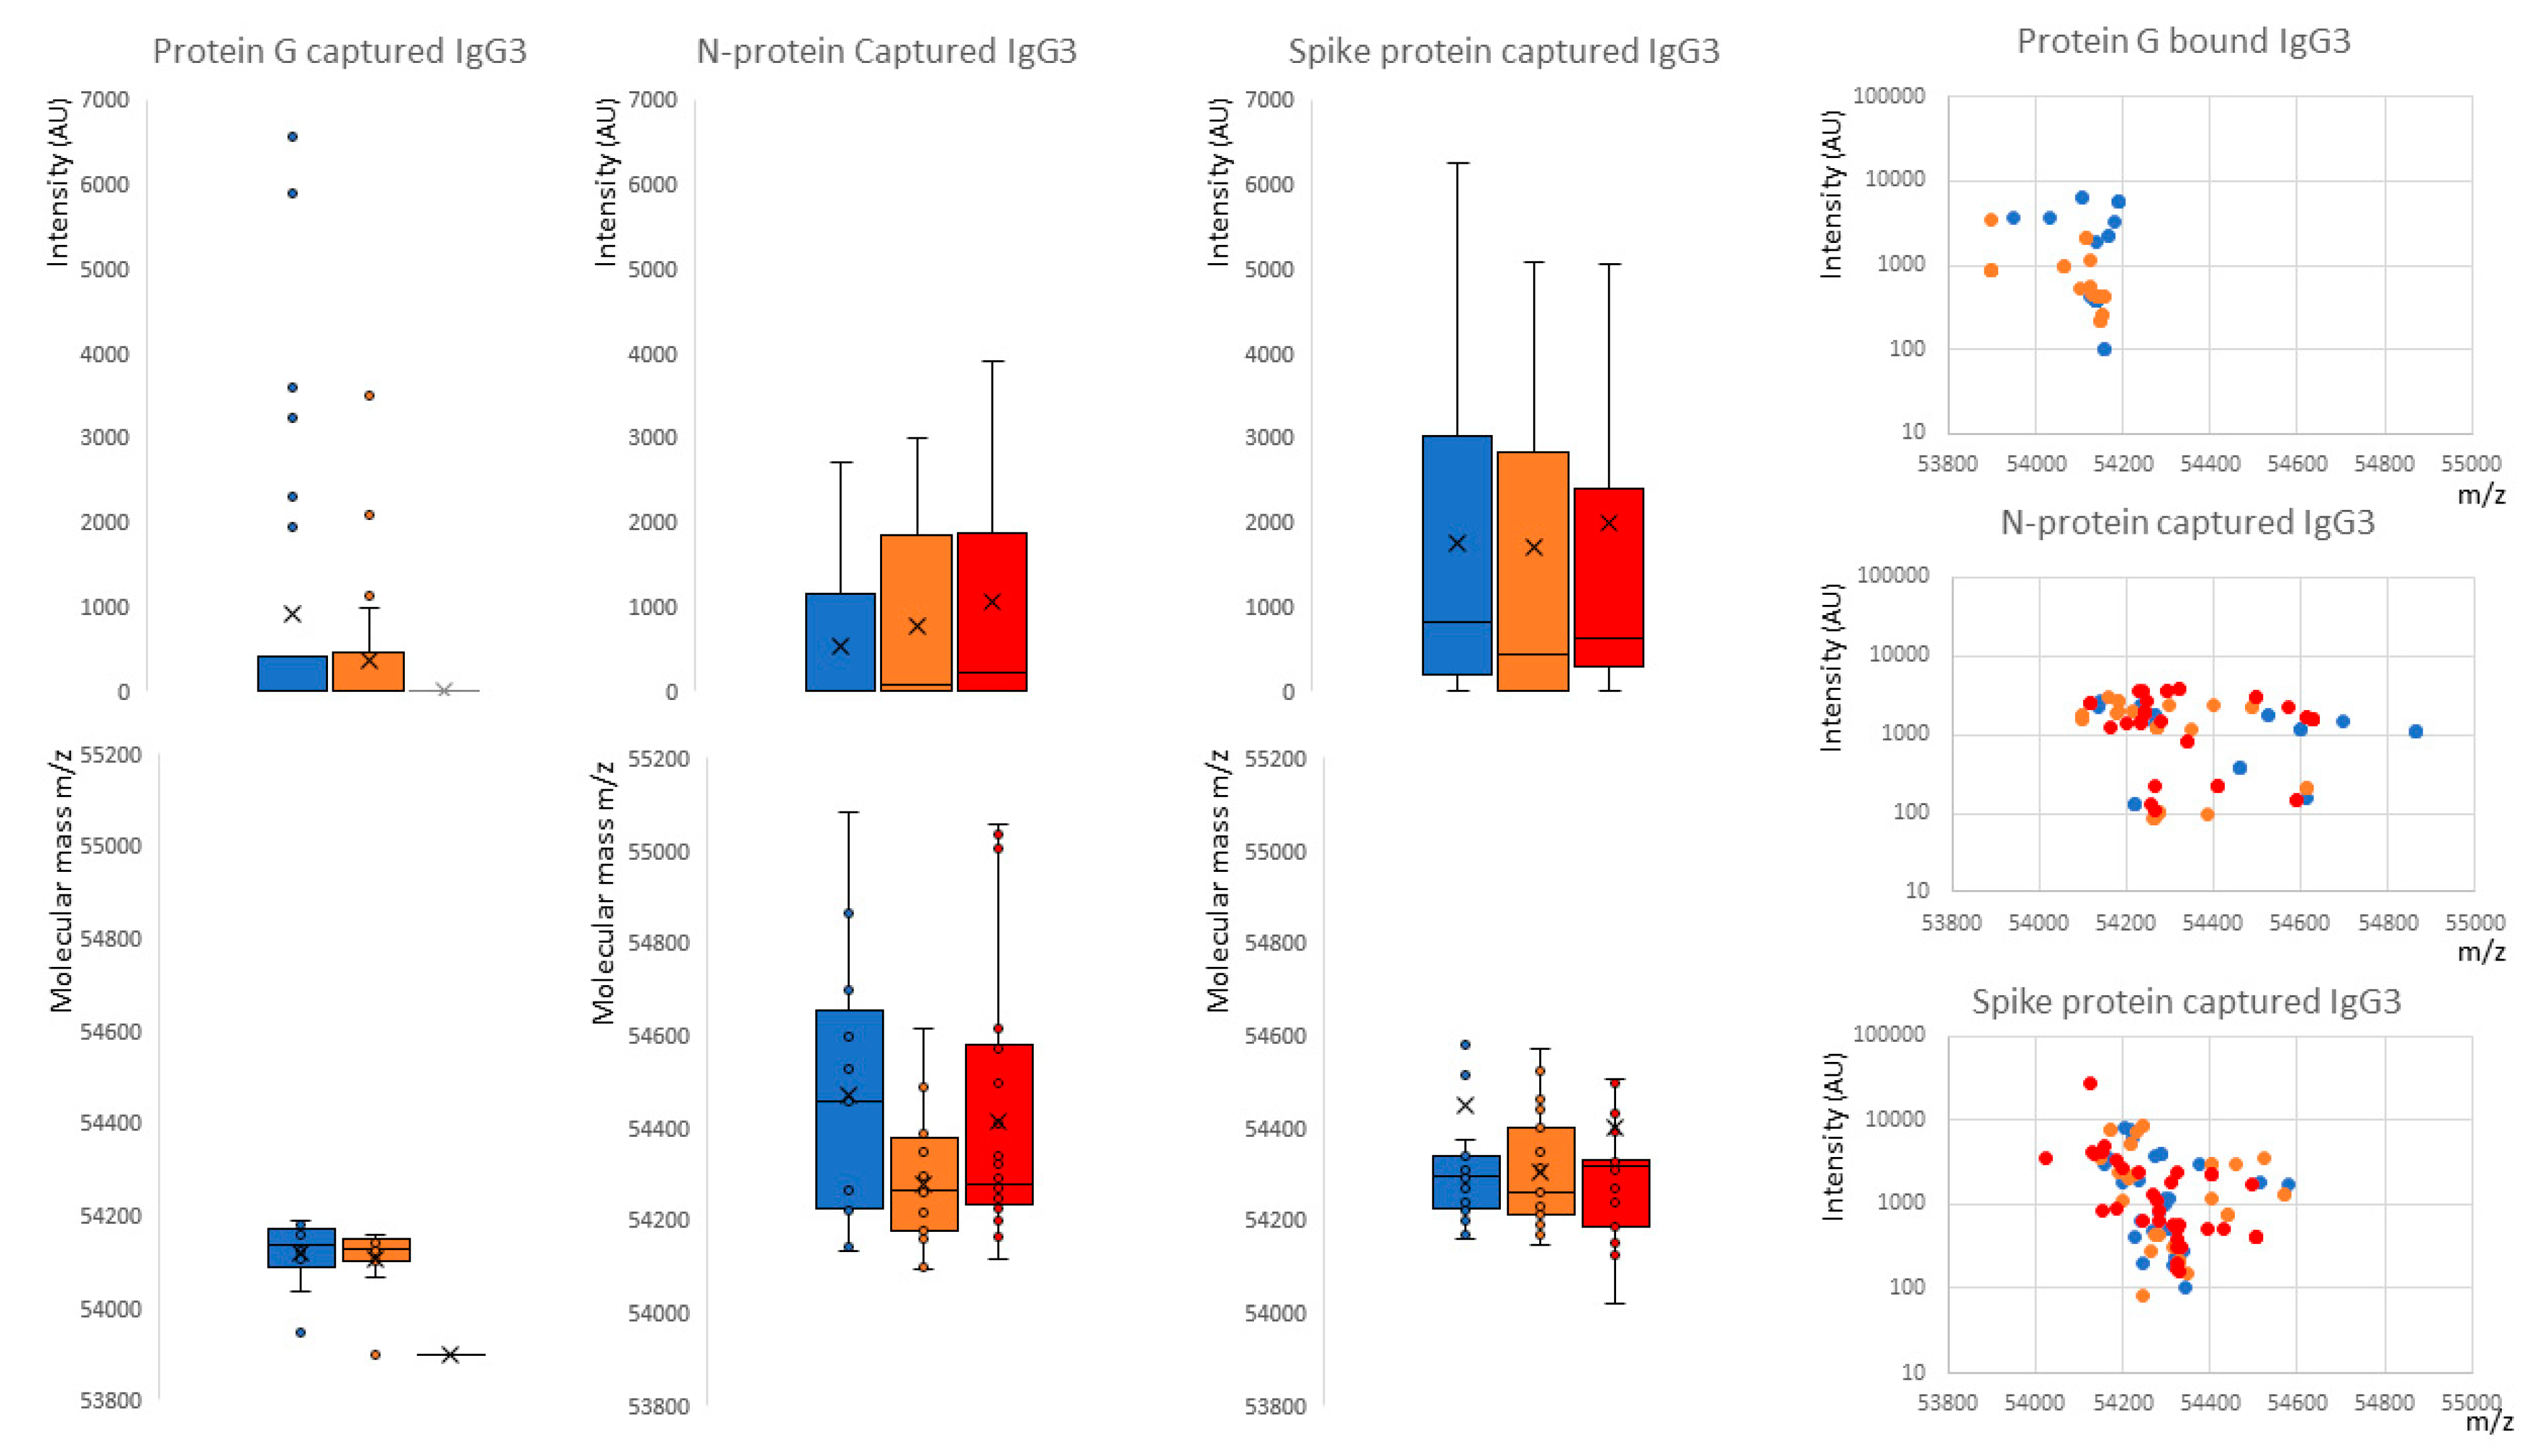
, nucleocapsid and prefusion complete spike protein . Further delineation is done by sample infection status: blue represents data from SARS-CoV-2 sero-negative HCWs, orange from SARS-CoV-2 sero-positive HCWs having recovered from mild symptoms and red sample data from convalescent patients recovering from COVID-19 ARDS.
. Further delineation is done by sample infection status: blue represents data from SARS-CoV-2 sero-negative HCWs, orange from SARS-CoV-2 sero-positive HCWs having recovered from mild symptoms and red sample data from convalescent patients recovering from COVID-19 ARDS.
, nucleocapsid and prefusion complete spike protein . Further delineation is done by sample infection status: blue represents data from SARS-CoV-2 sero-negative HCWs, orange from SARS-CoV-2 sero-positive HCWs having recovered from mild symptoms and red sample data from convalescent patients recovering from COVID-19 ARDS.


| IgG1 | IgG2 | IgG3 | IgG4 | |
|---|---|---|---|---|
| Relative Serum abundance | 43–75% | 16–48% | 1.7–7.5% | 0.8–11.7% |
| Mean adult serum level (g/L) | 6.98 g/L | 3.8 g/L | 0.51 g/L | 0.56 g/L |
| Half-life (days) | 21 | 21 | 7 to 21 | 21 |
| Responses to: Protein | ++ | +/− | ++ | ++ |
| Polysaccharides | + | +++ | +/− | +/− |
| Allergens | + | (−) | (−) | ++ |
| Total mass * | 146 kDa | 146 kDa | 170 kDa | 146 kDa |
| Average observed Kappa | 23 kDa | |||
| Average observed Lambda | 24 kDa | |||
| Average observed Heavy chain | 51 kDa | 51 kDa | 56 kDa | 49 kDa |
| Heavy chain N-linked Glyc sites | 1 | 1 | 2 | 1 |
| Heavy chain O-linked Glyc sites | 0 | 0 | 3 | 0 |
| Amino acids in hinge region | 15 | 12 | 62 | 12 |
| Inter-chain disulphide | 2 | 4 | 11 | 2 |
| C1q binding | ++ | + | +++ | − |
| Receptors binding: | ||||
| Fcy-RI | +++ | − | +++ | + |
| Fcy-RIIa | ++ | +/− | ++ | +/− |
| Fcy-RIIb/c | ++ | +/− | ++ | ++ |
| Fcy-RIIIa | + | +/− | +++ | +/− |
| Fcy-RIIIb | +/− | +/− | + | − |
| FcRn | +++ | +++ | ++/+++ | +++ |
| Placental transfer | +++ | ++ | ++/+++ | + |
| Protein G binding | ++ | ++ | ++ | + |
| Protein A binding | ++ | ++ | − | ++ |
Publisher’s Note: MDPI stays neutral with regard to jurisdictional claims in published maps and institutional affiliations. |
© 2022 by the authors. Licensee MDPI, Basel, Switzerland. This article is an open access article distributed under the terms and conditions of the Creative Commons Attribution (CC BY) license (https://creativecommons.org/licenses/by/4.0/).
Share and Cite
Iles, J.K.; Zmuidinaite, R.; Sadee, C.; Gardiner, A.; Lacey, J.; Harding, S.; Wallis, G.; Patel, R.; Roblett, D.; Heeney, J.; et al. Determination of IgG1 and IgG3 SARS-CoV-2 Spike Protein and Nucleocapsid Binding—Who Is Binding Who and Why? Int. J. Mol. Sci. 2022, 23, 6050. https://doi.org/10.3390/ijms23116050
Iles JK, Zmuidinaite R, Sadee C, Gardiner A, Lacey J, Harding S, Wallis G, Patel R, Roblett D, Heeney J, et al. Determination of IgG1 and IgG3 SARS-CoV-2 Spike Protein and Nucleocapsid Binding—Who Is Binding Who and Why? International Journal of Molecular Sciences. 2022; 23(11):6050. https://doi.org/10.3390/ijms23116050
Chicago/Turabian StyleIles, Jason K., Raminta Zmuidinaite, Christoph Sadee, Anna Gardiner, Jonathan Lacey, Stephen Harding, Gregg Wallis, Roshani Patel, Debra Roblett, Jonathan Heeney, and et al. 2022. "Determination of IgG1 and IgG3 SARS-CoV-2 Spike Protein and Nucleocapsid Binding—Who Is Binding Who and Why?" International Journal of Molecular Sciences 23, no. 11: 6050. https://doi.org/10.3390/ijms23116050
APA StyleIles, J. K., Zmuidinaite, R., Sadee, C., Gardiner, A., Lacey, J., Harding, S., Wallis, G., Patel, R., Roblett, D., Heeney, J., Baxendale, H., & Iles, R. K. (2022). Determination of IgG1 and IgG3 SARS-CoV-2 Spike Protein and Nucleocapsid Binding—Who Is Binding Who and Why? International Journal of Molecular Sciences, 23(11), 6050. https://doi.org/10.3390/ijms23116050