
Quantification of Low Amounts of Zoledronic Acid by HPLC-ESI-MS Analysis: Method Development and Validation

 ,
,  ,
,  and
and
Abstract
:1. Introduction
2. Materials and Methods
2.1. Reagents
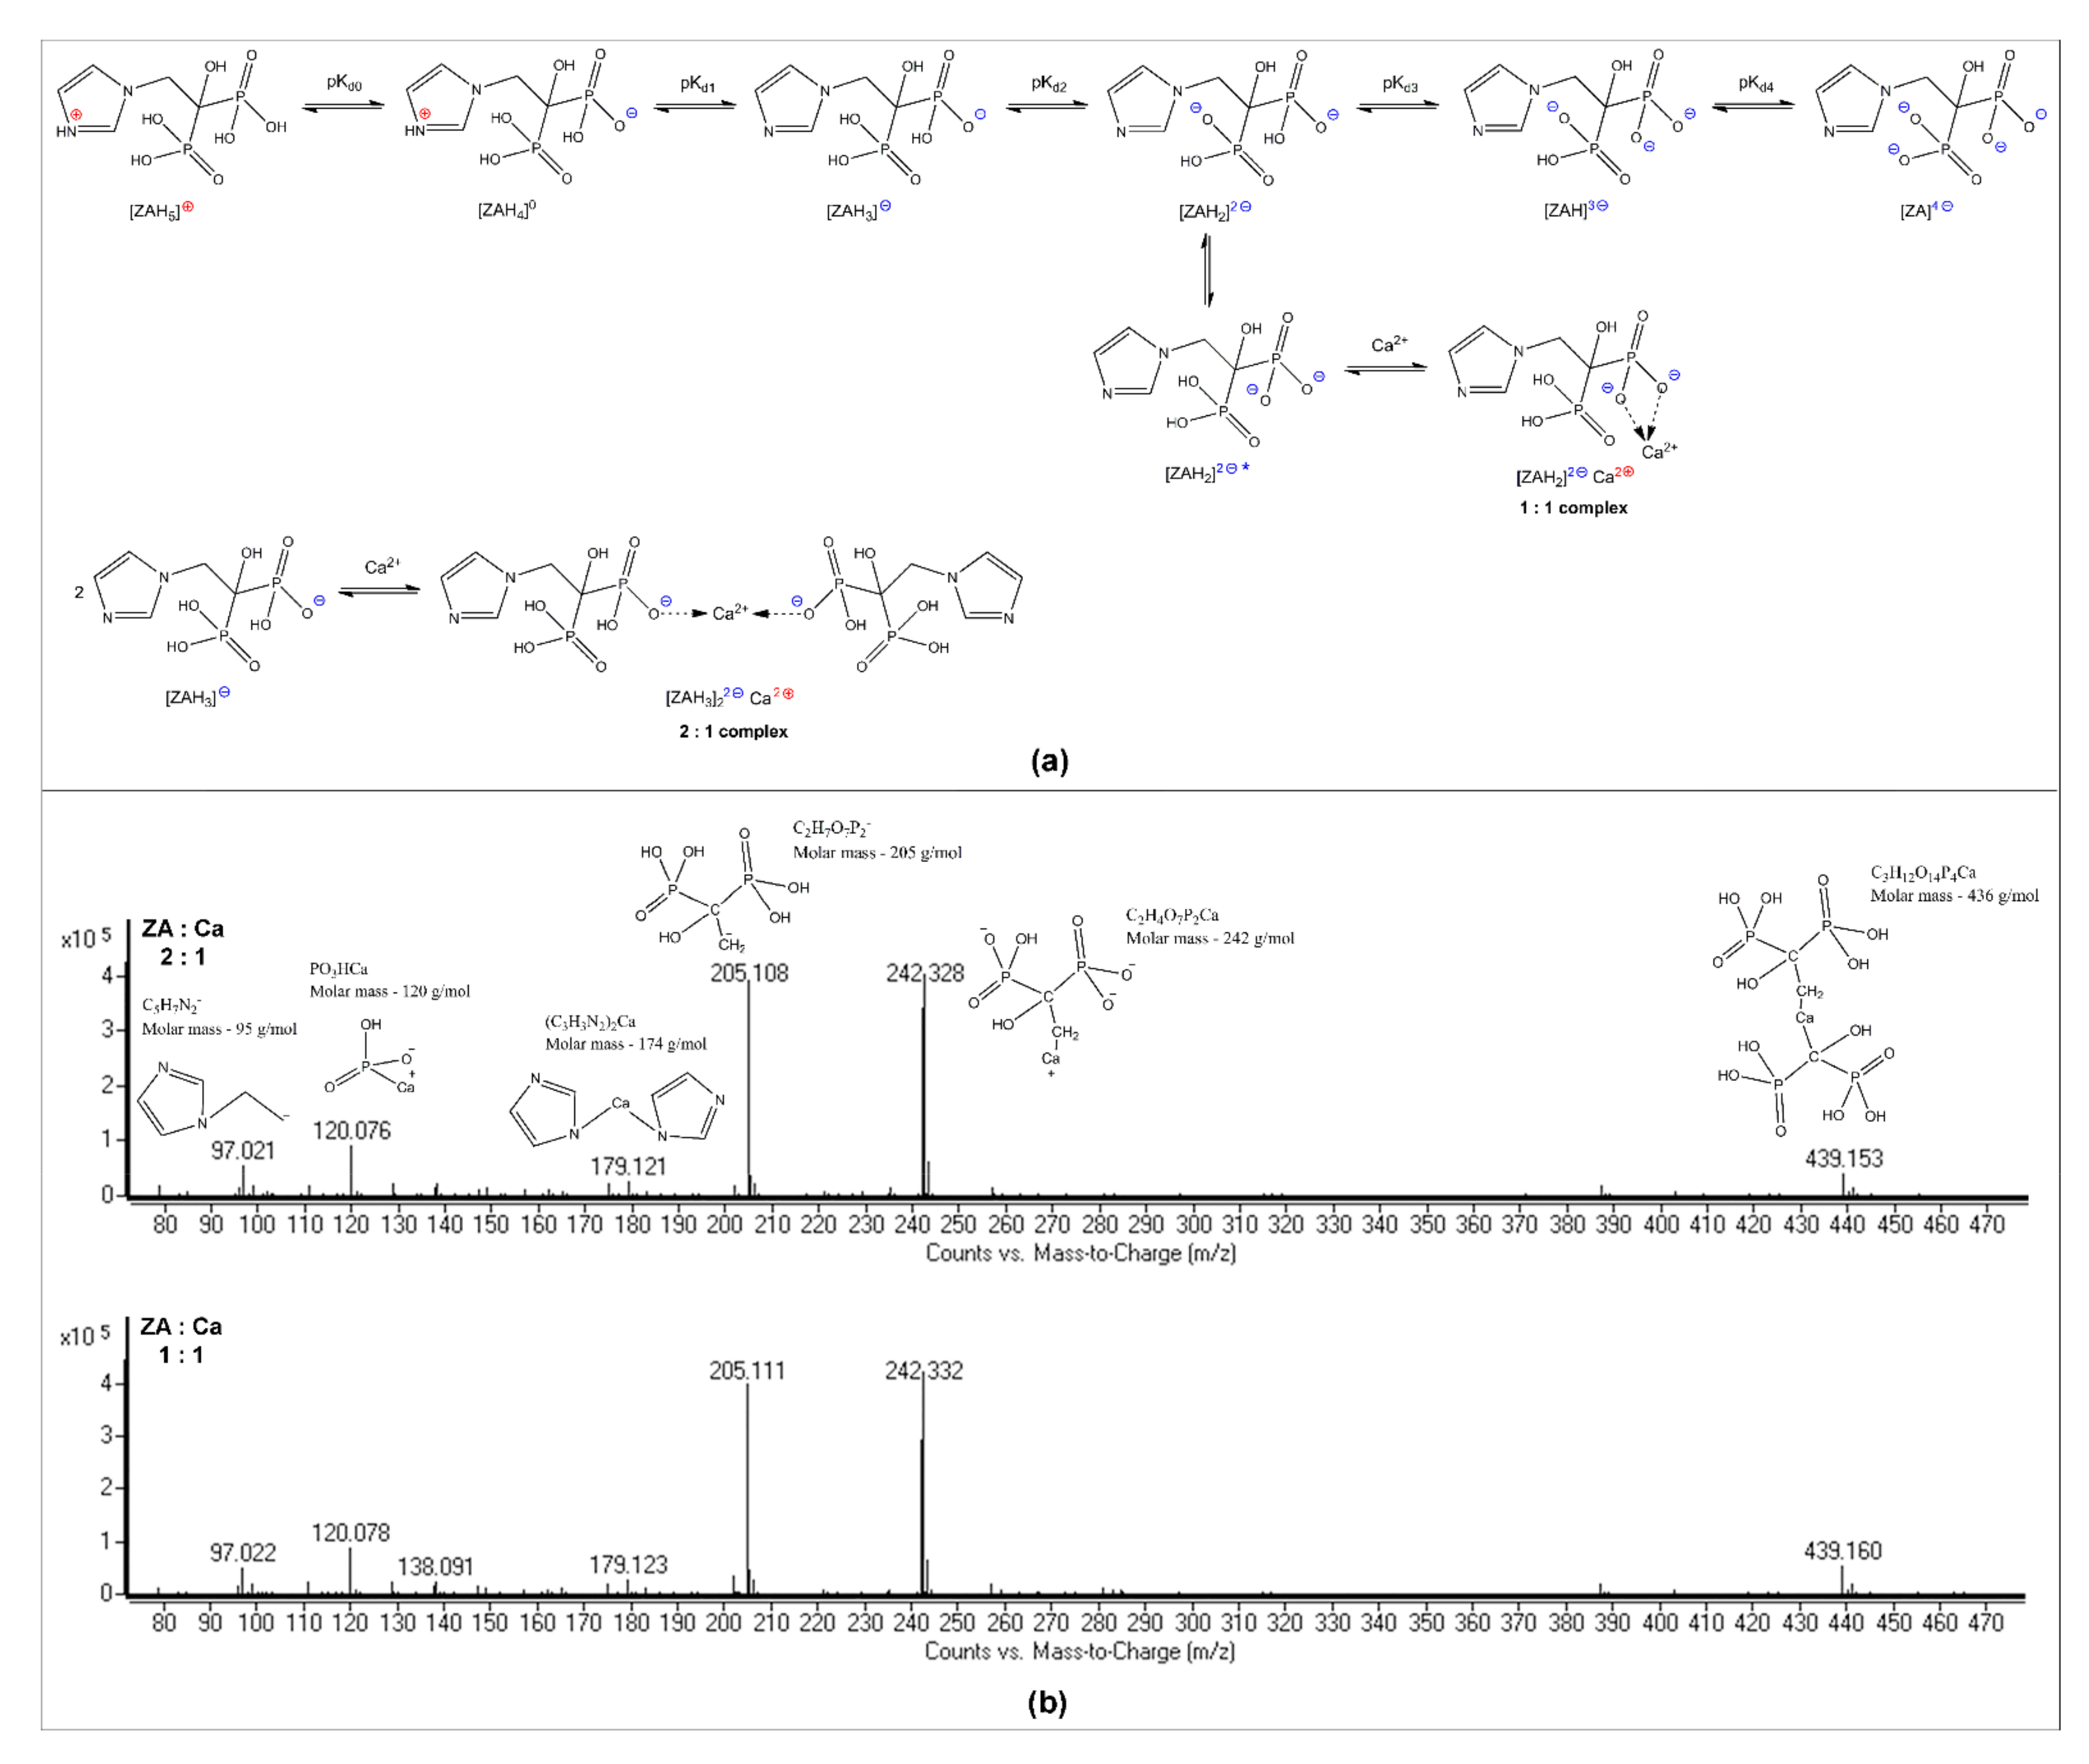
2.2. ZA-Ca2+ Complex Formation
2.3. ZA Quantification Method—Development and Validation
2.3.1. HPLC-ESI-MS Method Development
2.3.2. Preparation of ZA Standard Solutions
2.3.3. HPLC-ESI-MS Method Validation
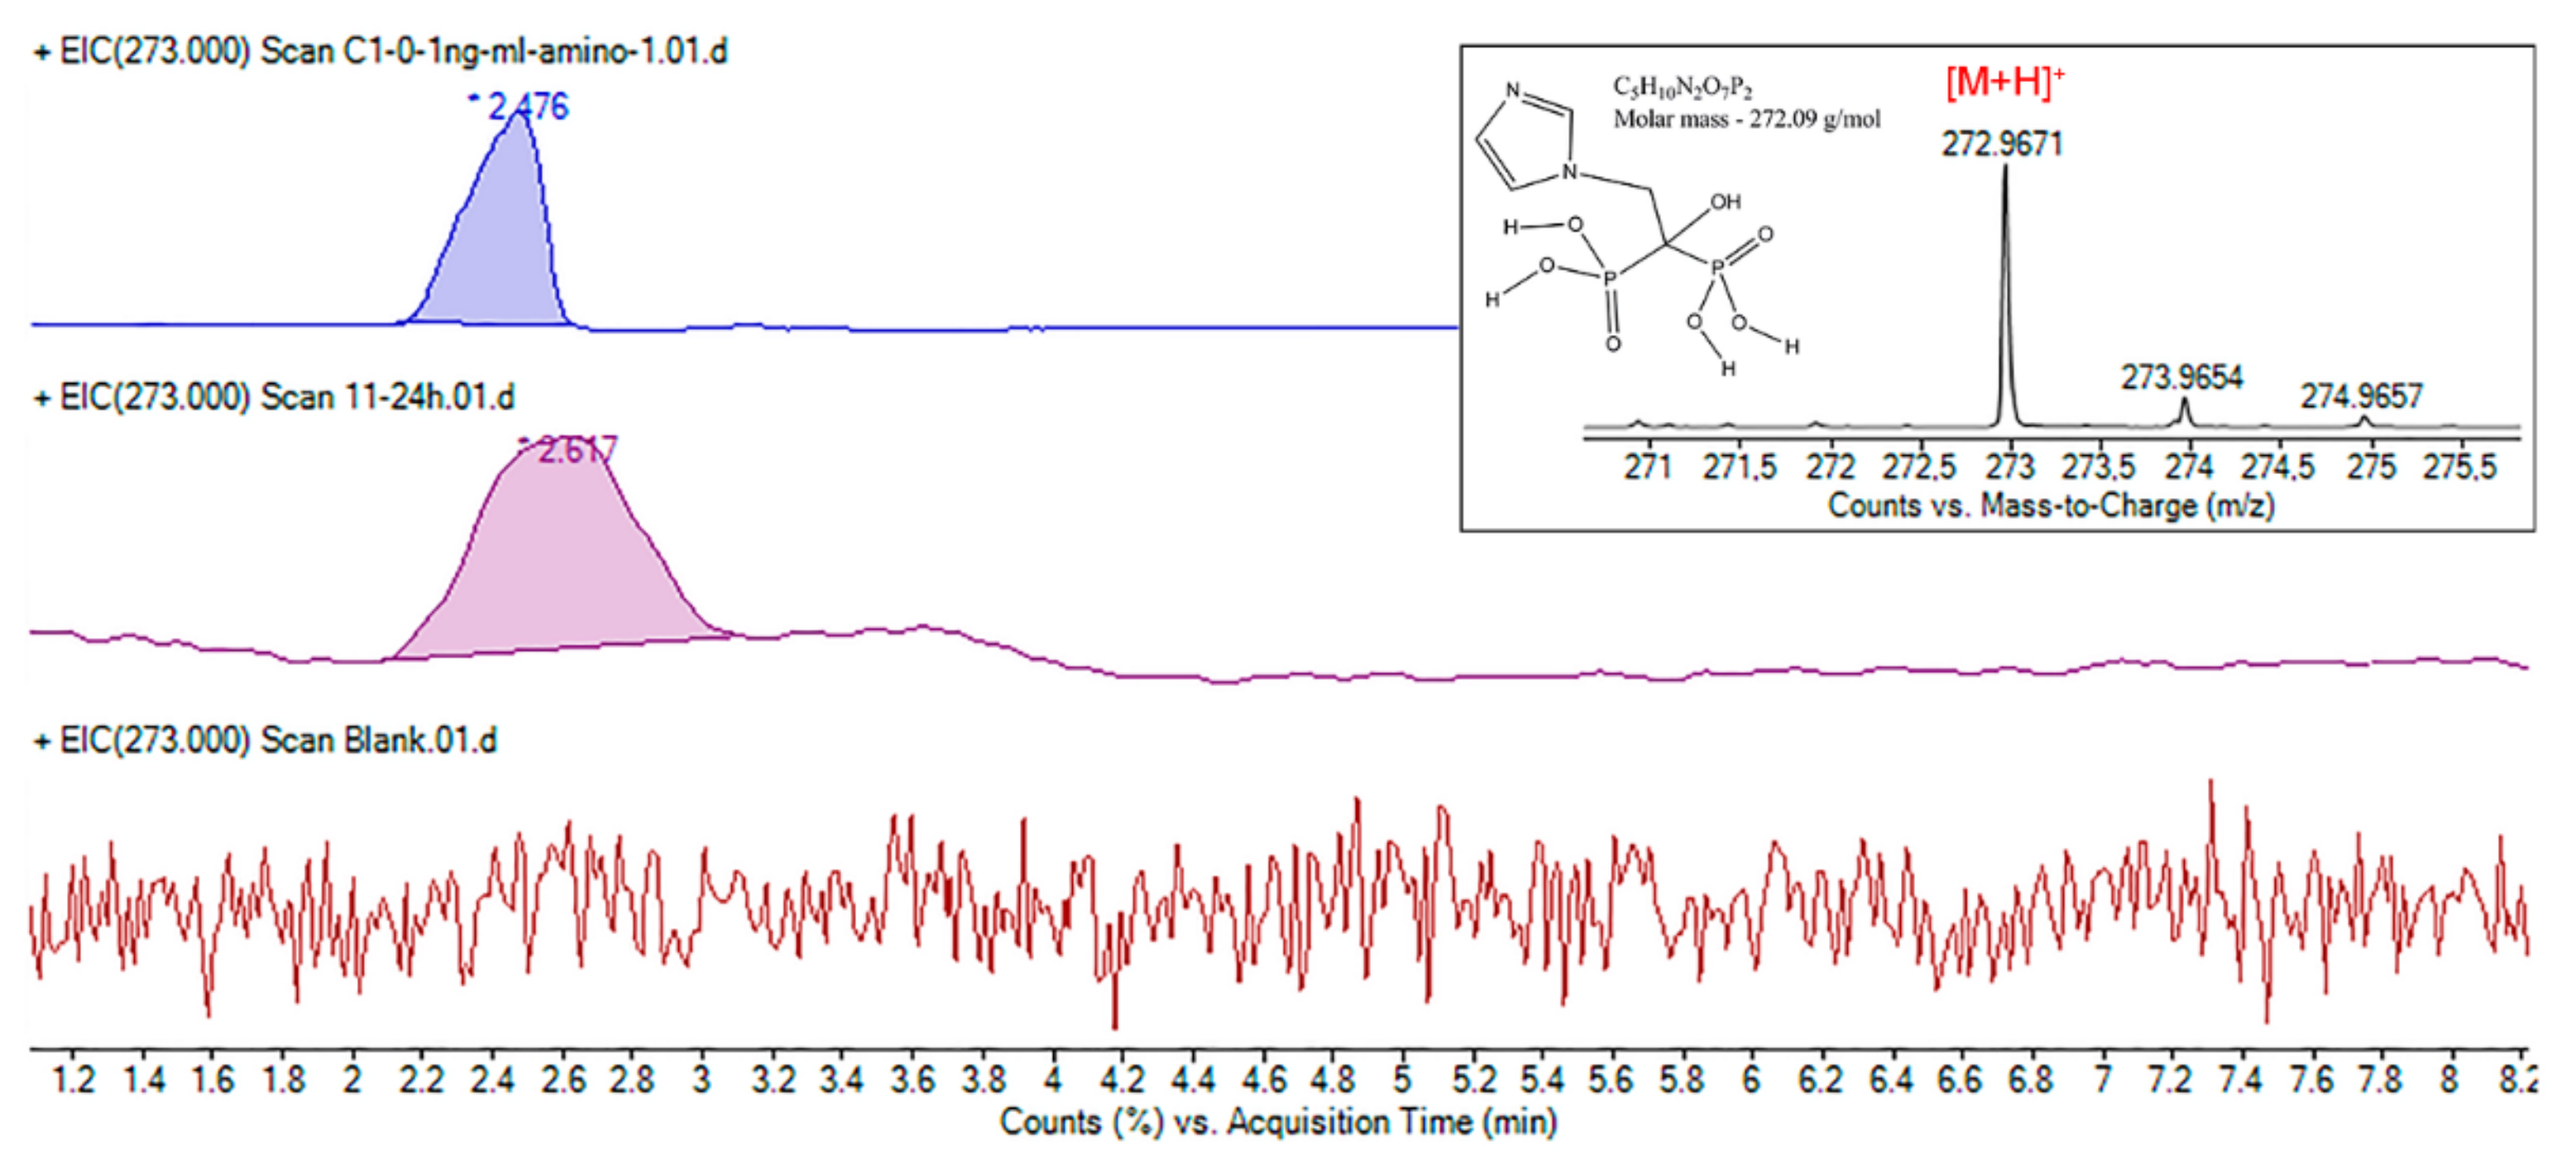
Selectivity
Precision
Accuracy
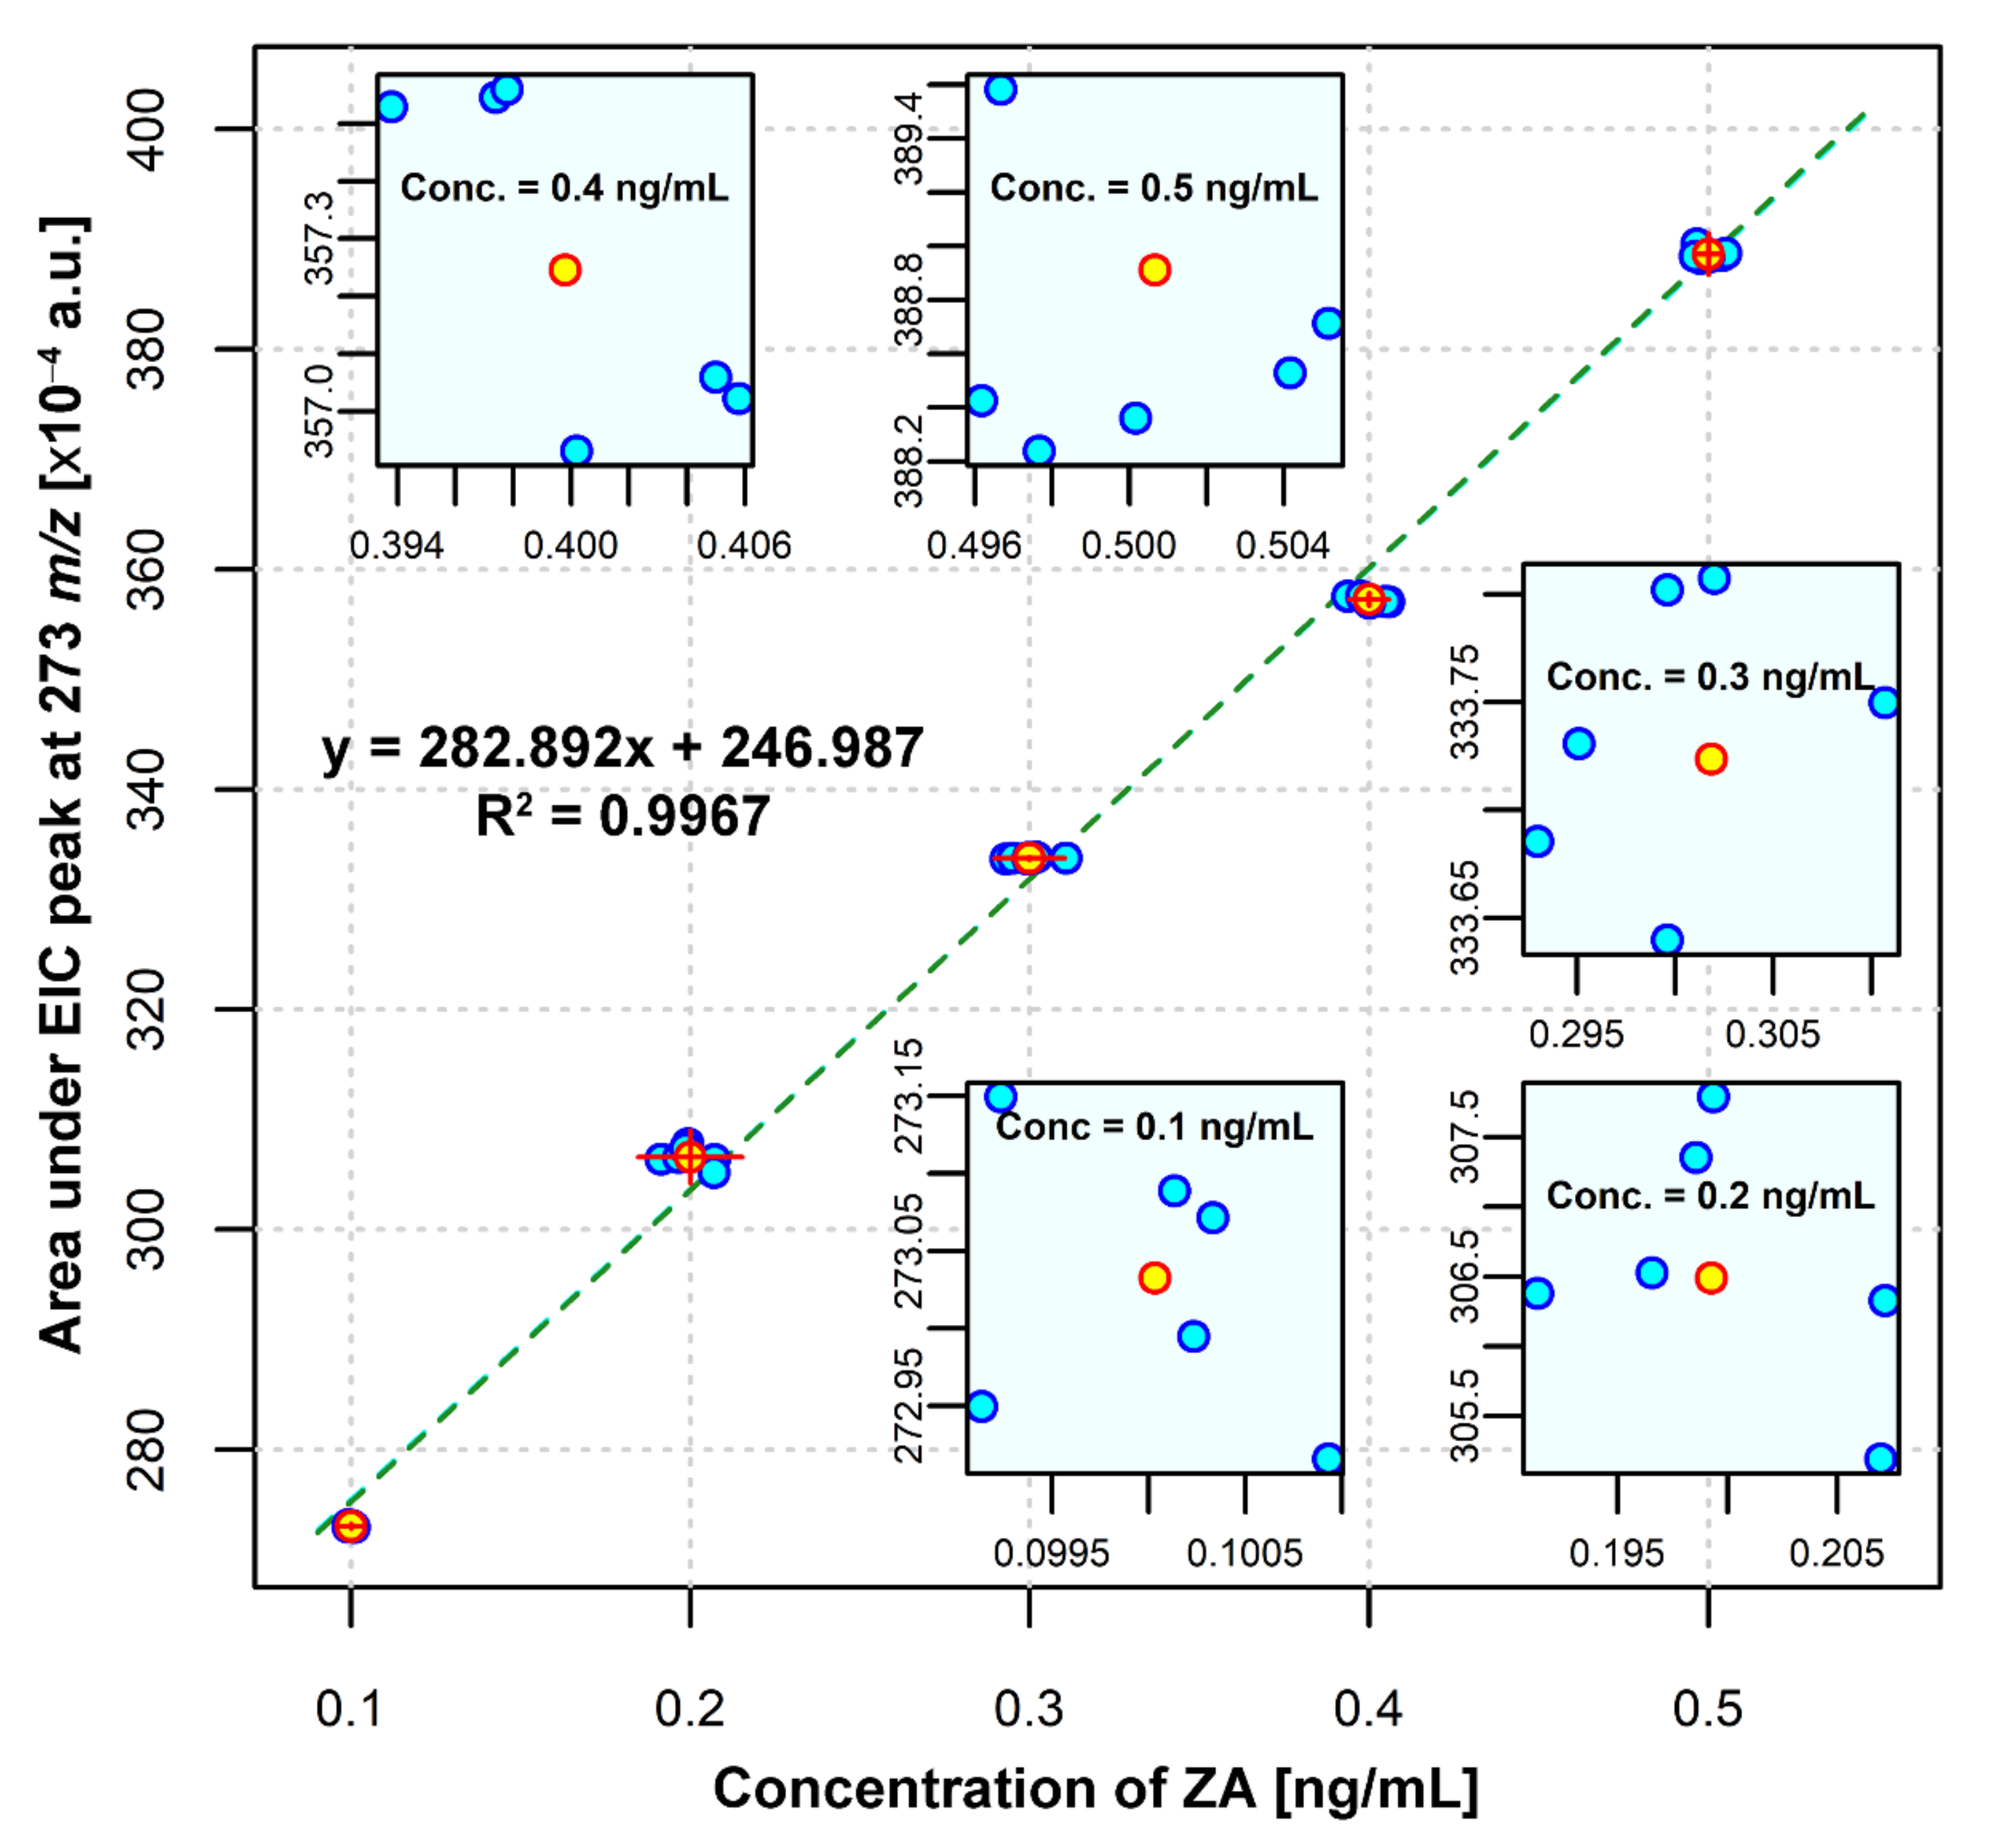
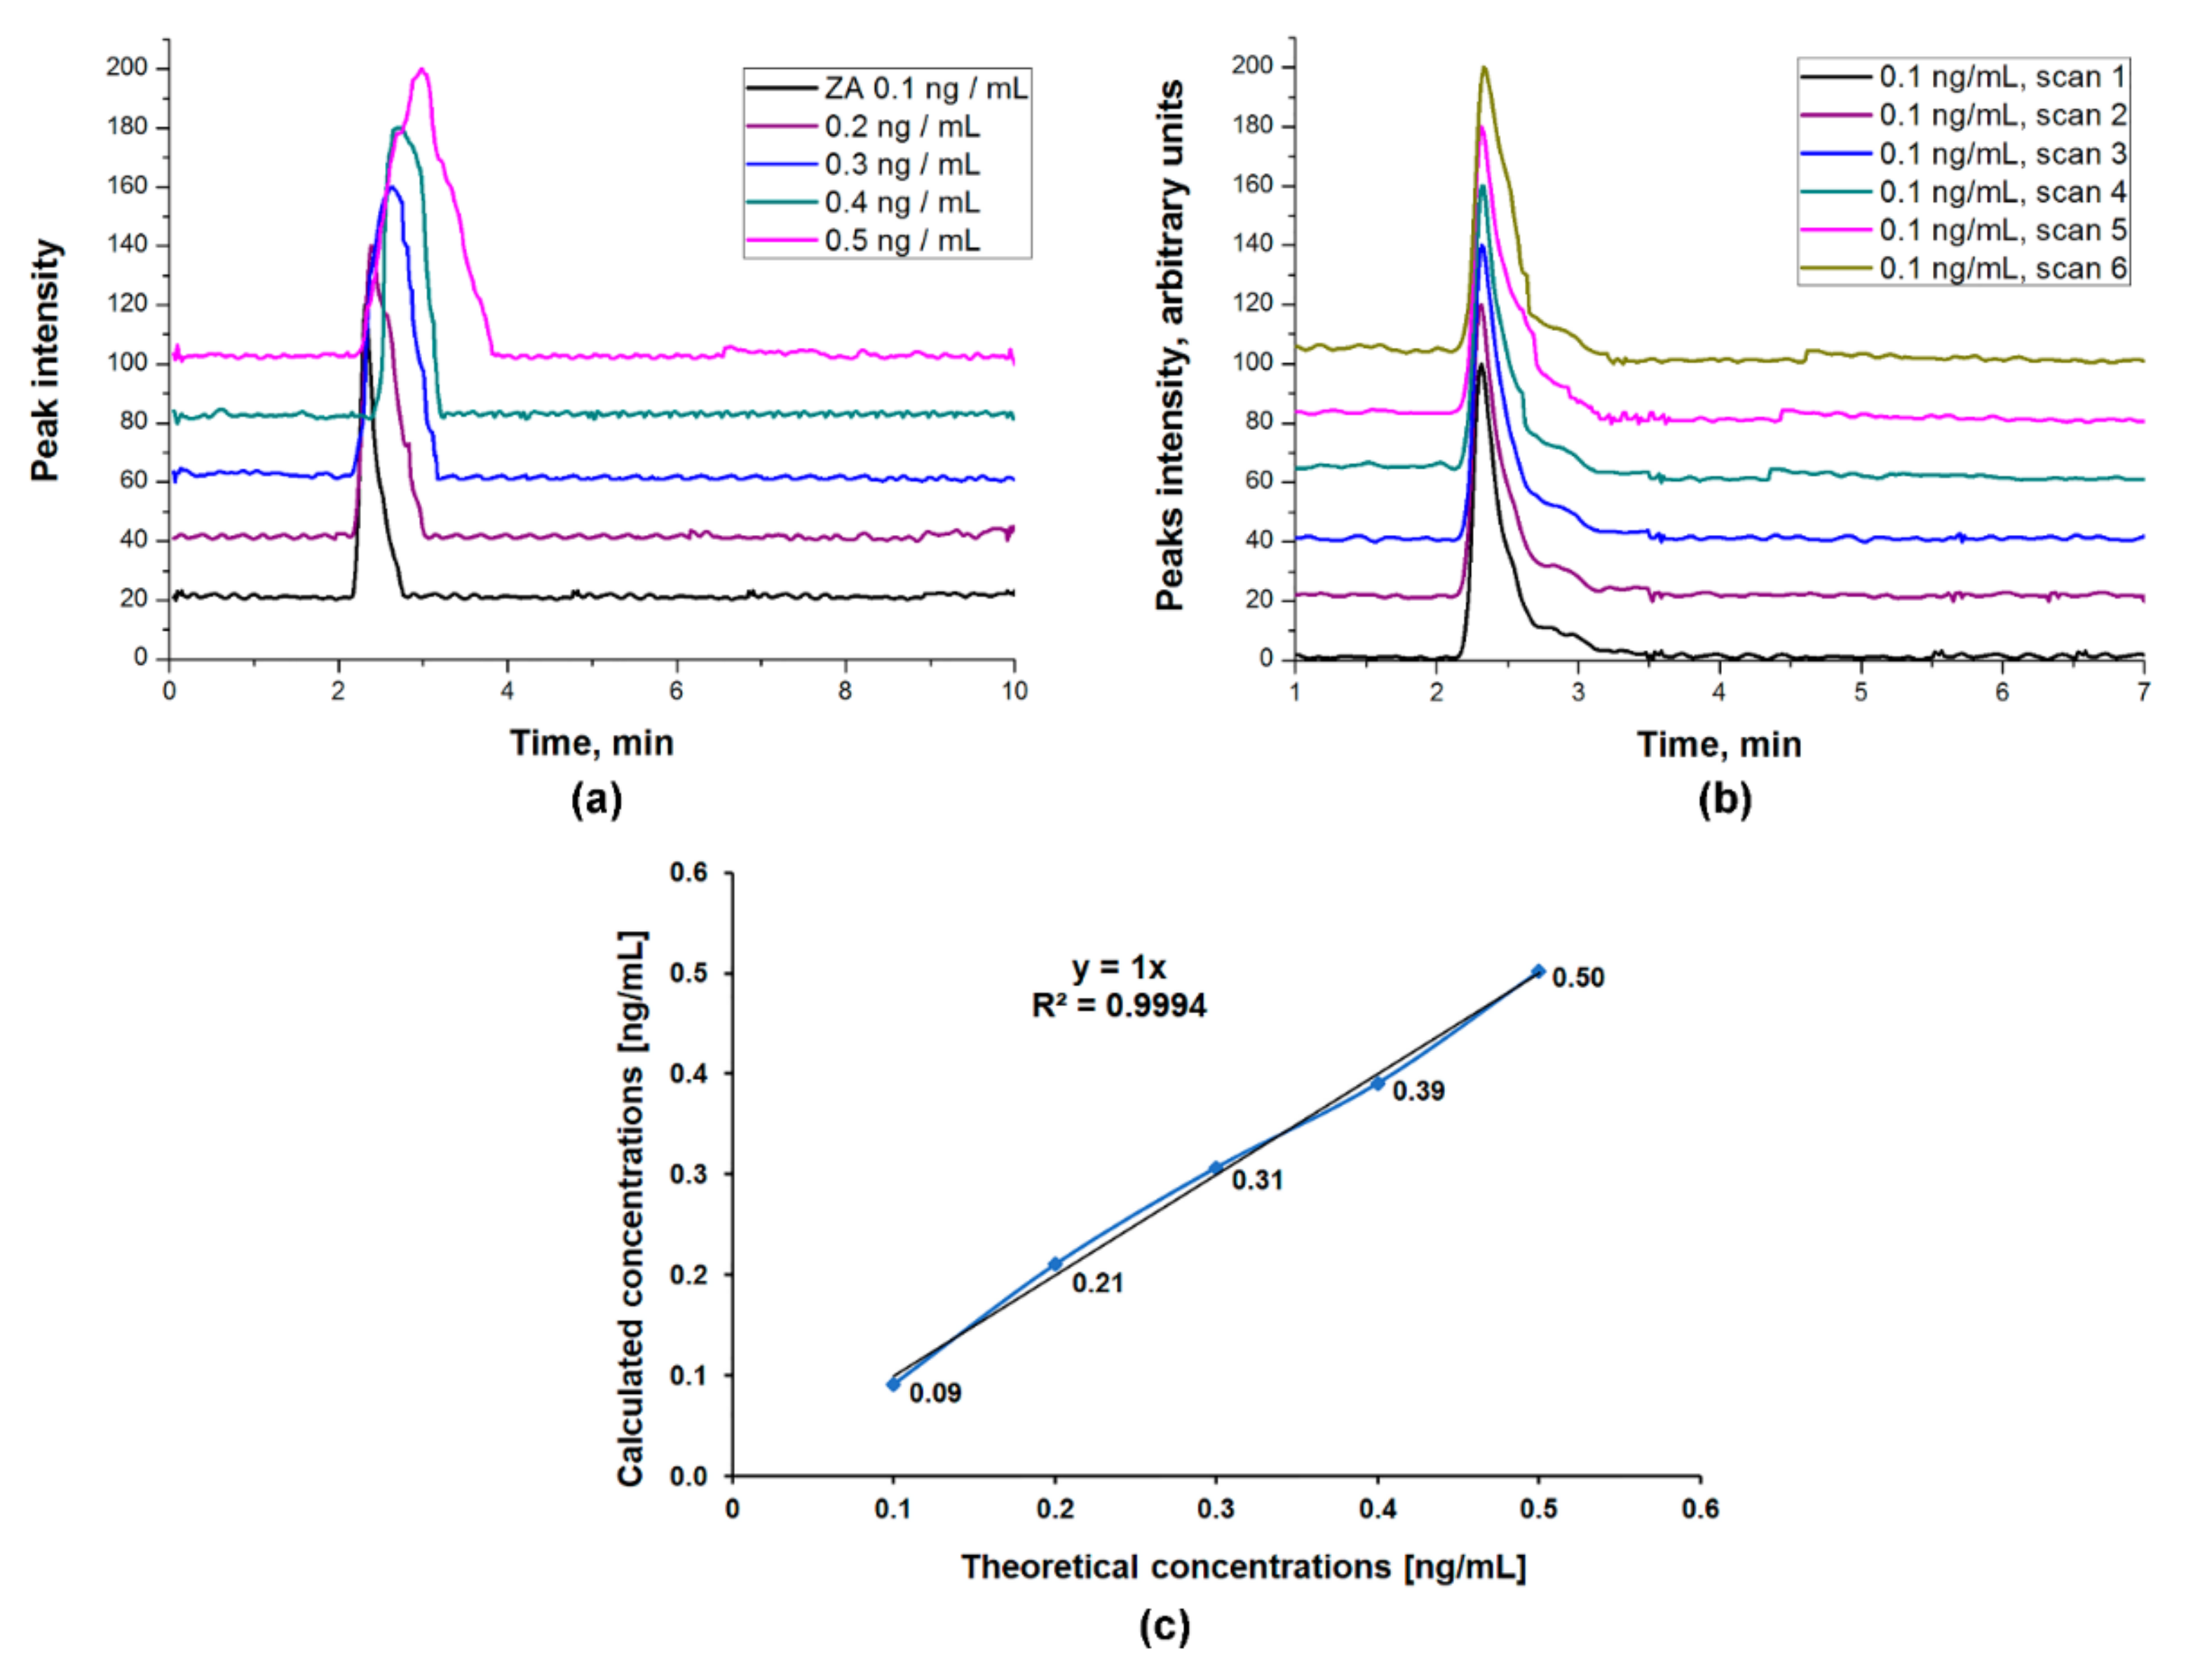
Linearity
Signal-to-Noise Ratio
Limit of Detection and Limit of Quantification
3. Results and Discussion
3.1. ZA-Ca2+ Complex Formation
3.2. HPLC-ESI-MS Method Development
ZA Calibration Curve
3.3. HPLC-ESI-MS Method Validation
3.3.1. Selectivity
3.3.2. Precision
3.3.3. Accuracy
3.3.4. Linearity
3.3.5. Signal-to-Noise Ratio
3.3.6. Limit of Detection and Limit of Quantification
4. Conclusions
Author Contributions
Funding
Institutional Review Board Statement
Informed Consent Statement
Data Availability Statement
Acknowledgments
Conflicts of Interest
References
- Jiang, Y.; Zhang, X.Q.; Xu, Z.R. Analysis of zoledronic acid and its related substances by ion-pair RP-LC. Chromatographia 2004, 60, 405–409. [Google Scholar] [CrossRef]
- Vadhan-Raj, S.; Von Moos, R.; Fallowfield, L.J.; Patrick, D.L.; Goldwasser, F.; Cleeland, C.S.; Henry, D.H.; Novello, S.; Hungria, V.; Qian, Y.; et al. Clinical benefit in patients with metastatic bone disease: Results of a phase 3 study of denosumab versus zoledronic acid. Ann. Oncol. 2012, 23, 3045–3051. [Google Scholar] [CrossRef] [PubMed]
- Zacharis, C.K.; Tzanavaras, P.D. Determination of bisphosphonate active pharmaceutical ingredients in pharmaceuticals and biological material: A review of analytical methods. J. Pharm. Biomed. Anal. 2008, 48, 483–496. [Google Scholar] [CrossRef] [PubMed]
- Oliveira, A.L.; Pedro, A.J.; Arroyo, C.S.; Mano, J.F.; Rodriguez, G.; Roman, J.S.; Reis, R.L. Biomimetic Ca-P coatings incorporating bisphosphonates produced on starch-based degradable biomaterials. J. Biomed. Mater. Res. Part B Appl. Biomater. 2010, 92B, 55–67. [Google Scholar] [CrossRef] [PubMed] [Green Version]
- Stich, T.; Alagboso, F.; Křenek, T.; Kovářík, T.; Alt, V.; Docheva, D. Implant-bone-interface: Reviewing the impact of titanium surface modifications on osteogenic processes in vitro and in vivo. Bioeng. Transl. Med. 2022, 7, e10239. [Google Scholar] [CrossRef] [PubMed]
- Han, D.; Long, A.; Wang, J.; Wang, X.; Zhang, Y. Effect of cervus and cucumis polypeptide combined with zoledronic acid on bone metabolic biochemical markers in glucocorticoids—Induced osteoporosis patients. Saudi J. Biol. Sci. 2019, 26, 1027–1031. [Google Scholar] [CrossRef] [PubMed]
- Legay, F.; Gauron, S.; Deckert, F.; Gosset, G.; Pfaar, U.; Ravera, C.; Wiegand, H.; Schran, H. Development and validation of a highly sensitive RIA for zoledronic acid, a new potent heterocyclic bisphosphonate, in human serum, plasma and urine. J. Pharm. Biomed. Anal. 2002, 30, 897–911. [Google Scholar] [CrossRef]
- Ikeda, H.; Yoshiga, D.; Kokabu, S.; Ariyoshi, W.; Tsurushima, H.; Sakaguchi, O.; Tanaka, J.; Kaneko, J.; Habu, M.; Sasaguri, M.; et al. Evaluation of therapeutic effects of teriparatide in a rat model of zoledronic acid-induced bisphosphonate-related osteonecrosis. J. Oral Maxillofac. Surg. Med. Pathol. 2019, 31, 333–341. [Google Scholar] [CrossRef]
- Fliefel, R.; El Ashwah, A.; Entekhabi, S.; Kumbrink, J.; Ehrenfeld, M.; Otto, S. Bifunctional effect of Zoledronic Acid (ZA) on human mesenchymal stem cells (hMSCs) based on the concentration level. J. Stomatol. Oral Maxillofac. Surg. 2020, 121, 634–641. [Google Scholar] [CrossRef]
- Di Vito, A.; Chiarella, E.; Baudi, F.; Scardamaglia, P.; Antonelli, A.; Giudice, D.; Barni, T.; Fortunato, L.; Giudice, A. Dose-Dependent Effects of Zoledronic Acid on Human Periodontal Ligament Stem Cells: An In Vitro Pilot Study. Cell Transplant. 2020, 29, 0963689720948497. [Google Scholar] [CrossRef]
- Rittler, D.; Baranyi, M.; Molnár, E.; Garay, T.; Jalsovszky, I.; Varga, I.K.; Hegedűs, L.; Aigner, C.; Tóvári, J.; Tímár, J.; et al. The Antitumor Effect of Lipophilic Bisphosphonate BPH1222 in Melanoma Models: The Role of the PI3K/Akt Pathway and the Small G Protein Rheb. Int. J. Mol. Sci. 2019, 20, 4917. [Google Scholar] [CrossRef] [PubMed] [Green Version]
- Giudice, A.; Antonelli, A.; Chiarella, E.; Baudi, F.; Barni, T.; Di Vito, A. The Case of Medication-Related Osteonecrosis of the Jaw Addressed from a Pathogenic Point of View. Innovative Therapeutic Strategies: Focus on the Most Recent Discoveries on Oral Mesenchymal Stem Cell-Derived Exosomes. Pharmaceuticals 2020, 13, 423. [Google Scholar] [CrossRef] [PubMed]
- Munoz, M.A.; Fletcher, E.K.; Skinner, O.P.; Jurczyluk, J.; Kristianto, E.; Hodson, M.P.; Sun, S.; Ebetino, F.H.; Croucher, D.R.; Hansbro, P.M.; et al. Bisphosphonate drugs have actions in the lung and inhibit the mevalonate pathway in alveolar macrophages. Elife 2021, 10, e72430. [Google Scholar] [CrossRef] [PubMed]
- Kameda, Y.; Aizawa, M.; Sato, T.; Honda, M. Zoledronic Acid-Loaded β-TCP Inhibits Tumor Proliferation and Osteoclast Activation: Development of a Functional Bone Substitute for an Efficient Osteosarcoma Treatment. Int. J. Mol. Sci. 2021, 22, 1889. [Google Scholar] [CrossRef]
- Veldboer, K.; Vielhaber, T.; Ahrens, H.; Hardes, J.; Streitbürger, A.; Karst, U. Determination of zoledronic acid in human urine and blood plasma using liquid chromatography/electrospray mass spectrometry. J. Chromatogr. B 2011, 879, 2073–2080. [Google Scholar] [CrossRef]
- Raina, D.B.; Larsson, D.; Mrkonjic, F.; Isaksson, H.; Kumar, A.; Lidgren, L.; Tägil, M. Gelatin- hydroxyapatite- calcium sulphate based biomaterial for long term sustained delivery of bone morphogenic protein-2 and zoledronic acid for increased bone formation: In-vitro and in-vivo carrier properties. J. Control. Release 2018, 272, 83–96. [Google Scholar] [CrossRef] [PubMed]
- Rao, B.M.; Srinivasu, M.K.; Rani, C.P.; Kumar, S.S.; Kumar, P.R.; Chandrasekhar, K.B.; Veerender, M. A validated stability indicating ion-pair RP-LC method for zoledronic acid. J. Pharm. Biomed. Anal. 2005, 39, 781–790. [Google Scholar] [CrossRef]
- Raccor, B.S.; Sun, J.; Lawrence, R.F.; Li, L.; Zhang, H.; Somerman, M.J.; Totah, R.A. Quantitation of zoledronic acid in murine bone by liquid chromatography coupled with tandem mass spectrometry. J. Chromatogr. B Anal. Technol. Biomed. Life Sci. 2013, 935, 54–60. [Google Scholar] [CrossRef] [Green Version]
- Lo Faro, A.F.; Giorgetti, R.; Busardò, F.P.; Lodi, G.; Martini, V.; Pispero, A.; Iriti, M.; Varoni, E.M. Development and validation of a method using ultra performance liquid chromatography coupled to tandem mass spectrometry for determination of zoledronic acid concentration in human bone. J. Pharm. Biomed. Anal. 2019, 162, 286–290. [Google Scholar] [CrossRef]
- Amin, N.; Afkhami, A.; Hosseinzadeh, L.; Madrakian, T. Green and cost-effective synthesis of carbon dots from date kernel and their application as a novel switchable fluorescence probe for sensitive assay of Zoledronic acid drug in human serum and cellular imaging. Anal. Chim. Acta 2018, 1030, 183–193. [Google Scholar] [CrossRef]
- Khajuria, D.K.; Vasireddi, R.; Trebbin, M.; Karasik, D.; Razdan, R. Novel therapeutic intervention for osteoporosis prepared with strontium hydroxyapatite and zoledronic acid: In vitro and pharmacodynamic evaluation. Mater. Sci. Eng. C 2017, 71, 698–708. [Google Scholar] [CrossRef] [PubMed]
- Vargas-Franco, J.W.; Castaneda, B.; Gama, A.; Mueller, C.G.; Heymann, D.; Rédini, F.; Lézot, F. Genetically-achieved disturbances to the expression levels of TNFSF11 receptors modulate the effects of zoledronic acid on growing mouse skeletons. Biochem. Pharmacol. 2019, 168, 133–148. [Google Scholar] [CrossRef]
- Tang, Q.; Jiang, S.; Jia, W.; Shen, D.; Qiu, Y.; Zhao, Y.; Xue, B.; Li, C. Zoledronic acid, an FPPS inhibitor, ameliorates liver steatosis through inhibiting hepatic de novo lipogenesis. Eur. J. Pharmacol. 2017, 814, 169–177. [Google Scholar] [CrossRef] [PubMed]
- Carbonare, L.D.; Mottes, M.; Malerba, G.; Mori, A.; Zaninotto, M.; Plebani, M.; Dellantonio, A.; Valenti, M.T. Enhanced Osteogenic Differentiation in Zoledronate-Treated Osteoporotic Patients. Int. J. Mol. Sci. 2017, 18, 1261. [Google Scholar] [CrossRef]
- Pons-Fuster López, E.; Seoane Leston, J.; López Jornet, P. Epigallocatechin-3-gallate reduces damage to osteoblast-like cells treated with Zoledronic acid. Arch. Oral Biol. 2018, 94, 27–32. [Google Scholar] [CrossRef] [PubMed]
- Mostefa Side Larbi, M.A.; Sauzet, C.; Piccerelle, P.; Cau, P.; Levy, N.; Gallice, P.; Berge-Lefranc, D. Thermodynamic study of the interaction between calcium and zoledronic acid by calorimetry. J. Chem. Thermodyn. 2016, 97, 290–296. [Google Scholar] [CrossRef]
- Bayraktar, D.; Tas, A.C. Chemical preparation of carbonated calcium hydroxyapatite powders at 37 °C in urea-containing synthetic body fluids. J. Eur. Ceram. Soc. 1999, 19, 2573–2579. [Google Scholar] [CrossRef] [Green Version]
- Rao, T.N. Validation of Analytical Methods. In Calibration and Validation of Analytical Methods—A Sampling of Current Approaches; InTechOpen: London, UK, 2018. [Google Scholar] [CrossRef] [Green Version]
- Khajuria, D.K.; Razdan, R.; Mahapatra, D.R. Development, in vitro and in vivo characterization of zoledronic acid functionalized hydroxyapatite nanoparticle based formulation for treatment of osteoporosis in animal model. Eur. J. Pharm. Sci. 2015, 66, 173–183. [Google Scholar] [CrossRef]
- Povoroznyuk, V.V.; Grygorieva, V.N.; Pekhnyo, V.I.; Kozachkova, O.M.; Tsaryk, N. V Zoledronic Acid and Its Calcium-contain Complexes in Treatment of Experimental Osteoporosis in Wistar Female Rats. Biochem. Anal. Biochem. 2017, 6, 340. [Google Scholar] [CrossRef]
- Olsen, B.A. Hydrophilic interaction chromatography using amino and silica columns for the determination of polar pharmaceuticals and impurities. J. Chromatogr. A 2001, 913, 113–122. [Google Scholar] [CrossRef]


| Sample | Rt | EIC Peak Area of m/z 273 [M + H]+ × 10−4 | SD | RSD% | Start Rt | End Rt |
|---|---|---|---|---|---|---|
| ZA 0.1 ng/mL-amino-1 | 2.316 | 273.0715 | 0.0306 | 0.0112 | 2.123 | 3.185 |
| ZA 0.1 ng/mL-amino-2 | 2.315 | 272.9948 | 0.0236 | 0.0086 | 2.09 | 3.169 |
| ZA 0.1 ng/mL-amino-3 | 2.304 | 272.9493 | 0.0558 | 0.0204 | 2.094 | 3.189 |
| ZA 0.1 ng/mL-amino-4 | 2.314 | 273.0887 | 0.0428 | 0.0157 | 2.121 | 3.184 |
| ZA 0.1 ng/mL-amino-5 | 2.305 | 273.1494 | 0.0857 | 0.0314 | 2.064 | 3.175 |
| ZA 0.1 ng/mL-amino-6 | 2.322 | 272.9155 | 0.0797 | 0.0292 | 2.097 | 3.176 |
| ZA 0.1 ng/mL-amino-mean value | 273.0282 |
| Sample | Rt | EIC Peak Area of m/z 273 [M + H]+ × 10−4 | SD | RSD% | Start Rt | End Rt |
|---|---|---|---|---|---|---|
| 80%-ZA-amino-1 | 2.305 | 357.123 | 0.1118 | 0.0313 | 1.999 | 3.174 |
| 80%-ZA-amino-2 | 2.282 | 357.1992 | 0.0579 | 0.0162 | 2.073 | 3.184 |
| 80%-ZA-amino-3 | 2.288 | 357.4954 | 0.2758 | 0.0772 | 2.014 | 3.173 |
| 80%-ZA-amino-4 | 2.286 | 356.891 | 0.1393 | 0.0389 | 2.012 | 3.188 |
| 80%-ZA-amino-5 | 2.318 | 357.4781 | 0.1393 | 0.0389 | 2.061 | 3.188 |
| 80%-ZA-amino-6 | 2.317 | 357.4999 | 0.1547 | 0.0433 | 2.027 | 3.17 |
| 80%-ZA-amino-mean value | 357.2811 | |||||
| 100%-ZA-amino-1 | 2.31 | 388.4991 | 0.1265 | 0.0326 | 2.068 | 3.179 |
| 100%-ZA-amino-2 | 2.379 | 388.4135 | 0.1871 | 0.0481 | 1.977 | 3.184 |
| 100%-ZA-amino-3 | 2.426 | 388.6965 | 0.0130 | 0.0034 | 2.008 | 3.183 |
| 100%-ZA-amino-4 | 2.428 | 389.0743 | 0.2802 | 0.0721 | 2.01 | 3.185 |
| 100%-ZA-amino-5 | 2.757 | 388.8763 | 0.1402 | 0.0361 | 2.097 | 3.175 |
| 100%-ZA-amino-6 | 2.934 | 388.5086 | 0.1198 | 0.0308 | 2.081 | 3.176 |
| 100%-ZA-amino-mean value | 388.6781 | |||||
| 120%-ZA-amino-1 | 2.436 | 417.0019 | 0.0067 | 0.0016 | 2.05 | 3.177 |
| 120%-ZA-amino-2 | 2.436 | 417.8364 | 0.5834 | 0.1399 | 2.066 | 3.177 |
| 120%-ZA-amino-3 | 2.384 | 416.344 | 0.4719 | 0.1132 | 2.094 | 3.189 |
| 120%-ZA-amino-4 | 2.374 | 417.4411 | 0.3039 | 0.0729 | 2.084 | 3.179 |
| 120%-ZA-amino-5 | 2.369 | 417.1665 | 0.1097 | 0.0263 | 2.096 | 3.174 |
| 120%-ZA-amino-6 | 2.38 | 416.2783 | 0.5184 | 0.1243 | 2.058 | 3.185 |
| 120%-ZA-amino-mean value | 417.0114 |
Publisher’s Note: MDPI stays neutral with regard to jurisdictional claims in published maps and institutional affiliations. |
© 2022 by the authors. Licensee MDPI, Basel, Switzerland. This article is an open access article distributed under the terms and conditions of the Creative Commons Attribution (CC BY) license (https://creativecommons.org/licenses/by/4.0/).
Share and Cite
Petrovici, A.-R.; Silion, M.; Simionescu, N.; Kallala, R.; Pinteala, M.; Maier, S.S. Quantification of Low Amounts of Zoledronic Acid by HPLC-ESI-MS Analysis: Method Development and Validation. Int. J. Mol. Sci. 2022, 23, 5944. https://doi.org/10.3390/ijms23115944
Petrovici A-R, Silion M, Simionescu N, Kallala R, Pinteala M, Maier SS. Quantification of Low Amounts of Zoledronic Acid by HPLC-ESI-MS Analysis: Method Development and Validation. International Journal of Molecular Sciences. 2022; 23(11):5944. https://doi.org/10.3390/ijms23115944
Chicago/Turabian StylePetrovici, Anca-Roxana, Mihaela Silion, Natalia Simionescu, Rami Kallala, Mariana Pinteala, and Stelian S. Maier. 2022. "Quantification of Low Amounts of Zoledronic Acid by HPLC-ESI-MS Analysis: Method Development and Validation" International Journal of Molecular Sciences 23, no. 11: 5944. https://doi.org/10.3390/ijms23115944
APA StylePetrovici, A.-R., Silion, M., Simionescu, N., Kallala, R., Pinteala, M., & Maier, S. S. (2022). Quantification of Low Amounts of Zoledronic Acid by HPLC-ESI-MS Analysis: Method Development and Validation. International Journal of Molecular Sciences, 23(11), 5944. https://doi.org/10.3390/ijms23115944