Article

Development and Characterization of a Factor V-Deficient CRISPR Cell Model for the Correction of Mutations

by
Luis Javier Serrano
1,
Mariano Garcia-Arranz
2,3,
Juan A. De Pablo-Moreno
1,
José Carlos Segovia
4,
Rocío Olivera-Salazar
2,
Damián Garcia-Olmo
2,3 and
Antonio Liras
1,*
1
Department of Genetics, Physiology and Microbiology, School of Biology, Complutense University, 28040 Madrid, Spain
2
Fundación Jiménez Díaz University Hospital Health Research Institute, Fundación Jiménez Díaz University Hospital, 28040 Madrid, Spain
3
Department of Surgery, Autonomous University of Madrid, 28049 Madrid, Spain
4
Differentiation and Cytometry Unit, Innovative Hematopoietic Therapies Division, Center for Energy, Environmental and Technological Research (CIEMAT), Biomedical Research Networking Center for Rare Diseases (CIBERER), 28040 Madrid, Spain
*
Author to whom correspondence should be addressed.
Int. J. Mol. Sci. 2022, 23(10), 5802; https://doi.org/10.3390/ijms23105802
Submission received: 28 April 2022 / Revised: 18 May 2022 / Accepted: 20 May 2022 / Published: 22 May 2022

Abstract

:
Factor V deficiency, an ultra-rare congenital coagulopathy, is characterized by bleeding episodes that may be more or less intense as a function of the levels of coagulation factor activity present in plasma. Fresh-frozen plasma, often used to treat patients with factor V deficiency, is a scarcely effective palliative therapy with no specificity to the disease. CRISPR/Cas9-mediated gene editing, following precise deletion by non-homologous end-joining, has proven to be highly effective for modeling on a HepG2 cell line a mutation similar to the one detected in the factor V-deficient patient analyzed in this study, thus simulating the pathological phenotype. Additional CRISPR/Cas9-driven non-homologous end-joining precision deletion steps allowed correction of 41% of the factor V gene mutated cells, giving rise to a newly developed functional protein. Taking into account the plasma concentrations corresponding to the different levels of severity of factor V deficiency, it may be argued that the correction achieved in this study could, in ideal conditions, be sufficient to turn a severe phenotype into a mild or asymptomatic one.

1. Introduction

Factor V (FV), also called labile factor or pro-accelerin, is a coagulation factor that plays a key role in the coagulation cascade. In humans, the FV gene (F5) has an approximate size of 80 kb, is located in chromosome 1q24.2 and consists of 25 exons and 24 introns. FV cDNA is 6914 bp in length. Eighty percent of circulating FV is produced in the liver by hepatocytes, while the remaining 20% resides in platelet granules [1,2,3,4]. This circulating factor is a glycosylated 330 kDa polypeptide whose activation results in a loss of its B-domain and in the splicing of the protein into a heavy 105 kDa chain, which contains the A1 and A2 domains, and a light 71–74 kDa chain, which contains the A3, C1 and C2 domains. The heavy chain interacts with activated factor X and prothrombin, while the light chain interacts with membrane phospholipids [5,6]. FV deficiency, known as parahemophilia or Owren’s disease, is an autosomal recessive disorder associated with mutations in the F5 gene and an ultra-rare condition with an incidence of 1–9/1,000,000 live births [7,8,9].
Clinically, FV deficiency is characterized by the occurrence of mild-to-severe bleeding episodes. Different phenotypes of the disease may develop depending on the levels present in the plasma of FV. A severely deficient phenotype is characteristic of plasma levels < 1% of normal, a moderately deficient phenotype is associated with plasma levels between 1% and 10% of normal and a mild/asymptomatic phenotype occurs with plasma levels above 10% of normal [4,10,11]. Bleeding episodes usually start before the age of six and are associated with a heterogeneous spectrum of hemorrhagic manifestations, ranging from mucosal or soft tissue bleeding (i.e., epistaxis or hemarthrosis) to potentially lethal hemorrhages. Abundant nasal and menstrual bleeding are also distinctive features of this deficiency. Profuse bleeding is likewise common during minor and major surgeries, as well as during dental procedures. Hemorrhagic arthropathy, hematomas and cranial and gastrointestinal bleeding are less frequent [4,7,12].
No plasma-derived or recombinant FV concentrates are currently available to treat FV deficiency. The available treatments consist of administering fresh-frozen (virally inactivated) plasma or the use of Octaplas®, an alternative solvent/detergent-treated pharmaceutical product. The latter is associated with a high safety profile against emerging pathogens and prions and contains an optimally controlled combination of different coagulation factors, including FV [13,14,15].
Gene editing by CRISPR/Cas9 has been proposed as a potential therapy for several genetic diseases, including FV deficiency. Indeed, given its ability to eliminate mutated exons and normalize the FV protein, CRISPR/Cas9-based gene editing can restore the protein’s original function [16,17]. This strategy, which uses two CRISPR guides (gRNA) to perform two double-strand breaks (DSB), seems to facilitate a so-called non-homologous end joining (NHEJ) repair [18,19,20]. Several authors have studied the efficacy of precise deletion by NHEJ (NHEJ-PD) and analyzed how this process works when the guides are separated by 23–148 bp, in which case, a precise deletion is the most likely event. The use of two guides to delete a defined DNA fragment and alter the frameshift efficiency of the affected locus in a pseudo-controlled way could allow the generation of knockout models for the study of the biology of the cell, thus contributing to correcting pathologic mutations or generating cellular or animal models of rare diseases [21,22]. In this study, a FV-deficient cell model was generated via CRISPR/Cas9 gene editing with a similar mutation to the one exhibited by the studied patient (c.3279G>A, p.Trp1093*).

2. Results

As far as the patient is concerned, a familiar segregation analysis indicated that her mother was heterozygous for the already described c.2218C>T, p.Arg740* mutation [23] with FV plasma levels at 63%, indicative of a mild phenotype, with no noteworthy clinical symptoms. Her father was heterozygous for the c.3279G>A, p.Trp1093* mutation [24] and presented with FV plasma levels of 21%, also associated with a mild phenotype without significant symptoms.
To facilitate the availability of FV deficient cells, an attempt was made to mimic one of the mutations described in this patient in a reference hepatic cell line.

2.1. NHEJ-PD Generates an FV KO Cellular Model for the HepG2 Cell Line

The non-homologous end-joining precision deletion (NHEJ-PD) strategy was used to generate a KO FV cellular model in a HepG2 cell line (KO HepG2) (Figure 1A,B) and reproduce a mutation similar to c.3279G>A, p.Trp1093*, which is the mutation exhibited by the studied patient (Figure 1C). A specific pair of guides were designed to produce a deletion of 35 bp (between nucleotides 3263 and 3297), modifying the frameshift of the gene sequence and giving rise to a premature stop codon at a short distance from the patient’s c.3263–3298del, p.Met1089* mutation (4 amino acids away). The efficiency of this gene editing procedure was about 60% (59.5%) (Figure 2A), with other minor genetic modifications also being obtained that were not relevant to our study.
Cells that contained this precise sequence were selected through colony-forming units (CFUs), and the DNA of these clones was analyzed by Sanger sequencing. Some clones were shown to exhibit the sought-after mutation (Figure 2B). For the next assays, three c.3263–3298del, p.Met1089* mutation-positive clone cell lines were used, called LO1, LO8 and LO9.

2.2. Generation of an FV TT Cellular Model Derived from the KO HepG2 Cell Line

Using the same procedure but with a different pair of guides, a recovered FV cell line (TT HepG2) was generated from KO HepG2 clones LO1, LO8 and LO9 through NHEJ-PD. In this case, a deletion of 49 bp (c.3242–3291del) removed the premature stop codon; the frameshift of the F5 was restored in the three clones (Figure 1D). Efficiency was around 41.4% ± 1.3 and Sanger sequencing yielded the expected sequences (Figure 2C).

2.3. Comparison and Characterization of the Three Cell Lines Obtained: WT HepG2, KO HepG2 and TT HepG2

The three cell lines obtained were compared and characterized. As shown in Figure 1E, the sizes of the PCR products varied in accordance with the sequential deletions carried out. The PCR product was 403 bp for the WT HepG2 line, 368 bp for the three clones of the KO HepG2 cell line and 368 bp and 319 bp for the TT HepG2 cell line, where two different bands were observed, one corresponding to non-edited cells (368 bp) and another to the edited cells that corrected the mutation (319 bp).
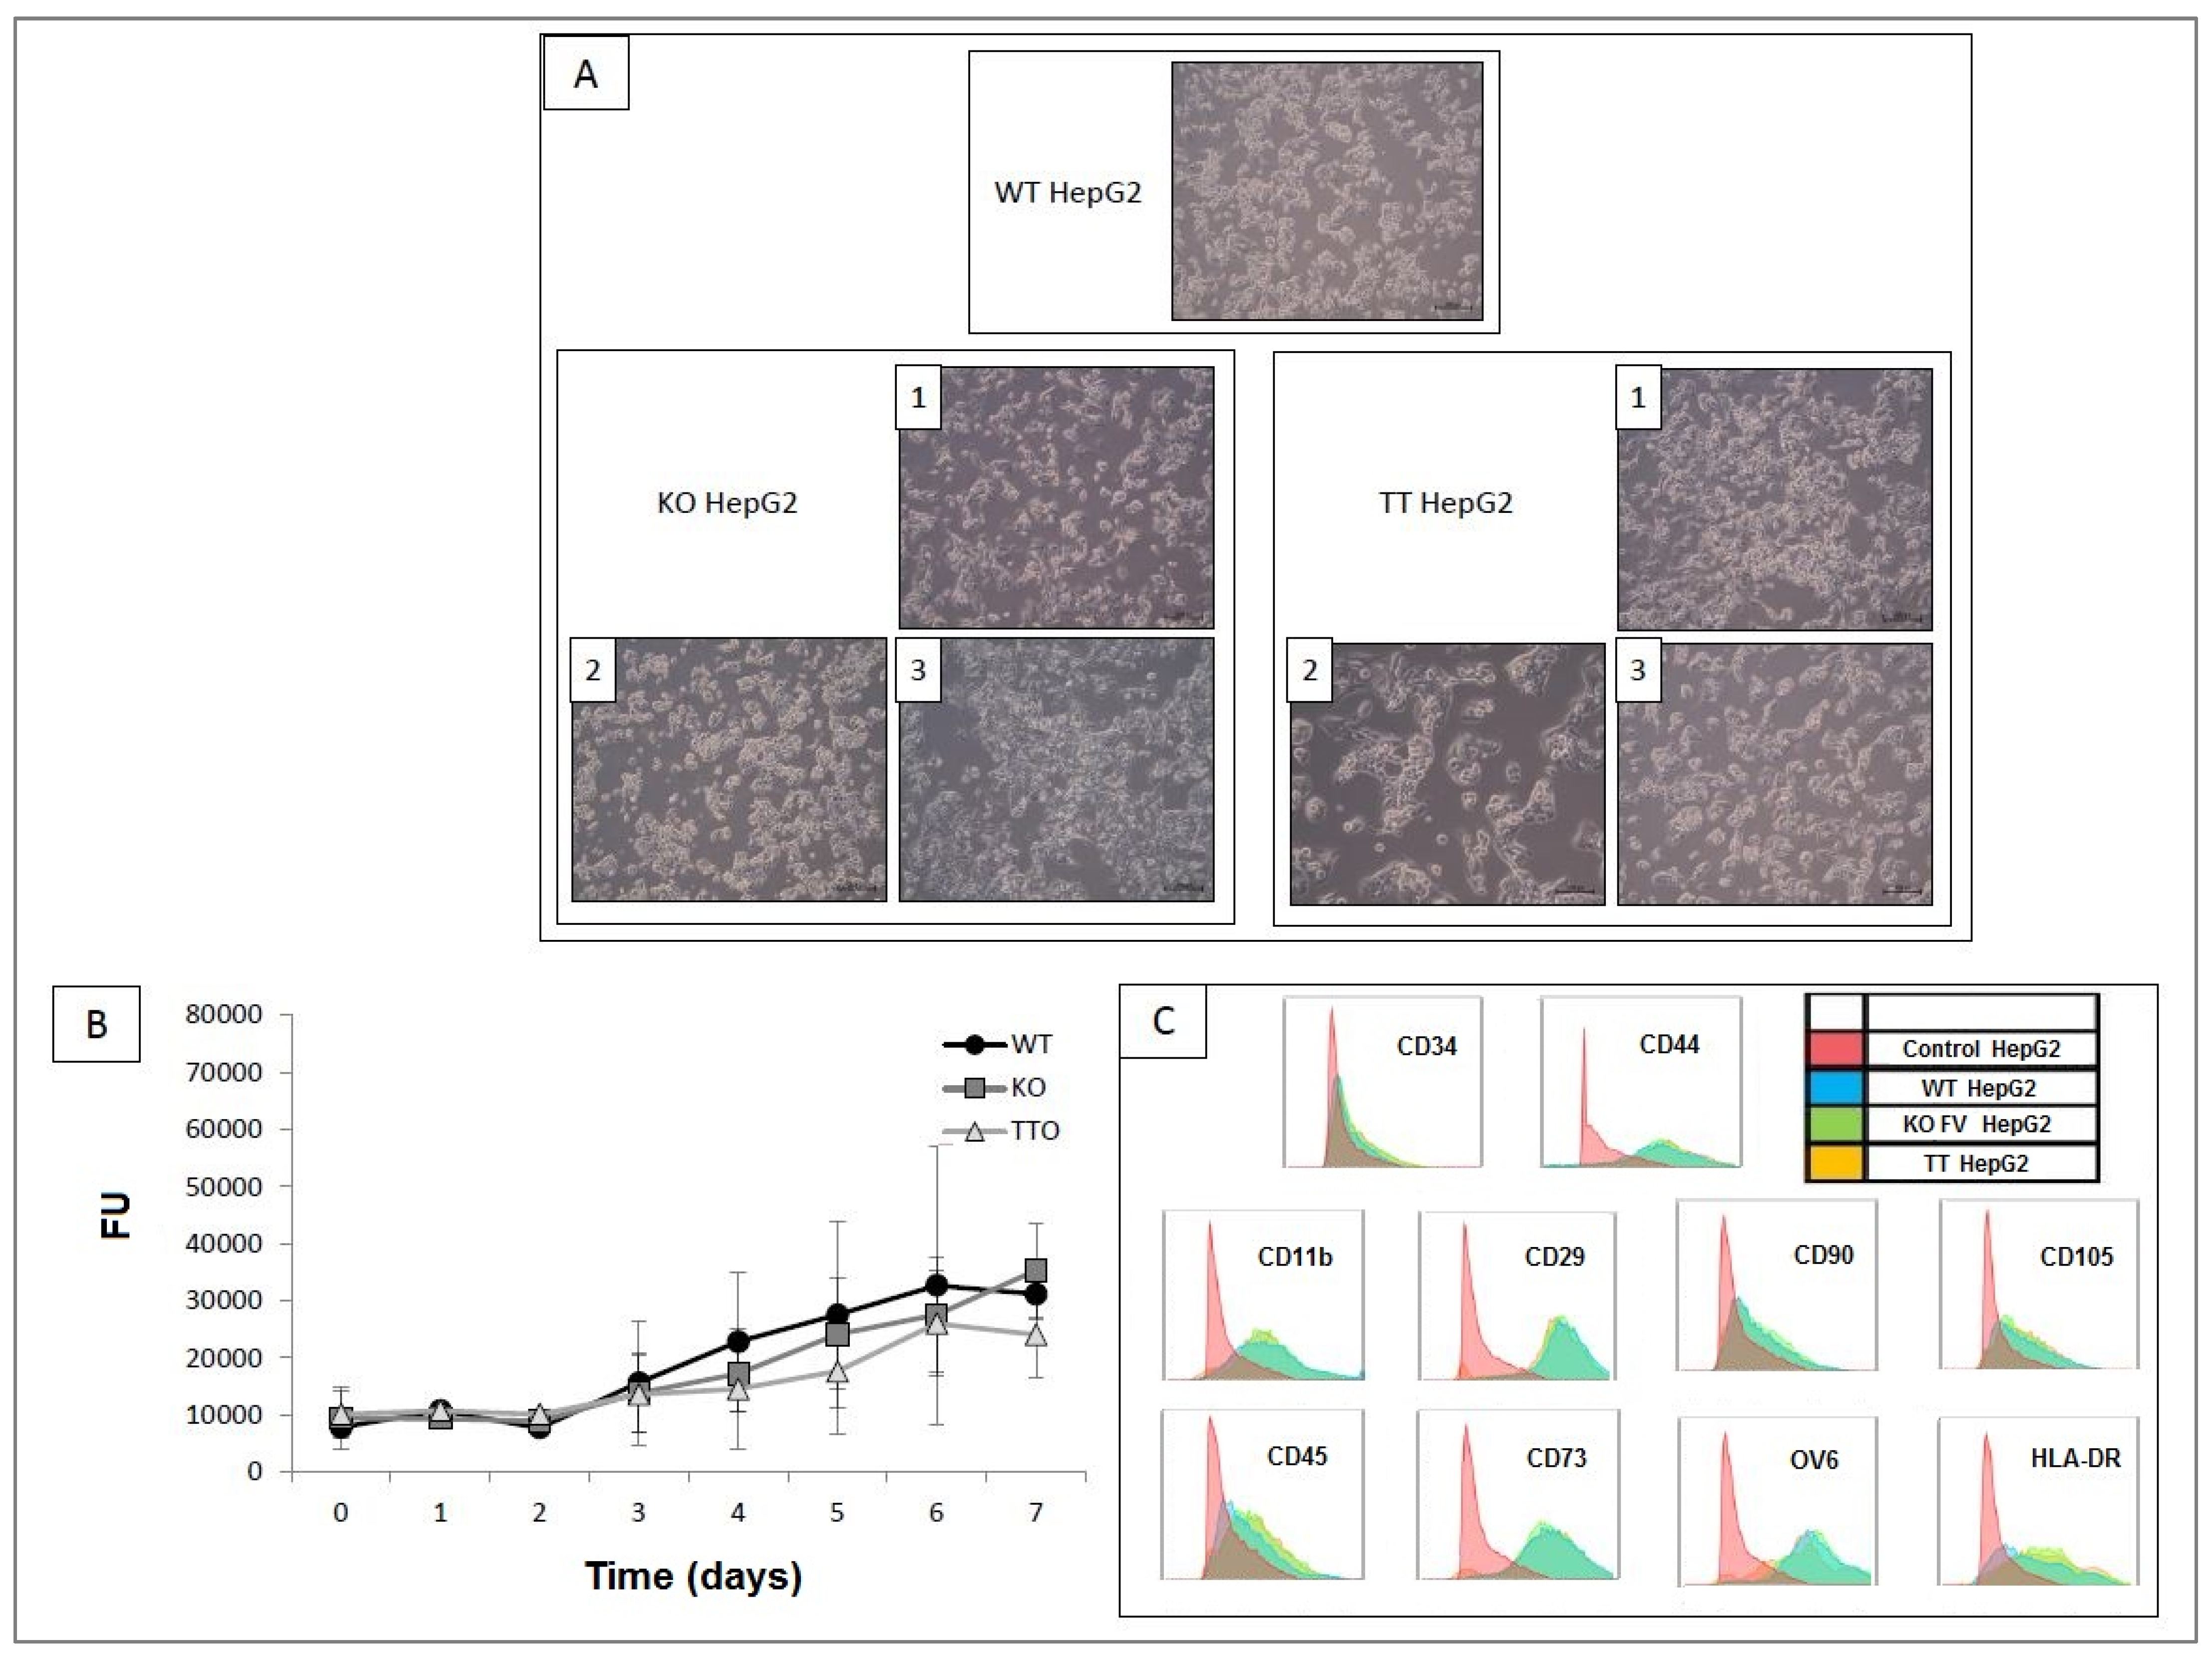
As shown in Figure 3A, no differences were observed between the cell lines in terms of size or form. As shown in Figure 3B, the proliferation assay did not reveal any significant differences between the three cell lines. Nor were there any differences observed in the expression of the membrane molecular markers analyzed between the WT HepG2, KO HepG2 and TT HepG2 cell lines (Figure 3C). Immuno-staining showed that all three HepG2 cell lines (WT, KO and TT) produced fluorescence-detectable FV proteins on immunostaining (Figure 4). The hASCs used as negative control did not produce any fluorescent signal. ELISA results showed a concentration of 0.69 ng/mL ± 0.05 of FV in the concentrated secretome of WT HepG2, 0.57 ng/mL ± 0.1 of FV in the concentrated secretome of KO HepG2 and 0.55 ng/mL ± 0.1 of FV in the concentrated secretome of TT HepG2. No signal was detected on ELISA for the negative controls, the oval cell line or the SW480 cell line (Figure 5).

2.4. Functional FV Synthesized by the Three Cell Lines

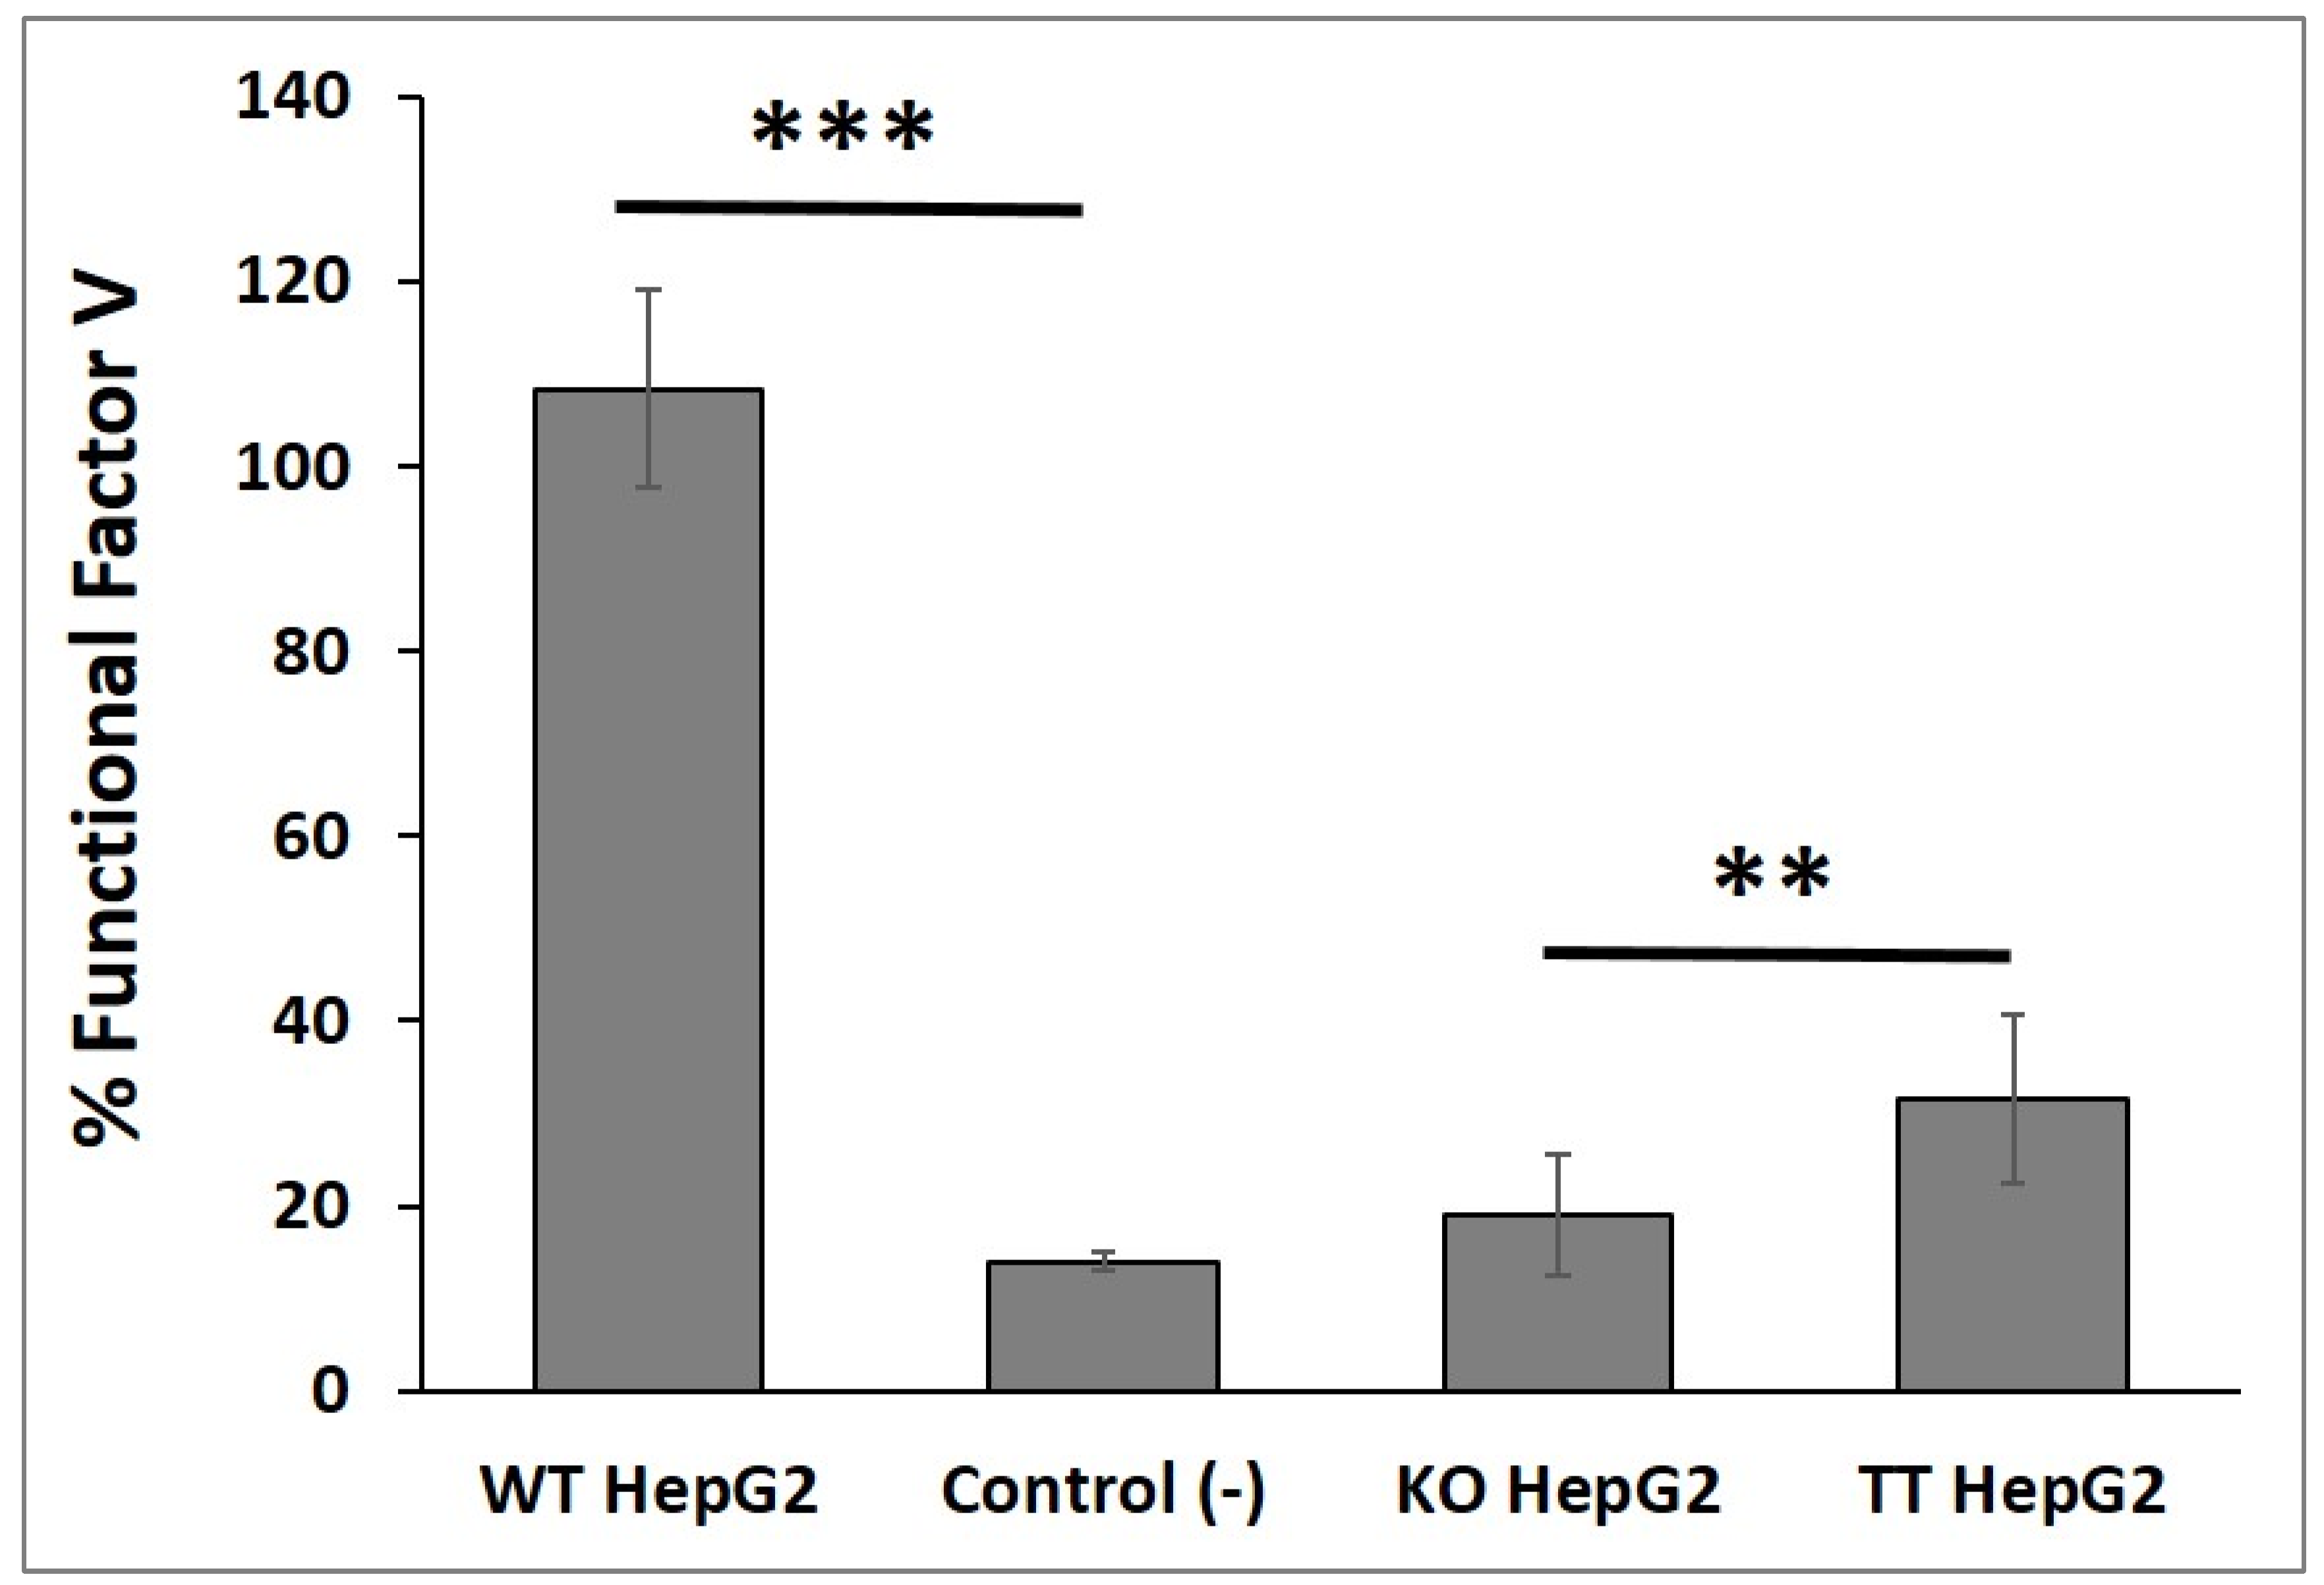
The functional FV synthesized by the WT HepG2, KO HepG2 and TT HepG2 cell lines was tested by means of a viscosity-based coagulation assay, which revealed that the concentrated secretome from the WT HepG2 cell line contained around 108% ± 10.7 functional FV (sample coagulation time was ±21.3 s), while the concentrated secretome from the KO HepG2 cell line contained 19% ± 6.5 of functional FV (sample coagulation time was ±31.2 s). The concentrated secretome of the TT HepG2 cell line contained 31.5% ± 9 functional FV (sample coagulation time: ±27.7 s), which was significantly different from the percentages obtained with the KO HepG2 cell line (p-value = 0.00125). No significant differences were found between the KO HepG2 cell line and the negative controls (Figure 6). The increment in functional FV levels (ΔFV) between the TT HepG2 and KO HepG2 cell lines was 40.2% ± 3.9, which was in line with the 41.4% DNA correction achieved.

2.5. Analysis of Off-Target TT Guides

An analysis of genomic regions was made through Sanger sequencing, including the exons and introns of some genes (Table 1). No mutations or alterations in the sequence of these genomic regions were detected. This could be indicative of the fact that our designed guides were specific for the F5 sequence, with no mutation or alteration being observed in the off-target genes analyzed.

3. Discussion

This study proposes a new advanced gene editing-based therapy for the correction of a new mutation in the F5 gene (c.3279G>A, p.Trp1093*), previously described by our research group [24]. A specific CRISPR/Cas9 technology was developed to treat coagulopathies arising from this mutation, which is protected by a Spanish patent (Ref. ES2785323B2) with international coverage [25,26].
The study was devoted to the development of a custom cell model based on the mutation present in the patient [24], who had a severe FV deficiency (<1%). A strategy to correct this mutation and restore full production of functional FV was designed. The patient presented with two nonsense mutations (3279G>A, p.Trp1093* and 2218C>T, p.Arg740*), which produced premature stop codons giving rise to FV deficiency. It was decided to choose mutation 3279G>A, p.Trp1093* for the therapeutic model proposed because mutation c.2218C>T, p.Arg740* was close to a thrombin binding domain, which made it difficult to perform small deletions without disrupting the production of the KO cell model. Moreover, in heterozygous conditions, the Trp1093* mutation reduces FV plasma levels to 21% [24].
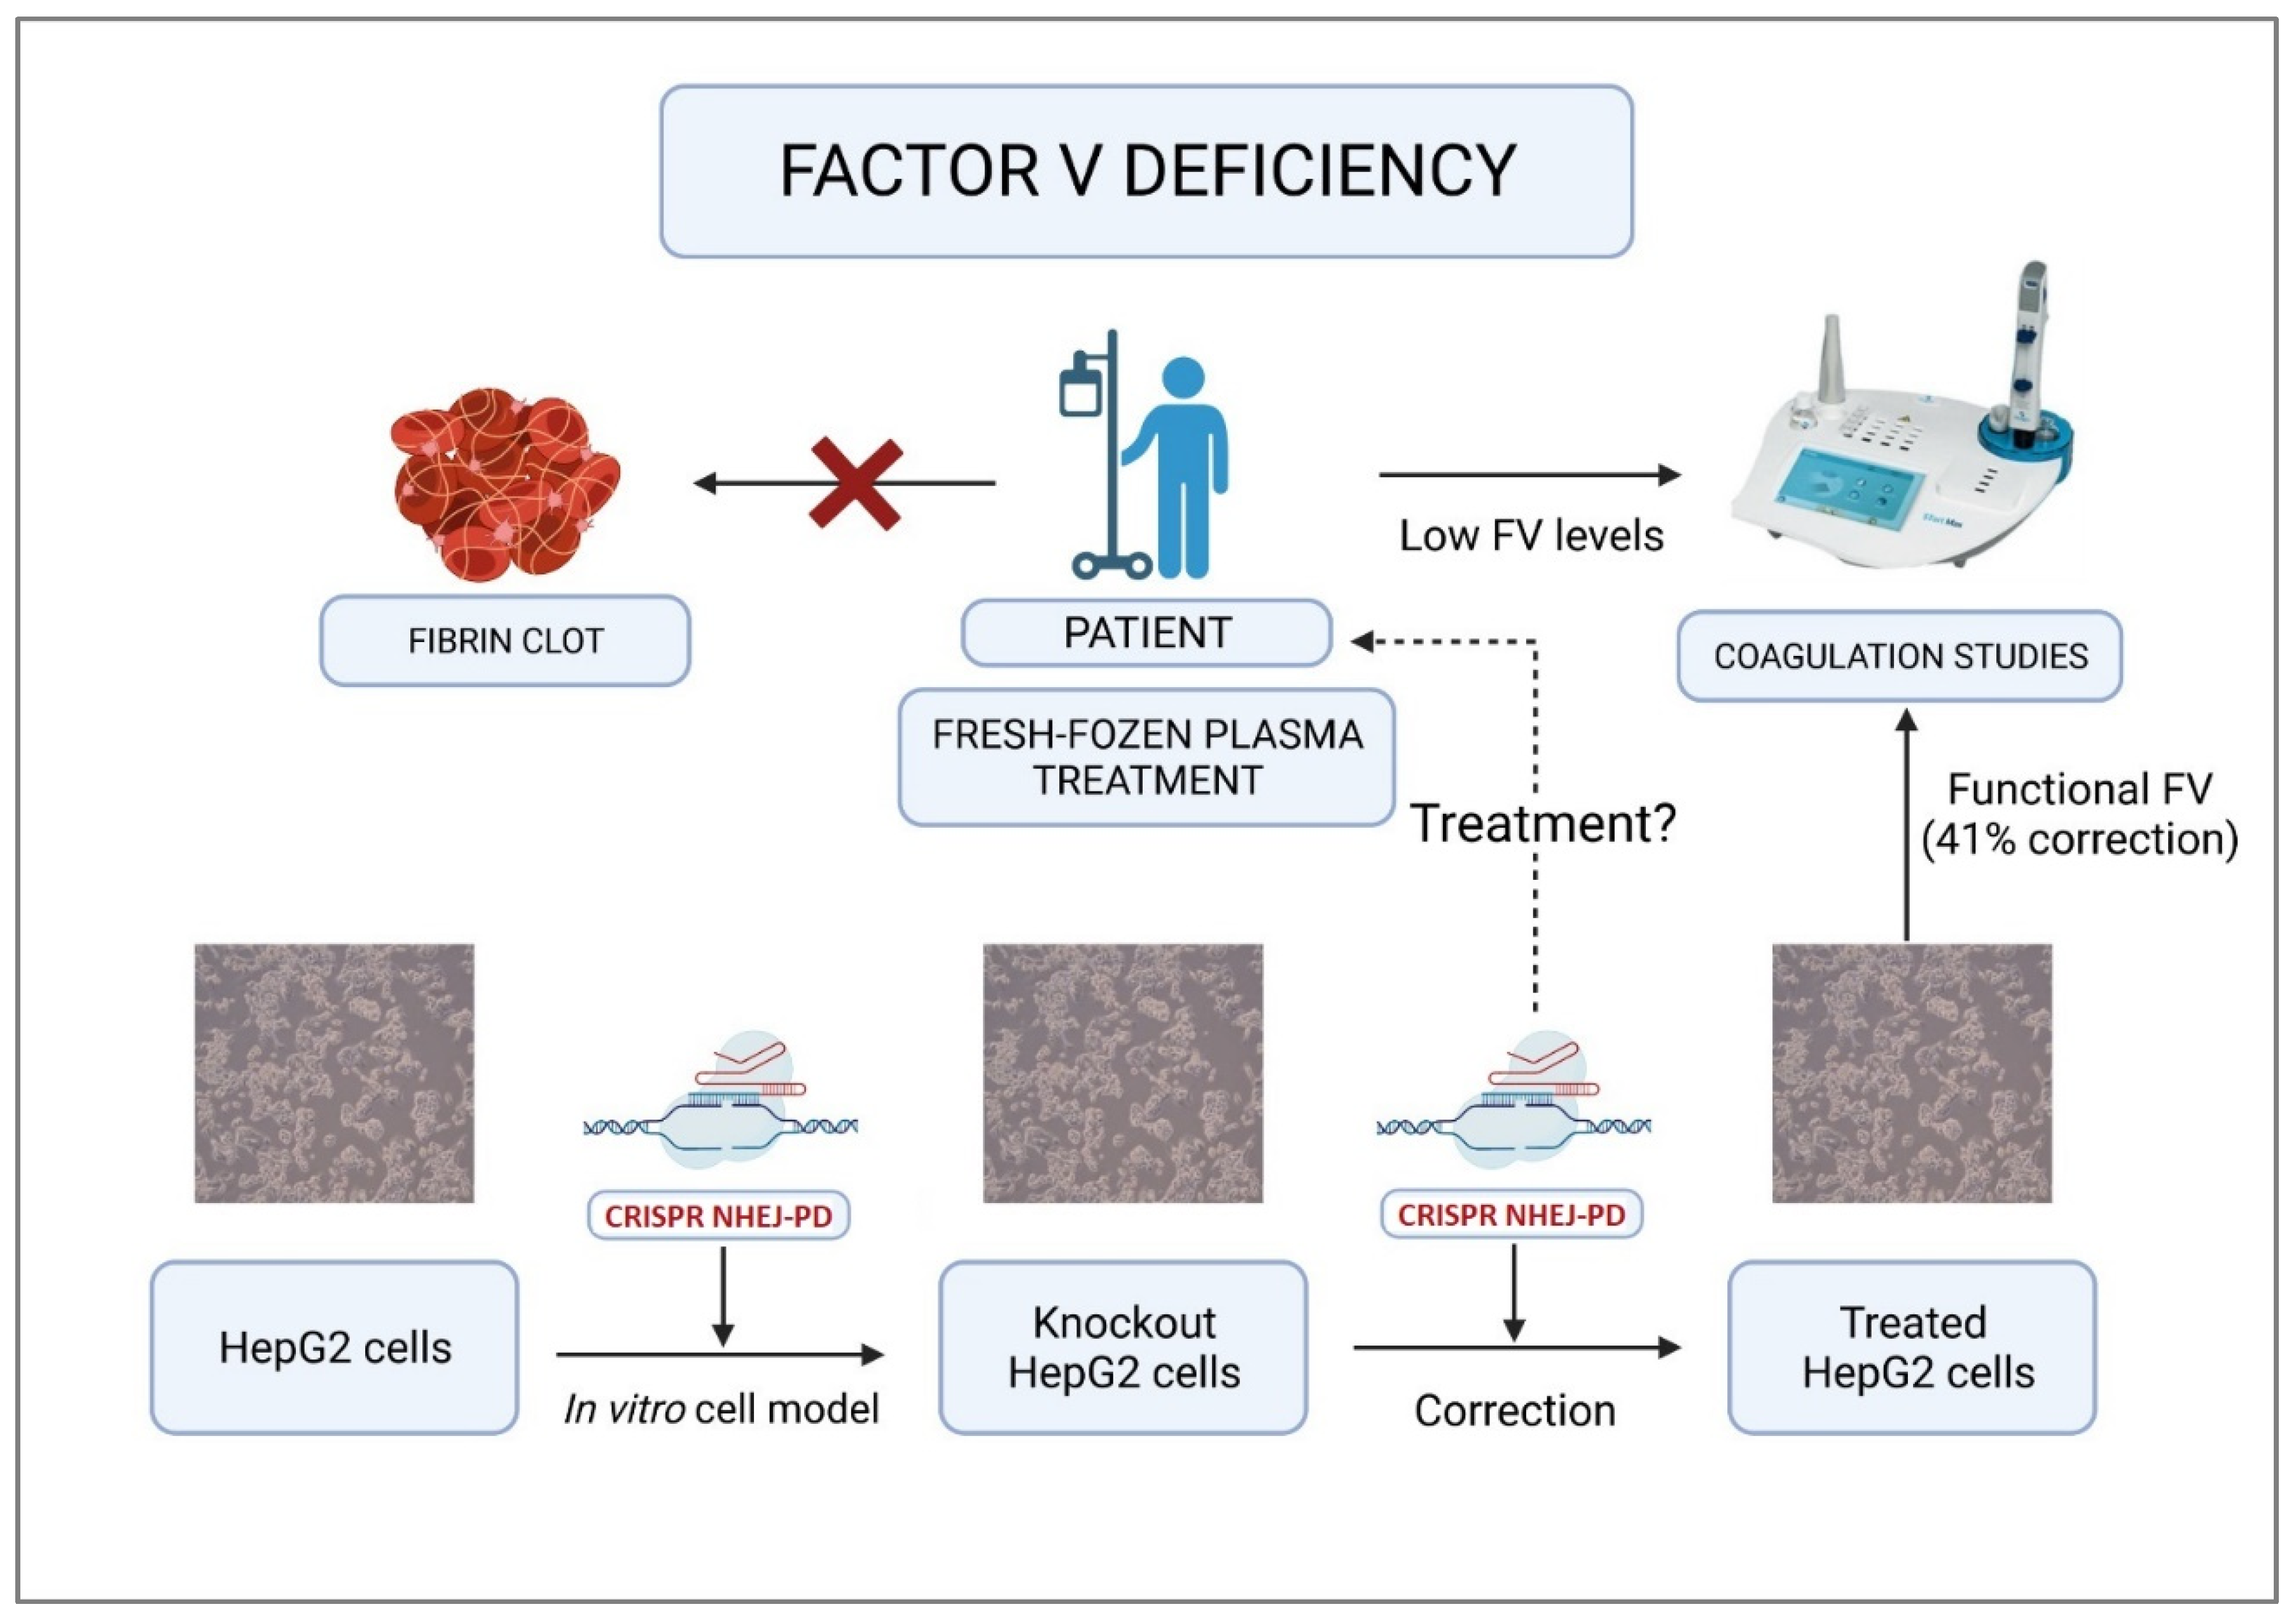
Developing a model of the kind proposed in this study is extremely useful given the difficulties inherent in working with samples from a patient with a hemorrhagic condition [27,28,29]. This model allows for testing custom treatments (in progress in our laboratory) for such patients (Figure 7).
HepG2 was selected for this study as it is a human immortalized cell line characterized by its robustness, durability, fast proliferation and potential to generate colonies from a single cell. It also expresses the F5 in a constitutive manner in a hepatic cell line, which is advantageous considering that FV is synthetized in the liver [30,31]. Primary WT hepatocyte cultures are too unstable and short-lasting to carry out gene editing and clonal culture isolation studies such as those conducted as part of this analysis [32,33,34].
Another option would have consisted in obtaining hepatocytes from induced pluripotent stem cells (iPSc) from the studied patient, but, as previously reported by the authors of this study, iPSc or mesenchymal stem cell-derived hepatocytes cannot produce FV as the process requires a tridimensional environment [35,36].
The purpose of this study was to obtain a simple and efficient cell model to test different in vitro strategies for correcting F5 mutations by gene editing or gene therapy using viral vectors.
The cell model used was developed through gene editing by means of a pair of guides (gRNA) based on the CRISPR/Cas9 technique. These guides direct the activity of the Cas9 protein to very specific sites in the genome [37], performing a precise deletion of the target sequences and an NHEJ repair. The use of two CRISPR gRNAs increases the efficacy of the NHEJ repair-mediated gene editing procedure. This pathway permits a higher editing efficacy than homologous repair using only a single guide. NHEJ-PD is based on the deletion of small DNA fragments through double DNA breaks mediated by two CRISPR guides. This typically gives rise to the removal of such fragments and to a perfect splicing of the two extremes. Apparently, any area in the genome may be subjected to CRISPR editing provided that it contains a PAM site (specific to each kind of Cas endonuclease used) and that the design of an RNA guide is possible [21]. The existence of numerous kinds of Cas endonucleases with different PAM sequences allows the formation of DNA double breaks anywhere in the genome and, consequently, the edition of any gene in the genome, with varying degrees of efficacy. This strategy is obviously faced with certain limitations associated with the design of the CRISPR guides used to induce double chain breaks. These include [22] the breaking distance between both guides. The optimal distance is between 23–148 bp. In general, a precise deletion is more likely when the distance between the guides is 30–500 bp. Orientation of the PAM sequence and of the sequence to be deleted within the guide is also very important; in/in orientations have been the most efficient for producing accurate deletions. It must be noted, however, that the distance between guides and the orientation of the PAM sequences have an impact on editing efficacy but not the ability to edit sequences.
KO gRNAs allowed us to produce a highly efficient KO FV cell model with a nonsense codon stop mutation similar to the one exhibited by the studied patient, in approximately the same area of exon 13 and resulting in the same phenotype. The heterogeneous culture was purified and enriched by harvesting, selecting and expanding a series of clones until homogeneous cell lines were obtained. Finally, an analysis was made in three KO clonal FV cell lines.
The same gene editing strategy, based on TT gRNAs, was used to correct the mutation in the three clones of the KO FV cell line. This resulted in the restoration of the frameshift of the F5 gene with an efficiency of 41% and in the generation of a functional FV cell line. The design of the guides and the PAM orientation influences the cleavage/splicing efficacy achieved by the NHEJ-PD strategy [22]. The guides used to induce the KO model (KO guide 5 and KO guide 1) (Figure 1B) were designed with the PAM sites facing the sequence to be deleted (in/in). Meanwhile, in the guides used to induce the correction (TT guide 4 and TT guide 2) (Figure 1D), PAM sites were outside the sequence (out/out), which results in a lower editing efficacy. This data having been obtained in optimal in vitro conditions, it must be noted that subsequent analyses with in vitro viral vectors using cell models, in vivo animal models or even clinical trials, will exhibit a lower efficacy given the complexity involved. In spite of that, it is to be expected that the functional FV levels obtained will be high enough to transform a severely FV deficient phenotype (<1% coagulation factor) into a moderately deficient FV phenotype (1–10% FV) or even a mild/asymptomatic FV phenotype (>10% FV) [10,11].
This strategy, which involves the deletion of different regions of exon 13, is similar to the one developed for the B domain (exon 14) of factor VIII [38], reducing its size and then packaging the B-domain deleted molecule into multiple viral vectors without loss of function [39].
Characterization of the three different cell lines (WT, KO and TT) did not show differences in cellular morphology, cellular proliferation or membrane molecular markers. These results seem to indicate that gene editing using the CRISPR/Cas9 method does not alter genes associated with the previously mentioned characteristics.
The analysis of the off-target genes did not show any modification in the genetic sequences derived from the unspecific editing of the CRISPR guides used, at least for the genes studied. The analysis of possible off-target sequences was conducted using the TT HepG2 cell line edited with the two CRISPR guides simultaneously using Sanger sequencing and database sequence comparison (NCBI, Ensembl and HGMD).
Due to the nature of this cell line, it is difficult to perform an NGS analysis to detect potential DNA or chromosome rearrangements. Indeed, the HepG2 cell line exhibits an aberrant karyotype with multiple DNA sequence rearrangements, duplications, deletions, polyploidies, etc., making it impossible to evaluate the potential CRISPR-induced chromosome or DNA rearrangements as these cells per se harbor multiple DNA alterations [40].
In the immunostaining and ELISA assays, no significant differences were found in the fluorescence or concentration of FV between the three cell lines studied (WT, KO and TT). This could indicate that the three cell lines were responsible for the production and secretion of FV, as detected by polyclonal antibody-based immuno-staining assays and ELISA. In the case of the KO cell line, the coagulometry assay found that the FV produced was not functional. Our hypothesis is that the KO cell line can synthesize and secrete a stable fragment of FV (heavy chain), as detected by polyclonal antibody-based assays, but not a complete protein (without a light chain). This is in line with previous reports arguing for the need to use monoclonal antibodies to target the region of interest, as polyclonal antibodies are not able to differentiate between a full and a truncated protein just on the basis of an ELISA assay [41]. This means that viscosity-based coagulometric assays should be the method of choice to quantify and evaluate the functionality of FV, and Sanger sequencing to locate the pathological mutations [24,42,43,44].
The FV obtained is, therefore, not functional because it lacks the light chain, which plays a very important role in the coagulation pathway as it enables FV to bind to platelet membrane phospholipids [5,6].
By the same token, although no significant differences were observed in FV concentrations between the TT cell line and the WT and KO cell lines, the functionality of FV in the TT cell line was found to be significantly higher than in the KO cell line. This shows that CRISPR/Cas9-based gene editing can effectively correct the pathological mutation and produce an FV protein with renewed functionality. There was no difference between the KO cell line and the negative controls in the fully functional FV production. This difference in the functionality of FV between the KO and the TT cell lines (ΔFV) was proportional to the editing efficiency obtained by using TT gRNAs.
Confirmation of the results obtained by Western blot was not possible using any of the usual protocols and antibodies (Life Technology, Thermofisher Scientific, Abcam, Abbexa). Nor was it possible to find any study or protocol that produced positive Western blot results using the HepG2 cell line secretome. These persistently negative results are in line with those found by other authors, who have detected a 330 kda band in the plasma of patients with a truncated FV protein, corresponding to the whole protein, but have been unable to detect bands derived from a potentially truncated protein [41].
There are currently no deficient FV animal models that allow the performance of preclinical studies that can be used to test the efficacy of our TT gRNAs in correcting the mutation of the F5 gene and restoring or increasing FV plasma levels in vivo. A few research groups have tried to develop deficient FV animal models, but such models have not been viable as none of the animals ever reach adulthood [45,46,47].
The next steps of our ongoing research will be focused on developing an FV-deficient animal model to test in vivo CRISPR-based gene editing and gene therapy protocols using lentiviral vectors.
In conclusion, a KO FV cell model with a mutation similar to the one carried by the patient studied was developed through NHEJ-PD with a CRISPR-based method. Moreover, an effective, precisely customized treatment, based on CRISPR gene editing, was developed to correct the mutation. The treatment proposed in this study succeeded in producing, at least in vitro, a functional FV protein. No molecular defect or alteration was found in the edited cells. This strategy could constitute a promising alternative for the development of custom pathologic models.

4. Materials and Methods

4.1. Clinical Characteristics of the Patient

This study analyzed a 14-year-old Caucasian female from Jaen, in the south of Spain, afflicted with severe FV deficiency (FV plasma level < 1%). She was a compound heterozygote presenting with two different mutations: one inherited from her father and the other from her mother. Both parents exhibited a mild FV deficiency. The ensuing cell model and CRISPR/Cas9-driven correction studies centered on a new mutation (c.3279G>A, p.Trp1093*), previously described by our group [24].

4.2. Mutational Analysis

Genetic maps were developed with the SnapGene 1.1.3. software (San Diego, CA, USA), and the genetic sequence and protein sequence (with their respective domains) were obtained from the NCBI (NM_000130.5), Ensembl (ENST00000367797.9) and HGMD databases.

4.3. Cell Lines

A HepG2 cell line [30,31] (isolated from a hepatocellular carcinoma), made available by Dr. Segovia’s laboratory at CIEMAT, Madrid, Spain, was cultured in Dulbecco’s Modified Eagle Medium (DMEM; Thermofisher Scientific, Walpham, MA, USA), 10% fetal bovine serum (FBS; Biowest, Nuaillé, France) and 1% penicillin/streptomycin (Thermofisher Scientific, Walpham, MA, USA). Cells were seeded at a density of 5 × 10⁴ cells/cm2. Incubation conditions were 37 °C, 5% CO2 and 95% relative humidity.
To obtain a homogeneous KO FV cell line, 200 cells were seeded in a 100 cm2 Petri dish following the electroporation phase. The colonies that formed two weeks later were transferred to 24-well dishes in order to expand the clones and obtain different clonal cell lines.

4.4. Design and Generation of CRISPR-Cas9 Tools

To obtain the KO FV in the HepG2 cell line (KO HepG2) as well as the so-called “treated HepG2” (TT HepG2) cells, where the KO mutation was eliminated or reversed, recourse was had to specific CRISPR guides (gRNA) in a ribonucleoprotein (RNP) format. The different crRNAs (CRISPR RNAs) were designed by applying the “Zhang lab’s” software (MIT) to the sequence between nucleotides 3100 and 3400, located at F5’s exon 13. Selection of these crRNAs was based on the location and distance between those two crRNAs in the sequence to be edited and on the score corresponding to crRNAs in terms of their guanine and cytosine contents, their self-assembling potential, etc.
gRNAs were formed by the combination of tracrRNA (trans-activating crRNA) and crRNA on the basis of the following protocol: 0.4 µL of 200 µM tracrRNA and 0.4 µL of 200 µM crRNA were incubated at 95 °C for 5 min. When the solution reached room temperature, 0.2 µL of 62 µM nuclease Cas9 (S. pyogenes, IDT) was added, and the mixture was incubated for at least 20 min. All reagents were obtained from Integrated DNA Technologies (IDT, Coralville, IA, USA).
The guides used for correcting the mutation (TT gRNAs) were patented as an effective in vitro treatment by the Spanish Patent and Trademark Office (ES 2785323 B2). Table 2 shows the gRNAs used in the cell lines (KO gRNAs; TT gRNAs).

4.5. Electroporation of the HepG2 Cell Line with RNPs

A total of 2 × 10⁵ cells were added to a solution comprising 2 µL of each RNP (gRNA + Cas9) and 20 µL of “SF cell line Nucleofector® solution” (Lonza, Basel, Switzerland). The resulting mixture was electroporated with an Amaxa 4D-Nucleofector system (Lonza, Basel, Switzerland), using a 20 µL volume under the EH-100 program.

4.6. Sequencing Analysis

The Sanger sequencing procedure was used to obtain the sequence of the different clones with a view to selecting (and subsequently expanding) the clone associated with the most accurate sequence. This sequencing method was used to determine the efficacy of the correction of the KO mutation and to analyze the sequences of potentially “off-target” genes as a way of establishing the degree of specificity of the guides. The Sanger sequencing procedure was carried out by the Genomics and Proteomics Unit of the Madrid Complutense University.
In order to sequence the HepG2 cell lines using the Sanger method, total genomic DNA was extracted from the cells using the “DNeasy® Blood and Tissue kit” (Qiagen, Germany) in accordance with the manufacturer’s instructions. The end-point PCR test (Biotools, Spain) was carried out using primers capable of amplifying 403 bp of WT HepG2; 368 bp of KO HepG2 and 319 bp of TT HepG2 of the human F5 (which contains the target region in the middle of the amplicon). For “off-target” genes, different primers with different amplicon sizes were used. Table 3 shows the primers used to amplify the F5 and the “off-target” genes, as well as the size of the amplicon.
The results of the Sanger sequencing assay were analyzed using the online version of Synthego’s ICE software (Synthego Corporation, Palo Alto, Santa Clara, CA, USA).

4.7. Characterization of HepG2 Cell Lines

A Zeiss Axiovert 40 C inverted microscope equipped with camera (Zeiss, Germany) was used to study the morphology of the different HepG2 cell lines. Images were captured with a 10× objective.
The proliferation index of the different HepG2 cell lines was evaluated using an Alamar blue assay (Alamar Blue™ Cell viability Reagent; Thermofisher Scientific, Walpham, MA, USA) in accordance with the protocol established by the manufacturer. A total of 1 × 10⁴ cells were briefly seeded in a 12-well dish with 10% FBS DMEM. The Alamar Blue reagent was subsequently diluted at 1:10 with 10% FBS DMEM. The solution was incubated for two hours, and a measurement was made at 560 nm excitation and 590 nm emission. This procedure was repeated daily for 7 days.
Molecular membrane markers were evaluated through flow cytometry using the antibodies shown in Table 4. The flow cytometer was a BD FACSCanto II system (BD biosciences. San José, CA, USA). A total of 2 × 10⁵ cells were used to test each molecular membrane marker; antibody concentrations were those recommended by the manufacturer. Between 2 µL and 10 µL of each antibody was added.

4.8. Factor V Analysis and Quantification

Intracellular FV immunostaining was applied to HepG2 cells using Abbexa’s Coagulation Factor V (FV) antibody (Abbexa, Cambridge, UK) and the DyLight™ 488 Donkey anti-rabbit IgG (minimal x-reactivity) Antibody (Biolegend, San Diego, CA, USA) in accordance with the manufacturers’ instructions. Staining with 4′,6-diamidino-2-phenylindole (DAPI) was also carried out in order to identify the nuclei. Images were captured with a LeicaSP2 confocal microscope (Leica Biosystems, Barcelona, Spain). Human adipose-derived stem cells (hASC) were used as control.
An FV ELISA assay was performed with 6.5× concentrated secretome samples. The concentration of the secretome was achieved by using concentrator columns (Vivaspin® 20, membrane: 100.000 MWCO PES (Sartorius. Stonehouse, UK) and by centrifuging 11 mL of secretome at 3000× g for 25 min. A WT HepG2 cell line was used as positive control, while mouse hepatic oval cells and the SW480 cell line were used as negative controls. The assay selected was the Human Factor V AssayMax ELISA Kit (Assaypro, St.Charles, MO, USA), which contained a polyclonal antibody. All the manufacturer’s instructions were followed. The data is shown as ng/mL of FV ± standard deviation.
A coagulation test was conducted using a STart Max II coagulometer (Stago, Barcelona, Spain) to ensure that the function of FV and its synthesis by different HepG2 cell lines were correct. FV function was tested using a 6.5× concentrated secretome from various cell lines.
The coagulation assay was conducted following the manufacturer’s instructions. A magnetic steel ball, 50 µL of FV-deficient human plasma (Stago, Barcelona, Spain) and 50 µL of concentrated secretome were placed on a tray. The solution was incubated for around one minute in the coagulometer’s “incubation zone”, after which 100 µL of Neoplastine Cl plus (Stago, Barcelona, Spain) was added. When the sample coagulated, the device calculated the clotting time and extrapolated the data to a previously prepared standard curve. The data is shown as a % of functional FV ± standard deviation. The oval and the SW480 cell line-derived concentrated secretomes were used as negative controls to evaluate coagulation.

4.9. Off-Target Analysis

The potentially unspecific editions of the guides were tested by means of an analysis of the “off-target” genes using PCR assays and Sanger sequencing protocols. Two “off-target” sequence selection criteria were adopted to reduce the number of genes to be analyzed, thereby making the study feasible. One of the criteria involved an analysis of sequences as potential “off-target” sequences located in any of the gene’s exons (regardless of any differences in the number of nucleotides between the CRISPR guides and the gene). The second criterion consisted of regarding sequences located in any of the gene’s introns as potentially “off-target” provided that the difference in the number of nucleotides between the CRISPR guides and the gene was equal or less than 4. The analysis of the potential off-target editions was performed on the TT HepG2 cell line edited using the two CRISPR guides simultaneously (TT guide 4 and TT guide 2).

4.10. Data Analysis

The data were analyzed using the Statgraphics centurion XVII software package (Statgraphics Technologies Inc, The Plains, VA, USA). Statistical analyses were carried out by means of a t-test, which considered differences statistically significant when the p-value was below 0.05 (*), 0.01 (**) and 0.001 (***). The data were expressed as mean ± standard deviation.

Author Contributions

L.J.S.: design of the experiments, data collection, data analysis and interpretation, drafting of the manuscript and preparation of figures and/or tables. M.G.-A.: design of the experiments, reviewing the drafts of the paper and searching for funding for the project. J.A.D.P.-M.: preparation of figures and critical review of data of evaluation of FV levels. J.C.S.: design of the experiments and reviewing the drafts of the paper. R.O.-S.: technical assistance in cytometry analysis. D.G.-O.: critical review of the study. A.L.: principal investigator of the project, conception and design of the experiments, data analysis, procurement of reagents/materials/analytical tools, drafting of the manuscript, preparation of figures and/or tables, reviewing of the drafts of the paper and search for funding. All authors have read and agreed to the published version of the manuscript.

Funding

This study was supported by the following public grants: Health Research, Instituto de Salud Carlos III; European Regional Development (RETICS RD 16/0011/00011 and RD 16/0011/0013); Directorate General for Research of the Community of Madrid (AvanCell-CM; Ref. S2017/BMD-3692); State Research Agency (PID2020-119637RB-I00). It also received funds from the Association for the Research and Cure of Factor V Deficiency (ASDEFAV).

Institutional Review Board Statement

Informed consent for FV testing was obtained from the patient involved the study at the time blood samples were taken for clinical purposes. The study was conducted in accordance with the Declaration of Helsinki, and approved by the Medical Ethics Committee of the Fundación Jiménez Díaz, Madrid, Spain (Protocol code No. PIC163_18FJD, 2018).

Conflicts of Interest

The authors have declared to have no conflict of interest with respect to this study.

References

  1. Segers, K.; Dahlbäck, B.; Nicolaes, G.A.F. Coagulation factor V and thrombophilia: Background and mechanisms. Thromb. Haemost. 2007, 98, 530–542. [Google Scholar] [CrossRef] [PubMed] [Green Version]
  2. Santamaria, S.; Reglińska-Matveyev, N.; Gierula, M.; Camire, R.M.; Crawley, J.T.B.; Lane, B.A.; Ahnström, J. Factor V has an anticoagulant cofactor activity that targets the early phase of coagulation. J. Biol. Chem. 2017, 292, 9335–9344. [Google Scholar] [CrossRef] [PubMed] [Green Version]
  3. van Doorn, P.; Rosing, J.; Duckers, C.; Hackeng, T.M.; Simioni, P.; Castoldi, E. Factor V Has Anticoagulant Activity in Plasma in the Presence of TFPIα: Difference between FV1 and FV2. Thromb. Haemost. 2018, 118, 1194–1202. [Google Scholar] [CrossRef] [Green Version]
  4. Tabibian, S.; Shiravand, Y.; Shams, M.; Safa, M.; Gholami, M.S.; Heydari, F.; Ahmadi, A.; Rashidpanah, J.; Dorgalaleh, A. A Comprehensive Overview of Coagulation Factor V and Congenital Factor V Deficiency. Semin. Thromb. Hemost. 2019, 45, 523–543. [Google Scholar] [CrossRef] [PubMed]
  5. Stoilova-McPhie, S.; Parmenter, C.D.J.; Segers, K.; Villoutreix, B.O.; Nicolaes, G.A.F. Defining the structure of membrane-bound human blood coagulation factor Va. J. Thromb. Haemost. 2008, 6, 76–82. [Google Scholar] [CrossRef] [PubMed]
  6. Ruben, E.A.; Rau, M.J.; Fitzpatrick, J.A.J.; Di Cera, E. Cryo-EM structures of human coagulation factors V and Va. Blood 2021, 137, 3137–3144. [Google Scholar] [CrossRef]
  7. Lippi, G.; Favaloro, E.J.; Montagnana, M.; Manzato, F.; Guidi, G.C.; Franchini, M. Inherited and acquired factor V deficiency. Blood Coagul. Fibrinolysis 2011, 22, 160–166. [Google Scholar] [CrossRef]
  8. Thalji, N.; Camire, R. Parahemophilia: New Insights into Factor V Deficiency. Semin. Thromb. Hemost. 2013, 39, 607–612. [Google Scholar] [CrossRef]
  9. Congenital Factor V Deficiency. The Portal for Rare Diseases and Orphan Drugs Orphanet. Available online: https://www.orpha.net/consor/cgi-bin/index.php?lng=EN (accessed on 26 March 2022).
  10. Peyvandi, F.; Di Michele, D.; Bolton-Maggs, P.H.B.; Lee, C.A.; Tripodi, A.; Srivastava, A. Project on Consensus Definitions in Rare Bleeeding Disorders of the Factor VIII/Factor IX Scientific and Standardisation Committee of the International Society on Thrombosis and Haemostasis. Classification of rare bleeding disorders (RBDs) based on the association between coagulant factor activity and clinical bleeding severity: Classification of rare bleeding disorders. J. Thromb. Haemost. 2012, 10, 1938–1943. [Google Scholar] [CrossRef]
  11. Jain, S.; Acharya, S.S. Management of rare coagulation disorders in 2018. Transfus. Apher. Sci. 2018, 57, 705–712. [Google Scholar] [CrossRef]
  12. Asselta, R.; Peyvandi, F. Factor V Deficiency. Semin. Thromb. Hemost. 2009, 35, 382–389. [Google Scholar] [CrossRef] [PubMed] [Green Version]
  13. Heger, A.; Svae, T.E.; Neisser-Svae, A.; Jordan, S.; Behizad, M.; Römisch, J. Biochemical quality of the pharmaceutically licensed plasma OctaplasLG® after implementation of a novel prion protein (PrPSc) removal technology and reduction of the solvent/detergent (S/D) process time. Vox Sang. 2009, 97, 219–225. [Google Scholar] [CrossRef] [PubMed]
  14. Cushing, M.M.; Asmis, L.; Calabia, C.; Rand, J.H.; Haas, T. Efficacy of solvent/detergent plasma after storage at 2–8 °C for 5 days in comparison to other plasma products to improve factor V levels in factor V deficient plasma. Transfus. Apher. Sci. 2016, 55, 114–119. [Google Scholar] [CrossRef] [PubMed]
  15. Spinella, P.C.; Borasino, S.; Alten, J. Solvent/Detergent-Treated Plasma in the Management of Pediatric Patients Who Require Replacement of Multiple Coagulation Factors: An Open-Label, Multicenter, Post-marketing Study. Front. Pediatr. 2020, 8, 572. [Google Scholar] [CrossRef] [PubMed]
  16. Ousterout, D.G.; Kabadi, A.M.; Thakore, P.I.; Majoros, W.H.; Reddy, T.E.; Gersbach, C.A. Multiplex CRISPR/Cas9-based genome editing for correction of dystrophin mutations that cause Duchenne muscular dystrophy. Nat. Commun. 2015, 6, 6244. [Google Scholar] [CrossRef] [Green Version]
  17. Bonafont, J.; Mencía, Á.; García, M.; Torres, R.; Rodríguez, S.; Carretero, M.; Chacón-Solano, E.; Modamio-Høybjør, S.; Marinas, L.; León, C.; et al. Clinically Relevant Correction of Recessive Dystrophic Epidermolysis Bullosa by Dual sgRNA CRISPR/Cas9-Mediated Gene Editing. Mol. Ther. 2019, 27, 986–998. [Google Scholar] [CrossRef]
  18. Canver, M.C.; Bauer, D.E.; Dass, A.; Yien, Y.Y.; Chung, J.; Masuda, T.; Maeda, T.; Paw, B.H.; Orkin, S.H. Characterization of Genomic Deletion Efficiency Mediated by Clustered Regularly Interspaced Palindromic Repeats (CRISPR)/Cas9 Nuclease System in Mammalian Cells. J. Biol. Chem. 2014, 289, 21312–21324. [Google Scholar] [CrossRef] [Green Version]
  19. Zheng, Q.; Cai, X.; Tan, M.H.; Schaffert, S.; Arnold, C.P.; Gong, X.; Chen, C.Z.; Huang, S. Precise gene deletion and replacement using the CRISPR/Cas9 system in human cells. Biotechniques 2014, 57, 115–124. [Google Scholar] [CrossRef]
  20. Geisinger, J.M.; Turan, S.; Hernandez, S.; Spector, L.P.; Calos, M.P. In vivo blunt-end cloning through CRISPR/Cas9-facilitated non-homologous end-joining. Nucleic Acids Res. 2016, 44, e76. [Google Scholar] [CrossRef] [Green Version]
  21. Hu, Y.; Li, W. Development and Application of CRISPR-Cas Based Tools. Front. Cell Dev. Biol. 2022, 10, 834646. [Google Scholar] [CrossRef]
  22. López-Manzaneda, S.; Ojeda-Pérez, I.; Zabaleta, N.; García-Torralba, A.; Alberquilla, O.; Torres, R.; Sánchez-Domínguez, R.; Torella, L.; Olivier, E.; Mountford, J.; et al. In Vitro and In Vivo Genetic Disease Modeling via NHEJ-Precise Deletions Using CRISPR-Cas9. Mol. Ther. Methods Clin. Dev. 2020, 19, 426–437. [Google Scholar] [CrossRef] [PubMed]
  23. Lunghi, B.; Castoldi, E.; Mingozzi, F.; Bernardi, F.; Castaman, G. A Novel Factor V Null Mutation Detected in a Thrombophilic Patient With Pseudo-Homozygous APC Resistance and in an Asymptomatic Unrelated Subject. Blood 1998, 92, 1463–1465. [Google Scholar] [CrossRef] [PubMed]
  24. Bernal, S.; Pelaez, I.; Alias, L.; Baena, M.; De Pablo-Moreno, J.A.; Serrano, L.J.; Camero, M.D.; Tizzano, E.F.; Berrueco, R.; Liras, A. High Mutational Heterogeneity, and New Mutations in the Human Coagulation Factor V Gene. Future Perspectives for Factor V Deficiency Using Recombinant and Advanced Therapies. Int. J. Mol. Sci. 2021, 22, 9705. [Google Scholar] [CrossRef] [PubMed]
  25. Patent “In Vitro Method to Recover the Expression of the F5 Gene Encoding Coagulation Factor V”. Invention Patent with Examination. Patent Recognition. UCM Office for the Transfer of Research Results. 2021. Available online: https://consultas2.oepm.es/pdf/ES/0000/000/02/78/53/ES-2785323_B2.pdf (accessed on 26 March 2022).
  26. In Vitro Method to Recover the Expression of the F5 Gene Encoding Coagulation Factor V. Transfer Catalog. UCM Office for the Transfer of Research Results. 2021. Available online: https://www.ucm.es/otri/complutransfer-metodo-in-vitro-para-recuperar-laexpresion-del-gen-f5-que-codifica-el-factor-v-de-la-coagulacion-1 (accessed on 26 March 2022).
  27. van Beek, D.; Funaki, B. Hemorrhage as a Complication of Percutaneous Liver Biopsy. Semin. Interv. Radiol 2013, 30, 413–416. [Google Scholar] [CrossRef] [PubMed] [Green Version]
  28. Midia, M.; Odedra, D.; Shuster, A.; Midia, R.; Muir, J. Predictors of bleeding complications following percutaneous image-guided liver biopsy: A scoping review. Diagn. Interv. Radiol. 2019, 25, 71–80. [Google Scholar] [CrossRef] [PubMed]
  29. Neuberger, J.; Patel, J.; Caldwell, H.; Davies, S.; Hebditch, V.; Hollywood, C.; Hubscher, S.; Karkhanis, S.; Lester, W.; Roslund, N.; et al. Guidelines on the use of liver biopsy in clinical practice from the British Society of Gastroenterology, the Royal College of Radiologists and the Royal College of Pathology. Gut 2020, 69, 1382–1403. [Google Scholar] [CrossRef]
  30. Wilson, D.B.; Salem, H.H.; Mruk, J.S.; Maruyama, I.; Majerus, P.W. Biosynthesis of coagulation Factor V by a human hepatocellular carcinoma cell line. J. Clin. Investig. 1984, 73, 654–658. [Google Scholar] [CrossRef]
  31. HepG2 (Liver Hepatocellular Carcinoma) Cell Line. 2021. Available online: https://www.hepg2.com/ (accessed on 26 March 2022).
  32. Shulman, M.; Nahmias, Y. Long-term culture and coculture of primary rat and human hepatocytes. Methods Mol. Biol. 2013, 945, 287–302. [Google Scholar] [CrossRef] [Green Version]
  33. Thompson, W.L.; Takebe, T. Human liver model systems in a dish. Dev. Growth Differ. 2021, 63, 47–58. [Google Scholar] [CrossRef]
  34. Mizoi, K.; Arakawa, H.; Yano, K.; Koyama, S.; Kojima, H.; Ogihara, T. Utility of Three-Dimensional Cultures of Primary Human Hepatocytes (Spheroids) as Pharmacokinetic Models. Biomedicines 2020, 8, 374. [Google Scholar] [CrossRef]
  35. Serrano, L.J.; de la Torre, P.; Liras, A.; Flores, A.I. Cell therapy for factor V deficiency: An approach based on human decidua mesenchymal stem cells. Biomed. Pharmacother. 2021, 142, 112059. [Google Scholar] [CrossRef] [PubMed]
  36. Pettinato, G.; Lehoux, S.; Ramanathan, R.; Salem, M.M.; He, L.X.; Muse, O.; Flaumenhaft, R.; Thompson, M.T.; Rouse, E.A.; Cummings, R.D.; et al. Generation of fully functional hepatocyte-like organoids from human induced pluripotent stem cells mixed with Endothelial Cells. Sci. Rep. 2019, 9, 8920. [Google Scholar] [CrossRef] [PubMed] [Green Version]
  37. Charpentier, E.; Doudna, J.A. Rewriting a genome. Nature 2013, 495, 50–51. [Google Scholar] [CrossRef] [PubMed]
  38. Zheng, C.; Zhang, B. Combined deficiency of coagulation factors V and VIII: An update. Semin. Thromb. Hemost. 2013, 39, 613–620. [Google Scholar] [CrossRef] [Green Version]
  39. Gong, J.; Chung, T.H.; Zheng, J.; Zheng, H.; Chang, L.J. Transduction of modified factor VIII gene improves lentiviral gene therapy efficacy for hemophilia A. J. Biol. Chem. 2021, 297, 101397. [Google Scholar] [CrossRef]
  40. Zhou, B.; Ho, S.S.; Greer, S.U.; Spies, N.; Bell, J.M.; Zhang, X.; Zhu, X.; Arthur, J.G.; Byeon, S.; Pattni, R.; et al. Haplotype-resolved and integrated genome analysis of the cancer cell line HepG2. Nucleic Acids Res. 2019, 47, 3846–3861. [Google Scholar] [CrossRef] [Green Version]
  41. Ajzner, E.; Balogh, I.; Haramura, G.; Boda, Z.; Kalmár, K.; Pfliegler, G.; Dahlbäck, B.; Muszbek, L. Anti-factor V auto-antibody in the plasma and platelets of a patient with repeated gastrointestinal bleeding. J. Thromb. Haemost. 2003, 1, 943–949. [Google Scholar] [CrossRef] [Green Version]
  42. Su, K.; Wang, L.; Wang, M.; Wang, H. A novel mutation (Ser951LeufsTer8) in F5 gene leads to hereditary coagulation factor V deficiency. Blood Coagul. Fibrinolysis 2021, 32, 140–145. [Google Scholar] [CrossRef]
  43. Luo, S.; Liu, S.; Xu, M.; Li, X.; Zhang, H.; Jin, Y.; Yang, L.; Wang, M. Analysis of phenotype and genotype of a family with hereditary coagulation factor V deficiency caused by the compound heterozygous mutations. Blood Coagul. Fibrinolysis 2020, 31, 485–489. [Google Scholar] [CrossRef]
  44. Al-Numair, N.S.; Ramzan, K.; Saleh, M.; Alzahrani, H.; Tarawah, A.; Abu-Douleh, E.; Elbaik, L.; Imtiaz, F.; Owaidah, T.M. First description of the molecular and clinical characterization of hereditary factor V deficiency in Saudi Arabia: Report of four novel mutations. Blood Coagul. Fibrinolysis 2019, 30, 224–232. [Google Scholar] [CrossRef]
  45. Cui, J.; O’Shea, K.S.; Purkayastha, A.; Saunders, T.L.; Ginsburg, D. Fatal haemorrhage and incomplete block to embryogenesis in mice lacking coagulation factor V. Nature 1996, 384, 66–68. [Google Scholar] [CrossRef] [PubMed] [Green Version]
  46. Wang, X. Translational Animal Models in Drug Discovery and Development; Bentham Science Publishers: New York, NY, USA, 2018. [Google Scholar]
  47. Weyand, A.C.; Grzegorski, S.J.; Rost, M.S.; Lavik, K.I.; Ferguson, A.C.; Menegatti, M.; Richter, C.E.; Asselta, R.; Duga, S.; Peyvandi, F.; et al. Analysis of factor V in zebrafish demonstrates minimal levels needed for early hemostasis. Blood Adv. 2019, 3, 1670–1680. [Google Scholar] [CrossRef] [PubMed] [Green Version]
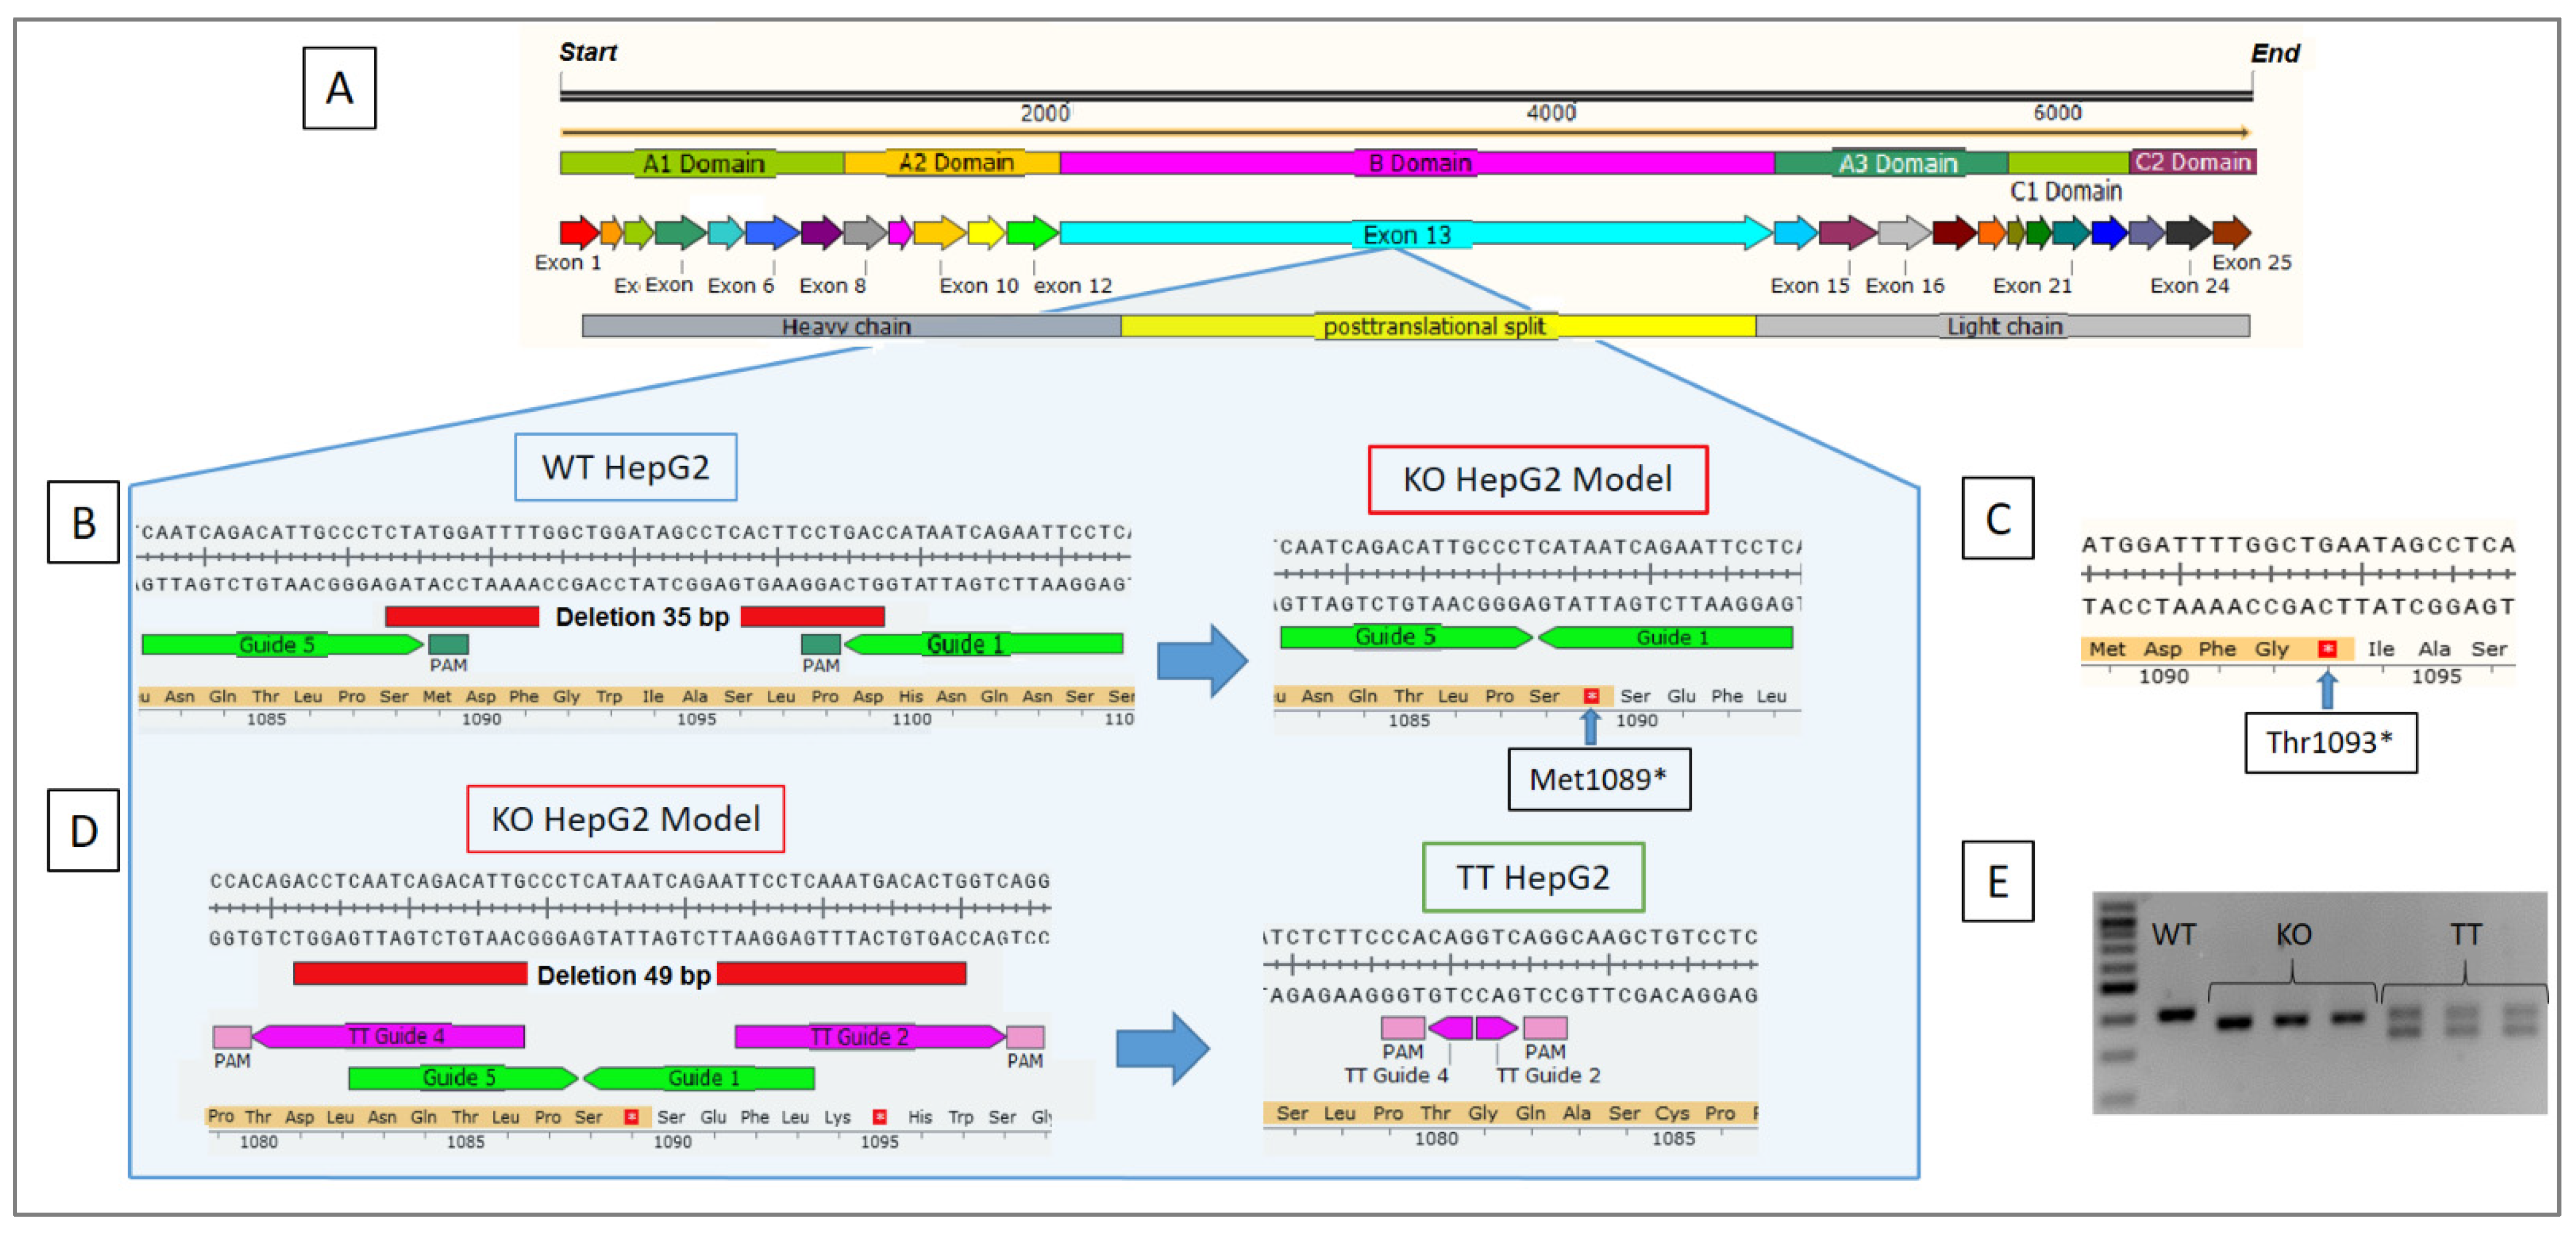
Figure 1. Gene editing strategy. (A) Structure of coagulation factor V. (B) KO HepG2 model development, simulating the similar mutation exhibited by the patient. (C) Patient’s Thr1093* pathological mutation. (D) Correction of the pathological mutation to obtain a treated HepG2 cell line (TT HepG2). (E) End-point PCR for the fragment of the F5 gene on the wildtype HepG2 cell line, the three KO HepG2 clones (LO1, LO8 and LO9) and TT HepG2 (LO1, LO8 and LO9). A 100 bp FastGene molecular marker from Nippon genetics (Japan) was used.
Ijms 23 05802 g001
Figure 2. Sequencing of the different editing procedures performed in the F5 of the HepG2 cell line. (A) Editing efficiency of the WT HepG2 line for obtaining the KO HepG2 line (by deleting 35 bp). (B) Three clone KO HepG2 cell lines (LO1, LO8 and LO9) were homozygous for the deletion of 35 bp, giving rise to the formation of a codon stop. (C) Editing efficiency of the KO clones for canceling the mutation and restoring the gene’s frameshift, giving rise to a corrected TT HepG2 cell line. Indel: insertion/deletion. Analyses were developed with the online version of Synthego’s ICE software.
Ijms 23 05802 g002
Figure 3. Characterization of different HepG2 lines. (A) Morphological changes of different clones (1, 2 and 3) (scale bar, 200 μm). Representative images from different experiments. (B) Proliferation curve presented as mean ± SD (n = 4) (p < 0.05). (C) Flow cytometry for membrane markers: Unstained cells (in red), WT HepG2 (in blue), KO HepG2 (in green) and TT HepG2 (in orange). Representative images from three different experiments.
Ijms 23 05802 g003
Figure 4. Coagulation factor V immuno-staining of cell lines. (A) WT HepG2. (B) KO HepG2. (C) TT HepG2. (D) hASCs as negative control (scale bar, 50 μm). Representative images from three different experiments.
Ijms 23 05802 g004
Figure 5. Application of the Human Coagulation Factor V ELISA assay to different HepG2 cell lines (WT HepG2, KO HepG2 and TT HepG2). Control (−) Oval cells and SW480 as negative controls. Figure presented as mean ± SD (n = 3).
Ijms 23 05802 g005
Figure 6. Functional factor V coagulometry assay. Functional factor V secreted by different cell lines (WT HepG2, KO HepG2 and TT HepG2). Control (-): Oval cells and SW480 as negative controls. Figure presented as mean ± SD (n = 4) (*** p < 0.001; ** p < 0.01).
Ijms 23 05802 g006
Figure 7. Summary of strategies and perspectives of the treatment of factor V deficiency. Using CRISPR/Cas9-based gene editing, the FV-producing HepG2 cell line was modified, giving rise to an in vitro knockout cell model unable to produce functional FV. The same tool was used to treat the modified cells and thereby correct the resulting mutation. This led to the recovery of 41% of FV’s functionality. This technology could constitute a gene therapy that could potentially cure FV deficiency.
Ijms 23 05802 g007
Table 1. Off-target gene analysis.
TT gRNA 2 Off-Targets
GeneBpMismatches *
EXONSFTA34095
TFCP3965
KIF93875
ABLIM34964
GAS74645
INTRONiGPC44742
iPRKCH3823
iWDR44923
iWDFY43853
iZNRF34033
iEPC150013
iNRG34234
TT gRNA 4 Off-Targets
GeneBpMismatches *
EXONARID1A3844
RSPO23505
TREML13945
PPIL24035
GPR1144565
LYPD64054
SCL25A34725
SKIL3824
TENM44404
INTRONiRAD51B4052
iMYO184394
iTEM83884
iEEFSE4114
iFOXP14024
* Different nucleotides between gRNA CRISPR and the gene sequences. ARID1A: AT-rich interaction domain 1A; RSPO2: R-spondin 2; TREML1: triggering receptor type 1 expressed on myeloid cells; PPIL2: peptidylprolyl isomerase type 2; GPR114: adhesion G protein-coupled receptor G5; LYPD6: Ly6/PLAUR domain; SCL25A3: mitochondrial phosphate carrier protein; SKIL: SKI-like proto-oncogene; TENM4: teneurin transmembrane protein 4; iRAD51B: intron of RAD51 paralog B (recombinase); iMYO18: intron of Myosin 18; iTEM8: intron of anthrax toxin receptor 1; iEEFSE: intron of Eukaryotic elongation factor, selenocysteine-tRNA-specific; iFOXP1: intron of Forkhead box P1; SFTA3: surfactant-associated 3; TFCP: transcription factor CP; KIF9: kinesin family member 9; ABLIM3: action-binding LIM protein family member 3; GAS7: growth arrest-specific 7; iGPC4: intron of Glypican 4; iPRKCH: intron of protein kinase C eta; iWDR4: intron of WD repeat domain 4; iWDFY4: intron of WD repeat and FYVE domain-containing protein 4; iZNRF3: intron of zinc and ring finger 3; iEPC1: intron of enhancer of polycomb homolog 1; iNRG3: intron of neuregulin 3.
Table 2. gRNAs used in the HepG2 cell lines (KO gRNAs, TT gRNAs).
GuideSequencePAM
KO Guide 5CAATCAGACATTGCCCTCTATGG
KO Guide 1GAGGAATTCTGATTATGGTCAGG
TT Guide 4CAATGTCTGATTGAGGTCTGTGG
TT Guide 2TTCCTCAAATGACACTGGTCAGG
gRNA: RNA guide; KO: Knockout model HepG2; TT: treated HepG2.
Table 3. Primers used to amplify F5 and off-target genes.
PrimersBp Product
Gene Sequence 5′-3′WTKOTT
Factor VForwardGAGAAGCACACACACCATGC403368319
ReverseCTGTGGGGAAGGACTTGTGA
TT gRNA 2 off-targets
Gene Primer 5′-3′bp
EXONSFTA3ForwardCCAACAAGGGTACACACTGC409
ReverseTCTCAGAATTCCTCCCTGCG
TFCPForwardCAGCCTTCCTATGAGACAACCA396
ReverseGAACCAAAGGCAGCACACAG
KIF9ForwardGCTCCTGTCTTGGGTAGGTGG387
ReverseCCAAAGCTCCCTAGCCCTCTT
ABLIM3ForwardCAGGCTATGTAGTCCCTGAGC496
ReverseATCACCTGCAGAGGACCCAA
GAS7ForwardATGCCTGGAGAGGTCAGGAT464
ReverseCAGCCCTGCCATACACAAGA
INTRONiGPC4ForwardGACCTTGACCCCAGACAACT474
ReverseTTTGAGGGGGAGGAAGTGTTC
iPRKCHForwardCACTGATTTCACCCTTAGCAAACC382
ReverseTAGGGCGAAGCTTTACCTGG
iWDR4ForwardAGGTTGGCCTTGACTTTGGG492
ReverseCCAGTGTCCGAAAGGCAAAATG
iWDFY4ForwardATAGAGCATGTGGAGCCCTTG385
ReverseGGGAAGGGAGAAGGGCATTG
iZNRF3ForwardGGATCTCTTACCAGCCCCCT403
ReverseGATCCTCCACTTGCTGATGG
iEPC1ForwardTCTTGGAAAGTGTACATCTGAGG500
ReverseCAGGCTTGAAGGTCTGTTTACC
iNRG3ForwardTGATGTTGTAGCCTAGGGAAGT423
ReverseAGCAAACCTCTGCATCCATCT
TT gRNA 4 off-targets
Gene Primer 5′-3′bp
EXONARID1AForwardTGGGAAAGGAGCAACTCTGC384
ReverseTGTCCTTGCCTGAAAAGGCT
RSPO2ForwardAGCAATGGGCAGAGCCATTC350
ReverseATGTGAACCACACCTAACCTGA
TREML1ForwardGAGCCAGTGCCATTTCCTGA394
ReverseCCCCTTCGATTTAGTTTGGAGC
PPIL2ForwardCTGTTGTGCCACAGATTGCG403
ReverseATACAGCCCTCCCGGTGTAG
GPR114ForwardCAAAGATTGGGAGGTTCCGC456
ReverseAATGGGTCACTCAGTAGGCG
LYPD6ForwardAGGTCTGCACTTCTTGTTGTG405
ReverseTGGTATGGAACTTGGGCTGT
SCL25A3ForwardCGCAGGCATTTTTCCCTTGC472
ReverseGTCTGACATTCGCTCTTTACATGG
SKILForwardAAGTAGTCAGAGCTCGCTGG382
ReverseTGTAATCAGCCCACAGGATGG
TENM4ForwardGGCCCTTTTGACACTCACCA440
ReverseCACCTCCTGGCCATTCTCAC
INTRONiRAD51BForwardTCTGCCACTCCTGACTTCCT405
ReverseTCTTCCTAGTCACCTCGCCT
iMYO18ForwardTAGGGCTCATTGCAAGGAAGAT439
ReverseCCCCAGCCTCCAATCTGAC
iTEM8ForwardGCCAAGCGTGTAGCAGACT388
ReverseTGGATGTCTGCCAGCAAAGG
iEEFSEForwardGAAGACCTGCCTCTTCCTGA411
ReverseCCCTCCCCTTACCTTTTCCAC
iFOXP1ForwardTGATAGAACCTCGCTTGGGG402
ReverseTAGTCTCTGGACTGGTGTGGG
gRNA: RNA guide; KO: Knockout model HepG2; TT: treated HepG2; WT: wildtype HepG2. gRNA: RNA guide; SFTA3: surfactant-associated 3; TFCP: transcription factor CP; KIF9: kinesin family member 9; ABLIM3: action-binding LIM protein family member 3; GAS7: growth arrest-specific 7; iGPC4: intron of Glypican 4; iPRKCH: intron of protein kinase C eta; iWDR4: intron of WD repeat domain 4; iWDFY4: intron of WD repeat and FYVE domain-containing protein 4; iZNRF3: intron of zinc and ring finger 3; iEPC1: intron of enhancer of polycomb homolog 1; iNRG3: intron of neuregulin 3; ARID1A: AT-rich interaction domain 1A; RSPO2: R-spondin 2; TREML1: triggering receptor expressed on myeloid cells like 1; PPIL2: peptidylprolyl isomerase-like 2; GPR114: adhesion G protein-coupled receptor G5; LYPD6: Ly6/PLAUR domain-containing 6; SCL25A3: mitochondrial phosphate carrier protein; SKIL: SKI-like proto-oncogene; TENM4: teneurin transmembrane protein 4; iRAD51B: intron of RAD51 paralog B (recombinase); iMYO18: intron of myosin 18; iTEM8: intron of anthrax toxin receptor 1; iEEFSE: intron of Eukaryotic elongation factor, selenocysteine-tRNA specific; iFOXP1: intron of Forkhead box P1.
Table 4. Antibodies used for flow cytometry.
AntibodyManufacturerFluorochromeConcentrationRef.
CD90BiolegendPE50 µg/mL328,110
CD29BiolegendPerCP-Cy5.5400 µg/mL303,024
CD73BiolegendPE400 µg/mL344,004
CD45BiolegendFITC200 µg/mL304,006
CD34BiolegendAPC50 µg/mL343,608
HLADRBiolegendAPC200 µg/mL307,658
OV6Santa Cruz Bio.PE200 µg/mLSC-101863
CD11bBiolegendPerCP-Cy5.5200 µg/mL301,328
CD105BiolegendAPC100 µg/mL323,208
CD44BiolegendPE/Cy7100 µg/mL338,816
Publisher’s Note: MDPI stays neutral with regard to jurisdictional claims in published maps and institutional affiliations.