Article

The Serum Hepatitis B Virus Large Surface Protein as High-Risk Recurrence Biomarker for Hepatoma after Curative Surgery

1
Department of Pathology, National Cheng Kung University Hospital, College of Medicine, National Cheng Kung University, Tainan 70101, Taiwan
2
Department of Medical Laboratory Science and Biotechnology, College of Medicine, National Cheng Kung University, Tainan 70101, Taiwan
3
Division of Hematology and Oncology, Department of Internal Medicine, National Cheng Kung University Hospital, College of Medicine, National Cheng Kung University, Tainan 70101, Taiwan
4
Department of Internal Medicine, Taipei City Hospital, Taipei 10341, Taiwan
5
Institute of Basic Medical Science, College of Medicine, National Cheng Kung University, Tainan 70101, Taiwan
*
Author to whom correspondence should be addressed.
Int. J. Mol. Sci. 2022, 23(10), 5376; https://doi.org/10.3390/ijms23105376
Submission received: 13 April 2022 / Revised: 9 May 2022 / Accepted: 9 May 2022 / Published: 11 May 2022

Abstract

:
Chronic hepatitis B (CHB) virus infection is the most important cause of HCC and is also associated with tumor progression. The development of viral biomarkers for HCC prognosis is critical in evaluating relative risks to recurrence in the CHB HCC patients. We report that the large HBV surface protein (LHBS) expression increased in the tumors, implicating that it played a significant role in tumor development. To detect the LHBS in serum and evaluate its association with HCC progression, we developed a sandwich ELISA method for LHBS. The mouse monoclonal antibodies for the pre-S1, pre-S2, and HBS regions were in-house generated and constructed into a chemiluminescent sandwich ELISA system, which allowed sensitive and quantitative measurement of the protein. Using this ELISA assay, we estimated the expression of LHBS in CHB and HCC patients. We found that the serum LHBS level was correlated with the HBS but not the viral titer in serum, indicating that HBV surface proteins’ expression does not mainly depend on viral replication. Moreover, both serum LHBS and HBS levels were lower in the HCC patients than in the CHB. The liver LHBS signals, detected by immunohistochemical staining, showed significant correlations with the serum LHBS and HBS levels. In addition, the more elevated serum LHBS but not HBS level was significantly associated with cirrhosis and worse disease-free and overall survival rates, based on the multivariate analysis. Conclusion: LHBS plays a specific role in tumor progression and is an independent parameter associated with HCC recurrence. Serum LHBS represents a novel noninvasive biomarker for HCC patients with a worse prognosis after surgery.

1. Introduction

Chronic hepatitis B (CHB) virus infection is the most important cause of hepatocellular carcinoma (HCC) in many regions of the world. Currently, 2 billion people have been infected with HBV, and 350 million of them have CHB. HBV infection also results in 500,000 to 1.2 million deaths per year caused by chronic hepatitis, cirrhosis, and HCC, and is among the top 10 leading causes of death worldwide [1,2,3]. Because the responses to adjuvant chemotherapies and radiation are usually not good in HCC, tumor recurrence rates after curative hepatic resection are high [4]. Therefore, long-term monitoring of HCC progression after primary treatments is important. The identification of effective and reliable high-risk biomarkers for HCC progression remains a major challenge.
HBV oncoproteins have long been known to play a critical role for HCC progression [3]. Viral factors not only trigger pathological changes that lead to carcinogenesis but also enhance the proliferation and recurrence of tumors after primary treatments. Antiviral therapies have been shown to benefit HCC prognosis after primary cancer treatments such as surgery, radiofrequency ablation (RFA), and transarterial chemoembolization (TACE), suggesting that viral factors are consistent oncogenic players in multiple stages of HCC development [5,6]. Therefore, it is promising to identify high-risk HBV-related markers for recurrence that can be monitored frequently after primary treatments. The oncogenic HBX protein has long been shown to be closely related to HCC development by directly interacting with basal transcription factors and the acetyltransferase CBP/p300 [7]. HBX functions as a transcriptional transactivator of different host genes involved in cellular proliferation control, chromatin remodeling, and cell cycle progression [8,9]. Some studies have reported that HBX gene mutations are correlated with the prognosis of HCC, probably through their aberrant interactions with host carcinogenic pathways [10,11]. However, despite its significant role in HCC progression, HBX is rarely detectable in peripheral blood, compromising the feasibility of its use as a convenient biomarker for monitoring HCC patients after primary treatments.
Recent studies have also found that the large HBV surface (LHBS) protein is highly associated with HCC development [12]. LHBS contains the integral pre-S1, pre-S2, and S domains and binds to the HBV receptor sodium taurocholate co-transporting polypeptide (NTCP) on hepatocytes to facilitate viral entry and morphogenesis [13,14]. The accumulation of viral LHBS and its prevalent pre-S mutants in chronic HBV carriers triggers a sustained endoplasmic reticulum (ER) overload response, leading to ER stress-mediated cell proliferation, metabolic switching, and genomic instability, which are associated with pro-oncogenic effects [15,16,17,18]. We recently found that in contrast to that of small HBS, the expression of LHBS is maintained in HCC and likely plays an important role in promoting tumor progression [15]. It was found that the level of the major surface protein was lower in tumor samples than in the peritumor samples, in which the HBS signals were usually intense, suggesting that HBS gene expression was downregulated during carcinogenesis. However, in the tumor regions, similar to the nontumor regions, LHBS exhibited strong staining signals in most HCC cases, indicating that LHBS is continuously expressed in carcinogenesis and likely plays an important role in cancer progression [12,16,17]. It was reported that LHBS transgenic mice developed HCC, which suggested that LHBS is uniquely associated with HBV-related carcinogenic processes and the progression of liver cancer [18]. Therefore, it is likely that serum LHBS may also be related to the progression of liver cancer. LHBS is translated from the HBS gene, which produces three different surface proteins; thus, the detection of LHBS depends on protein assays rather than genetic testing. Therefore, we performed in-house development of a monoclonal antibody for the pre-S1 region and developed it into an LHBS ELISA kit. We found that the serum LHBS level is consistent with the liver cancer tissue LHBS level and can be considered an independent risk factor for liver cancer recurrence after surgery.

2. Materials and Methods

2.1. Patients

Fifty-three patients with HBV-related HCC who underwent hepatectomy between 2010 and 2017 and were being followed up at NCKU Hospital were recruited for this study. All patients were negative for HCV infection. The serum of these patients was tested for various HBV biomarkers, including HBsAg, DNA titer, and LHBS, which was tested by the assay developed in this study. Serum samples were obtained at the time of hepatectomy then analyzed for HBV viral load, HBsAg concentration, and pre-S mutant status. Archival paraffin blocks containing HCC and nontumor liver tissue were retrieved from the Department of Pathology at NCKUH and were subjected to histopathological analysis and to immunohistochemical analysis of LHBS and HBS expression. Sixty-five hepatitis B patients—33 HBeAg(+) patients and 32 HBeAg(−) patients—were also recruited for comparison. This study protocol was approved by the Human Experiment and Ethics Committee of NCKUH with the Institutional Review Board (ER-105-142, 08/01/2017). All the patients provided signed informed consent to use their surgical specimens for this research.

2.2. Generation and Purification of the Monoclonal Antibodies Specific for LHBS Pre-S and S Regions

To generate mouse antibodies specifically recognizing pre-S region of the HBV LHBS, the pre-S region gene sequence was cloned into the pET21b vector, and its expression was induced in the E. coli BL21 strain using the inducing chemical isopropyl β-D-1-thiogalactopyranoside (IPTG, 0.2 mM). The purified recombinant pre-S region protein was injected into BALB/c mice to produce pre-S-region-specific antibodies. To produce antibodies that recognize HBS, the HBS recombinant protein, purchased from Leadgene, Inc. (Tainan, Taiwan), was injected into mice to produce HBS-specific antibodies (Figure 1a). The immunized mice were sacrificed, and the splenocytes were used for hybridoma preparation. The hybridoma cells that expressed antibodies recognizing the target pre-S and S proteins were further subjected to serial limiting dilution procedures to generate monoclonal-antibody-producing hybridoma clones. The monoclonal antibodies were tested for their sensitivities/specificities for LHBS, HBS, and the pre-S1 region peptide spanning amino acids 21 to 47, the region previously reported to be highly antigenic [19,20]. The hybridoma clones that exhibited satisfactory sensitivities to and specificities for the target proteins were purified and intraperitoneally injected into mice for ascites fluid production. Finally, antibody-rich ascites fluid was harvested, and the monoclonal antibodies were purified using IgG beads. Some aliquots of these antibodies were also directly conjugated with biotin, as they were evaluated as detection antibodies in the sandwich ELISA system.

2.3. Determination of Antibody Sensitivities

To determine the antibody titers, 0.1 ng/μL of each antigen protein or peptide was coated onto each well of the 96-well ELISA plate and was then incubated at 4 °C overnight. The next day, the purified monoclonal antibodies were serially diluted 10-fold and added to the ELISA wells pre-coated with antigens prior to standard ELISA washing steps with phosphate buffered saline with Tween® 20 (PBST, pH 7.4). Antigen–antibody complex signals were detected by incubation with anti-mouse IgG secondary antibodies conjugated to horseradish peroxidase (HRP) followed by the chemiluminescent HRP substrate tetramethylbenzidine (TMB), and the signals were measured using an ELISA chemiluminescence reader. Additionally, to determine the antigen detection limits of the antibodies, the various antigen proteins were serially diluted 10-fold and were then coated onto the ELISA wells; antibodies (1:2000 dilution in PBST) were then added to the well, and standard chemiluminescence detection procedures were then performed. The calibration curves were plotted to determine the limit of detection (LOD), limit of quantification (LOQ), linear range, and limit of linearity (LOL) of the various antibodies for their specific antigen proteins [21].

2.4. DNA Sequencing of the Antibody Variable Genes

DNA sequencing of the antibody variable (V) genes in the pre-S1, pre-S2, and HBS-antibody-producing hybridoma cell lines was performed by Leadgene, Inc. (Tainan, Taiwan). Antibody monoclonality was confirmed in each cell line, and the DNA sequences of the framework region (FR) and the complementarity-determining region (CDR) in the antibody V region genes were demonstrated. The corresponding amino acid residues in these regions were determined based on the DNA sequences.

2.5. The Sandwich ELISA for LHBS Detection

The in-house-developed LHBS-specific antibody (clone N-term-7-21-5), which targets the pre-S1 region, was coated onto the ELISA wells and incubated at 4 °C overnight. The next day, standard normal serum or HBsAg(+) serum (5 μL serum + 98 μL 2% bovine serum albumin/well) was added to the wells. After sequential washing steps, the detection antibodies, which recognized the pre-S2 or HBS region, were added. The LHBS signals were finally visualized by chemiluminescence detection. The level of LHBS in the serum was quantified by plotting the signal values on a standard curve generated using the pre-S region recombinant protein in various concentrations. Moreover, the LHBS ELISA kit and respective antibodies developed in this study have been filed for US patent application (Appl. No. 63/217,300).

2.6. Detection of HBV Markers

The serum HBsAg level was detected using the HBsAg Abbott ARCHITECT® assay. The serum HBV viral load was determined using the COBAS® AmpliPrep/COBAS® TaqMan® HBV Test (Roche Diagnostics).

2.7. Immunohistochemical Staining and Interpretation

Immunohistochemistry was performed on 5 µm thick formalin-fixed, paraffin-embedded sections with primary antibodies against LHBS (clone N-term-7-21-5) (1:100) and HBS (T9, Thermo Scientific, Waltham, MA, USA) (1:50). Expression was scored according to the percentages of stained hepatocytes or HCC cells. The liver tissue from a known CHB case was used as positive control. For the negative control of the primary antibodies, the pre-immune mouse immunoglobulin was used. Cytoplasmic LHBS or HBS staining, including mild, moderate, and strong staining was considered positive. The procedures were performed with a Benchmark XT autostainer (Ventana Medical Systems, Oro Valley, AZ, USA). Staining in sections was visualized by an aminoethyl carbazole substrate kit (Zymed Laboratory, San Francisco, CA, USA). Counterstaining was carried out with hematoxylin.

2.8. Statistical Analysis

Between-group differences were compared by Mann–Whitney U test. The correlations between serum LHBS, HBS, viral load, and liver stain were assessed using Spearman’s rank correlation coefficient. Disease-free survival (DFS) and overall survival (OS) were calculated using the Kaplan–Meier method, and the log-rank test was used to assess the differences between groups. The thresholds of various clinicopathologic factors to divide them into low and high groups were chosen based on the ROC curve analysis. The threshold was basically the whole number closest to the best-fit threshold number. A Cox proportional hazards regression model was used to measure the independence of different factors. Cox regression was performed via forward stepwise analysis, and only the prognostic variables that were significant in the univariate analysis were included in the model. Finally, p values less than 0.05 were considered statistically significant.

3. Results

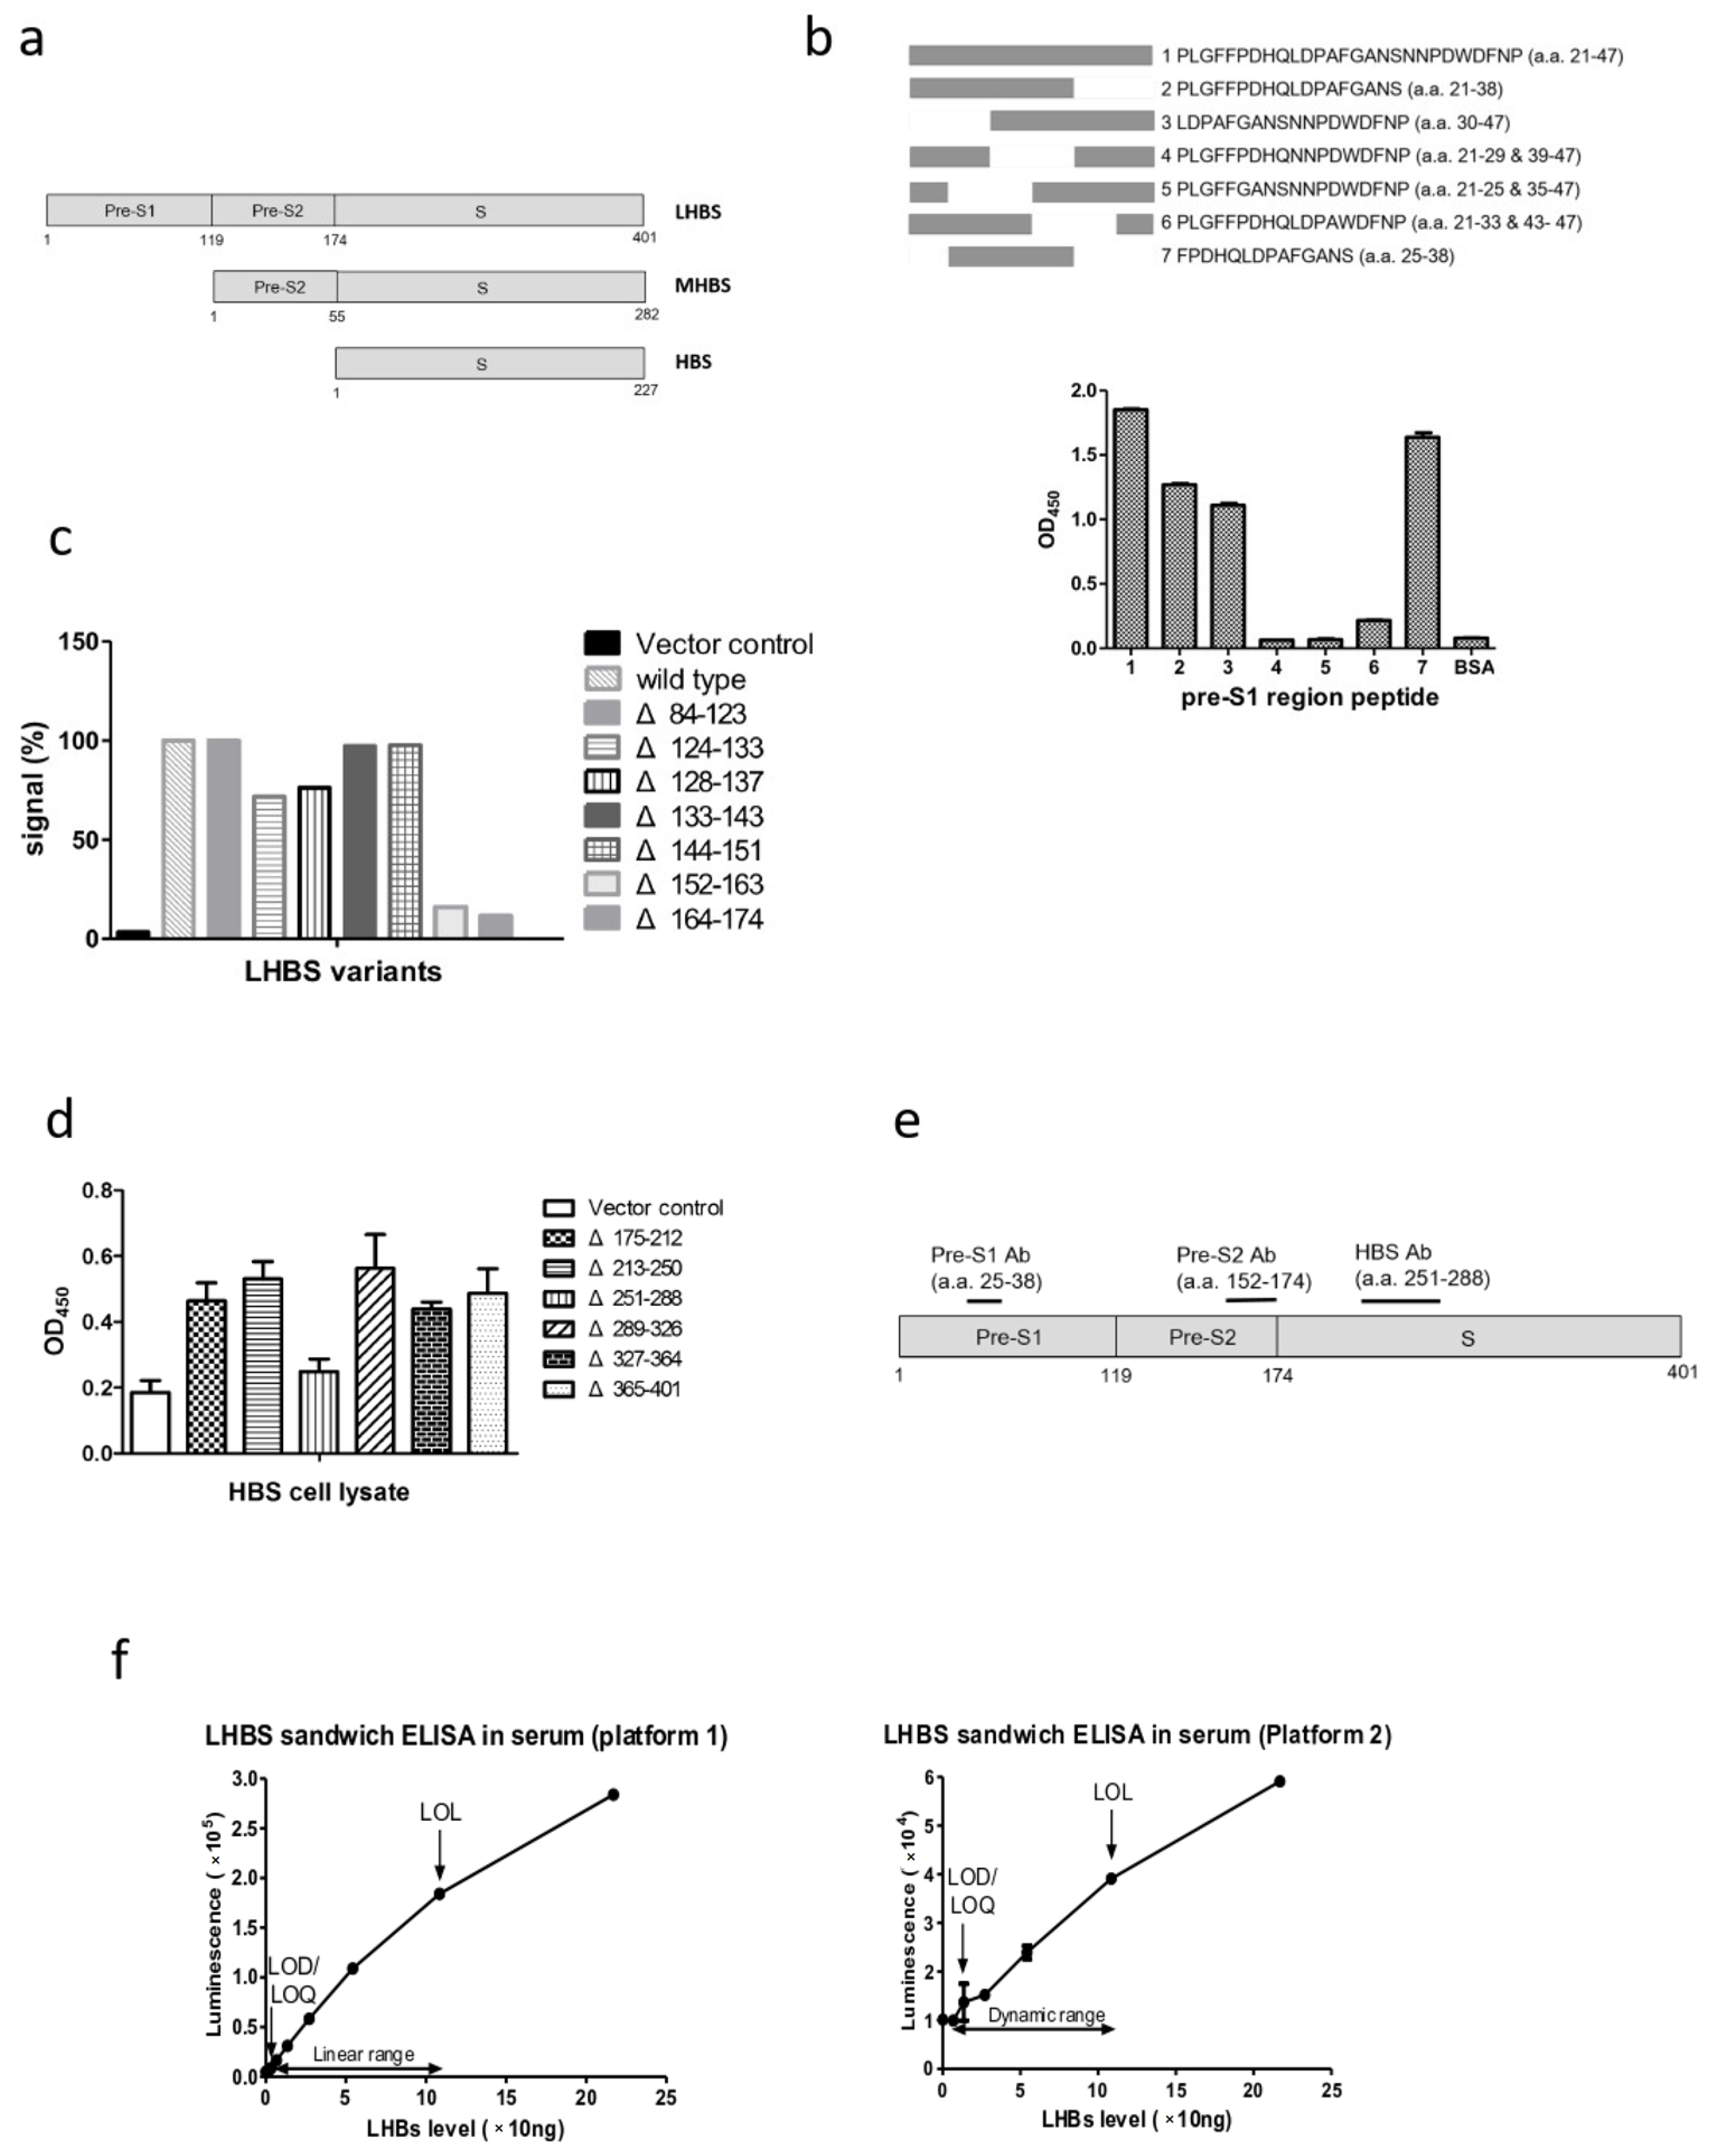
3.1. Establishment of the Chemiluminescence ELISA Kit for LHBS Quantification in Serum

The monoclonal antibodies generated in this study were analyzed for antigen recognition regions. For the pre-S1 region antibody, various oligopeptides spanning the region in the pre-S1 N-terminal containing amino acids 21 through 47, previously shown to be highly antigenic, were synthesized and tested for their relative affinities for the pre-S1 antibody [19,20]. The results indicated that the anti-pre-S1 antibody specifically recognized the peptide containing amino acids 25–38 in the sequence FPDHQLDPAFGANS compared with the adjacent protein regions (Figure 1b). For the anti-pre-S2 region antibody, lysates of 293T cells transfected with the LHBS gene with partial deletion of various pre-S regions were tested by ELISA for recognition by the antibody. The results showed that the anti-pre-S2 antibody recognized the full-length and different truncations, except that with deletions of a. a. residues 152–163 and 164–174 in the pre-S2 region, indicating that the epitope recognized by the anti-pre-S2 monoclonal antibody was likely located in the region surrounding a. a. 152–174 in the pre-S2 region (Figure 1c). The anti-HBS antibody recognized all LHBS truncations except that with deletion of a. a. 251–288, which was suggested to be the anti-HBS antibody recognition region (Figure 1d,e).
The mouse monoclonal antibodies specific for the following proteins were generated: pre-S1, pre-S2, and HBS. The amino acid compositions of the CDR1 to 3 in the variable regions of these antibodies were determined based on the DNA sequencing analysis (Table 1). The antibodies were first tested for their sensitivities to the recombinant target proteins. The anti-pre-S1 and anti-pre-S2 antibodies recognized the pre-S region E. coli recombinant protein well. For the anti-pre-S1 antibody, the LOQ and LOL values were 0.09 and 12.5 ng/mL, respectively, indicating that the dynamic range of detection was 0.09 to 12.5 ng/mL [21]. The anti-pre-S2 antibody also showed high sensitivity to the pre-S region protein, with the LOQ and LOL values of 0.04 and 1.56 ng/mL, respectively. Regarding the anti-HBS antibody, the LOQ and LOL values for the HBS recombinant protein were 0.06 and 50 ng/mL, respectively (Supplementary Figure S1). As these monoclonal antibodies presented with satisfactory sensitivities to and specificities for their target proteins, they were amplified on a large scale by ascites production, purified by the IgG columns, and conjugated to biotin for sandwich ELISA.
The monoclonal antibodies generated in this study were employed to develop a sandwich ELISA to detect LHBS in serum. The anti-pre-S1 antibody, which specifically recognized LHBS, was used as the coating antibody, whereas either the anti-pre-S2 or anti-HBS antibody was used as the detection antibody in the LHBS ELISA. Pooled HBsAg(+) patient sera with known concentrations of LHBS were used as the standard sample to test its performance. The LHBS sandwich ELISA with the pre-S2 detection antibody revealed an LOQ value of 13.5 ng/mL, and the linearity range was 13.5 to 108.5 ng/mL. In addition, the ELISA with the HBS detection antibody revealed an LOQ value of 1.7 ng/mL, and the linearity range was 1.7 to 108.5 ng/mL (Figure 1f). These data demonstrated that the LHBS sandwich ELISA using either the pre-S2 or HBS detection antibody could detect LHBS in serum sensitively.

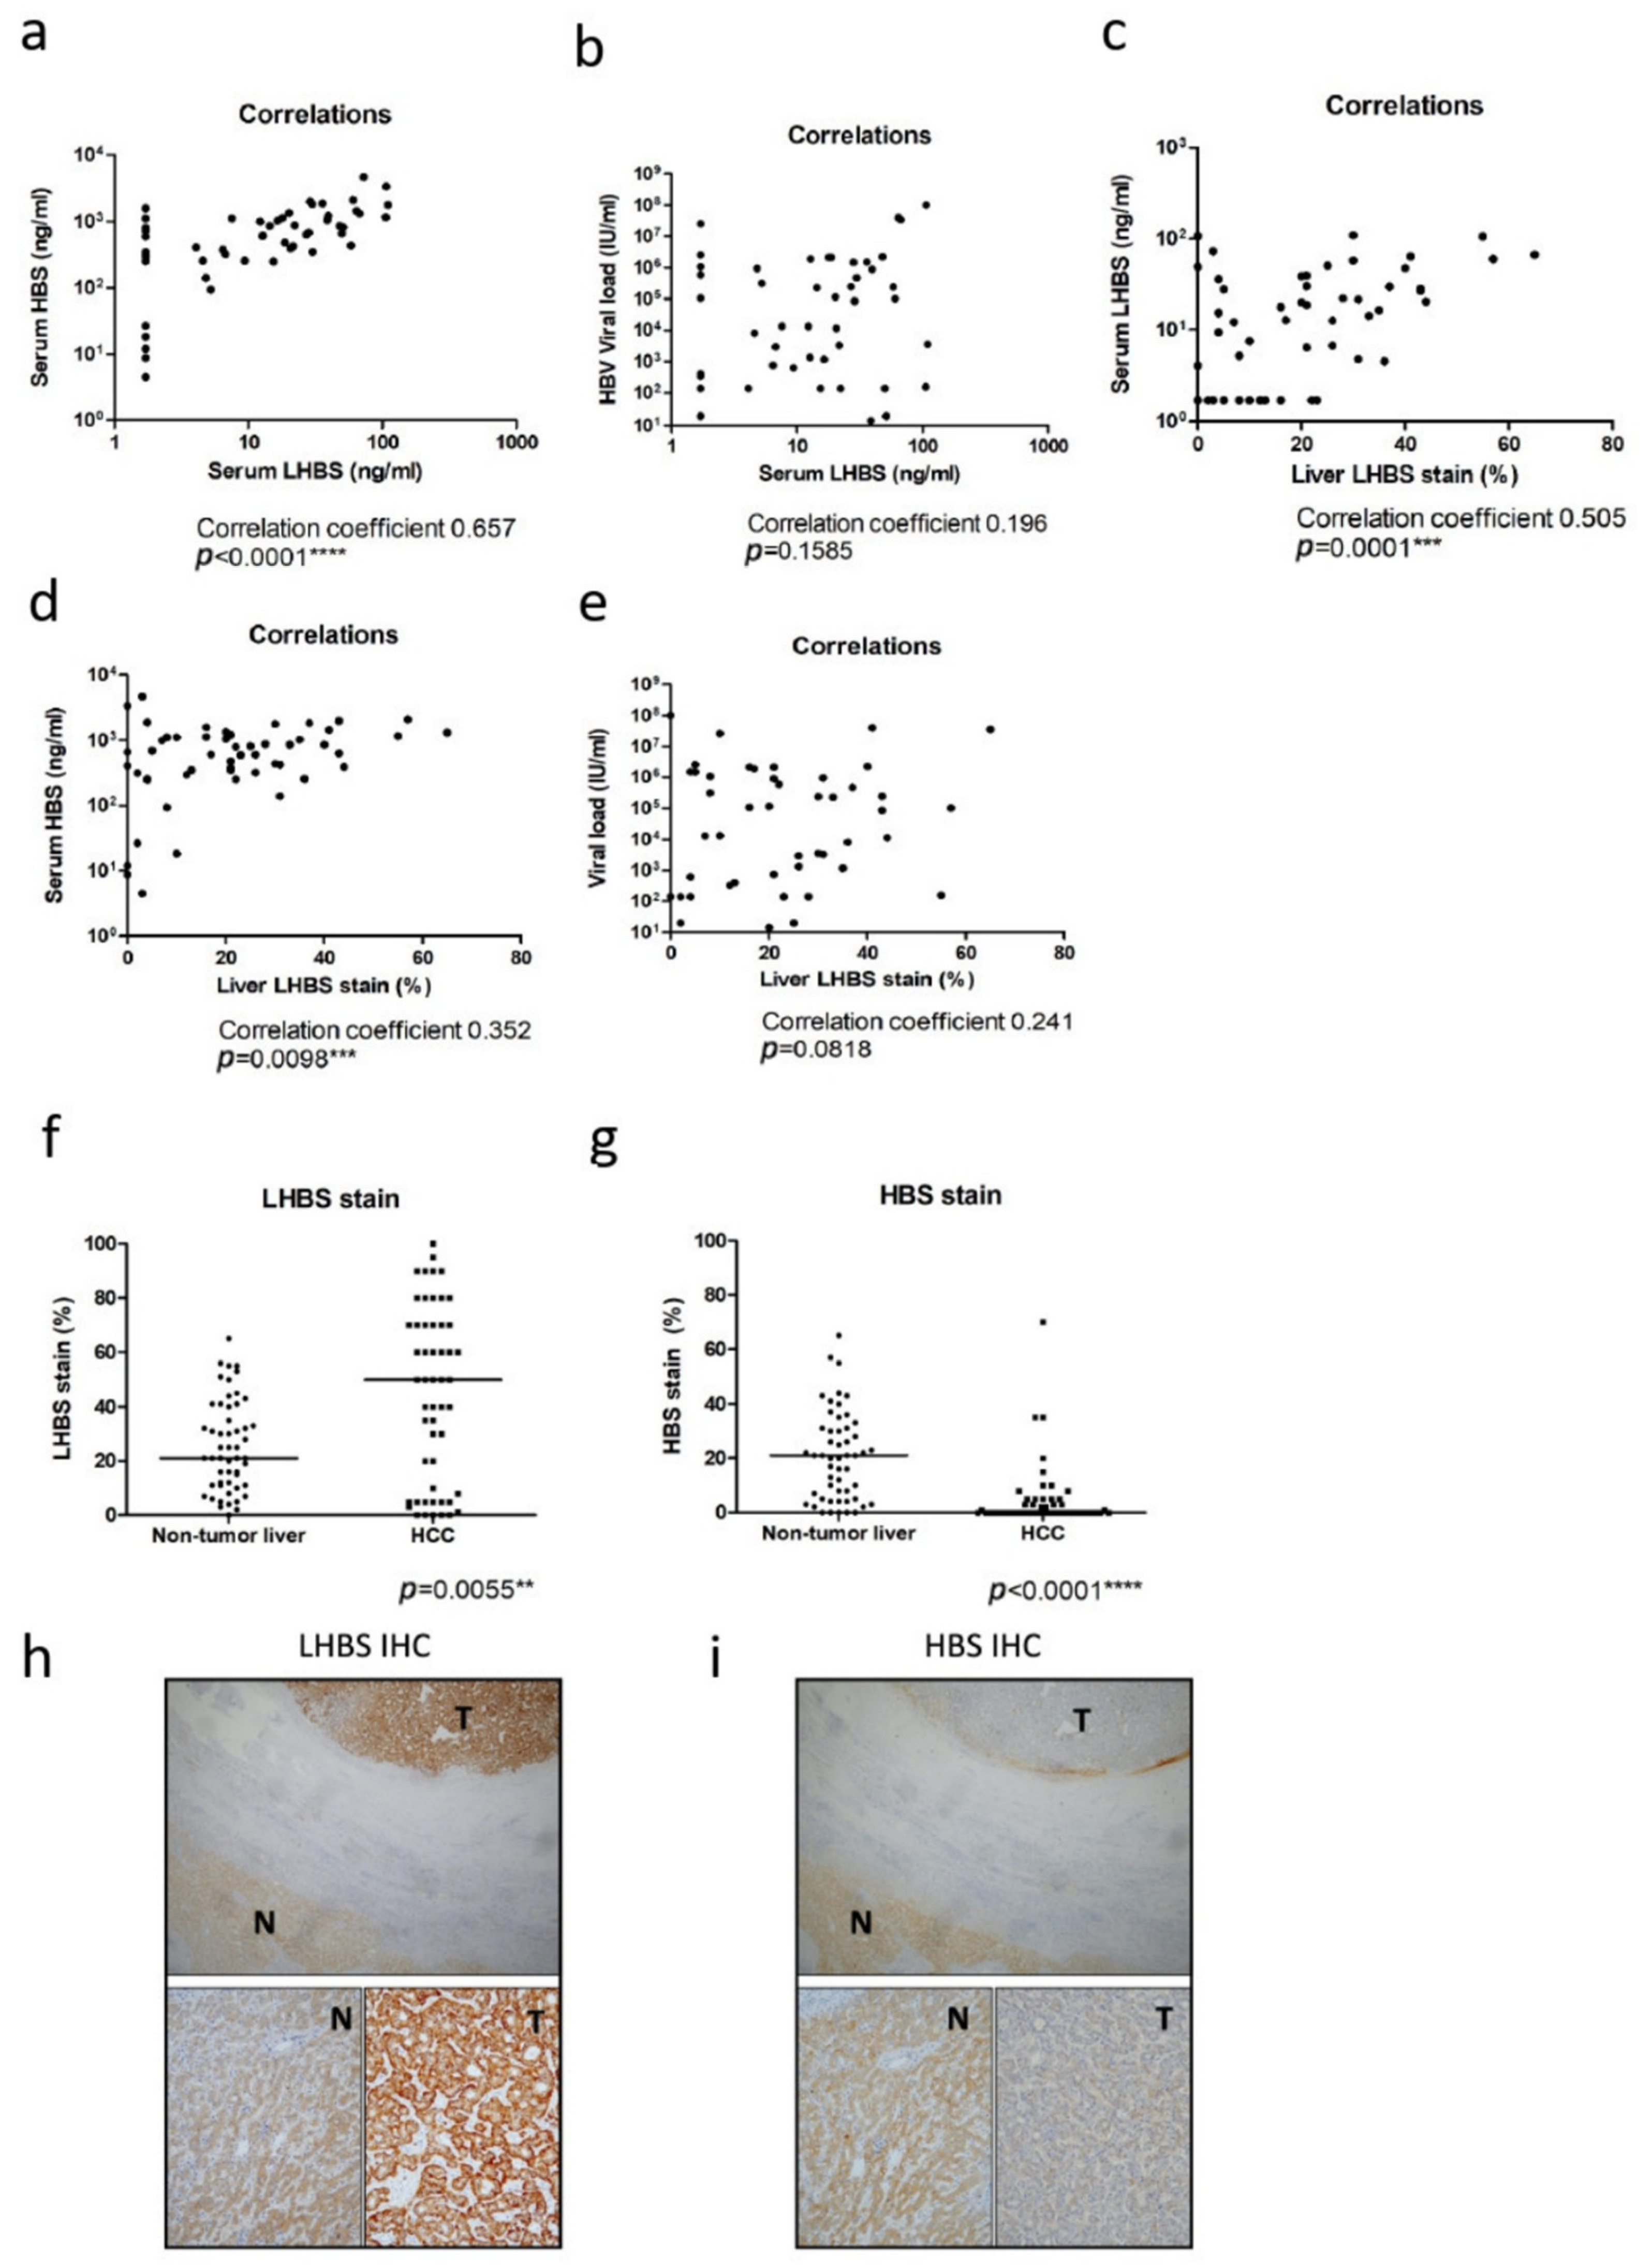
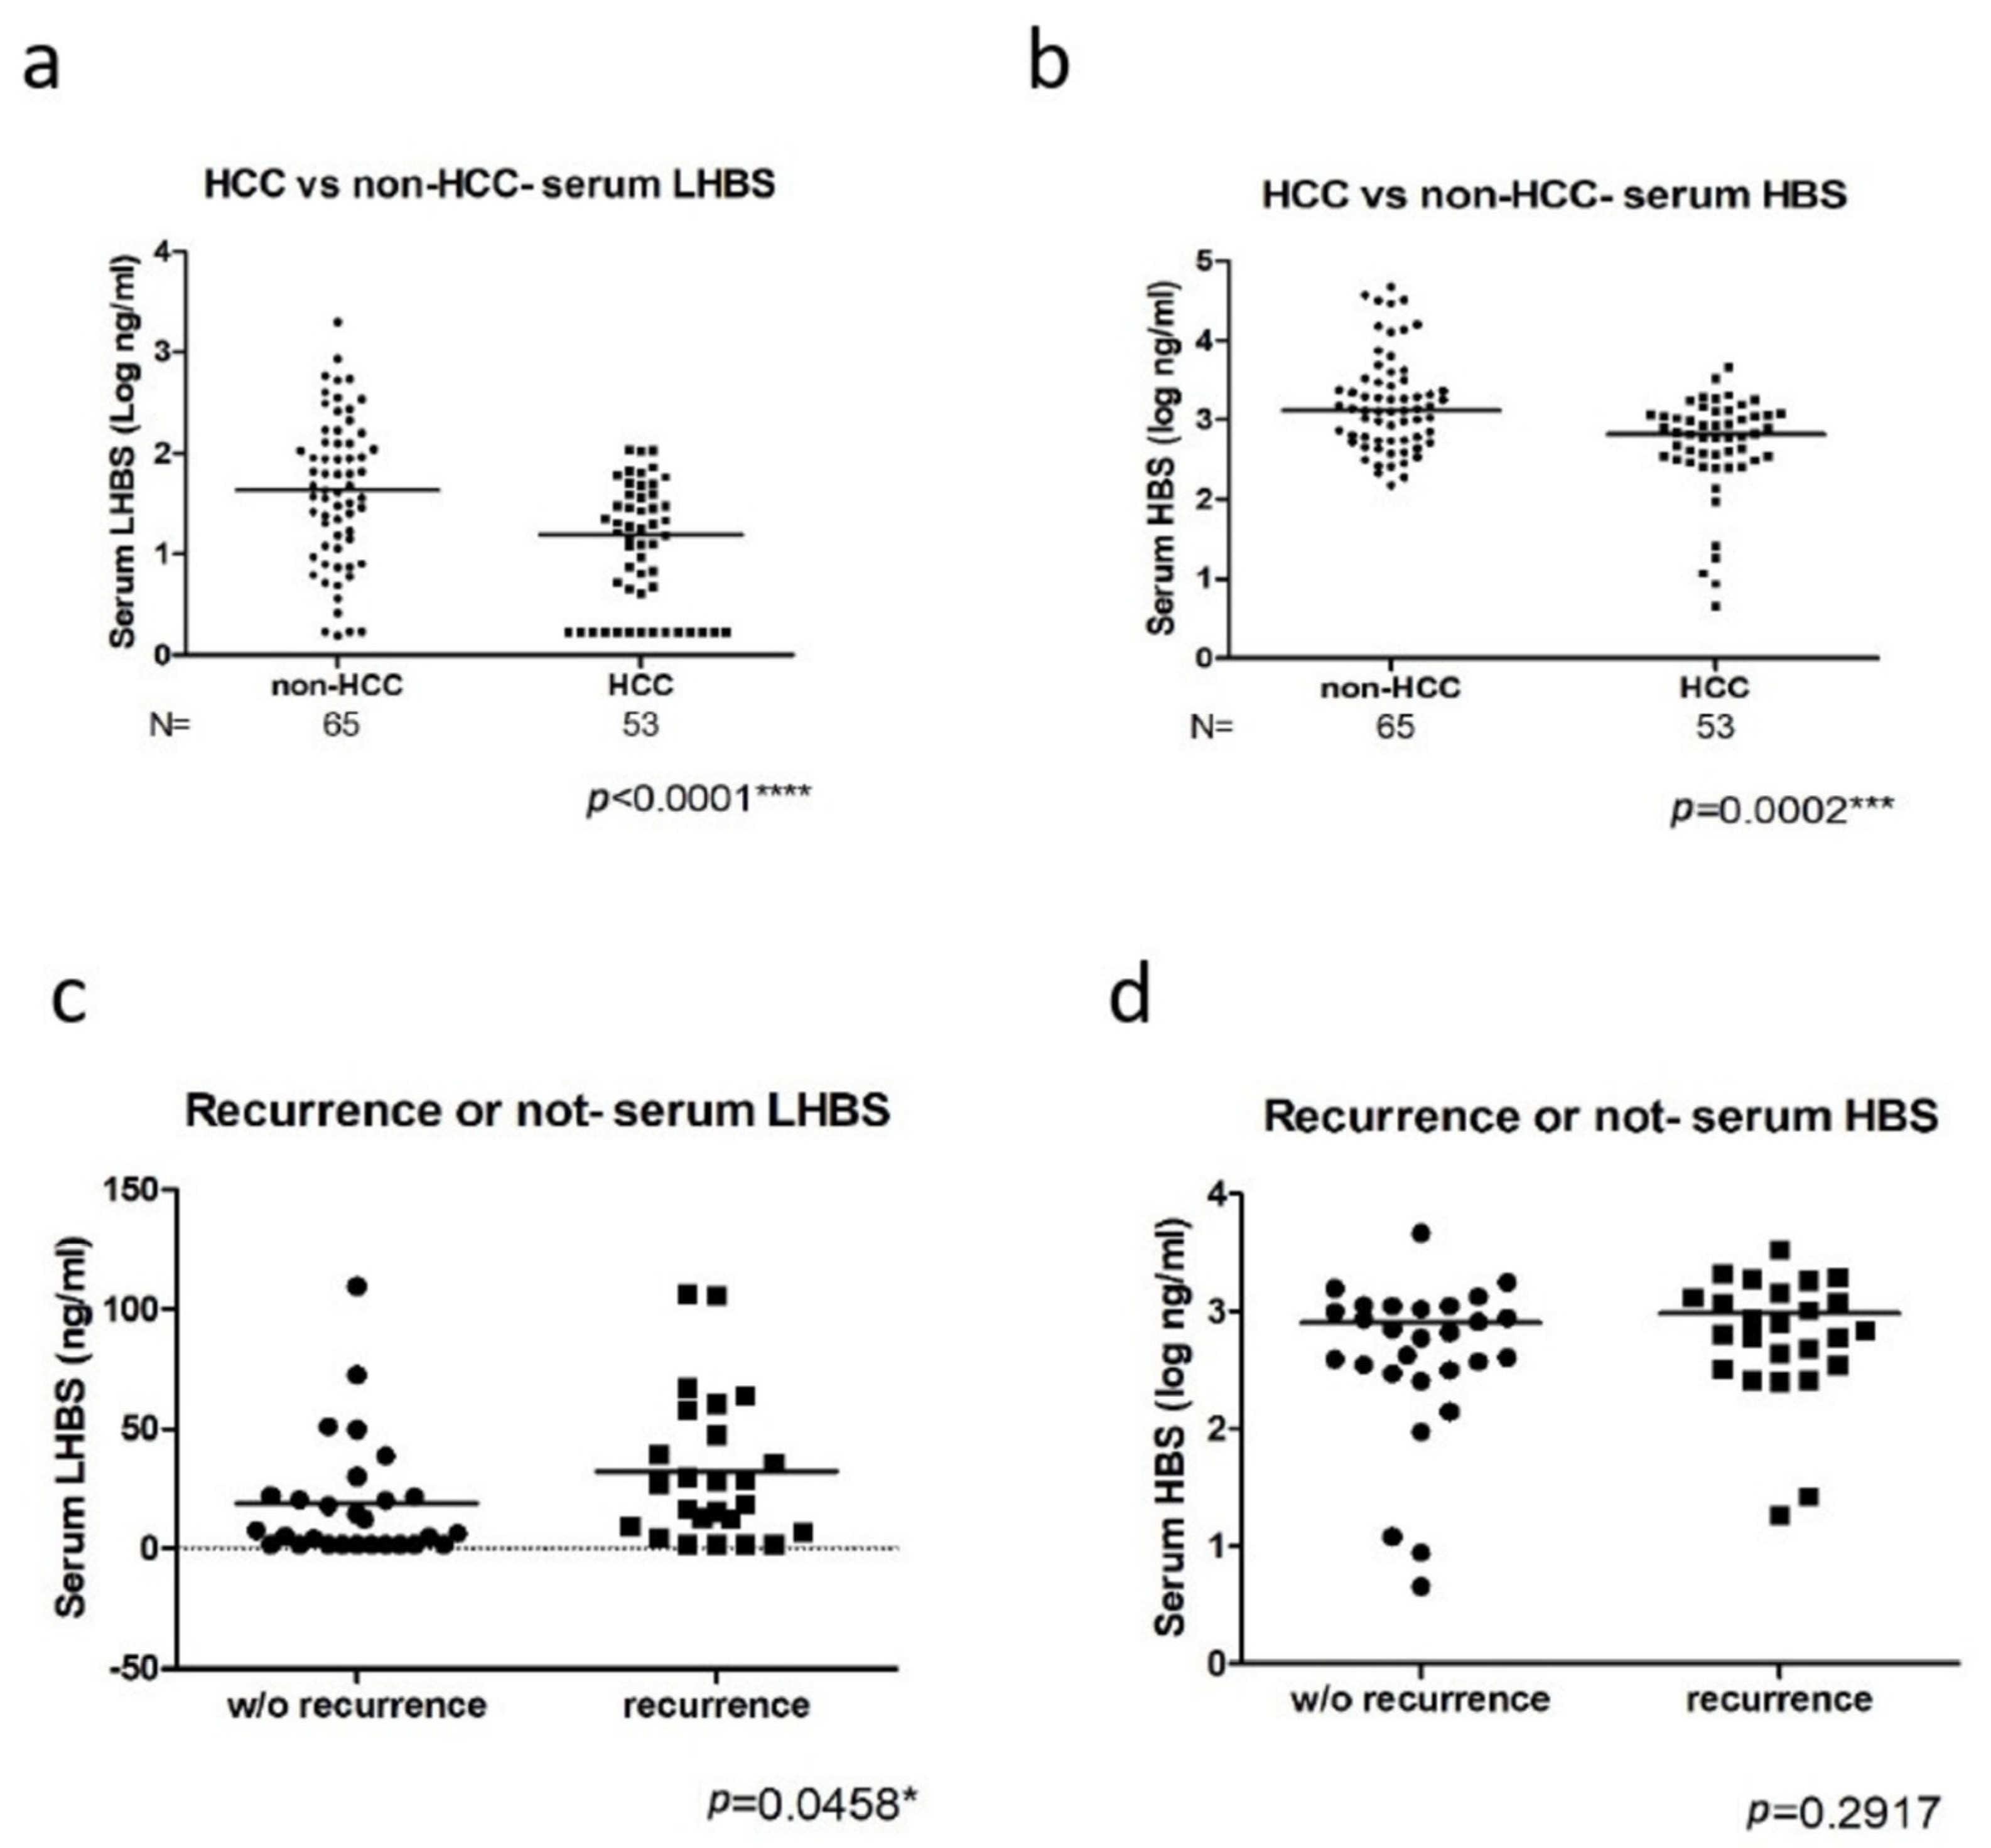
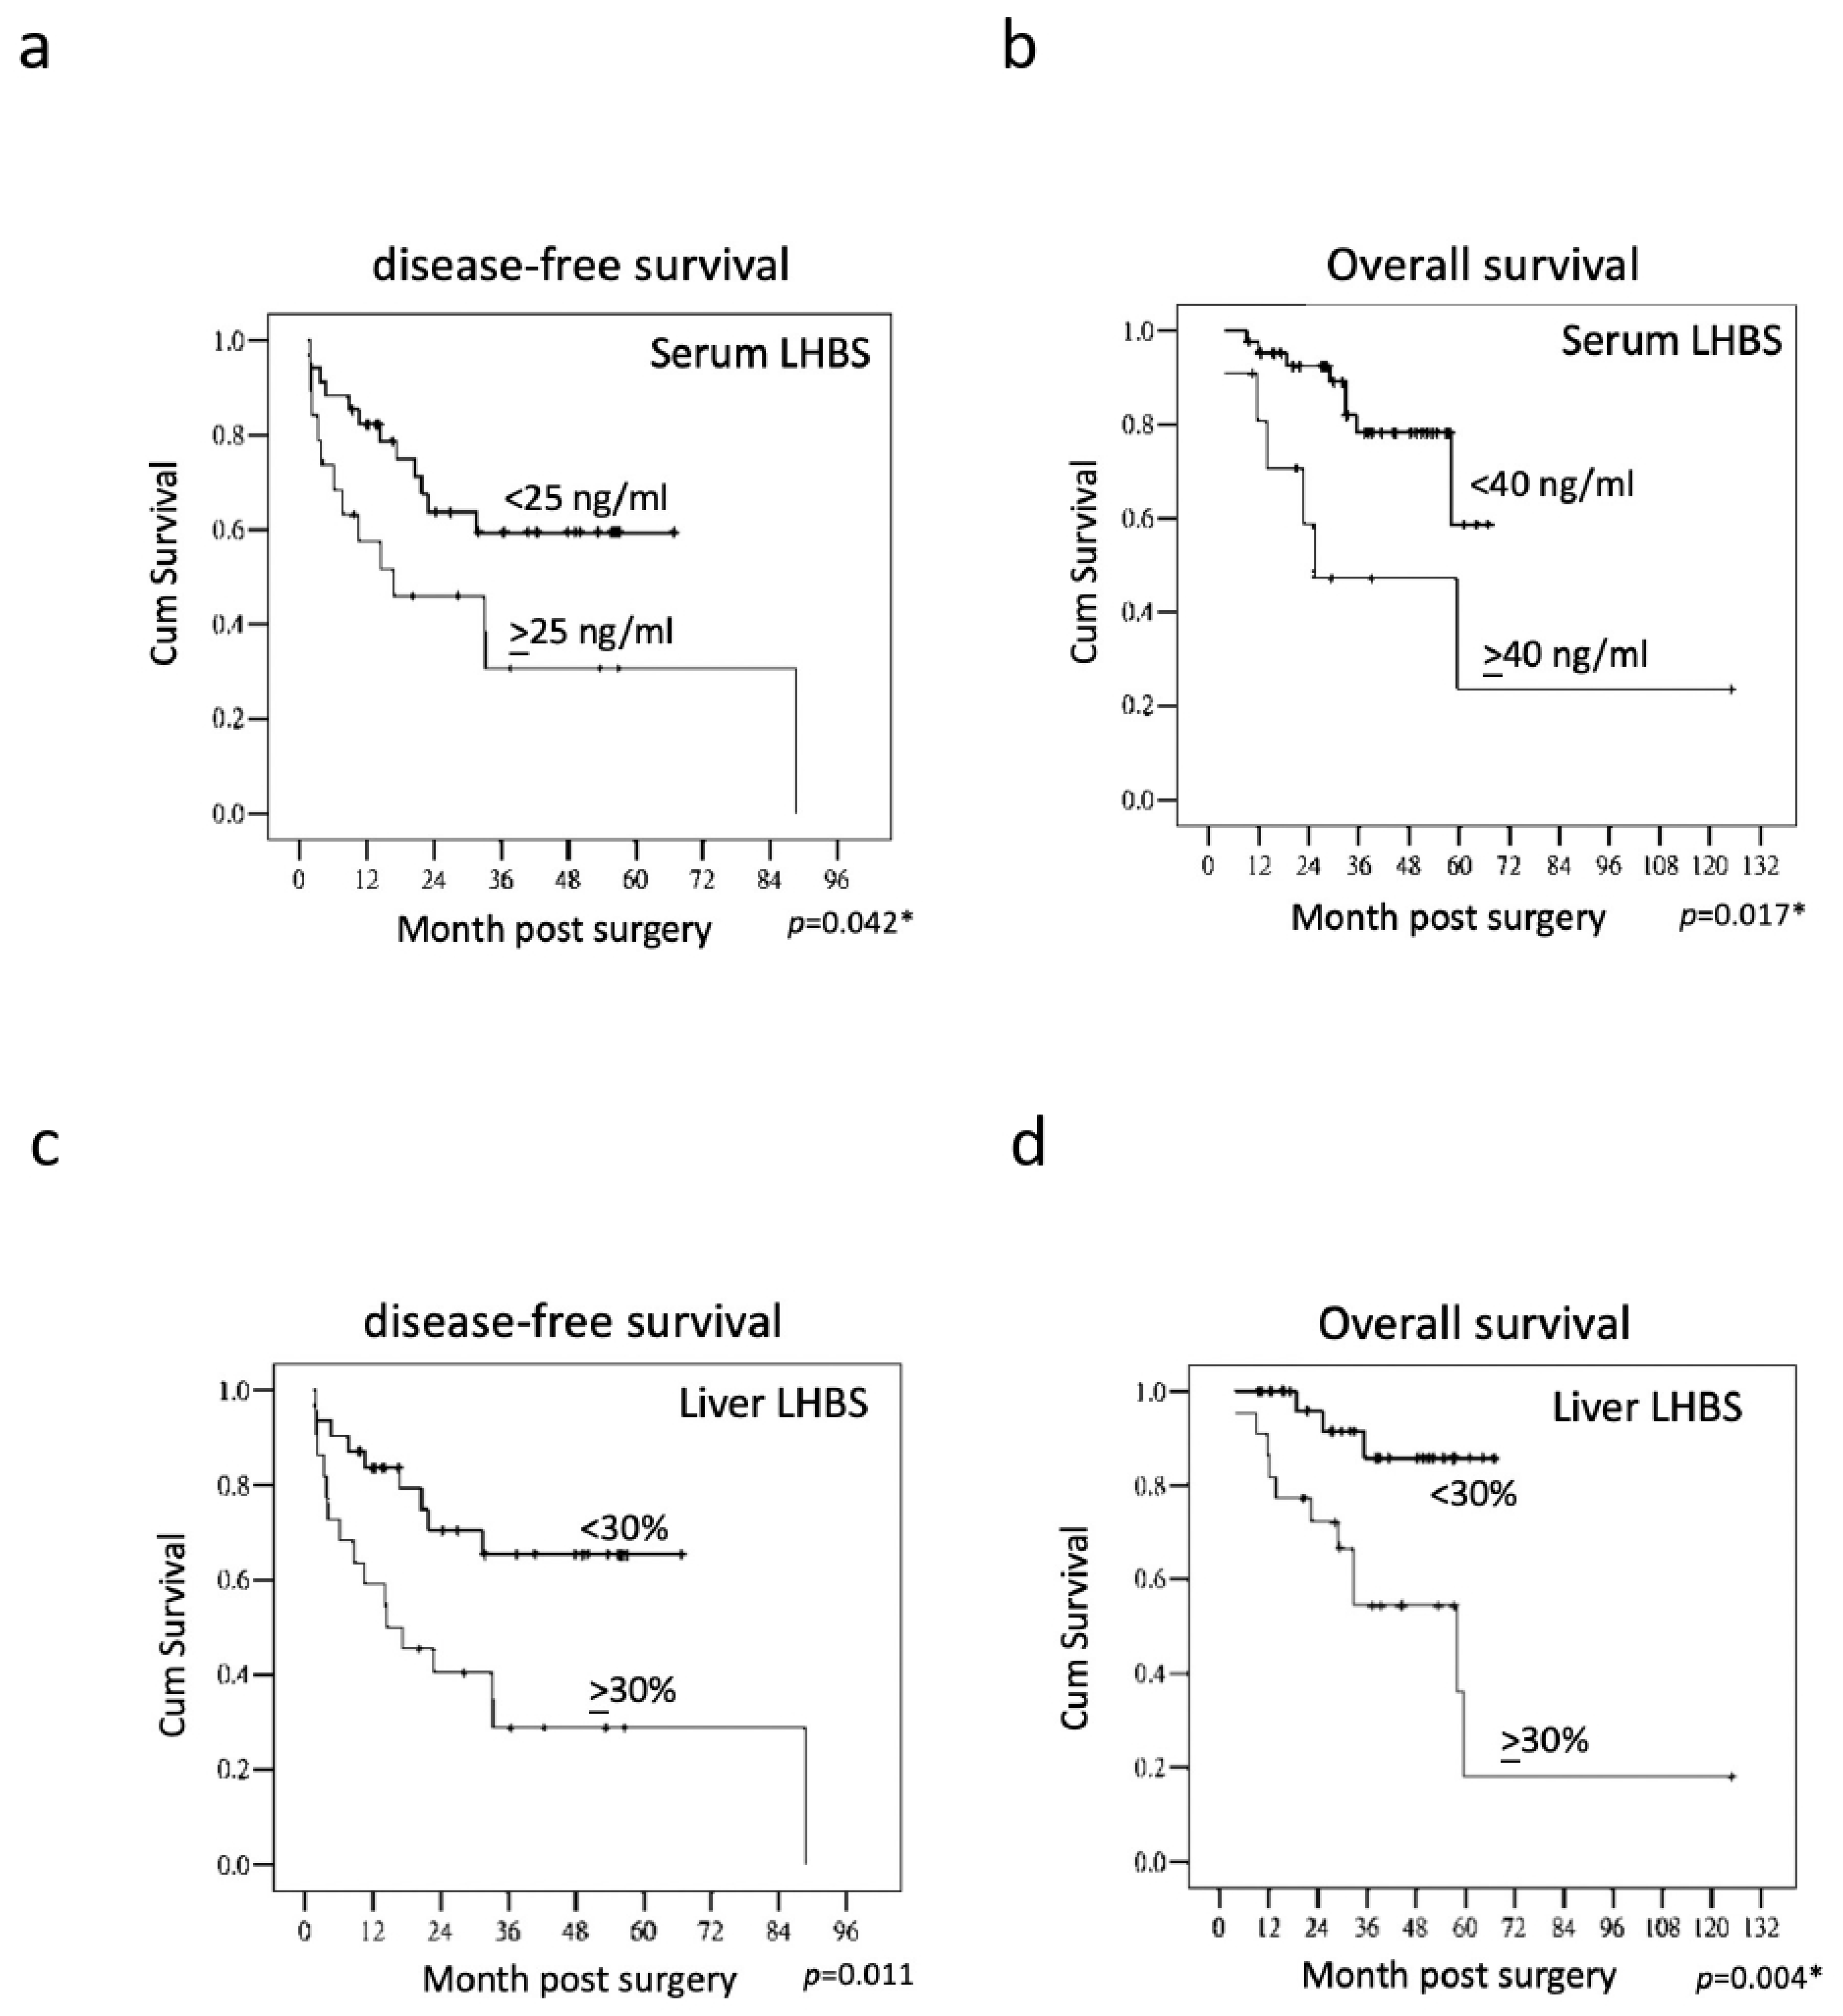
3.2. The Association of LHBS Expression with HBV Replication and HCC Prognosis

Using the LHBS ELISA analysis developed here, the serum LHBS levels in the CHB (n = 65) and HCC (n = 53) patients were detected. We found that the serum LHBS level was correlated with the HBS but not the viral titer in serum, indicating that HBV surface proteins’ expression does not mainly depend on viral replication status (Figure 2a,b). Moreover, the liver LHBS signals, detected by immunohistochemical staining, showed significant correlations with the serum LHBS and HBS levels (Figure 2c–e). We also found that both serum LHBS and HBS levels were lower in the HCC patients than in the CHB (Figure 3a,b). However, the LHBS expression increased in the tumorous regions, whereas the HBS expression decreased in the tumor, consistent with our previous findings (Figure 2f–i) [15,22,23].
We evaluated the association of the serum LHBS with the various clinicopathologic factors in HCC. The serum LHBS but not HBS was correlated with recurrence after surgery (Figure 3c,d). The higher serum LHBS was significantly associated with cirrhosis, advanced AJCC stage, and worse DFS and OS, as determined by the multivariate analysis (Table 2) as well as the Kaplan–Meier analysis with the log-rank test (Figure 4a,b). However, the serum HBS did not significantly correlate with DFS or OS. The immunohistochemistry analysis also revealed that the liver LHBS level was highly correlated with cirrhosis as well as the DFS and OS in the HCC patients receiving surgery. Moreover, the LHBS levels in the tumorous regions were positively associated with vascular invasion (Table 3). In comparison, the liver HBS staining showed a correlation with the AJCC stage but not with any other clinicopathologic parameter analyzed, which suggested that LHBS plays a specific role involving in tumor progression. (Table 4).
Moreover, independent clinicopathologic factors correlated with DFS and OS in HCC patients were estimated by the multivariate analysis. For DFS, the tumor size, vascular invasion, serum LHBS, and liver LHBS staining were significant factors (Table 5). For OS, the multifocal tumor phenotype, tumor size, serum LHBS, and liver LHBS staining were significant (Table 6). On the contrary, neither serum HBS nor liver HBS staining was significantly associated with DFS or OS, indicating that LHBS is an independent parameter associated with HCC recurrence (Table 5 and Table 6).

4. Discussion

This study developed a sensitive and simple ELISA method to detect LHBS. With the adaptation of the chemiluminescent substrate in the ELISA, the method allows highly sensitive and quantitative measurement of LHBS [24]. The dynamic range of the measurement is approximately 100-fold, which allows reliable measurement of samples across a wide range of concentrations. With the direct detection of the protein in serum, this detection method is much more time and cost effective than measuring the viral DNA titer. Serum LHBS was better than traditional serum HBS in the stratification of HBe(−) CHB patients and HCC patients, in the correlation of HCC recurrence and in the prediction of DFS and OS in HCC patients after surgery.
LHBS is mainly an integral component of virion envelope and some filamentous SVPs, whereas HBS is expressed in a free form or in spherical SVPs and in the virion in serum [3,25,26,27]. LHBS has been shown to play pivotal roles in the HBV life cycle, including binding to the receptor NTCP, mediating entry into hepatocytes, virus budding, assembly of the envelope and nucleocapsid, and facilitating exocytosis and secretion of the S protein [13,14]. In one study, the composition of HBsAg was shown to have specific patterns across different phases of hepatitis B. Patients in acute or chronic hepatitis phases had significantly lower proportions of LHBS than individuals in the inactive carrier phase irrespective of their HBe antigen status or HBsAg level [28]. Our study also showed that serum LHBS was highest in HBeAg(+) CHB patients, followed by HBeAg(−) CHB patients, whereas HCC patients showed the lowest serum LHBS levels (data not shown). The exact molecular mechanism for the decrease in LHBS in the HCC patients remains unclear. Thus, previous studies reported that the HBV surface proteins generally decrease in the long natural course of HBV infection, possibly due to gradual immune clearance or reduced viral replication after long durations of infection [29,30,31]. In fact, most HBV(+) HCC cases are diagnosed with cancer after many years with CHB, implicating that most HCC cases might have carried the viral infection longer than the CHB cases. Our HCC cohort had a slightly older mean age than the CHB did (HCC 56.3y and CHB 50y), possibly due to that most HCC cases were in the infection for longer than CHB were. In HCC patients, serum LHBS, liver LHBS, and tumor LHBS expression were not significantly correlated with HBeAg status. Serum LHBS and liver LHBS were significantly higher in cirrhotic patients. These findings suggested that LHBS expression is independent of viral replication status when HCC occurs.
LHBS not only plays an important role in HBV infection but also is involved in HCC carcinogenesis [18,32]. In this study, we found that serum and liver LHBS levels were significantly correlated with HCC recurrence. Previous studies have shown that LHBS plays an important role in the development of HBV-related HCC by activating multiple pro-oncogenic pathways. The accumulation of viral LHBS and its prevalent pre-S mutants in chronically HBV-infected hepatocytes triggers a sustained endoplasmic reticulum (ER) overload response, leading to activation of VEGF/Akt/mTOR signaling pathways and IRE1/p38-mediated NF-kB and COX-2 activation [33,34]. LHBS also induces ER stress-mediated Ca2+ efflux and ROS generation, which leads to oxidative DNA damage and genomic instability [35]. The pre-S2 mutant protein interacts with c-Jun activation domain binding protein 1 (JAB1), which enhances activator protein-1 transcriptional activity and cell proliferation. Through its binding to JAB1, the pre-S2 mutant protein induces JAB1 nuclear translocation, which activates p27/retinoblastoma/Cdk2/cyclin A pathways and leads to cell cycle progression [36]. Pre-S2 mutant LHBS was also found to block NBS1-mediated homologous recombination repair and induce genomic instability [37]. LHBS elicits hyperploidy by inducing DNA damage and upregulating Plk1, which attenuates cell cycle arrest at the G2/M DNA damage checkpoint [16]. Moreover, recent studies have shown that N-glycans on LHBS are associated with ER stress-mediated cell cycle dysregulation and cell proliferation, suggesting that the post-translational modifications of LHBS play significant roles in regulating HBV-related carcinogenesis [17,38]. An analysis of CHB patients revealed that overexpression of both LHBS and its pre-S mutants is associated with advanced liver disease and HCC development [35,39].
In liver tissue, ground glass hepatocytes identified in patients with HBV-related HCC harbor pre-S deletion variants that largely accumulate in the ER lumen due to mutation-induced protein misfolding and are associated with increased risks of HCC recurrence and metastasis [38,40,41]. Immunohistochemical staining was performed to examine the expression of various surface proteins in tumor tissue surgically resected from patients with HBV-related HCC. HBS protein expression was lower in the tumor than in the non-tumor liver samples, in which the HBS signals were usually intense, suggesting that the HBS gene promoter was downregulated during carcinogenesis. In contrast to that of HBS, the expression of LHBS is maintained in HCC tissue, which likely plays an important role in promoting tumor progression [15]. In this study, we found that serum LHBS was significantly correlated with liver LHBS staining. Serum LHBS is likely a surrogate marker that reflects liver LHBS levels.
In conclusion, we developed a sensitive and simple ELISA method to detect LHBS. Serum LHBS was better than HBS in the stratification of CHB and HCC patients and the correlation of HCC recurrence. Measurement of serum LHBS could be used as a noninvasive test to identify HCC patients with worse DFS and OS, as well as the ones advised to undertake more aggressive treatment modalities or surveillance after surgery.

Supplementary Materials

The following supporting information can be downloaded at: https://www.mdpi.com/article/10.3390/ijms23105376/s1.

Author Contributions

W.H.: pathological study and data analysis; H.-W.T. and Y.-P.L.: patient recruitment and follow up; C.-J.Y.: experimental handling; Y.-P.L. and K.-H.C.: data interpretation: C.-J.H.; administrative support: Y.-P.L.; manuscript writing: H.-W.T. All authors have read and agreed to the published version of the manuscript.

Funding

This study was supported by the Taiwan Ministry of Science and Technology (grant nos. 106-2320-B-006-048-MY3, 109-2622-B-006-006, and 110-2320-B-006-030-MY3 to WH).

Institutional Review Board Statement

This study protocol was approved by the Human Experiment and Ethics Committee of NCKUH with the Institutional Review Board (ER-105-142, 08/01/2017).

Informed Consent Statement

Written informed consent has been obtained from the patient(s) to publish this paper.

Conflicts of Interest

The authors declare no conflict of interest.

Abbreviations

CDRcomplementarity-determining region
CHBchronic hepatitis B
DFSdisease-free survival
ERendoplasmic reticulum
HBVhepatitis B virus
HCChepatocellular carcinoma
JAB1c-Jun activation domain binding protein 1
LHBSlarge HBV surface protein
LODlimit of detection
LOQlimit of quantification
LOLlimit of linearity
NTCPsodium taurocholate co-transporting polypeptide
OSoverall survival
RFAradiofrequency ablation
TACEtransarterial chemoembolization

References

  1. Arbuthnot, P.; Kew, M. Hepatitis B virus and hepatocellular carcinoma. Int. J. Exp. Pathol. 2001, 82, 77–100. [Google Scholar] [CrossRef] [PubMed]
  2. Bosch, F.X.; Ribes, J.; Borras, J. Epidemiology of primary liver cancer. Semin. Liver Dis. 1999, 19, 271–285. [Google Scholar] [CrossRef] [PubMed]
  3. Lin, C.L.; Kao, J.H. Prevention of hepatitis B virus-related hepatocellular carcinoma. Hepatoma Res. 2021, 7, 9. [Google Scholar] [CrossRef]
  4. Tabrizian, P.; Jibara, G.; Shrager, B.; Schwartz, M.; Roayaie, S. Recurrence of hepatocellular cancer after resection: Patterns, treatments, and prognosis. Ann. Surg. 2015, 261, 947–955. [Google Scholar] [CrossRef]
  5. Liaw, Y.F.; Chu, C.M. Hepatitis B virus infection. Lancet 2009, 373, 582–592. [Google Scholar] [CrossRef]
  6. Pazgan-Simon, M.; Simon, K.A.; Jarowicz, E.; Rotter, K.; Szymanek-Pasternak, A.; Zuwała-Jagiełło, J. Hepatitis B virus treatment in hepatocellular carcinoma patients prolongs survival and reduces the risk of cancer recurrence. Clin. Exp. Hepatol. 2017, 4, 210–216. [Google Scholar] [CrossRef]
  7. Cougot, D.; Wu, Y.; Cairo, S.; Caramel, J.; Renard, C.A.; Lévy, L.; Buendia, M.A.; Neuveut, C. The hepatitis B virus X protein functionally interacts with CREB-binding protein/p300 in the regulation of CREB-mediated transcription. J. Biol. Chem. 2007, 282, 4277–4287. [Google Scholar] [CrossRef] [Green Version]
  8. Henkler, F.F.; Koshy, R. Hepatitis B virus transcriptional activators: Mechanisms and possible role in oncogenesis. J. Viral. Hepat. 1996, 3, 109–121. [Google Scholar] [CrossRef]
  9. Yen, C.-J.; Yang, S.-T.; Chen, R.-Y.; Huang, W.; Chayama, K.; Lee, M.-H.; Yang, S.-J.; Lai, H.-S.; Yen, H.-Y.; Hsiao, Y.-W.; et al. Hepatitis B virus X protein (HBx) enhances centrosomal P4.1-associated protein (CPAP) expression to promote hepatocarcinogenesis. J. Biomed. Sci. 2019, 26, 44. [Google Scholar] [CrossRef] [Green Version]
  10. Zhang, Y.; Yan, Q.; Gong, L.; Xu, H.; Liu, B.; Fang, X.; Yu, D.; Li, L.; Wei, T.; Wang, Y.; et al. C-terminal truncated HBx initiates hepatocarcinogenesis by downregulating TXNIP and reprogramming glucose metabolism. Oncogene 2021, 40, 1147–1161. [Google Scholar] [CrossRef]
  11. Ali, A.; Abdel-Hafiz, H.; Suhail, M.; Al-Mars, A.; Zakaria, M.K.; Fatima, K.; Ahmad, S.; Azhar, E.; Chaudhary, A.; Qadri, I. Hepatitis B virus, HBx mutants and their role in hepatocellular carcinoma. World J. Gastroenterol. 2014, 20, 10238–10248. [Google Scholar] [CrossRef] [PubMed]
  12. Churin, Y.; Roderfeld, M.; Roeb, E. Hepatitis B virus large surface protein: Function and fame. Hepatobiliary Surg. Nutr. 2015, 4, 1–10. [Google Scholar] [PubMed]
  13. Li, W. The hepatitis B virus receptor. Annu. Rev. Cell Dev. Biol. 2015, 31, 125–147. [Google Scholar] [CrossRef] [PubMed]
  14. Watashi, K.; Urban, S.; Li, W.; Wakita, T. NTCP and beyond: Opening the door to unveil hepatitis B virus entry. Int. J. Mol. Sci. 2014, 15, 2892–2905. [Google Scholar] [CrossRef] [PubMed] [Green Version]
  15. Yen, C.-S.; Ai, Y.-L.; Tsai, H.-W.; Chan, S.-H.; Cheng, K.-H.; Lee, Y.-P.; Kao, C.-W.; Wang, Y.-C.; Chen, Y.-L.; Lin, C.-H.; et al. Hepatitis B virus surface gene pre-S2 mutant as a high-risk serum marker for hepatoma recurrence after curative hepatic resection. Hepatology 2018, 19, 280–286. [Google Scholar]
  16. Li, T.-N.; Wu, Y.-J.; Tsai, H.-W.; Sun, C.-P.; Wu, H.-L.; Pei, Y.-N.; Lu, K.-Y.; Yen, T.T.-C.; Chang, C.-W.; Chan, H.-L.; et al. Intrahepatic hepatitis B virus large surface antigen induces hepatocyte hyperploidy via failure of cytokinesis. J. Pathol. 2018, 245, 502–513. [Google Scholar] [CrossRef]
  17. Choi, Y.M.; Lee, S.Y.; Kim, B.J. Naturally occurring hepatitis B virus mutations leading to endoplasmic reticulum stress and their contribution to the progression of hepatocellular carcinoma. Int. J. Mol. Sci. 2019, 20, 597. [Google Scholar] [CrossRef] [Green Version]
  18. Huang, S.N.; Chisari, F.V. Strong, sustained hepatocellular proliferation precedes hepatocarcinogenesis in hepatitis B surface antigen transgenic mice. Hepatology 1995, 21, 620–626. [Google Scholar]
  19. Schulze, A.; Schieck, A.; Ni, Y.; Mier, W.; Urban, S. Fine mapping of pre-S sequence requirements for hepatitis B virus large envelope protein-mediated receptor interaction. J. Virol. 2010, 84, 1989–2000. [Google Scholar] [CrossRef] [Green Version]
  20. Sankhyan, A.; Sharma, C.; Dutta, D.; Sharma, T.; Chosdol, K.; Wakita, T.; Watashi, K.; Awasthi, A.; Acharya, S.K.; Khanna, N.; et al. Inhibition of preS1-hepatocyte interaction by an array of recombinant human antibodies from naturally recovered individuals. Sci. Rep. 2016, 6, 21240. [Google Scholar] [CrossRef] [Green Version]
  21. Armbruster, D.A.; Pry, T. Limit of blank, limit of detection and limit of quantitation. Clin. Biochem. Rev. 2008, 29 (Suppl. S1), S49–S52. [Google Scholar] [PubMed]
  22. Tseng, T.-C.; Liu, C.-J.; Yang, H.-C.; Su, T.-H.; Wang, C.; Chen, C.; Kuo, S.F.; Liu, C.-H.; Chen, P.-J.; Chen, D.-S.; et al. High levels of hepatitis B surface antigen increase risk of hepatocellular carcinoma in patients with low HBV load. Gastroenterology 2012, 142, 1140–1149. [Google Scholar] [CrossRef] [PubMed] [Green Version]
  23. Vo, T.T.; Poovorawan, K.; Charoen, P.; Soonthornworasiri, N.; Nontprasert, A.; Kittitrakul, C.; Phumratanaprapin, W.; Tangkijvanich, P. Association between hepatitis B surface antigen levels and the risk of hepatocellular carcinoma in patients with chronic hepatitis B infection: Systematic review and meta-analysis. Asian Pac. J. Cancer Prev. 2019, 20, 2239–2246. [Google Scholar]
  24. Japp, N.C.; Souchek, J.J.; Sasson, A.R.; Hollingsworth, M.A.; Batra, S.K.; Junker, W.M. Tumor biomarker in-solution quantification, standard production, and multiplex detection. J. Immunol. Res. 2021, 2021, 9942605. [Google Scholar] [CrossRef]
  25. Cao, J.; Zhang, J.; Lu, Y.; Luo, S.; Zhang, J.; Zhu, P. Cryo-EM structure of native spherical subviral particles isolated from HBV carriers. Virus Res. 2019, 259, 90–96. [Google Scholar] [CrossRef]
  26. Patient, R.; Hourioux, C.; Sizaret, P.Y.; Trassard, S.; Sureau, C.; Roingeard, P. Hepatitis B virus subviral envelope particle morphogenesis and intracellular trafficking. J. Virol. 2007, 81, 3842–3851. [Google Scholar] [CrossRef] [Green Version]
  27. Bruss, V.; Gerhardt, E.; Vieluf, K.; Wunderlich, G. Functions of the large hepatitis B virus surface protein in viral particle morphogenesis. Intervirology 1996, 39, 23–31. [Google Scholar] [CrossRef]
  28. Pfefferkorn, M.; Böhm, S.; Schott, T.; Deichsel, D.; Bremer, C.M.; Schröder, K.; Gerlich, W.H.; Glebe, D.; Berg, T.; Van Bömmel, F. Quantification of large and middle proteins of hepatitis B virus surface antigen (HBsAg) as a novel tool for the identification of inactive HBV carriers. Gut 2018, 67, 2045–2053. [Google Scholar] [CrossRef]
  29. Lee, J.H.; Kim, S.J.; Ahn, S.H.; Lee, J.H.; Park, Y.J.; Kim, H.S. Correlation between quantitative serum HBsAg and HBV DNA test in Korean patients who showed high level of HBsAg. J. Clin. Pathol. 2010, 63, 1027–1031. [Google Scholar] [CrossRef]
  30. Nie, J.J.; Kang, L.; Pian, Y.; Gao, Z.X.; Hu, J.H. Prevalence of hepatitis B surface antigen in coastal area of Tianjin, China. Future Virol. 2020, 15, 91–99. [Google Scholar] [CrossRef]
  31. Lee, P.L.; Chen, J.J.; Tung, H.D.; Cheng, C.T.; Chuang, T.W.; Wang, S.J.; Wu, H.-C. Serum hepatitis B surface antigen level might predict cirrhosis and hepatocellular carcinoma in older patients with chronic hepatitis B. Adv. Dig. Med. 2015, 2, 102–107. [Google Scholar] [CrossRef] [Green Version]
  32. Lin, W.L.; Hung, J.H.; Huang, W. Association of the hepatitis B virus large surface protein with viral infectivity and endoplasmic reticulum stress-mediated liver carcinogenesis. Cells 2020, 9, 2052. [Google Scholar] [CrossRef] [PubMed]
  33. Hung, J.H.; Su, I.J.; Lei, H.Y.; Wang, H.C.; Lin, W.C.; Chang, W.T.; Huang, W.; Chang, W.; Chang, Y.; Chen, C.-H.; et al. Endoplasmic reticulum stress stimulates the expression of cyclooxygenase-2 through activation of NF-kappaB and pp38 mitogen-activated protein kinase. J. Biol. Chem. 2004, 279, 46384–46392. [Google Scholar] [CrossRef] [PubMed] [Green Version]
  34. Yang, J.-C.; Teng, C.-F.; Wu, H.-C.; Tsai, H.-W.; Chuang, H.-C.; Tsai, T.-F.; Hsu, Y.-H.; Huang, W.; Wu, L.-W.; Su, I.-J. Enhanced expression of vascular endothelial growth factor-A in ground glass hepatocytes and its implication in hepatitis B virus hepatocarcinogenesis. Hepatology 2009, 49, 1962–1971. [Google Scholar] [CrossRef]
  35. Hsieh, Y.-H.; Su, I.-J.; Wang, H.-C.; Chang, W.-W.; Lei, H.-Y.; Lai, M.-D.; Huang, W. Pre-S mutant surface antigens in chronic hepatitis B virus infection induce oxidative stress and DNA damage. Carcinogenesis 2004, 25, 2023–2032. [Google Scholar] [CrossRef] [Green Version]
  36. Hsieh, Y.-H.; Su, I.-J.; Wang, H.-C.; Tsai, J.-H.; Huang, Y.-J.; Chang, W.-W.; Lai, M.-D.; Lei, H.-Y.; Huang, W. Hepatitis B virus pre-S2 mutant surface antigen induces degradation of cyclin-dependent kinase inhibitor p27Kip1 through c-Jun activation domain-binding protein 1. Mol. Cancer Res. 2007, 5, 1063–1072. [Google Scholar] [CrossRef] [Green Version]
  37. Hsieh, Y.-H.; Chang, Y.-Y.; Su, I.-J.; Yen, C.-J.; Liu, Y.-R.; Liu, R.-J.; Hsieh, W.-C.; Tsai, H.-W.; Wang, L.H.-C.; Huang, W. Hepatitis B virus pre-S2 mutant large surface protein inhibits DNA double-strand break repair and leads to genome instability in hepatocarcinogenesis. J. Pathol. 2015, 236, 337–347. [Google Scholar] [CrossRef]
  38. Liu, W.; Cao, Y.; Wang, T.; Xiang, G.; Lu, J.; Zhang, J.; Hou, P. The N-glycosylation modification of LHBs (large surface proteins of HBV) effects on endoplasmic reticulum stress, cell proliferation and its secretion. Hepat. Mon. 2013, 13, e12280. [Google Scholar] [CrossRef] [Green Version]
  39. Wang, H.C.; Wu, H.C.; Chen, C.F.; Fausto, N.; Lei, H.Y.; Su, I.J. Different types of ground glass hepatocytes in chronic hepatitis B virus infection contain specific pre-S mutants that may induce endoplasmic reticulum stress. Am. J. Pathol. 2003, 163, 2441–2449. [Google Scholar] [CrossRef] [Green Version]
  40. Tsai, H.-W.; Lin, Y.-J.; Lin, P.-W.; Wu, H.-C.; Hsu, K.-H.; Yen, C.-J.; Chan, S.-H.; Huang, W.; Su, I.-J. A clustered ground-glass hepatocyte pattern represents a new prognostic marker for the recurrence of hepatocellular carcinoma after surgery. Cancer 2011, 117, 2951–2960. [Google Scholar] [CrossRef]
  41. Tsai, H.-W.; Lin, Y.-J.; Wu, H.C.; Chang, T.-T.; Wu, I.-C.; Cheng, P.-N.; Yen, C.-J.; Chan, S.-H.; Huang, W.; Su, I.-J. Resistance of ground glass hepatocytes to oral antivirals in chronic hepatitis B patients and implication for the development of hepatocellular carcinoma. Oncotarget 2016, 7, 27724–27734. [Google Scholar] [CrossRef] [PubMed] [Green Version]
Figure 1. The recognition protein regions of the pre-S1, pre-S2, and HBS monoclonal antibodies. (a) Schematic diagrams of the large (L) HBS, medium (M) HBS, and HBS proteins. LHBS includes the pre-S1 (119 a. a.), pre-S2 (55 a. a.), and S (227 a. a.) protein regions. MHBS includes the pre-S2 and S regions, whereas HBS is comprised of the S region only. (b) The binding affinities of the pre-S1 antibody to the various oligopeptides spanning the pre-S1 amino acid 21 to 47, previously shown to be highly antigenic. Top: diagram of the full-length oligonucleotide and various deletion variants. Bottom: binding affinities of the pre-S1 antibody to the various pre-S1 region oligonucleotides. (c) The binding affinities of the pre-S2 antibody to the LHBS truncated with various pre-S2 regions. Protein lysates of the 293T cells expressing various pre-S2 truncated LHBS were tested for their recognitions by the pre-S2 antibody. (d) The binding affinities of the HBS antibody to HBS truncated with various regions in the protein. Protein lysates of the 293T cells expressing various truncated HBS were tested for their recognitions by the HBS antibody. (e) Diagram for the LHBS recognition regions of the pre-S1, pre-S2, and HBS antibodies. (f) Performance of the chemiluminescence ELISA system developed in this study. The LOD, LOQ, LOL, and detection dynamic ranges of LHBS in HBsAg(+) sera are shown. Platform 1 (left), which uses the HBS antibody as detection antibody. Platform 2 (right), which uses the pre-S2 antibody as detection antibody.
Ijms 23 05376 g001
Figure 2. Correlation of the levels of serum and liver LHBS with that of HBS and viral load. (ae) Correlation of the serum LHBS with serum HBS (a) and viral load (b), and liver LHBS stain with serum LHBS (c), serum HBS (d), and viral load (e). (f,g) Comparison of LHBS stain (f) and HBS stain (g) between non-tumor liver tissue and HCC tissue. (h,i) Representative images of LHBS stain (h) and HBS stain (i) in non-tumor liver tissue (N) and HCC tissue (T). Top panels: gross views of the LHBS and HBS staining. Bottom panels: magnified images of staining results in the tumor (T) and non-tumor (N) regions. LHBS was more diffusely expressed in HCC tissue while HBS expression was diminished in HCC tissue. ** p < 0.01, *** p < 0.001, **** p < 0.0001.
Ijms 23 05376 g002
Figure 3. Correlation of the serum LHBS and HBS with HCC incidence and post-surgery recurrence. (a,b) The LHBS (a) and HBS (b) levels in CHB and HCC patients. (c,d) The LHBS (c) and HBS (d) levels in the HCC patients with or without recurrence. The p value for each correlation analysis is shown below the corresponding graph. * p < 0.05, *** p < 0.001, **** p < 0.0001.
Ijms 23 05376 g003
Figure 4. Kaplan–Meier analyses of serum LHBS (a,b) and liver LHBS stain (c,d) in disease-free survival and overall survival. The p value for each correlation analysis is shown below the corresponding graph. * p < 0.05.
Ijms 23 05376 g004
Table 1. Amino acid sequences of the complementarity-determining regions in the variable regions of the monoclonal antibodies developed in this study.
AntibodyCDR Sequences
Pre-S1Heavy chain
GYSITSDYA (CDR1)….IRYSGTT (CDR2)….ARGGTGLTY (CDR3)
Kappa light chain
ENVGTY (CDR1)….GAS (CDR2)….GQTYNYPFT (CDR3)
Pre-S2Heavy chain
GYTFTSYW (CDR1)….INPSNGIT (CDR2)….TIGYDYGSNYEAMDF (CDR3)
Kappa light chain
KSLLHSNGITY (CDR1)….QMS (CDR2)….AQNLELPWT (CDR3)
HBSHeavy chain
GYTLTDYVIG (CDR1)….EVYPGSVYTSYNEKFKG (CDR2)….AYDGYSPFDY (CDR3)
Kappa light chain
KASENVGTYVS (CDR1)….GASNRYI (CDR2)….GQSYNYPHT (CDR3)
Table 2. Association of serum LHBS and HBS with various clinicopathologic indicators in the HCC clinical cohort.
FactorsGroupSerum LHBS (ng/mL) Mean (S.D.)p ValueSerum HBS (ng/mL) Mean (S.D.)p Value
Age<60 years20.57 (20.33)0.506778.94 (559.90)0.970
≥60 years33.04 (38.35)1030.32 (1199.85)
SexMale26.00 (27.74)0.442929.93 (890.06)0.275
Female20.90 (32.44)607.32 (568.75)
CirrhosisAbsent14.78 (25.65)0.005 *725.67 (807.28)0.153
Present30.77 (28.63)949.18 (864.96)
HBeAgAbsent26.81 (28.46)0.238926.86 (935.48)0.732
Present20.10 (28.79)708.05 (502.38)
Serum AFP (ng/mL)<20025.06 (29.25)0.687868.08 (874.88)0.742
≥20024.96 (24.98)874.53 (691.82)
Viral load (IU/mL)<20,00021.80 (29.65)0.157674.75 (871.87)0.061
≥20,00028.96 (26.96)1103.84 (761.18)
Tumor differentiationW17.84 (9.49)0.705634.77 (550.53)0.471
M-P26.32 (30.48)910.71 (884.07)
Multifocal tumorsAbsent23.07 (26.56)0.294784.99 (664.80)0.359
Present38.01 (38.54)1421.50 (1564.14)
Satellite noduleAbsent25.12 (30.22)0.566818.02 (875.01)0.117
Present24.71 (20.14)1088.51 (689.43)
Tumor size<5 cm23.63 (28.09)0.684766.13 (844.84)0.098
≥5 cm27.78 (29.67)1069.19 (828.50)
Vascular invasionAbsent19.34 (23.03)0.238684.03 (516.76)0.242
Present31.82 (33.29)1098.15 (1084.99)
AJCC stageI-II14.79 (16.59)0.010 *588.15 (470.62)0.010 *
IIIA-C37.42 (34.63)1208.49 (1058.58)
Pre-S deletionAbsent28.88 (32.94)0.833806.16 (832.59)0.445
Present22.52 (25.27)910.33 (861.86)
*: p < 0.05. Tumor differentiation according to WHO system; AFP, alpha-fetoprotein; AJCC, American Joint Committee on Cancer 2017.
Table 3. Association of liver tissue LHBS staining with various clinicopathologic indicators in the HCC clinical cohort.
FactorsGroupLiver LHBS (%) Mean (S.D.)p ValueTumor LHBS (%) Mean (S.D.)p Value
Age<60 years26.85 (16.48)0.38341.29 (32.13)0.264
≥60 years23.42 (17.63)50.68 (31.47)
SexMale26.85 (16.48)0.14241.29 (32.13)0.205
Female23.42 (17.63)50.68 (31.47)
CirrhosisAbsent18.89 (14.03)0.044 *61.31 (27.52)0.007 *
Present29.38 (17.25)35.35 (30.71)
HBeAgAbsent25.89 (17.20)0.93643.17 (34.52)0.578
Present24.85 (16.29)48.78 (23.80)
Serum AFP (ng/mL)<20024.22 (15.68)0.29744.37 (32.34)0.893
≥20033.50 (21.70)46.25 (31.48)
Viral load (IU/mL)<20,00021.93 (14.76)0.11642.96 (31.74)0.641
≥20,00030.08 (18.33)46.70 (32.69)
Tumor differentiationW27.87 (11.24)0.41243.12 (24.63)0.932
M-P25.22 (17.69)44.93 (33.27)
Multifocal tumorsAbsent24.86 (16.45)0.47845.47 (32.32)0.634
Present30.57 (19.67)39.28 (30.88)
Satellite noduleAbsent23.95 (17.10)0.08641.67 (31.33)0.138
Present32.80 (14.07)57.50 (32.85)
Tumor size<5 cm24.71 (15.05)0.79246.77 (30.67)0.509
≥5 cm27.38 (20.16)40.55 (34.76)
Vascular invasionAbsent22.37 (16.48)0.06134.14 (31.28)0.009 *
Present30.66 (16.28)57.50 (28.59)
AJCC stageI-II23.93 (16.62)0.44243.93 (30.54)0.809
IIIA-C27.66 (17.18)45.54 (34.15)
Pre-S deletionAbsent24.19 (16.14)0.69658.09 (29.47)0.052
Present26.56 (17.43)35.84 (30.76)
*: p < 0.05. Tumor differentiation according to WHO system; AFP, alpha-fetoprotein; AJCC, American Joint Committee on Cancer 2017.
Table 4. Association of liver tissue HBS staining with various clinicopathologic indicators in the HCC clinical cohort.
FactorsGroupLiver HBS (%) Mean (S.D.)p ValueTumor HBS (%)
Mean (S.D.)
p Value
Age<60 years22.70 (16.56)0.2283.50 (8.57)0.177
≥60 years17.05 (15.71)7.10 (16.11)
SexMale22.90 (16.67)0.0563.69 (7.82)0.980
Female11.10 (10.93)9.50 (22.13)
CirrhosisAbsent17.21 (13.68)0.3587.26 (17.45)0.611
Present22.61 (17.54)3.41 (6.95)
HBeAgAbsent21.05 (16.76)0.9202.61 (6.51)0.055
Present19.64 (15.65)10.85 (19.50)
Serum AFP (ng/mL)<20018.91 (14.61)0.1794.37 (11.90)0.223
≥20030.62 (22.55)7.12 (11.78)
Viral load (IU/mL)<20,00017.34 (14.87)0.1132.13 (4.54)0.077
≥20,00024.70 (17.42)8.00 (16.45)
Tumor differentiationW26.75 (11.96)0.14210.25 (24.30)0.687
M-P19.60 (16.88)3.82 (8.03)
Multifocal tumorsAbsent19.95 (16.11)0.4313.82 (7.93)0.787
Present25.42 (18.35)11.14 (26.12)
Satellite noduleAbsent18.41 (15.98)0.045 *5.72 (12.94)0.112
Present30.40 (14.87)0.80 (1.75)
Tumor size<5 cm19.34 (15.09)0.5475.34 (13.22)0.488
≥5 cm23.27 (18.71)3.72 (8.67)
Vascular invasionAbsent16.74 (14.39)0.0555.66 (14.62)0.707
Present25.87 (17.55)4.20 (8.38)
AJCC stageI-II18.55 (15.73)0.2874.51 (9.43)0.562
IIIA-C23.25 (17.01)5.12 (14.38)
Pre-S deletionAbsent22.00 (17.40)0.6967.90 (16.56)0.207
Present19.81 (15.83)2.75 (6.80)
*: p < 0.05. Tumor differentiation according to WHO system; AFP, alpha-fetoprotein; AJCC, American Joint Committee on Cancer 2017.
Table 5. Prognostic significance of clinicopathological indicators, HBsAg expression, and HBV serum profiles for disease-free survival in HCC patients.
FactorGroupDisease-Free Survival
UnivariateMultivariate
HR (95% CI)p ValueHR (95% CI)p Value
Age<60/≥60 years0.517 (0.205–1.305)0.163
SexMale/female0.538 (0.160–1.805)0.315
Cirrhosis−/+1.121 (0.479–2.621)0.793
Serum AFP<200/≥200 ng/mL1.570 (0.585–4.213)0.371
Viral load<20,000/≥20,000 IU/mL2.354 (1.028–5.394)0.043 * NS
DifferentiationW/M-P1.709 (0.508–5.748)0.419
Multifocal tumor−/+2.056 (0.699–6.044)0.190
Satellite nodule−/+1.945 (0.768–4.930)0.161
Tumor size<5/≥5 cm4.140 (1.833–9.352)0.001 *3.979 (1.750–9.048)0.001 *
Vascular invasion−/+2.317 (1.023–5.248)0.044 *2.590 (1.157–5.797)NS
AJCC stageI-II/IIIA-C2.762 (1.142–6.681)0.024 * NS
HBeAg−/+1.173 (0.486–2.833)0.723
Pre-S deletion−/+0.852 (0.379–1.916)0.698
Serum HBS<1000/≥1000 ng/mL1.806 (0.798–4.088)0.156
Serum LHBS<25/≥25 ng/mL2.246 (1.007–5.010)0.048 *2.267 (1.001–5.137)NS
Small HBS stain<30/≥30%1.686 (0.748–3.802)0.208
LHBS stain<30/≥30%2.811 (1.229–6.433)0.014 *2.650 (1.154–6.087)0.022 *
*: p < 0.05. Tumor differentiation according to WHO system; AFP, alpha-fetoprotein; AJCC, American Joint Committee on Cancer 2017; NS, not significant.
Table 6. Prognostic significance of clinicopathological indicators, HBsAg expression, and HBV serum profiles for overall survival in HCC patients.
FactorGroupOverall Survival
UnivariateMultivariate
HR (95% CI)p ValueHR (95% CI)p Value
Age<60/≥60 years0.453 (0.126–1.624)0.224
SexMale/female0.035 (0.000–15.883)0.283
Cirrhosis−/+1.533 (0.480–4.897)0.471
Serum AFP<200/≥200 ng/mL0.800 (0.179–3.577)0.770
Viral load<20,000/≥20,000 IU/mL2.188 (0.730–6.557)0.162
DifferentiationW/M-P1.609 (0.357–7.249)0.535
Multifocal tumor−/+5.266 (1.549–17.899)0.008 *27.399 (4.053–185.239)0.001 *
Satellite nodule−/+1.996 (0.621–6.416)0.246
Tumor size<5/≥5 cm4.195 (1.398–12.591)0.011 *19.935 (3.387–117.335)0.001 *
Vascular invasion−/+2.892 (1.114–7.513)0.029 * NS
AJCC stageI-II/IIIA-C4.750 (1.314–17.173)0.017 * NS
HBeAg−/+1.225 (0.376–3.992)0.736
Pre-S deletion−/+0.911 (0.317–2.615)0.863
Serum HBS<1000/≥1000 ng/mL2.745 (0.921–8.179)0.070
Serum LHBS<40/≥40 ng/mL3.508 (1.183–10.406)0.024 *6.432 (1.276–32.422)0.024 *
Small HBS stain<30/≥30%2.046 (0.713–5.876)0.183
LHBS stain<30/≥30%5.431 (1.513–19.497)0.009 *5.250 (1.295–21.278)0.020 *
*: p < 0.05. Tumor differentiation according to WHO system; AFP, alpha-fetoprotein; AJCC, American Joint Committee on Cancer 2017; NS, not significant.
Publisher’s Note: MDPI stays neutral with regard to jurisdictional claims in published maps and institutional affiliations.

