
Whole-Tissue Three-Dimensional Imaging of Rice at Single-Cell Resolution

 and
and 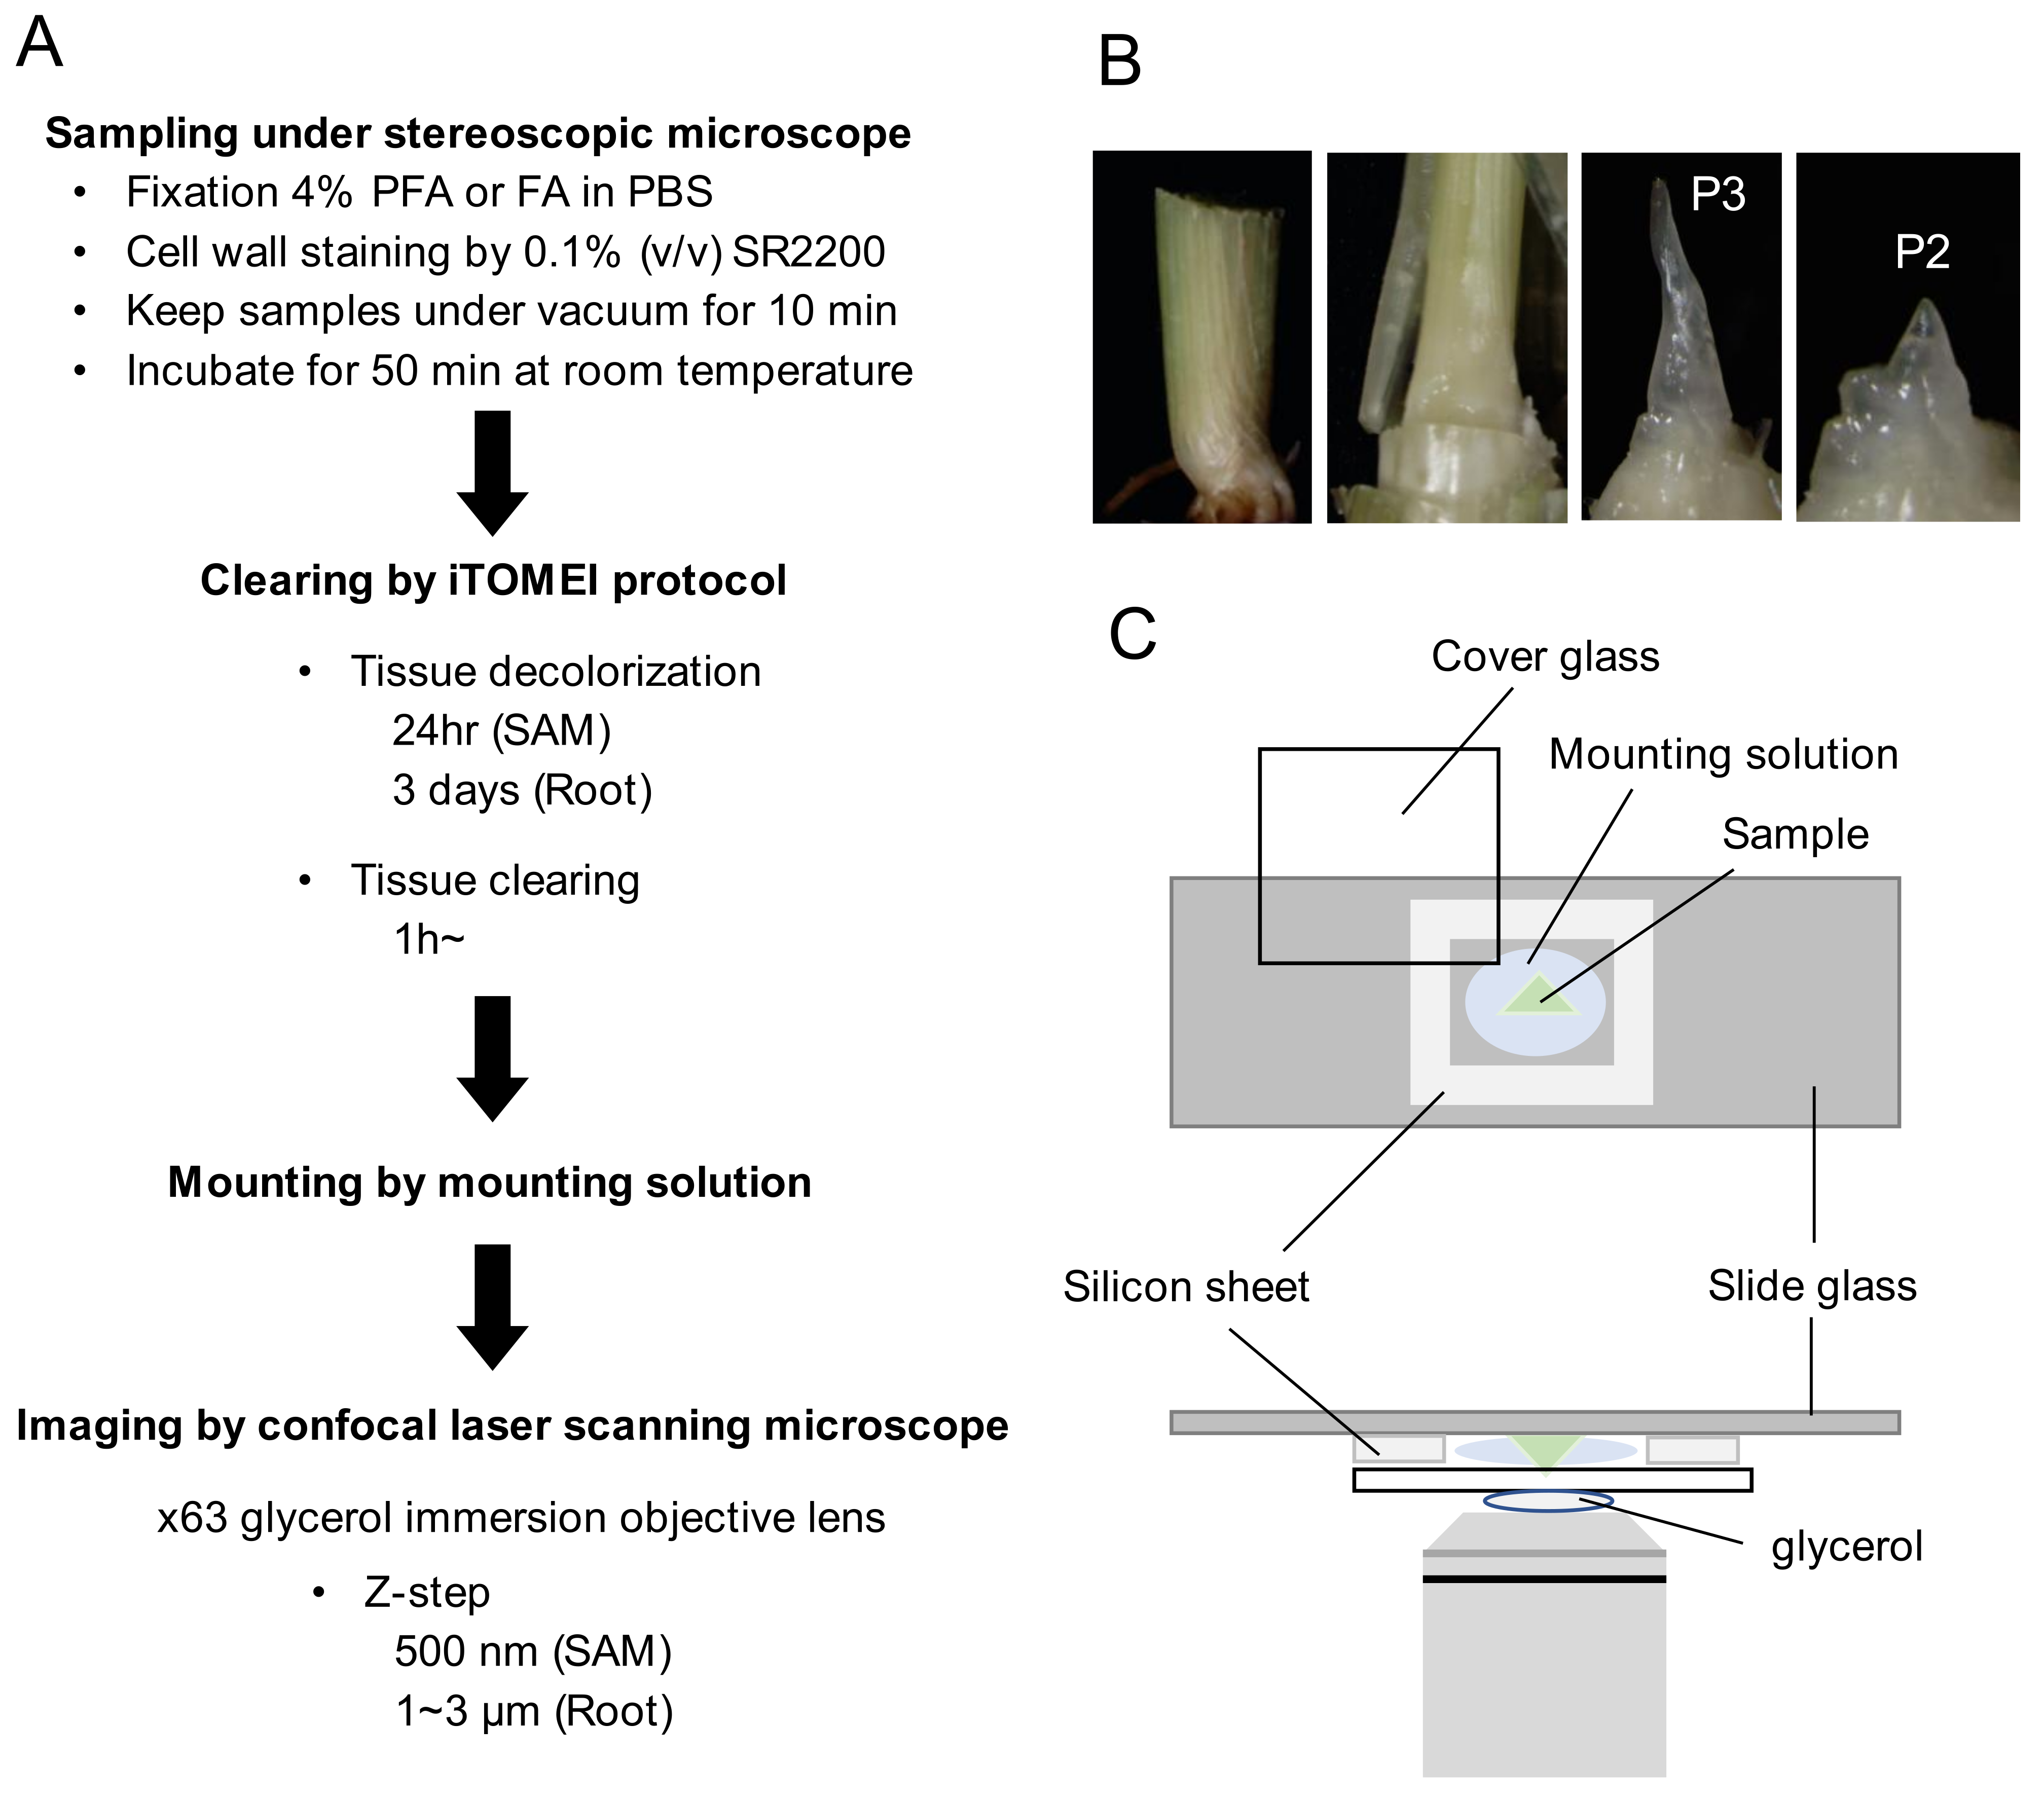
Abstract
1. Introduction
2. Results
2.1. Development of a Tissue Clearing and 3D Imaging Protocol in Rice
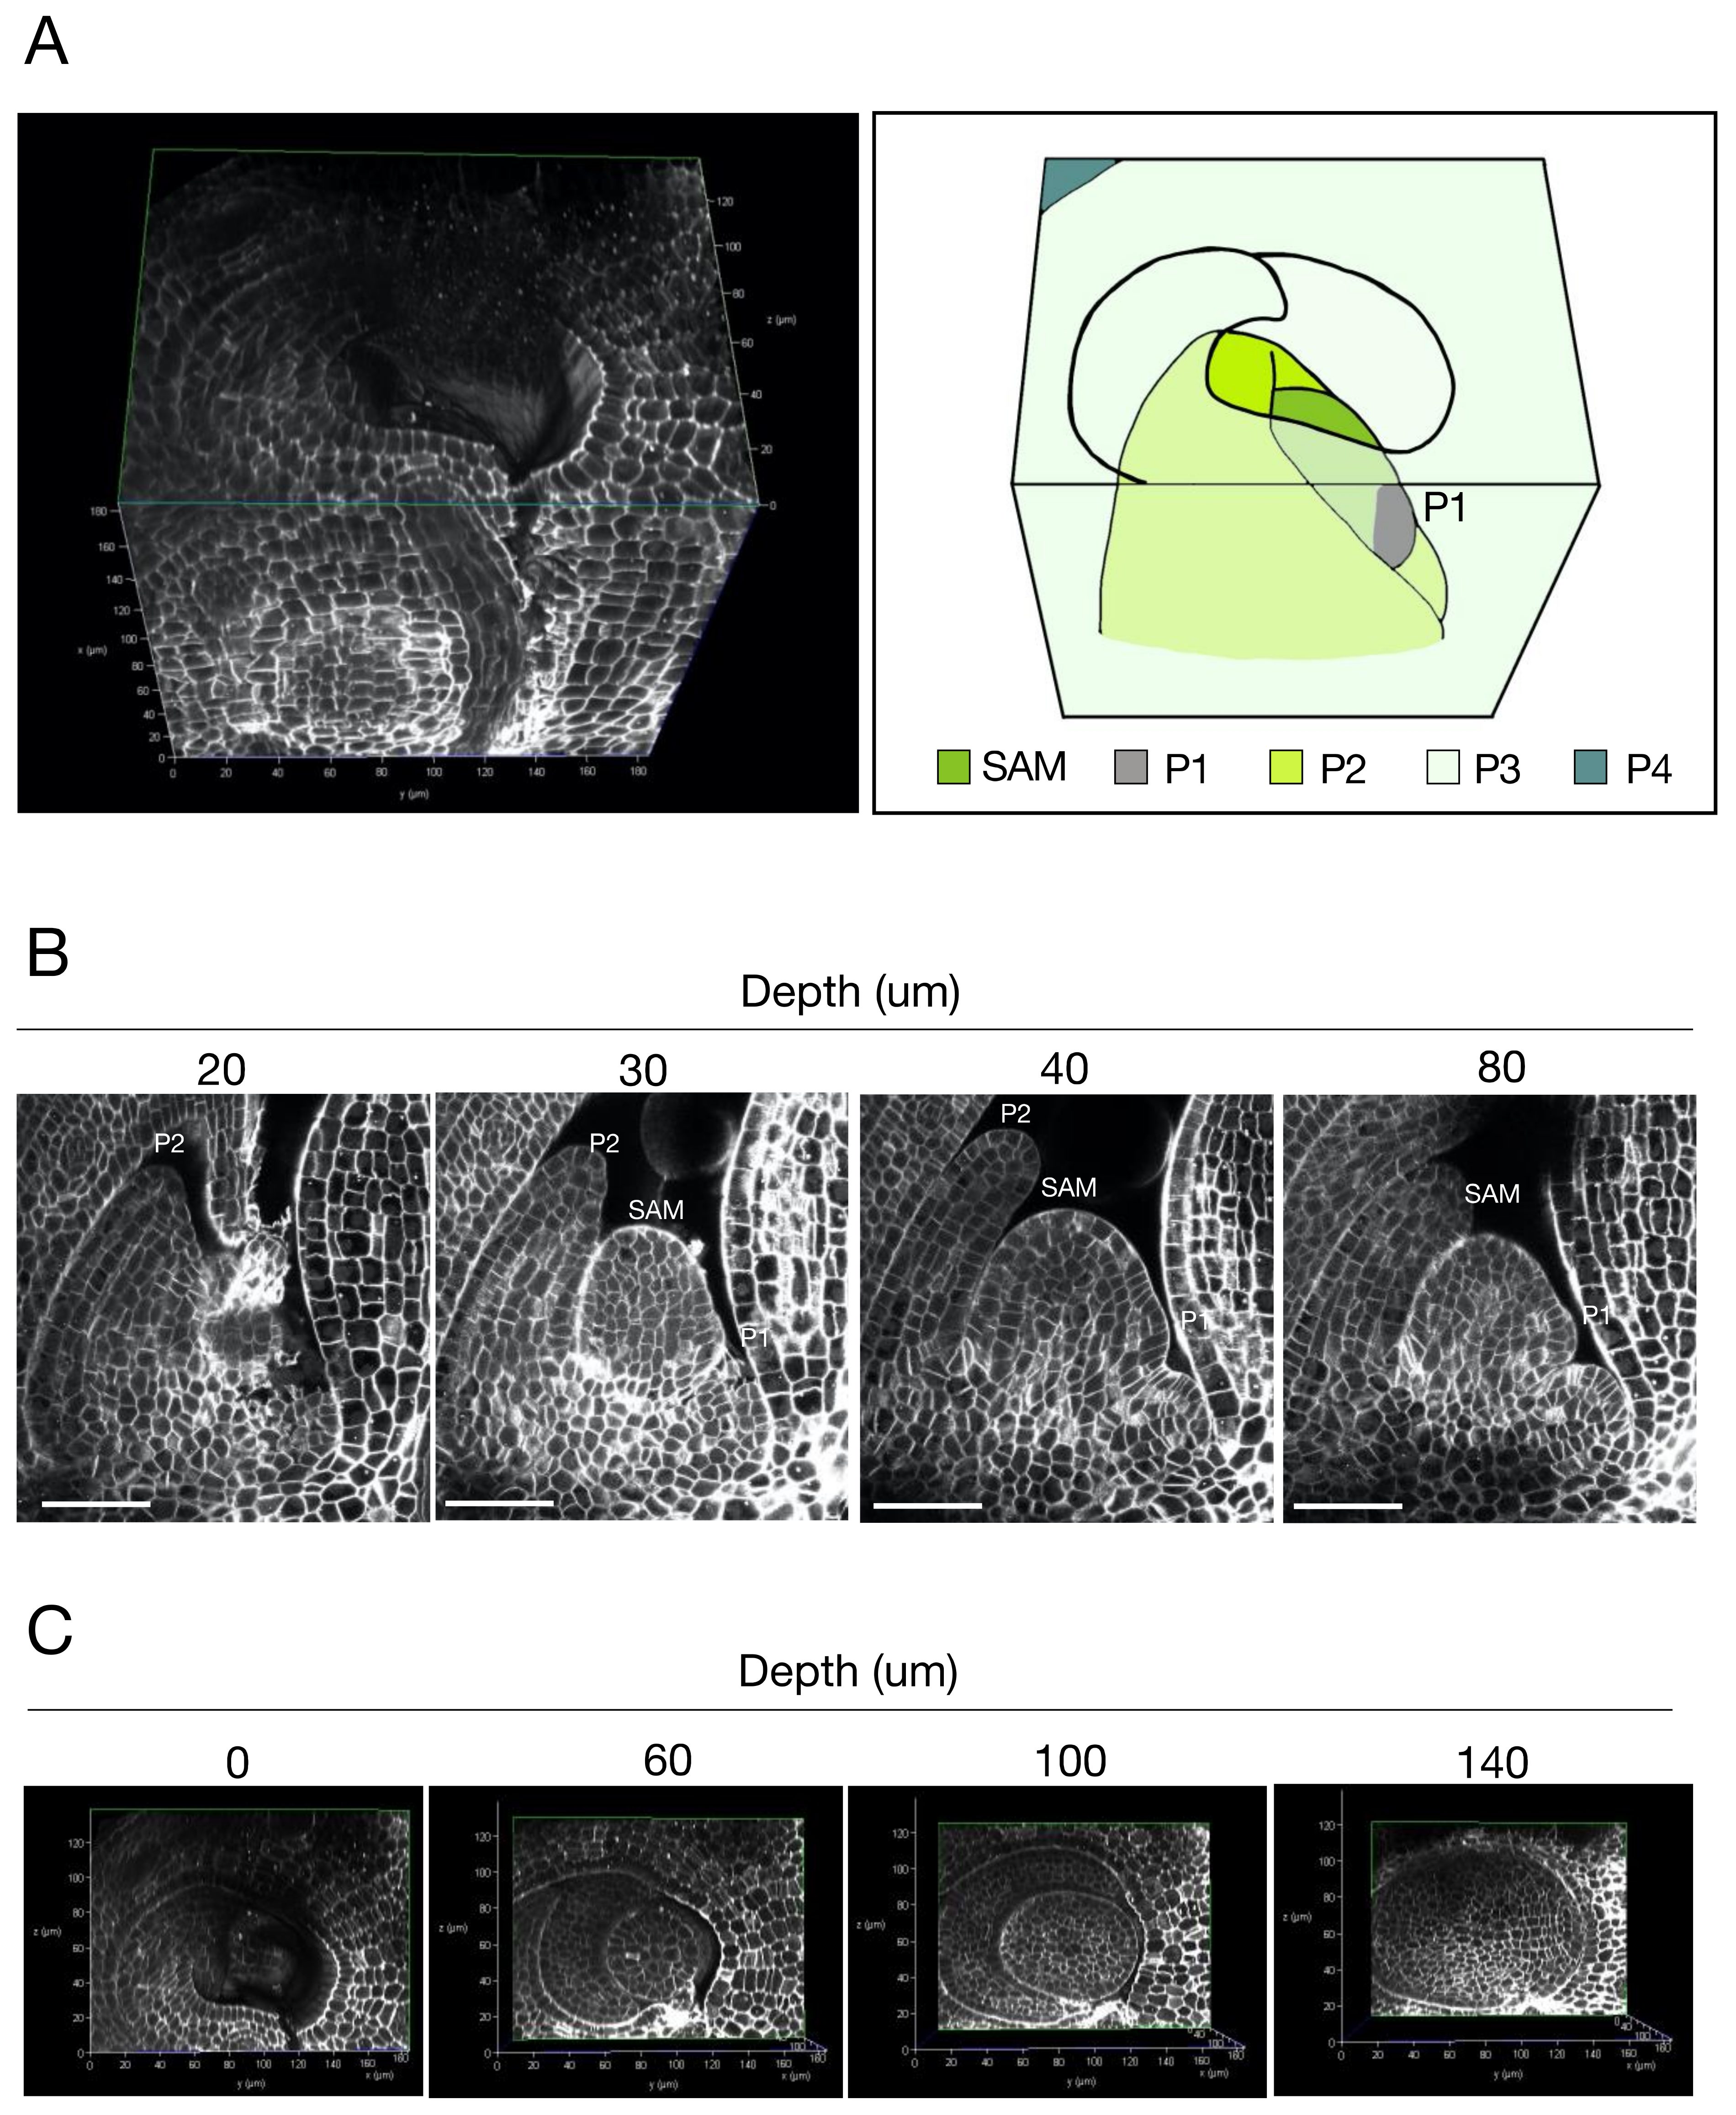
2.2. Three-Dimensional Imaging of Rice SAMs with Single-Cell Resolution
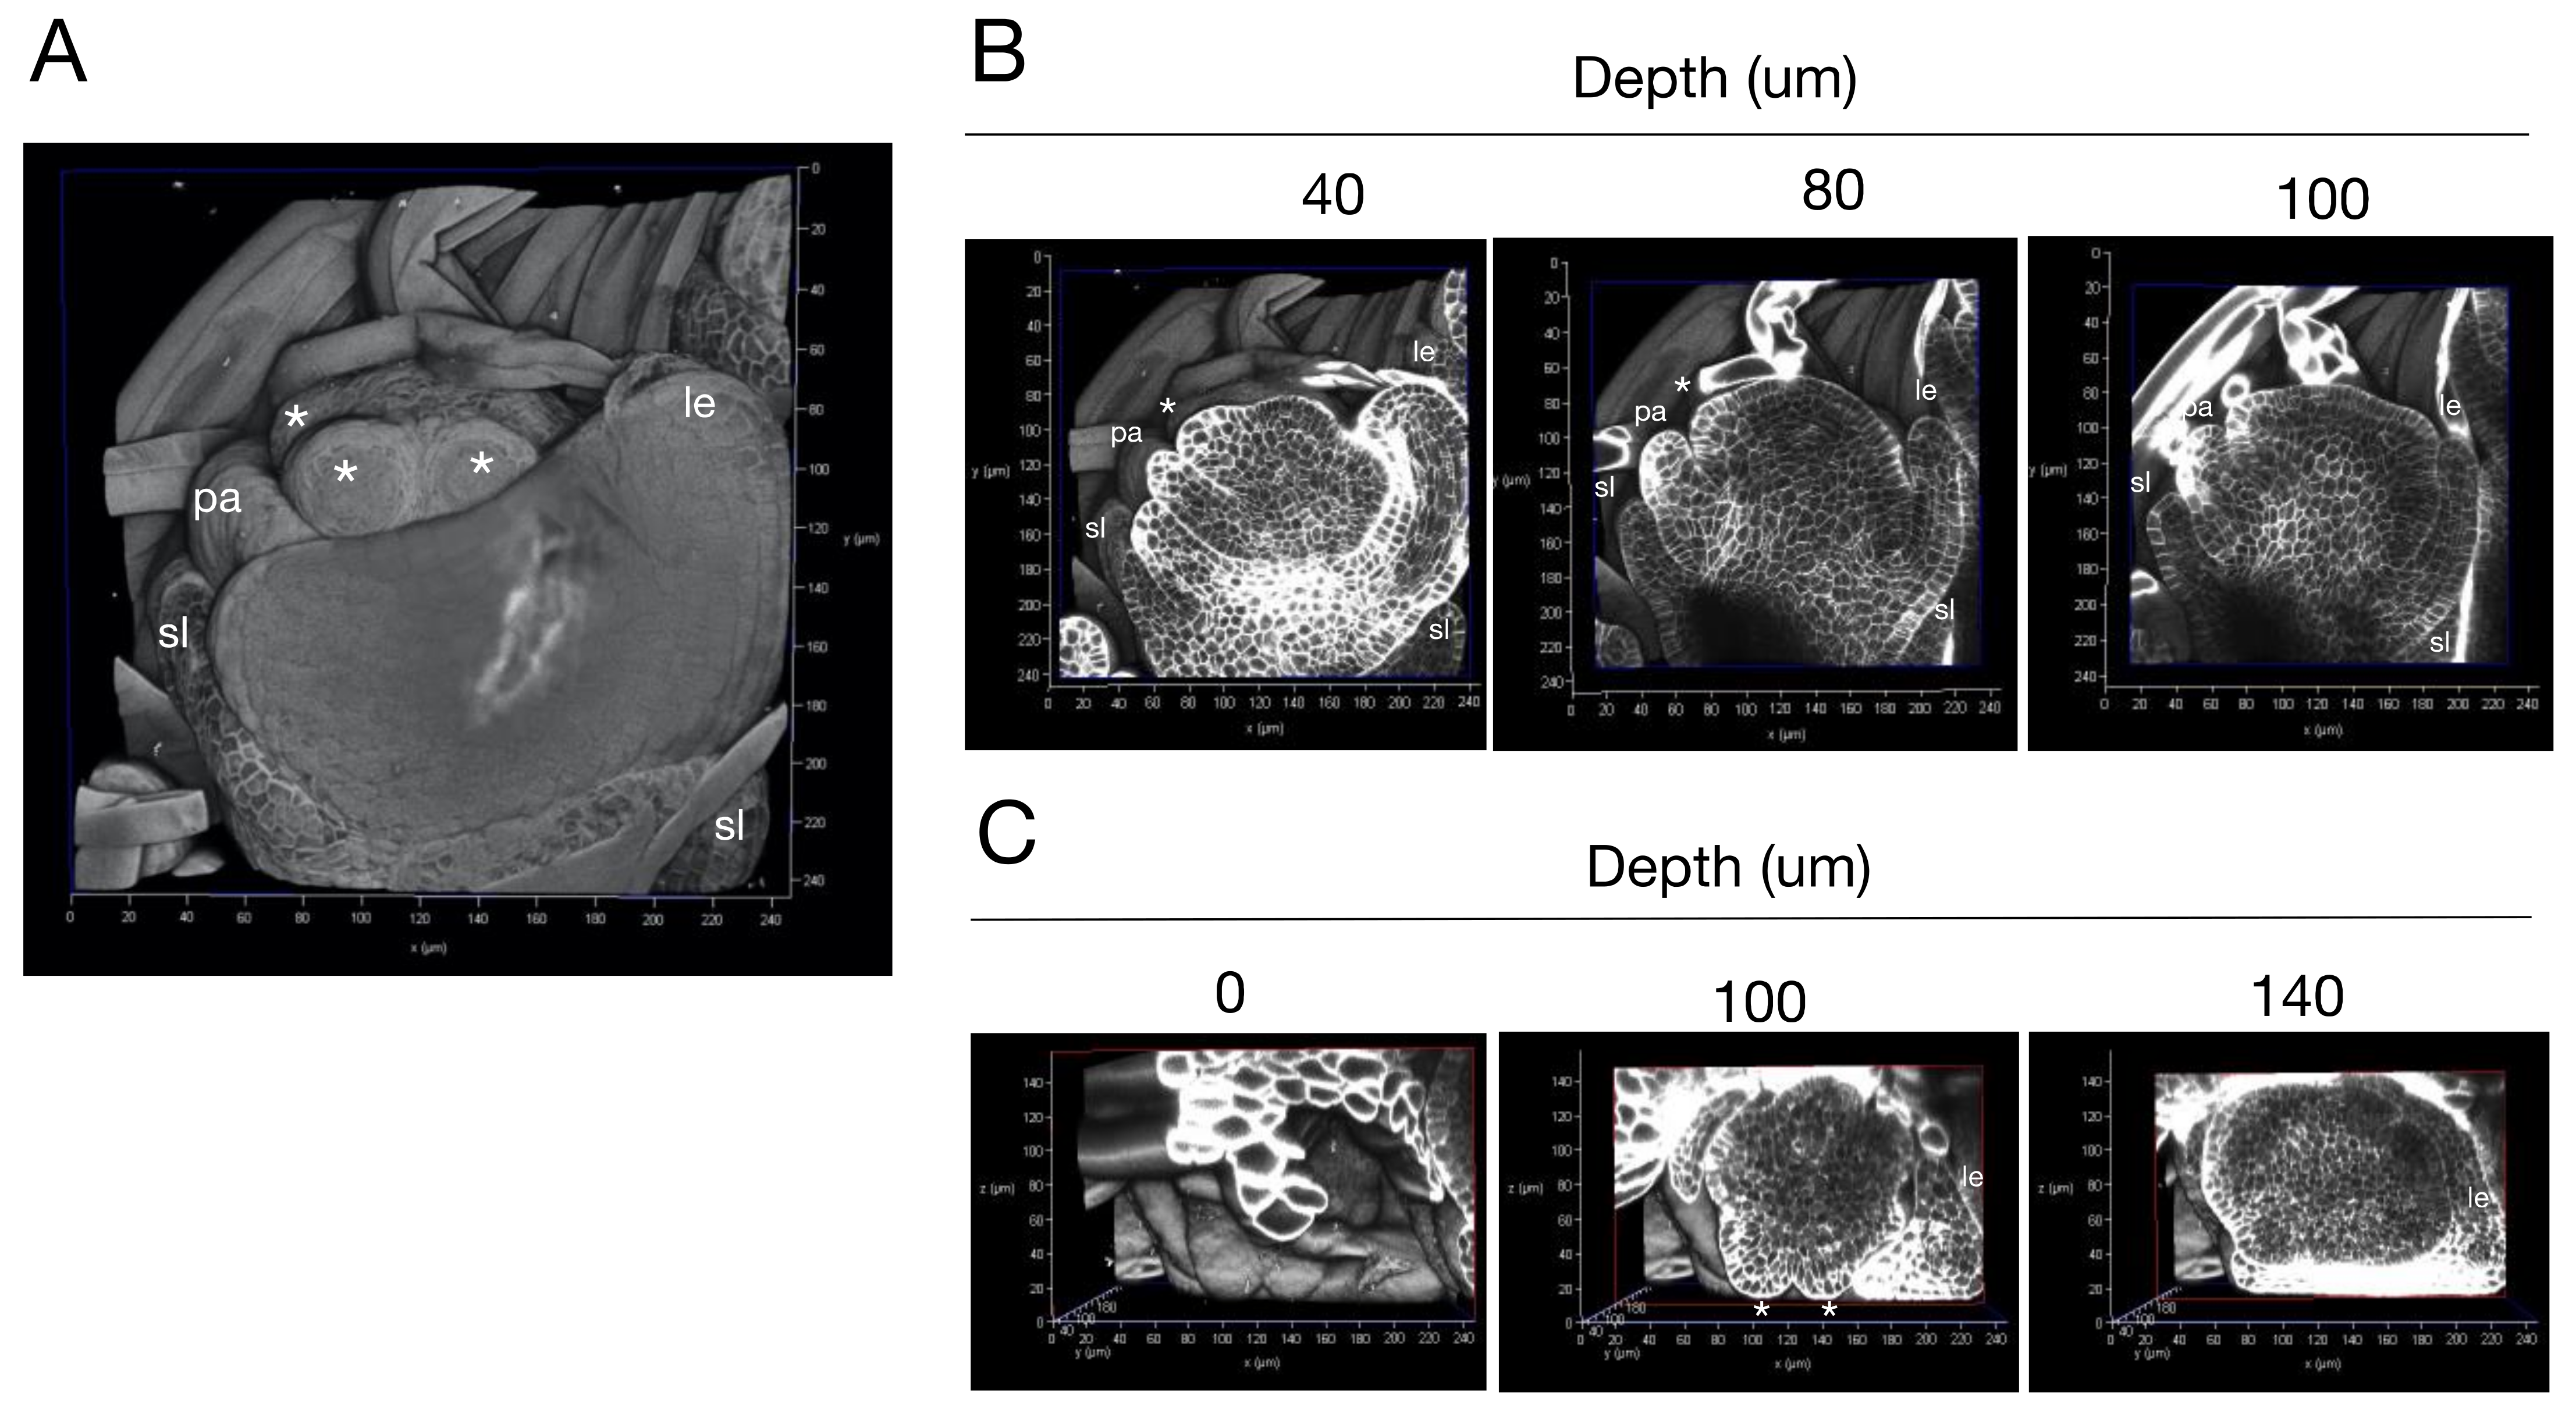
2.3. Three-Dimensional Imaging of Rice Florets with Single-Cell Resolution
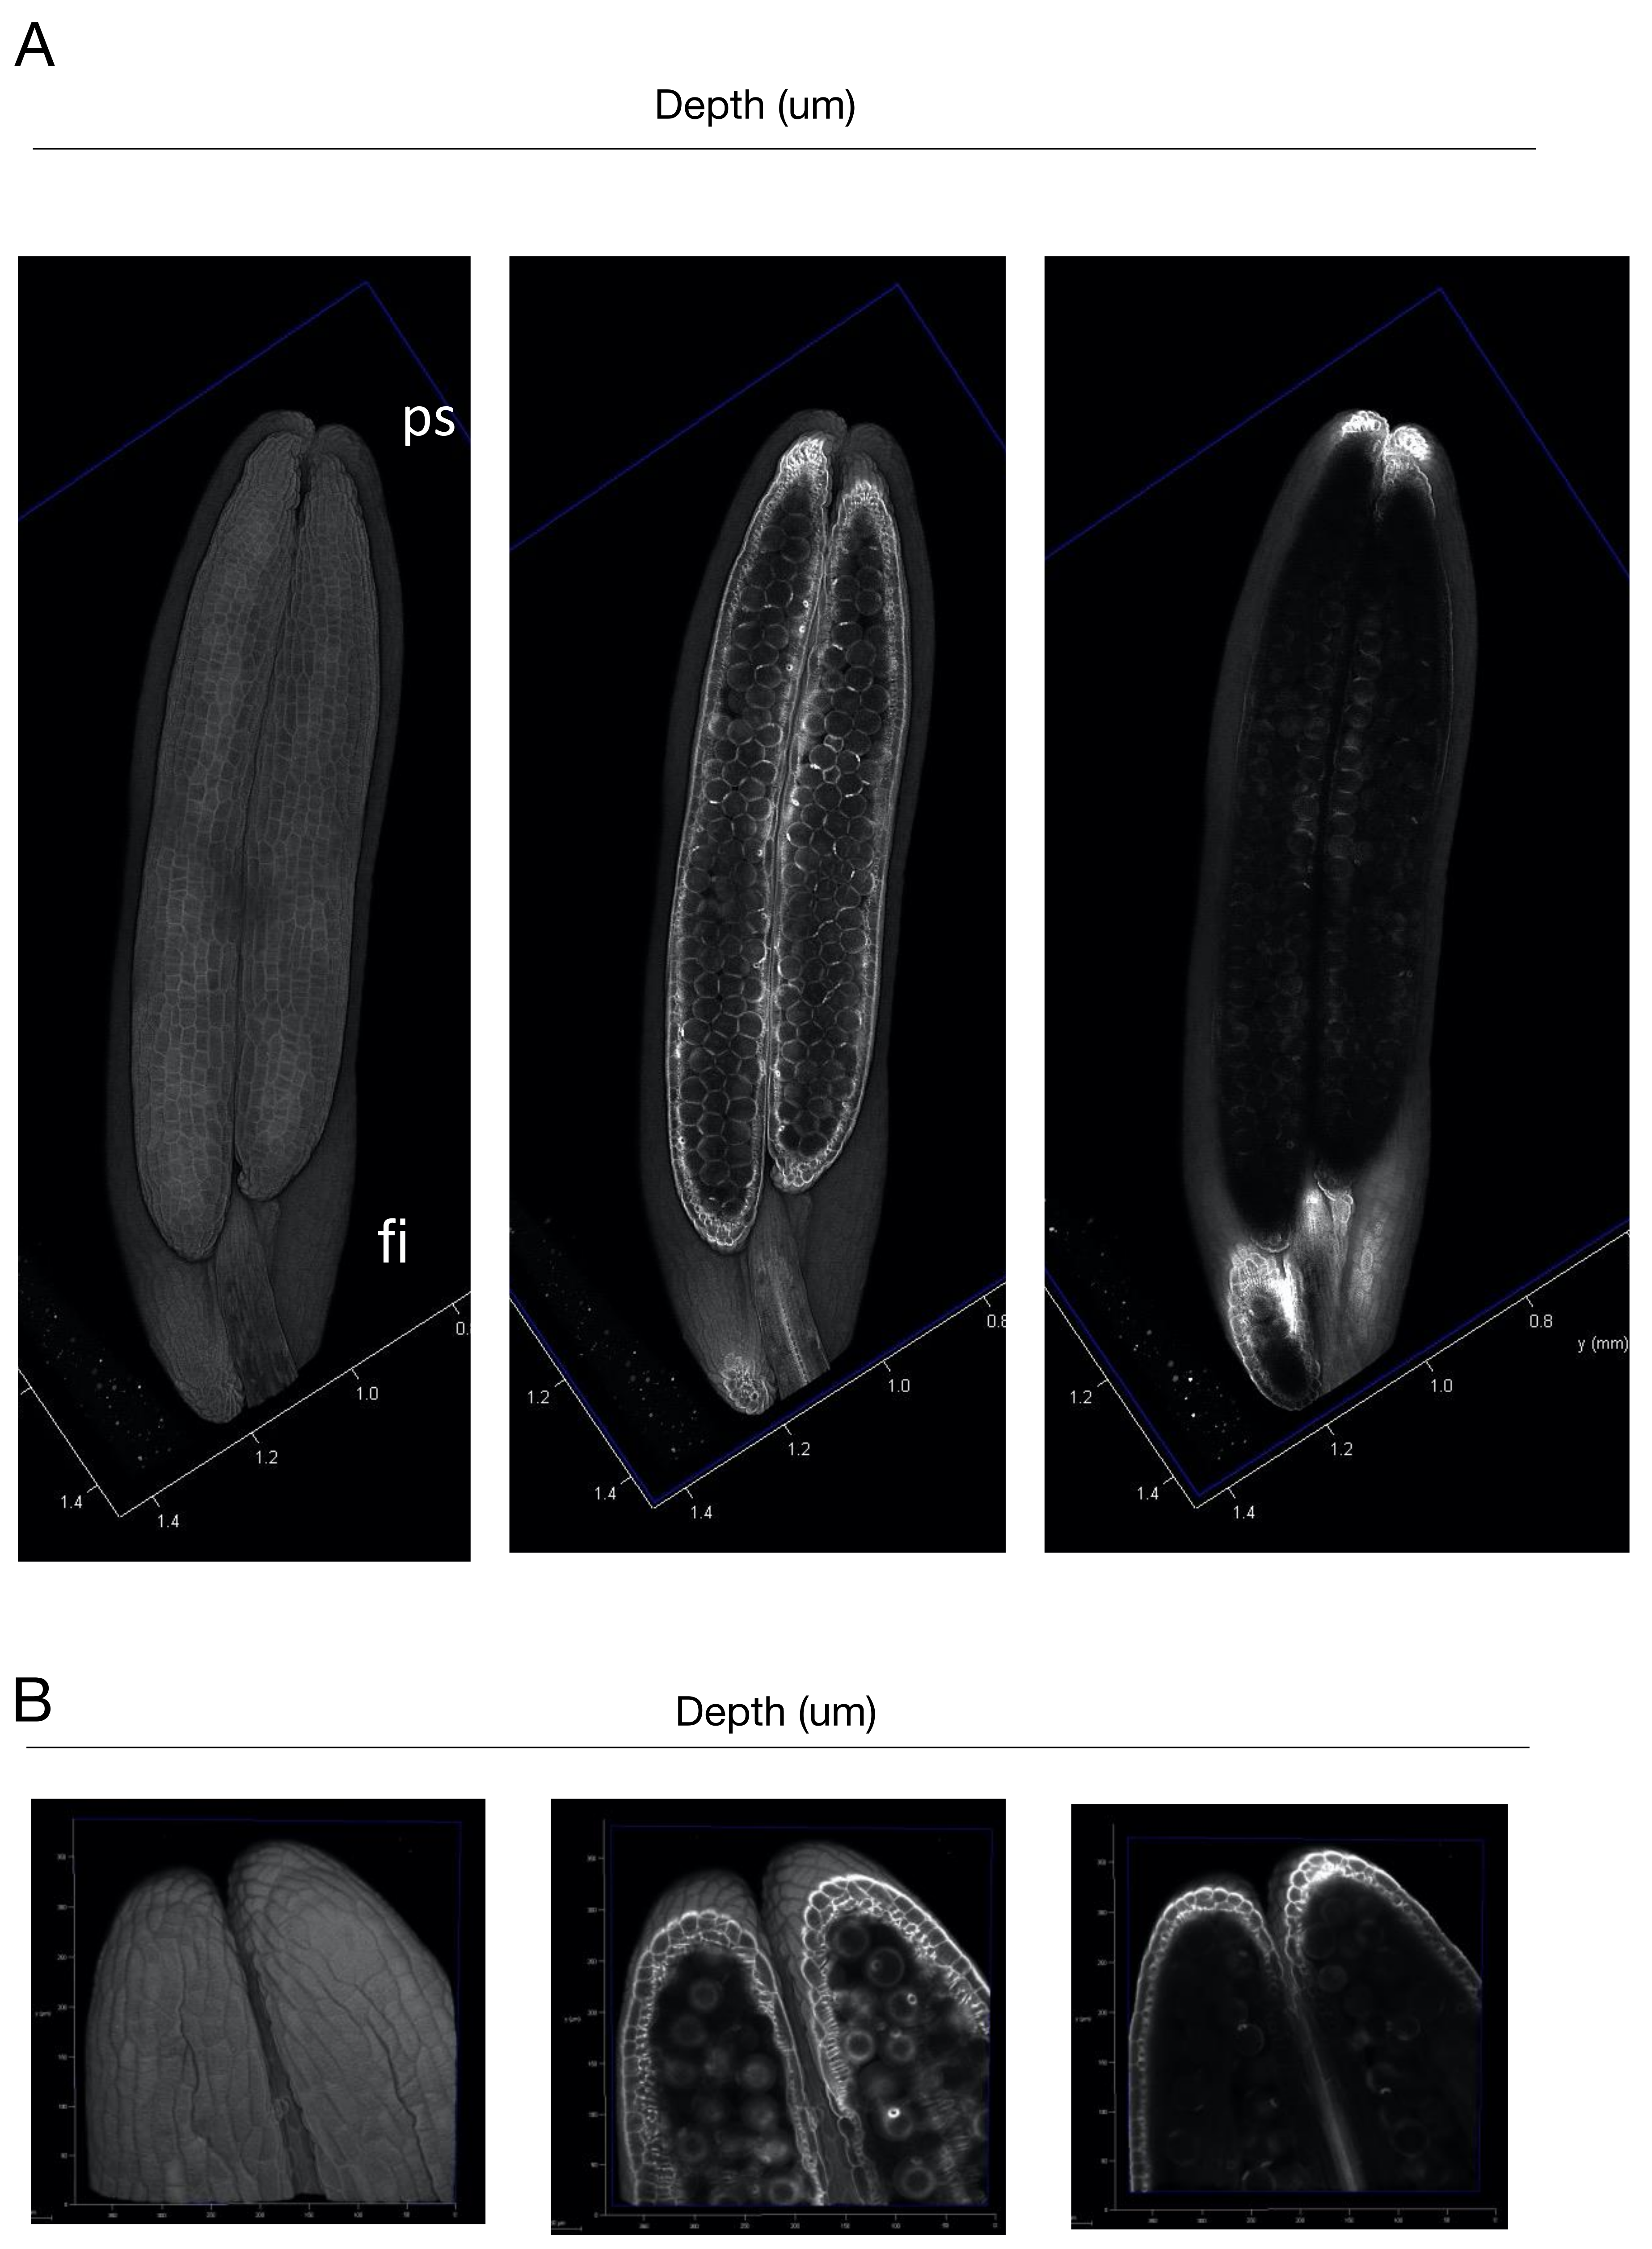
2.4. Three-Dimensional Imaging of the Rice Anther with Single-Cell Resolution
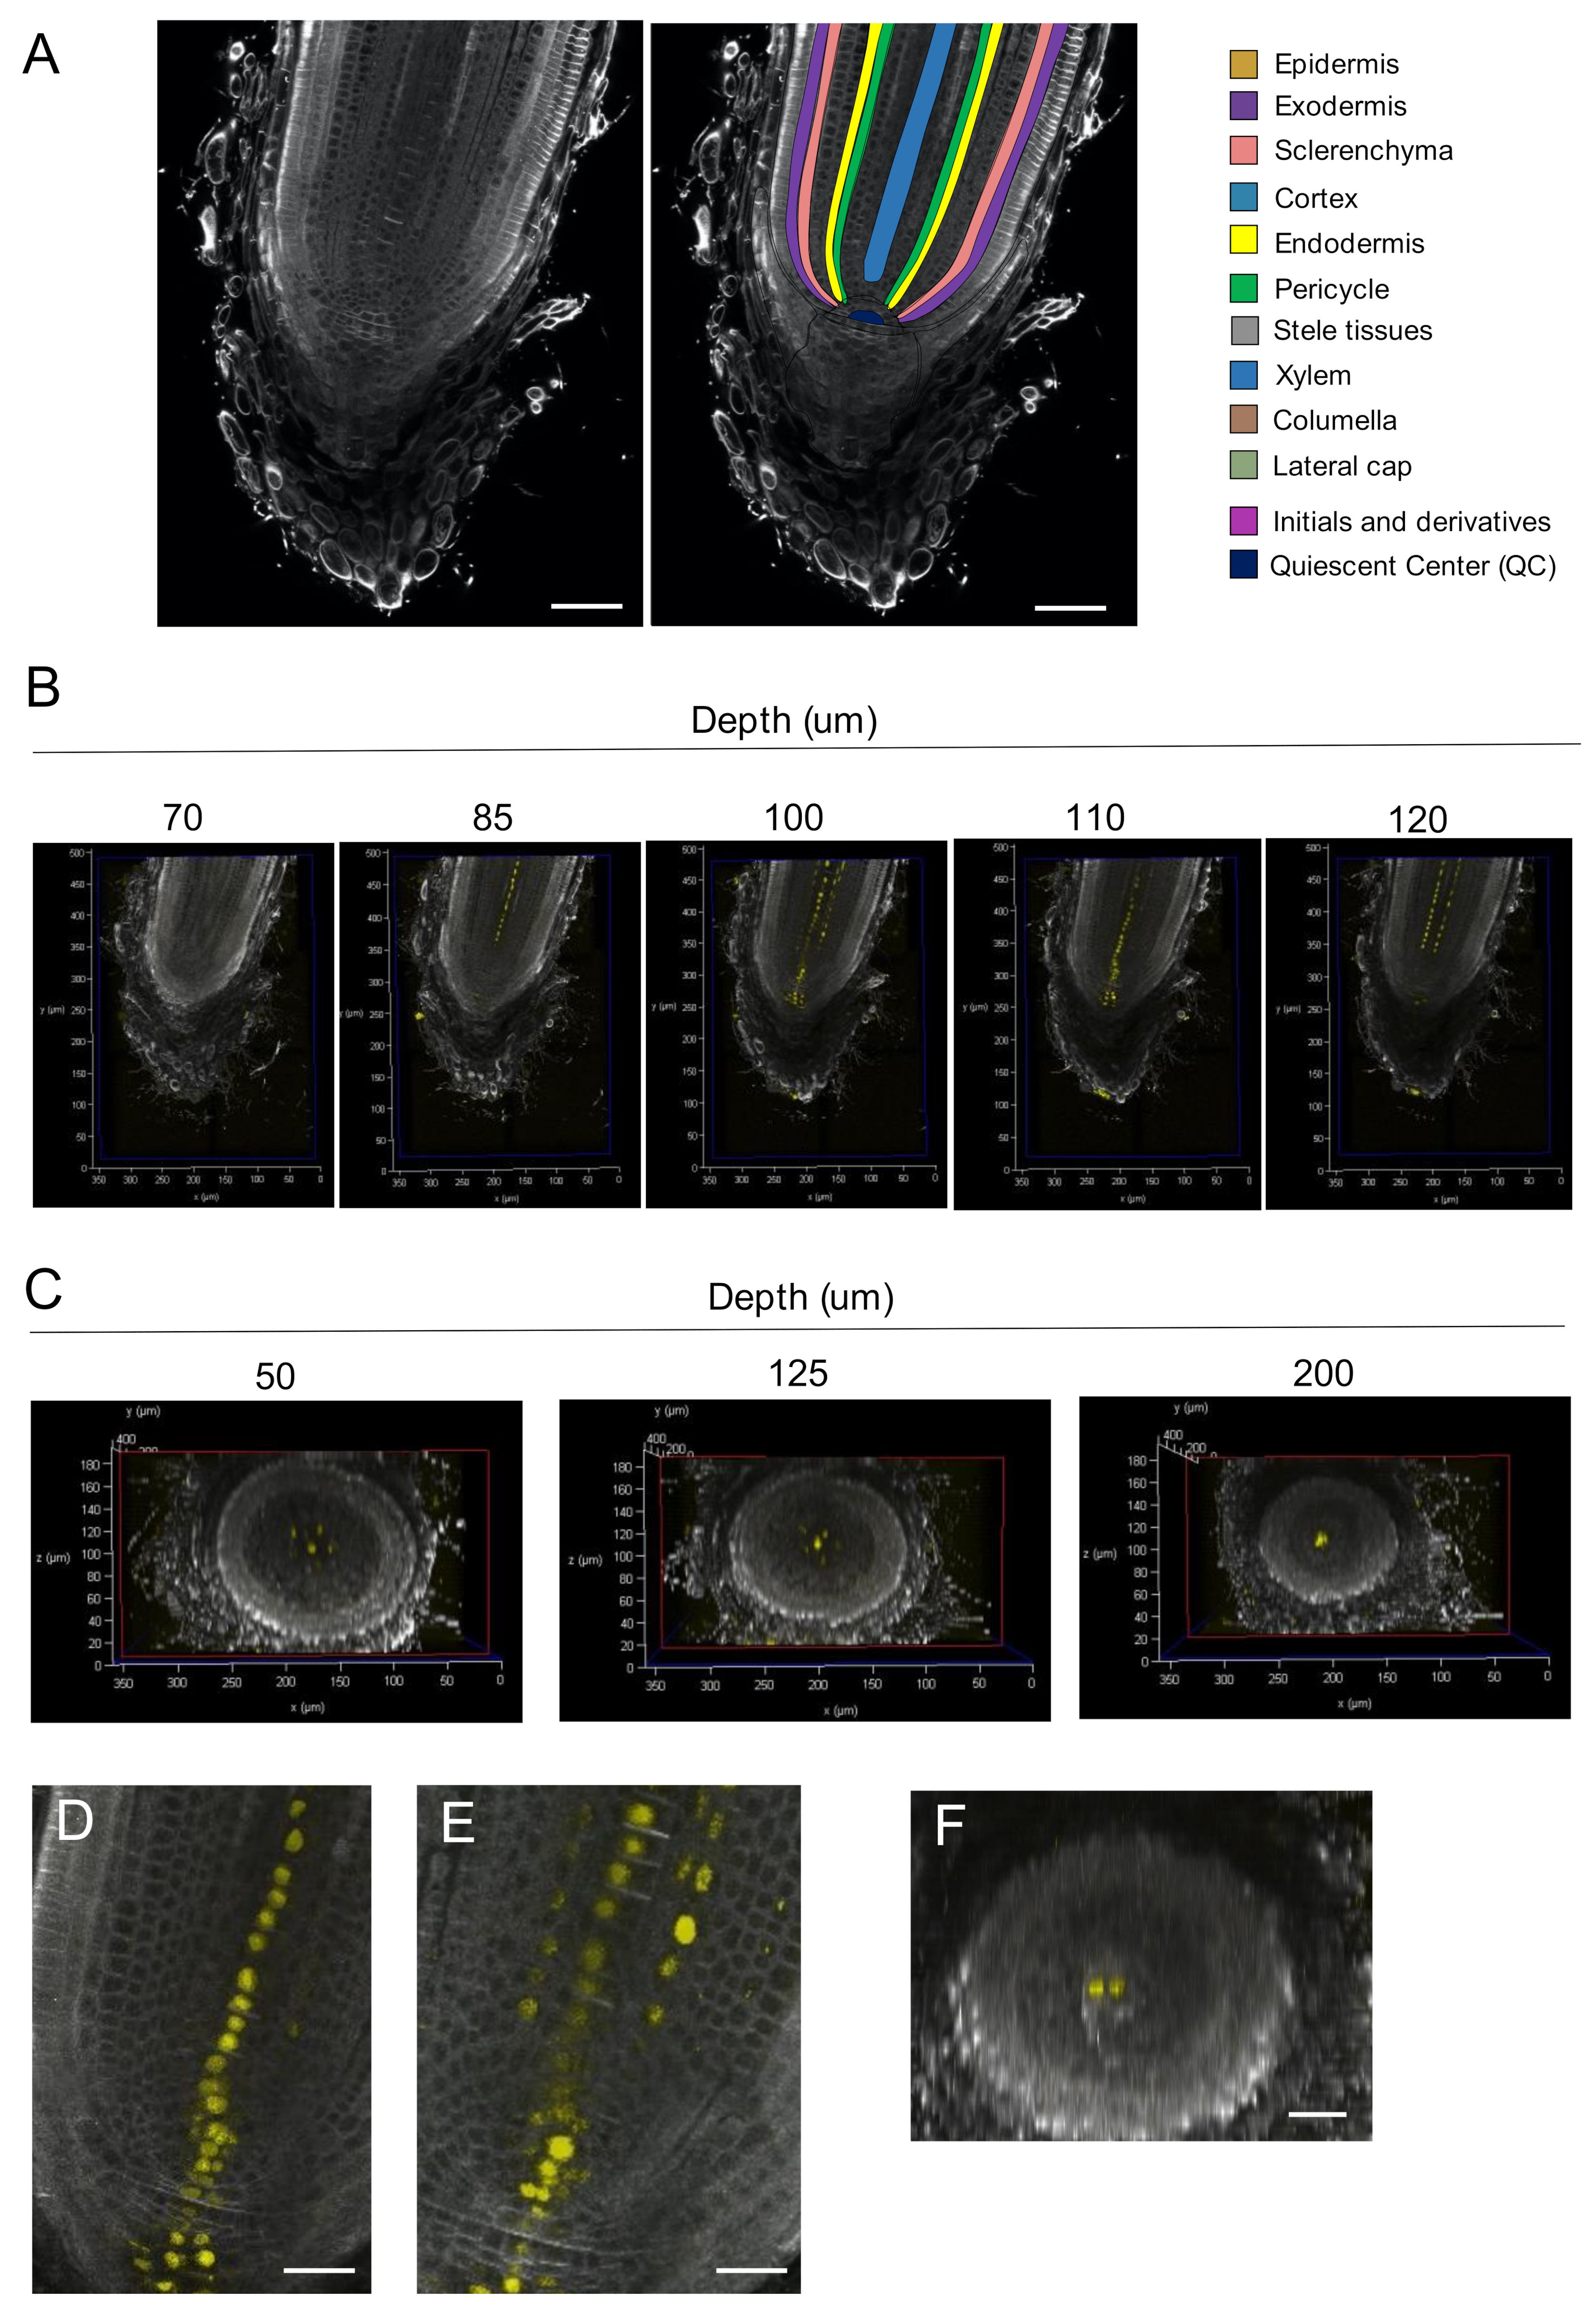
2.5. Three-Dimensional Imaging of the Rice RAM with Single-Cell Resolution
3. Discussion
3.1. Tissue Clearing and 3D Imaging Enabled the Precise Evaluation of the Cellular Arrangement of Rice Tissues
3.2. Spatial Distribution of DR5 Signals in the Root Tip
4. Materials and Methods
4.1. Plant Materials and Growth Conditions
4.2. Sampling of Rice Shoot Apical Meristems and Florets
4.3. Fixation and Cell-Wall Staining
4.4. Clearing by the iTOMEI Protocol
4.5. Mounting Samples and Imaging by a Confocal Laser Scanning Microscope
Supplementary Materials
Author Contributions
Funding
Institutional Review Board Statement
Informed Consent Statement
Data Availability Statement
Conflicts of Interest
References
- Chan, C.J.; Heisenberg, C.-P.; Hiiragi, T. Coordination of Morphogenesis and Cell-Fate Specification in Development. Curr. Biol. 2017, 27, R1024–R1035. [Google Scholar] [CrossRef]
- Hirano, H.-Y.; Tanaka, W. Stem Cell Maintenance in the Shoot Apical Meristems and during Axillary Meristem Development. Cytologia 2020, 85, 3–8. [Google Scholar] [CrossRef]
- Coudert, Y.; Périn, C.; Courtois, B.; Khong, N.G.; Gantet, P. Genetic Control of Root Development in Rice, the Model Cereal. Trends Plant Sci. 2010, 15, 219–226. [Google Scholar] [CrossRef]
- Lintilhac, P.M. The Problem of Morphogenesis: Unscripted Biophysical Control Systems in Plants. Protoplasma 2014, 251, 25–36. [Google Scholar] [CrossRef]
- Piekarska-Stachowiak, A.; Szymanowska-Pułka, J.; Potocka, I.; Lipowczan, M. Topological Traits of a Cellular Pattern versus Growth Rate Anisotropy in Radish Roots. Protoplasma 2019, 256, 1037–1049. [Google Scholar] [CrossRef] [PubMed]
- Lipowczan, M.; Borowska-Wykret, D.; Natonik-Bialon, S.; Kwiatkowska, D. Growing Cell Walls Show a Gradient of Elastic Strain across Their Layers. J. Exp. Bot. 2018, 69, 4349–4362. [Google Scholar] [CrossRef]
- Hama, H.; Hioki, H.; Namiki, K.; Hoshida, T.; Kurokawa, H.; Ishidate, F.; Kaneko, T.; Akagi, T.; Saito, T.; Saido, T.; et al. ScaleS: An Optical Clearing Palette for Biological Imaging. Nat. Neurosci. 2015, 18, 1518–1529. [Google Scholar] [CrossRef] [PubMed]
- Susaki, E.A.; Tainaka, K.; Perrin, D.; Kishino, F.; Tawara, T.; Watanabe, T.M.; Yokoyama, C.; Onoe, H.; Eguchi, M.; Yamaguchi, S.; et al. Whole-Brain Imaging with Single-Cell Resolution Using Chemical Cocktails and Computational Analysis. Cell 2014, 157, 726–739. [Google Scholar] [CrossRef] [PubMed]
- Chung, K.; Wallace, J.; Kim, S.-Y.; Kalyanasundaram, S.; Andalman, A.S.; Davidson, T.J.; Mirzabekov, J.J.; Zalocusky, K.A.; Mattis, J.; Denisin, A.K.; et al. Structural and Molecular Interrogation of Intact Biological Systems. Nature 2013, 497, 332–337. [Google Scholar] [CrossRef]
- Kurihara, D.; Mizuta, Y.; Sato, Y.; Higashiyama, T. ClearSee: A Rapid Optical Clearing Reagent for Whole-Plant Fluorescence Imaging. Development 2015, 142, 4168–4179. [Google Scholar] [CrossRef] [PubMed]
- Hasegawa, J.; Sakamoto, Y.; Nakagami, S.; Aida, M.; Sawa, S.; Matsunaga, S. Three-Dimensional Imaging of Plant Organs Using a Simple and Rapid Transparency Technique. Plant Cell Physiol. 2016, 57, 462–472. [Google Scholar] [CrossRef]
- Palmer, W.M.; Martin, A.P.; Flynn, J.R.; Reed, S.L.; White, R.G.; Furbank, R.T.; Grof, C.P.L. PEA-CLARITY: 3D Molecular Imaging of Whole Plant Organs. Sci. Rep. 2015, 5, 13492. [Google Scholar] [CrossRef] [PubMed]
- Imoto, A.; Yamada, M.; Sakamoto, T.; Okuyama, A.; Ishida, T.; Sawa, S.; Aida, M. A ClearSee-Based Clearing Protocol for 3D Visualization of Arabidopsis Thaliana Embryos. Plants 2021, 10, 190. [Google Scholar] [CrossRef]
- Hirai, R.; Higaki, T.; Takenaka, Y.; Sakamoto, Y.; Hasegawa, J.; Matsunaga, S.; Demura, T.; Ohtani, M. The Progression of Xylem Vessel Cell Differentiation Is Dependent on the Activity Level of VND7 in Arabidopsis Thaliana. Plants 2019, 9, 39. [Google Scholar] [CrossRef] [PubMed]
- Kurihara, D.; Mizuta, Y.; Nagahara, S.; Higashiyama, T. ClearSeeAlpha: Advanced Optical Clearing for Whole-Plant Imaging. Plant Cell Physiol. 2021, 62, 1302–1310. [Google Scholar] [CrossRef]
- Xing, Y.; Zhang, Q. Genetic and Molecular Bases of Rice Yield. Annu. Rev. Plant Biol. 2010, 61, 421–442. [Google Scholar] [CrossRef]
- Bailey-Serres, J.; Parker, J.E.; Ainsworth, E.A.; Oldroyd, G.E.D.; Schroeder, J.I. Genetic Strategies for Improving Crop Yields. Nature 2019, 575, 109–118. [Google Scholar] [CrossRef]
- Hori, K.; Shenton, M. Recent Advances in Molecular Research in Rice: Agronomically Important Traits. Int. J. Mol. Sci. 2020, 21, 5945. [Google Scholar] [CrossRef]
- Wang, W.; Mauleon, R.; Hu, Z.; Chebotarov, D.; Tai, S.; Wu, Z.; Li, M.; Zheng, T.; Fuentes, R.R.; Zhang, F.; et al. Genomic Variation in 3010 Diverse Accessions of Asian Cultivated Rice. Nature 2018, 557, 43–49. [Google Scholar] [CrossRef] [PubMed]
- Itoh, J.-I.; Nonomura, K.-I.; Ikeda, K.; Yamaki, S.; Inukai, Y.; Yamagishi, H.; Kitano, H.; Nagato, Y. Rice Plant Development: From Zygote to Spikelet. Plant Cell Physiol. 2005, 46, 23–47. [Google Scholar] [CrossRef]
- Barbier de Reuille, P.; Routier-Kierzkowska, A.-L.; Kierzkowski, D.; Bassel, G.W.; Schüpbach, T.; Tauriello, G.; Bajpai, N.; Strauss, S.; Weber, A.; Kiss, A.; et al. MorphoGraphX: A Platform for Quantifying Morphogenesis in 4D. Elife 2015, 4, 05864. [Google Scholar] [CrossRef] [PubMed]
- Toriba, T.; Suzaki, T.; Yamaguchi, T.; Ohmori, Y.; Tsukaya, H.; Hirano, H.-Y. Distinct Regulation of Adaxial-Abaxial Polarity in Anther Patterning in Rice. Plant Cell 2010, 22, 1452–1462. [Google Scholar] [CrossRef] [PubMed]
- Lucob-Agustin, N.; Kawai, T.; Takahashi-Nosaka, M.; Kano-Nakata, M.; Wainaina, C.M.; Hasegawa, T.; Inari-Ikeda, M.; Sato, M.; Tsuji, H.; Yamauchi, A.; et al. WEG1, Which Encodes a Cell Wall Hydroxyproline-Rich Glycoprotein, Is Essential for Parental Root Elongation Controlling Lateral Root Formation in Rice. Physiol. Plant. 2020, 169, 214–227. [Google Scholar] [CrossRef] [PubMed]
- Ulmasov, T.; Murfett, J.; Hagen, G.; Guilfoyle’, T.J. Aux/lAA Proteins Repress Expression of Reporter Genes Containing Natural and Highly Active Synthetic Auxin Response Elements. Available online: http://www.plantcell.org/content/plantcell/9/11/1963.full.pdf (accessed on 16 April 2021).
- Nakielski, J.; Lipowczan, M. A Method to Determine the Displacement Velocity Field in the Apical Region of the Arabidopsis Root. Planta 2012, 236, 1547–1557. [Google Scholar] [CrossRef] [PubMed][Green Version]
- Bishopp, A.; Help, H.; El-Showk, S.; Weijers, D.; Scheres, B.; Friml, J.; Benková, E.; Mähönen, A.P.; Helariutta, Y. A Mutually Inhibitory Interaction between Auxin and Cytokinin Specifies Vascular Pattern in Roots. Curr. Biol. 2011, 21, 917–926. [Google Scholar] [CrossRef] [PubMed]
- Zürcher, E.; Tavor-Deslex, D.; Lituiev, D.; Enkerli, K.; Tarr, P.T.; Müller, B. A Robust and Sensitive Synthetic Sensor to Monitor the Transcriptional Output of the Cytokinin Signaling Network in Planta. Plant Physiol. 2013, 161, 1066–1075. [Google Scholar] [CrossRef]
- Antoniadi, I.; Plačková, L.; Simonovik, B.; Doležal, K.; Turnbull, C.; Ljung, K.; Novák, O. Cell-Type-Specific Cytokinin Distribution within the Arabidopsis Primary Root Apex. Plant Cell 2015, 27, 1955–1967. [Google Scholar] [CrossRef]
- Sakamoto, Y.; Ishimoto, A.; Sakai, Y.; Sato, M.; Nishihama, R.; Abe, K.; Sano, Y.; Furuichi, T.; Tsuji, H.; Kohchi, T.; et al. Improved clearing method contributes to deep imaging of plant organs. Commun. Biol. 2021, in press. [Google Scholar] [CrossRef]


Publisher’s Note: MDPI stays neutral with regard to jurisdictional claims in published maps and institutional affiliations. |
© 2021 by the authors. Licensee MDPI, Basel, Switzerland. This article is an open access article distributed under the terms and conditions of the Creative Commons Attribution (CC BY) license (https://creativecommons.org/licenses/by/4.0/).
Share and Cite
Sato, M.; Akashi, H.; Sakamoto, Y.; Matsunaga, S.; Tsuji, H. Whole-Tissue Three-Dimensional Imaging of Rice at Single-Cell Resolution. Int. J. Mol. Sci. 2022, 23, 40. https://doi.org/10.3390/ijms23010040
Sato M, Akashi H, Sakamoto Y, Matsunaga S, Tsuji H. Whole-Tissue Three-Dimensional Imaging of Rice at Single-Cell Resolution. International Journal of Molecular Sciences. 2022; 23(1):40. https://doi.org/10.3390/ijms23010040
Chicago/Turabian StyleSato, Moeko, Hiroko Akashi, Yuki Sakamoto, Sachihiro Matsunaga, and Hiroyuki Tsuji. 2022. "Whole-Tissue Three-Dimensional Imaging of Rice at Single-Cell Resolution" International Journal of Molecular Sciences 23, no. 1: 40. https://doi.org/10.3390/ijms23010040
APA StyleSato, M., Akashi, H., Sakamoto, Y., Matsunaga, S., & Tsuji, H. (2022). Whole-Tissue Three-Dimensional Imaging of Rice at Single-Cell Resolution. International Journal of Molecular Sciences, 23(1), 40. https://doi.org/10.3390/ijms23010040