1. Introduction
There are similarities in the mechanisms that control human and cattle reproduction. Therefore, models developed for cattle can provide information about processes taking place in humans [
1,
2]. The preovulatory follicle provides appropriate conditions for oocyte growth and development [
3]. The ovarian follicle includes two main types of cells: granulosa and theca, which are responsible for nurturing the growing oocyte until ovulation. In cattle, the ovulating dominant follicle is recruited from 2 or 3 follicular waves [
4], whereas the rest of the follicles growing in this same cohort undergo atresia [
5,
6,
7]. It was estimated that 95–99% of all ovarian follicles in mammals undergo this process [
8,
9]. Atresia may occur at any time during folliculogenesis, however, the majority of follicles remain atretic throughout the antral stage of follicular development [
6].
The studies concerning mechanisms of programmed cell death underlying atresia documented complex network of factors controlling this process [
9,
10]. However, the majority of investigations refer to apoptosis as the main mechanism regulating atresia. Apoptosis occurs via two main pathways: intrinsic and extrinsic. In the intrinsic pathway, the presence of pro-apoptotic factors or the absence of factors suppressing death, cause the changes in the inner membrane of the mitochondria and release of pro-apoptotic proteins from the intermembrane space into the cytosol [
11]. Activation of these proteins lead to apoptosome formation and caspase (CASP9) activation, which initiates the executive CASP3 [
12,
13]. The extrinsic pathway depends on the transmembrane receptor-mediated interactions, belonging to the tumor necrosis factor (TNF) receptor gene superfamily (TNFRSF) [
14]. The extracellular signals, such as Fas ligand (FasL) or tumor necrosis factor alpha (TNF-
), interact with corresponding death receptors [
13,
15,
16]. In consequence, CASP8 initiates the activation of effector caspase cascade (e.g., CASP3, CASP7), resulting in the DNA fragmentation and apoptosis [
12,
17]. Granulosa cells are suggested as the initiator of follicular atresia, undergoing apoptosis in atretic follicles before the oocyte and theca cells [
18,
19,
20]. However, it was proven that theca cells control granulosa cell apoptosis [
21]. A study of Tajima et al. (2002) showed that paracrine factors produced by theca cells may inhibit apoptosis of granulosa cells [
22].
Apoptosis in follicular atresia is controlled by a network of factors. Ovarian steroids, produced by granulosa and theca cells as a result of action by follicle-stimulating hormone (FSH) and luteinizing hormone (LH), are considered as a basis of this process. However, there are other regulators of follicular apoptosis. Kisspeptin, a stimulator of FSH and LH secretion, decreases viability of granulosa cells and initiates apoptosis in bovine granulosa cells [
23]. Follistatin (FST), a local inhibitor of FSH secretion and insulin-like growth factor (IGF) family members, protects granulosa cells from apoptosis [
24,
25]. Furthermore, members of transforming growth factor beta (TGF-
) and TNF-
families were suggested as engaged in atresia regulation in cattle [
26]. The latest studies show that also microRNA (miRNA) affects follicular atresia [
9,
27].
The latest investigations show necroptosis (in addition to apoptosis) as a mechanism controlling homeostasis in ovarian follicles. Necroptosis is an alternative form of programmed cell death, independent of CASPase [
23]. Necroptosis is activated in response to factors promoting programmed cell death when the activation of caspases is blocked by their inhibitors. After recruitment of receptor interacting protein kinases (RIPKs) by death receptors, RIPK1, RIPK3 and mixed lineage kinase domain-like protein (MLKL) form a death-inducing signaling complex II. Phosphorylation of RIPK1, RIPK3 and MLKL results in cell death [
28,
29]. It is documented that spontaneous necroptosis occurs during luteolysis in primates and domestic animals [
12,
28,
30]. The expression of necrosome components: RIPK1, RIPK3, MLKL and specific necroptosis marker phosphorylated MLKL (pMLKL(S358)), was documented in human and macaque ovarian follicles [
13,
31,
32]. In cultured human granulosa cells, the presence of RIPK1 inhibitor and the MLKL blocker significantly reduced necroptosis [
31]. It was also documented that the presence of the RIPK1 inhibitor resulted in increased diameters of secondary follicles and well-developed granulosa layers [
32].
Although it is well known that apoptosis takes place during folliculogenesis [
10], the role of necroptosis (programmed necrosis) dependent on RIPKs in this process is still open. There are few studies of the death processes in theca cells. Therefore the aim of this study was to investigate the occurrence or absence of necroptosis in the granulosa and theca cells of bovine ovarian follicles. For this purpose: (i) the mRNA expression of
RIPK1 and
RIPK3 of the granulosa and theca cells derived from the healthy and atretic follicles were studied by Real-Time PCR, and (ii) correlation between genes associated with death processes of the follicles at three different stages (newly selected, undergoing differentiation and undergoing luteinisation) was analysed by a systems biology approach.
A Systems Biology approach was taken to identify the differences/similarities between two types of cells (granulosa and theca cells) during two processes: apoptosis and programmed cell death. This motivated the creation of separate networks for granulosa and theca cells at different developmental stages. Cluepedia (an application available in Cytoscape) was used to create dynamic networks. These networks allowed the comparison of interactions between granulosa and theca cells and also permitted mapping of the known interactions (from the String-action database) on the newly created networks. Further, the DyNet Analyzer (another application available in Cytoscape) was used to visualise the similarities/differences between networks.
2. Results
2.1. mRNA Expression of RIPK1 and RIPK3 in Granulosa and Theca Cells Originating from Different Ovarian Follicle Types (Healthy and Atretic)
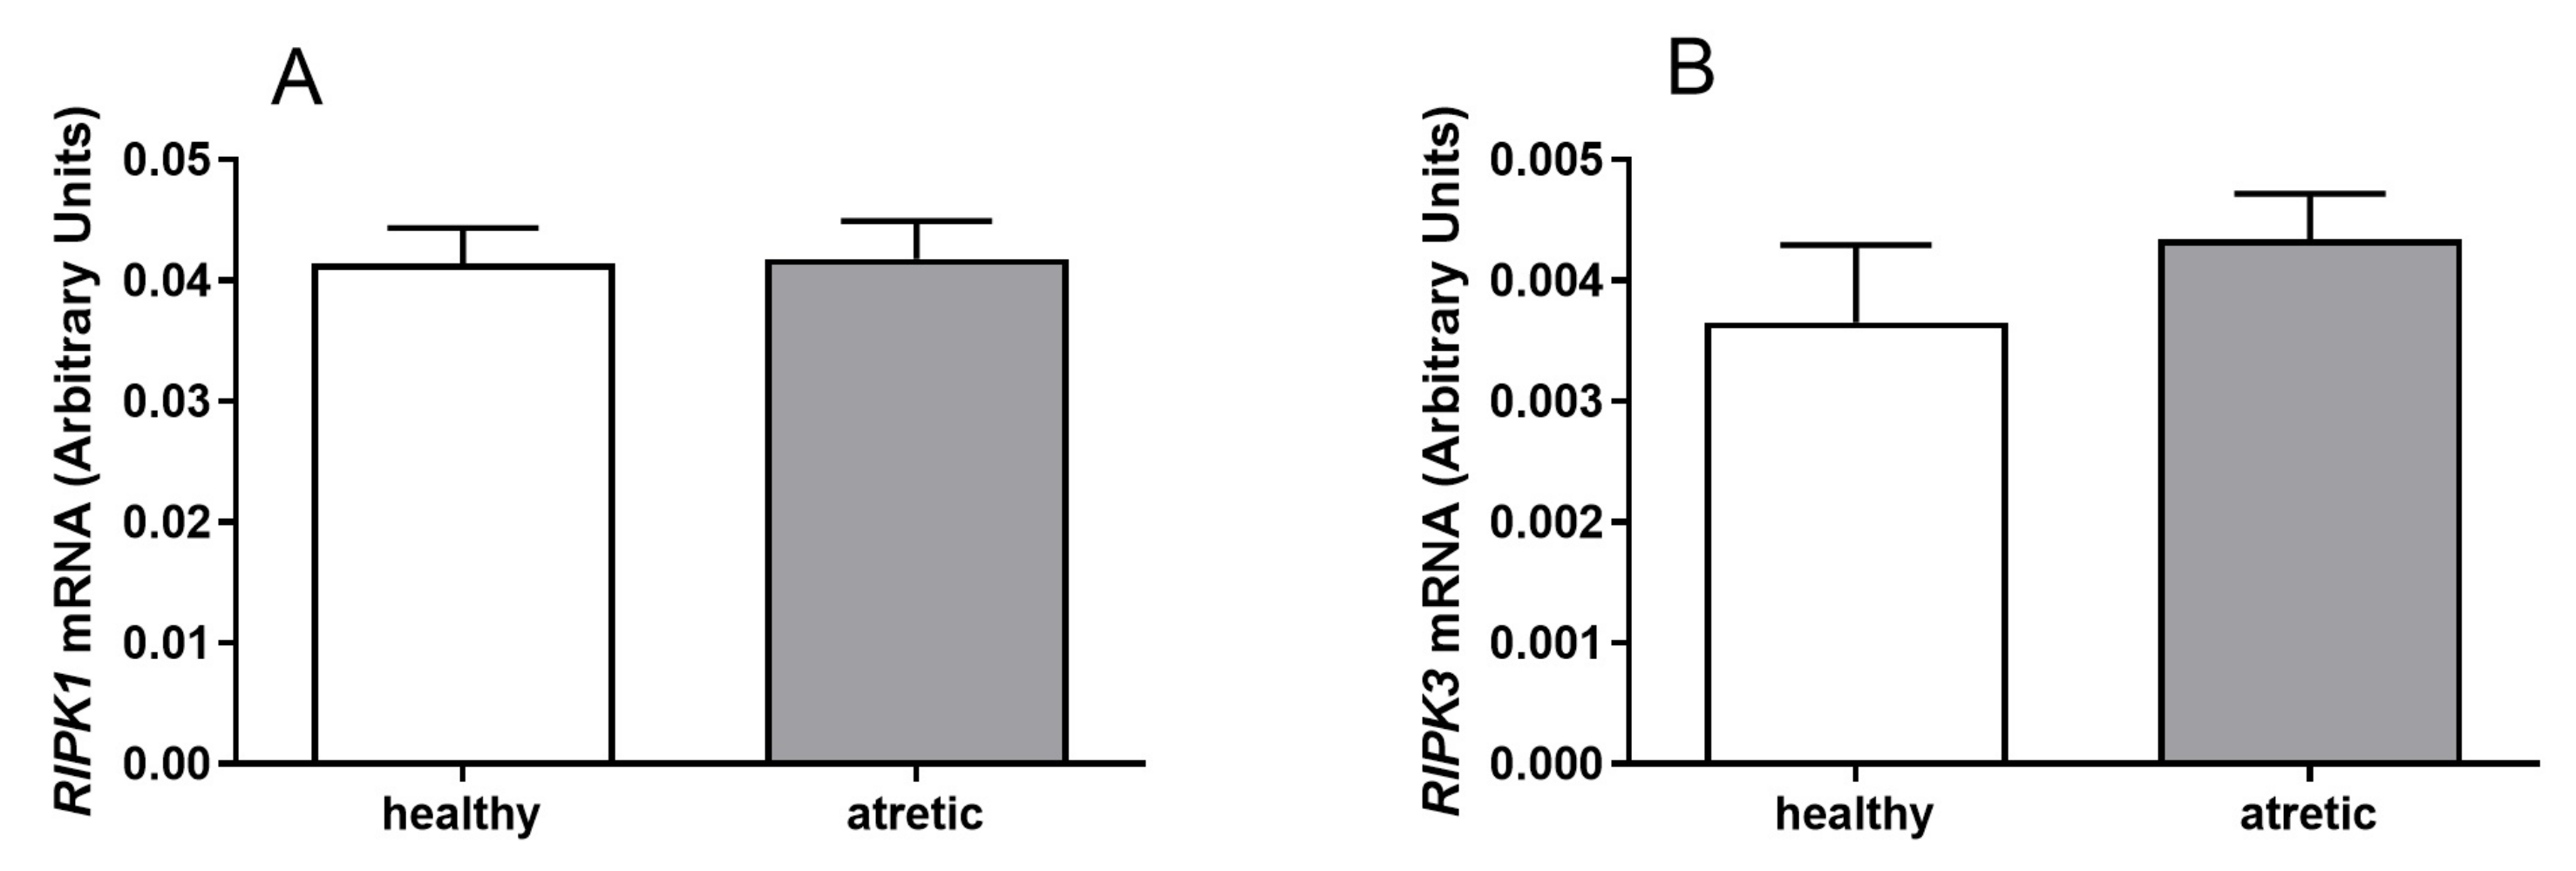
The mRNA expression of
RIPK1 and
RIPK3 was detected in granulosa cells (
Figure 1) and theca cells (
Figure 2) of healthy and atretic bovine ovarian follicles.
Greater mRNA levels of both
RIPK1 (
Figure 1A,
p < 0.05) and
RIPK3 (
Figure 1B,
p < 0.05) were found in the granulosa cells isolated from atretic follicles in comparison to healthy follicles. Similar mRNA levels of
RIPK1 (
Figure 2A,
p > 0.05) and
RIPK3 (
Figure 2B,
p > 0.05) were detected in theca cells isolated from both healthy and atretic follicle types. In summary,
Figure 1 shows higher expression levels of
RIPK1 and
RIPK3 for granulosa cells from atretic follicles than for growing follicles. However,
Figure 2 shows similar expression levels of
RIPK1 and
RIPK3 for theca cells from atretic and growing follicles.
2.2. The Protein-Protein Interaction Network
To study the interactome, the protein–protein interaction (PPI) network, based on the IMEx [
33] curated database was created. Human data and Uniprot identifiers were used since interactions in mammals are conservative and the bovine interactions are scarcely annotated. Note that interactions found using IMEx [
33] did not distinguish between interactions found in a specific tissue. Interactions between proteins allowed for study of the topological characteristics using MCODE (an application available in Cytoscape). This study allowed for the identification of the modules of genes associated with specific functions. The network was further enriched using the ClueGO application [
19] and baseline expression of the chosen genes in the human ovary. The created network was used to study if there is experimental evidence for interactions between the proteins linked to necroptosis, apoptosis and atresia and to check how many of these proteins are expressed in the ovary. The chosen genes found in OMIM (Online Mendelian Inheritance in Man) [
34] were mapped to the UniProtKB identifiers for humans.
The PPI network (protein–protein interaction) was created based on human protein interactions (the gene names and uniprot symbols used are shown in
Appendix A Table A1). Functions played by proteins are closely conserved among species [
16] and interactions recorded in humans are likely to occur similarly in bovines.
Moreover, the basal transcripts in the ovary found in the Gene Expression Atlas were integrated with the list of genes used to build the PPI network. The IMEx [
33] network (only interactions in humans depicted) resulted in a network composed of 75 nodes and 297 edges. The PPI network contained many other proteins, which did not originate from the initial list. Thus, only the genes originating from the list of genes retrieved from OMIM [
34] were selected (a network composed of 75 nodes and 297 edges). Next, a reduced network was created (with 75 nodes and 87 edges). This was done by removing self-interactions and multiple interactions between nodes. Next, nodes which did not interact with any other nodes were removed. This resulted in a network composed of 40 nodes and 87 edges. Finally, the topological characteristics were investigated using MCODE applied to the PPI network. The obtained IMEx [
33] network is shown in
Figure 3.
Figure 3 displays the IMEx Network [
33], where the connections are not tissue specific. However,
Figure 3 also shows the basal expression values of chosen genes in the ovary, mapped to the node size. As shown in
Figure 3,
RIPK1 was expressed while
RIPK3 expression was very low (small node size). Note that
RIPK1 together with
FADD,
TRADD,
CASP8 and
TNFRSF1A are expressed in apoptosis and they all occur in
Figure 3. Thus, apoptosis may take place in the ovary. The complex: MLKL, RIPK3 and RIPK1 is characteristic of necroptosis. The direct connections between RIPK3 and MLKL and between RIPK1 and RIPK3 shown in the graph were derived from the IMEx database in which curated interactions (not tissue specific) are stored. The color of the nodes was mapped to the node degree (number of edges) (here green represents a high degree; yellow represents a medium degree; and red represents a low degree).
Table A2 and
Table A3 in the
Appendix A show genes with the highest degree and betweenness centrality (the number of times a node acts as a bridge along the shortest path between two other nodes).
2.3. Network Clustering: Topological Clusters Using MCODE
The topological clusters found in MCODE identify groups of proteins with a similar function. The MCODE preprocessing combined the haircut option (dropping nodes from a cluster if there is only one connection to it) with default settings in CluePedia [
19]. There were three topological clusters found in the IMEx network [
33].
Cluster 1, containing: TRADD, FADD, CASP8, RIPK1 and TNFRSF1A (5 nodes and 16 edges).
Cluster 2, containing: TP53, BCL2 and BAX (3 nodes and 5 edges).
Cluster 3, containing: ESR1, CCAR1 and ESR2 (3 nodes and 4 edges).
Genes in Cluster 1 are needed for apoptosis. BAX and BCL2 from Cluster 2 determine the cell fate (apoptosis or not).
2.3.1. Enrichment Study
Enrichment analysis identifies the over- and under- represented terms in the population.
The PPI network was enriched in the ClueGO application [
19] using annotations from Reactome Pathways for humans [
35]. The genes’ transcript used to create the network based on Reactome Pathways ontology [
35] is specified in
Table A1 in
Appendix A.
The action relationships (expression, inhibition and activation) between the nodes were determined by CluePedia [
19]. A file representing interactions between nodes was extracted from the STRING database [
36] (on 17 February 2020) available in CluePedia [
19]. Next, to assess functional annotation of the hub genes, ClueGO + CluePedia [
19] were applied and biological pathways of the hubs in
Figure 4 represent one or more functions (for example, the Apoptosis hub represents three functions). The pathways illustrated in
Figure 4 which are associated with apoptosis and programmed cell death are studied in more detail using nested networks and CluePedia networks (see
Section 5). The pathways are connected with the following settings in CluePedia [
19]: assigned kappa score 0.5; corrected
p-value < 0.05; number of genes per term equal to 3; percentage for the queried terms equals to 4; the Bonferroni setting was used with the
p-value correction; and lastly two-sided (enrichment/depletion) tests based on hypergeometric distribution for terms and groups was selected. These settings were used also while retrieving functional annotations for the reduced list of genes. However, in the case of using the reduced list of genes, the Reactome Pathways database [
35] was first used to create the functional terms.
2.3.2. Analysis of GSE34317 Raw Data ( Transformed Data for Granulosa and Theca Cells of Bovine Ovarian Follicles)
To study the death processes in the granulosa cells (GC) and theca cells (TC) of pre-ovulatory ovarian follicles the dataset GSE34317 was used (publicly available in NCBI’s Gene Expression Omnibus (GEO)) [
37]. This is a dataset of gene expressions for 28,054 genes in the GC and TC of bovine dominant follicles at three different developmental stages.
“Principal component analysis (PCA) is a mathematical algorithm that reduces the dimensionality of the data while retaining most of the variation in the data set”. “It accomplishes this reduction by identifying directions, called principal components, along which the variation in the data is maximal. By using a few components, each sample can be represented by relatively few numbers instead of by values for thousands of variables. Samples can then be plotted, making it possible to visually assess similarities and differences between samples and determine whether samples can be grouped” [
38].
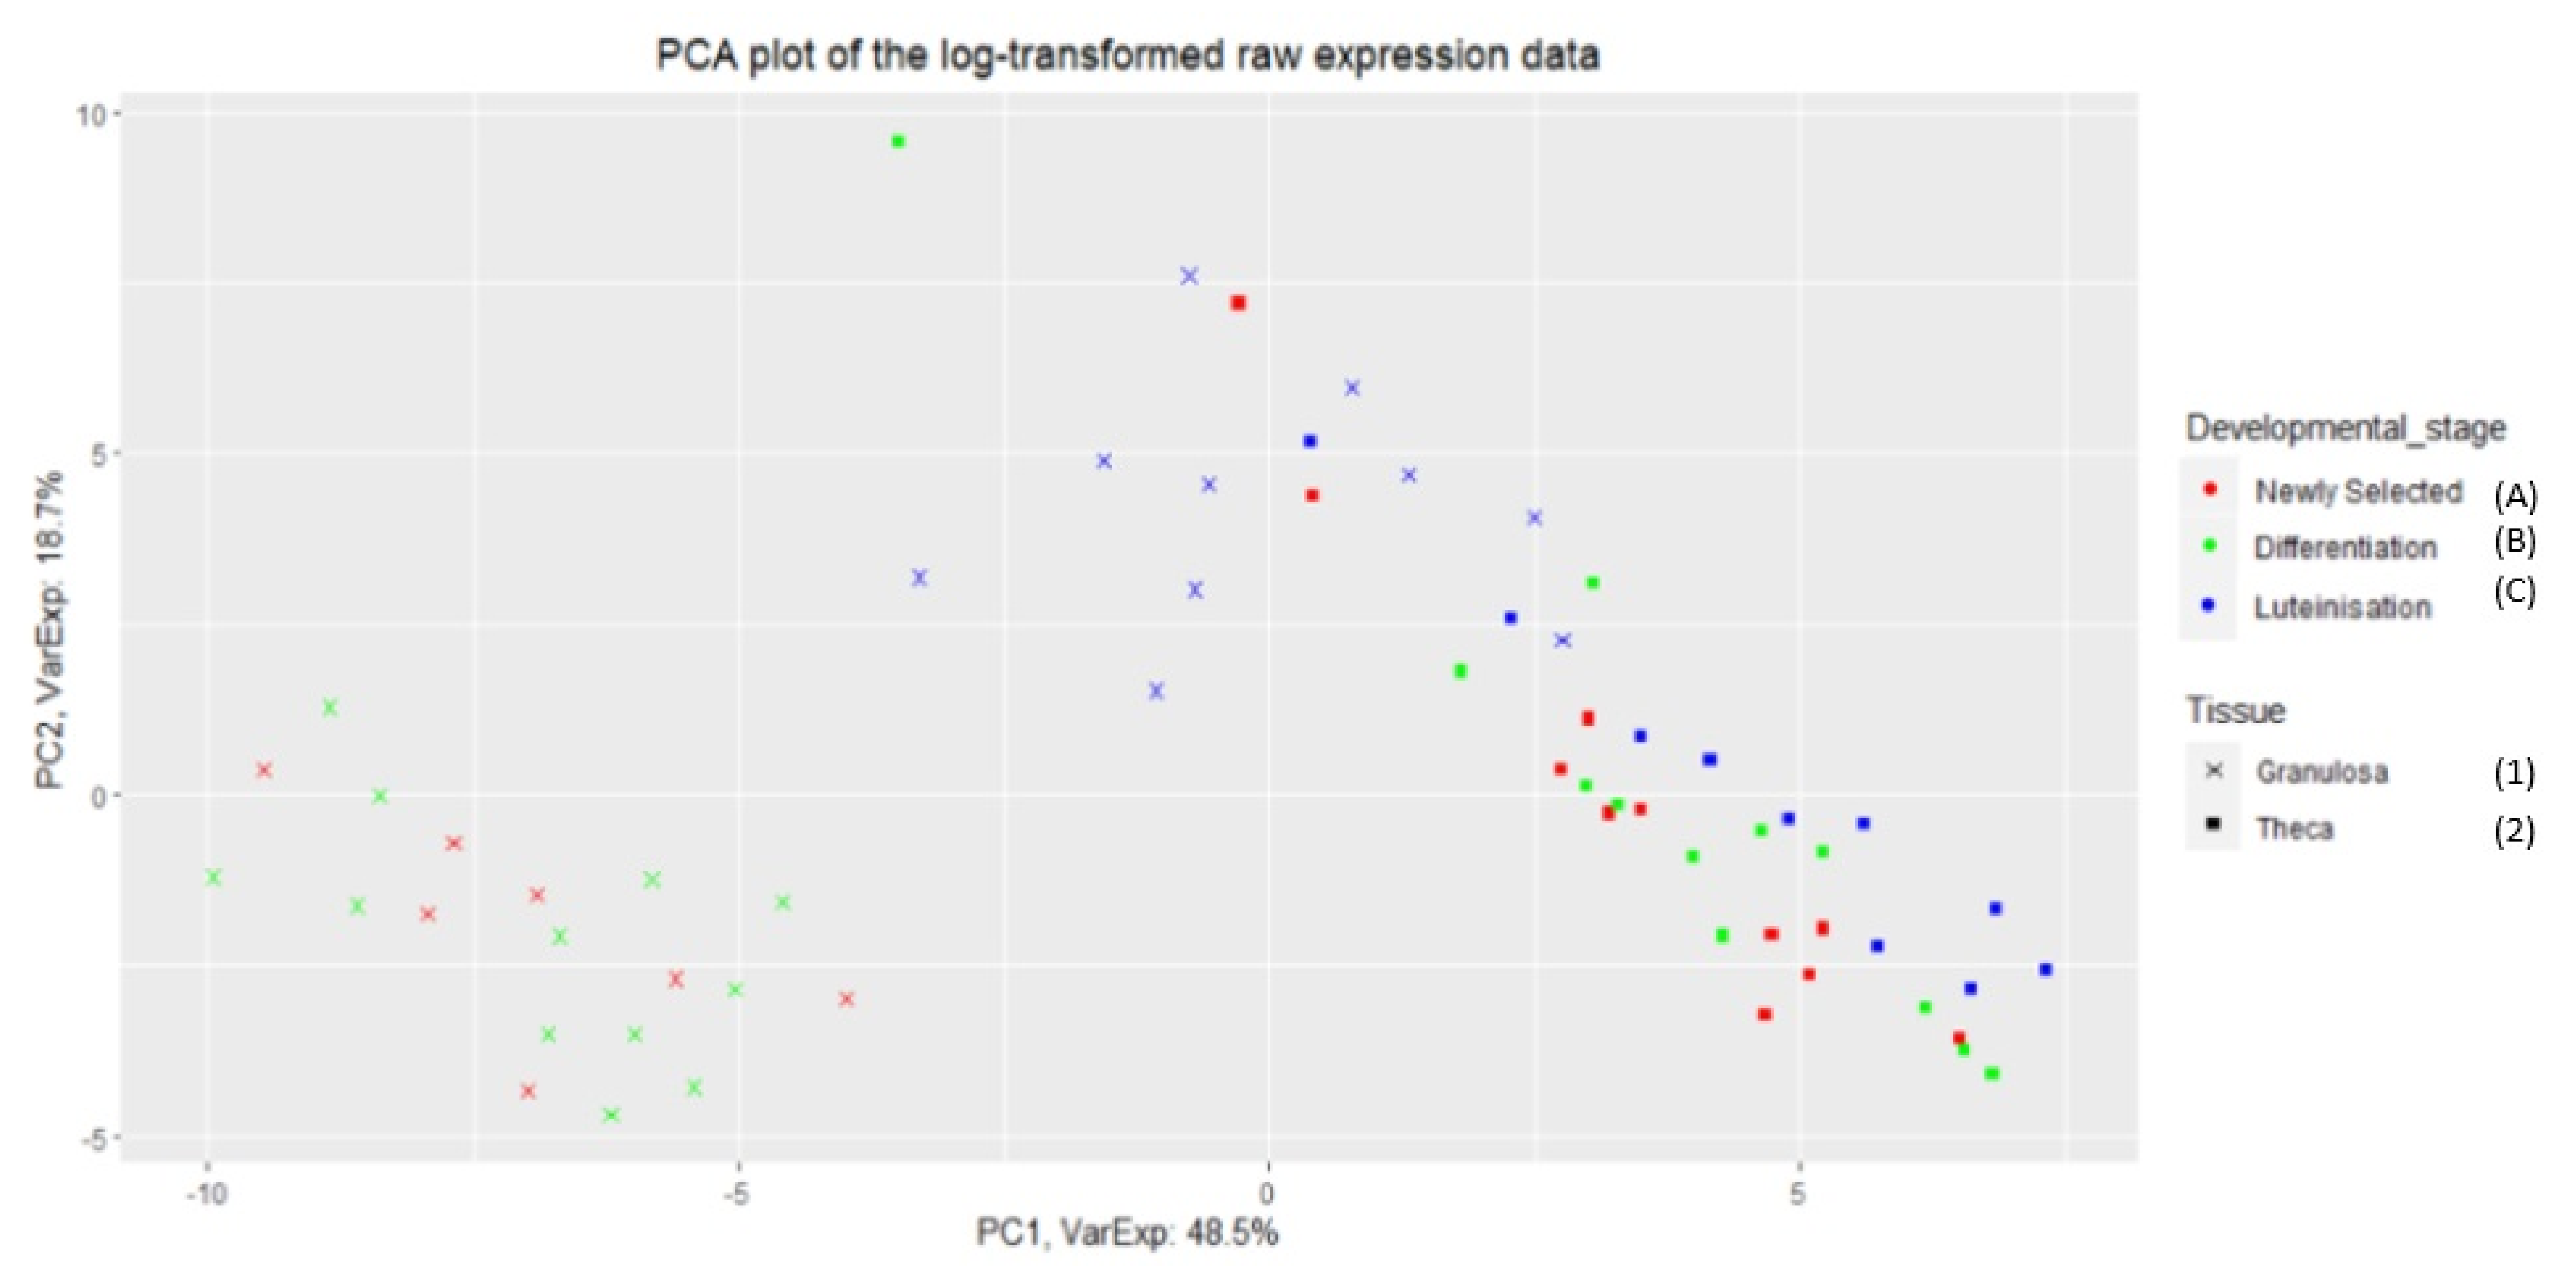
The PCA graph in
Figure A1 shows the separation of data between two types of cells (granulosa and theca) of bovine ovarian follicles. In addition, the gene expressions (from
Table A8 in
Appendix A) of the granulosa cells differed between developmental stages. In contrast, expression of analysed genes was similar in the theca cells from all developmental stages. Moreover, the genes of the granulosa cells from the luteinising (atretic) follicles were more similar to theca than granulosa of healthy follicles (newly selected (A) or differentiating (B) stages).
Next, the down-regulated genes (in
Table A4 in
Appendix A) were identified in R using the DESeq2 package.
Tables (
Table A4 and
Table A5 in
Appendix A) show that the smallest number of differentially expressed genes were in granulosa and theca cells originated from newly selected (A) and differentiating follicles (B). The expression of genes in granulosa cells of luteinising follicles differs from both granulosa and theca cells of newly selected and differentiating follicles. Note that
CYLD,
RIPK1 and
CASP8 differed between group A1 vs. C1, and A1 vs. A2.
CYLD and
RIPK1 differed between B1 vs. C1.
CYLD differed between group A2 vs. C2. Moreover,
TNFRSF1A,
RIPK1 and
TRADD were down-regulated in granulosa compared to theca from newly selected follicles (group A1 vs. A2) and in granulosa from healthy follicles compared to those undergoing luteinisation (group A1 vs. C1 and B1 vs. C1).
RIPK3,
RIPK1 and
CASP8 were down-regulated and
CYLD was up-regulated in granulosa compared to the theca originated from follicles undergoing luteinisation. In theca cells originating from newly selected follicles compared to granulosa cells from follicles undergoing luteinisation (group A2 vs. C1), there was down-regulation of
CYLD and up-regulation of
RIPK3 and
CASP8. In addition,
CASP8 was up-regulated in group A1 vs. C1 and A1 vs. B1. When granulosa and theca were compared from the follicles undergoing luteinisation, down-regulation of
CASP8,
RIPK3 and up-regulation of
CYLD were recorded.
2.4. Nested Networks Describing Apoptosis and Programmed Cell Death
The apoptosis and programmed cell death gene networks shown in
Figure 4 were analysed with nested networks. Nested networks were created and were composed of genes characteristic of either apoptosis or programmed cell death. Nested networks for apoptosis and programmed cell death were created based on the Reactome pathways [
35] (see
Figure 4). The connections between the genes in either apoptosis or programmed cell death were studied using String-action database and CluePedia networks. CluePedia [
19] requires at least three replicates (samples) to conduct correlation analysis and create networks. Since these replicates were not available for theca of differentiating and luteinising follicles, CluePedia networks were created only for granulosa cells (all developmental stages) and theca cells of newly selected follicles. Only genes present in the original list (see
Table A6 in
Appendix A) were kept in the created networks (to improve readability). The activation and inhibition actions were found in “String” networks with String-Actions [
36] (updated 7 September 2020). The action scores were set to 0.7 in CluePedia. In addition, the nested networks for apoptosis and programmed cell death were created and used to analyze experimental expression data from public repositories (GSE34317) using Pearson correlation and MIC (strength) algorithm available in CluePedia [
19]. The Pearson correlation as well as MIC (strength) algorithm were set to 0.7 [
19].
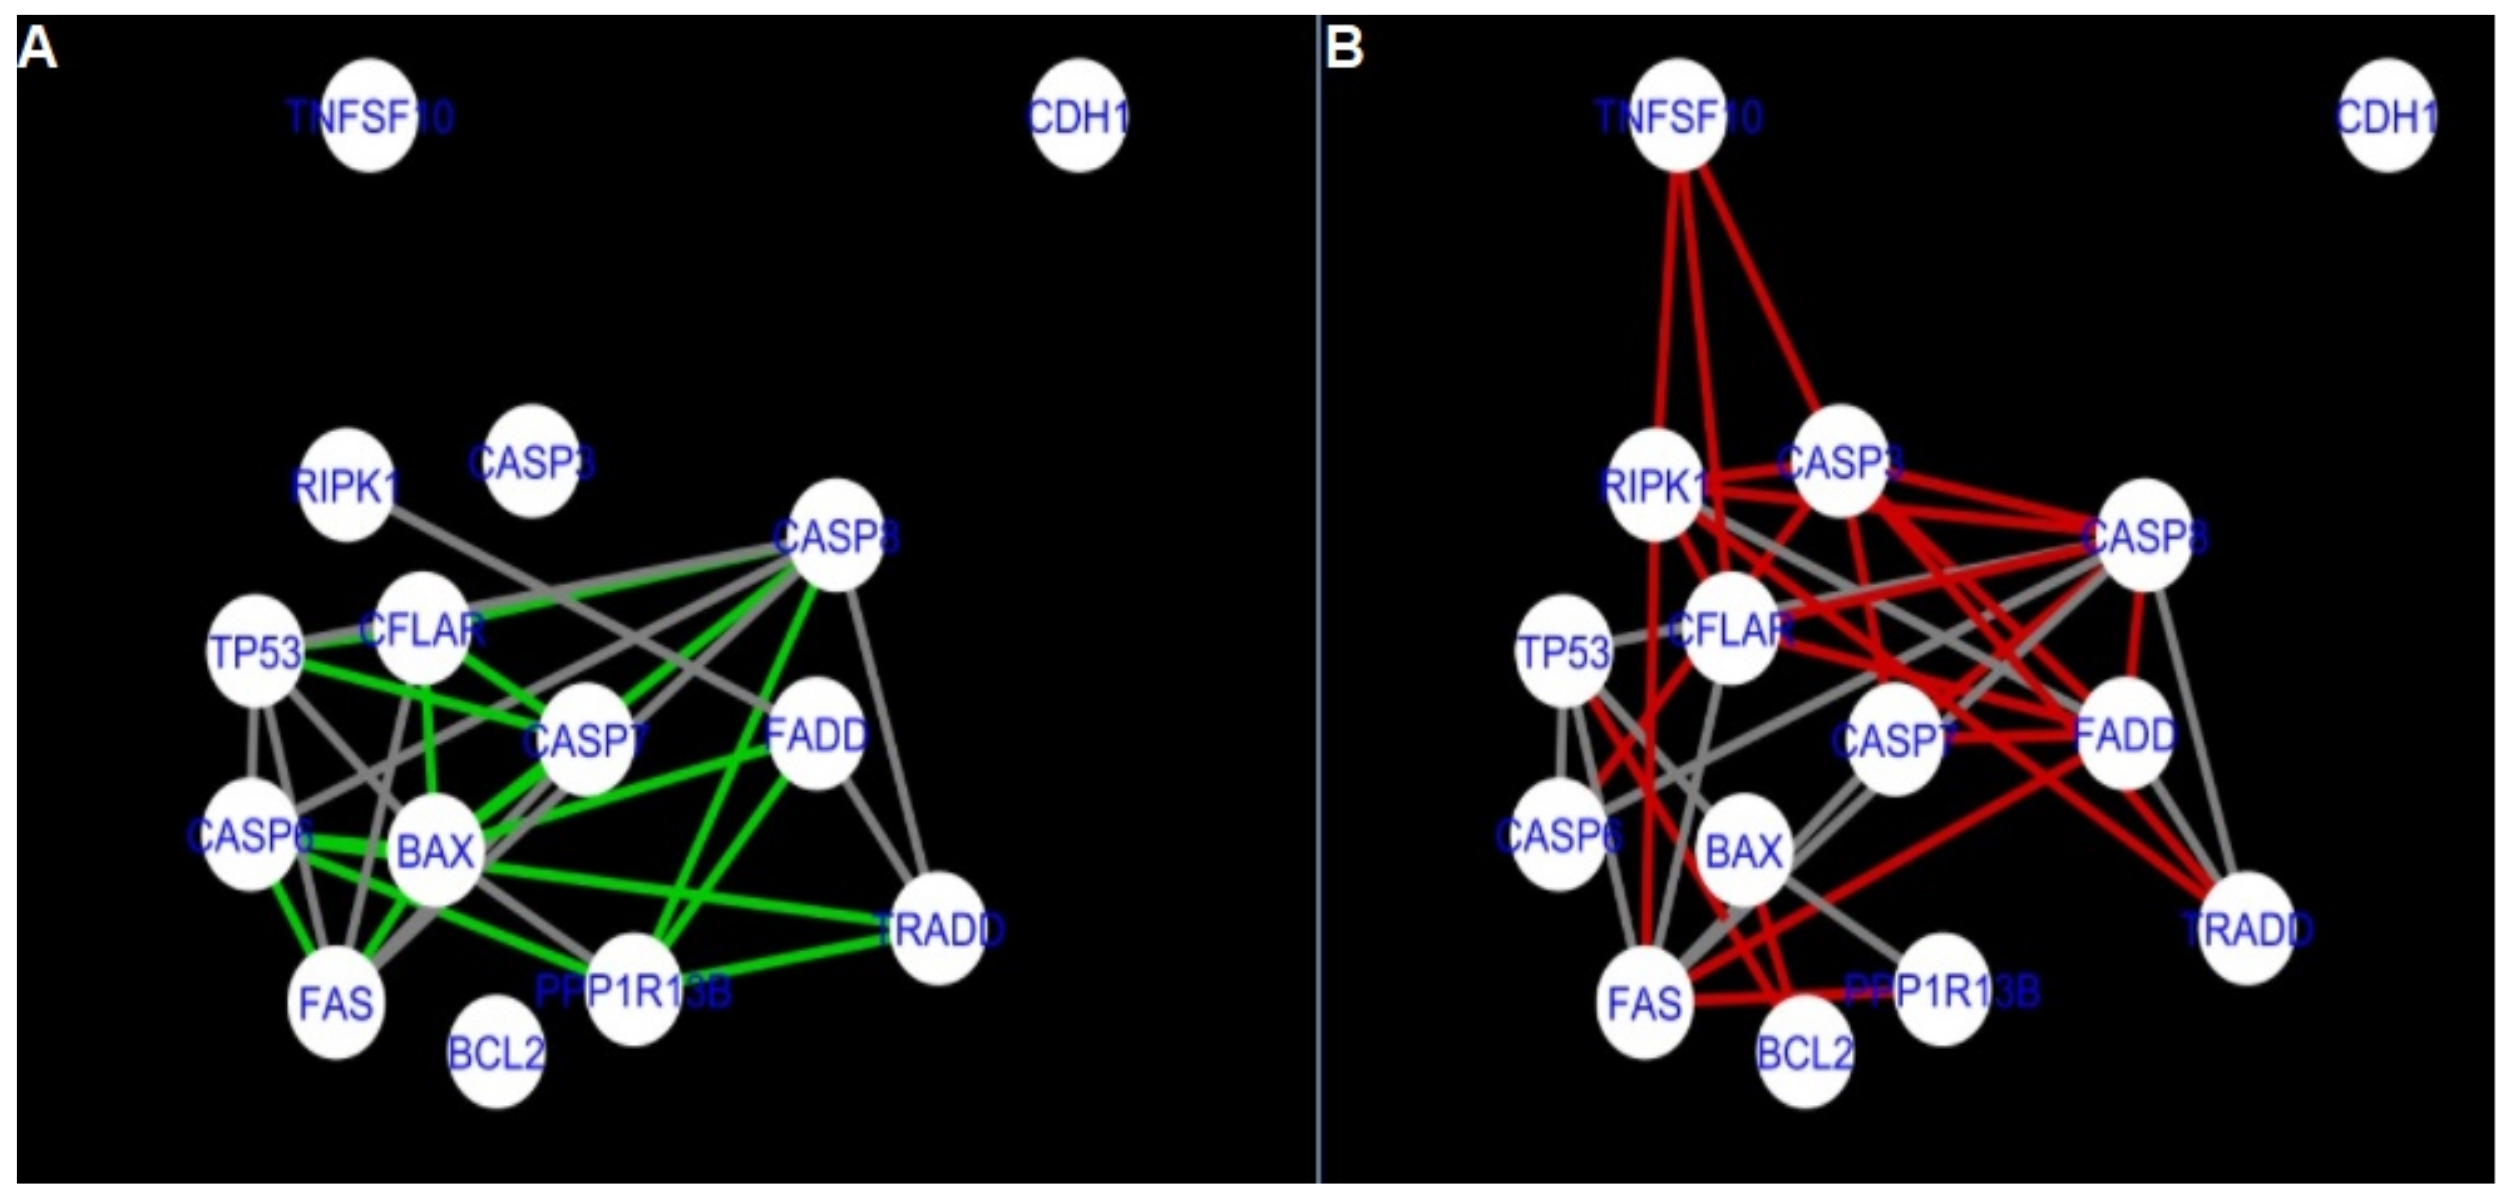
Separate networks were created for programmed cell death and apoptosis for two different types of cells (granulosa and theca). Three networks were created for granulosa cells, for follicles originating from growing, static and atretic follicles (the static follicles are the follicles undergoing differentiation).
The following genes occurred in the apoptosis pathway: BAX, BCL2, CASP3, CASP6, CASP7, CDH1, CFLAR, FADD, FAS, PPP1R13B, RIPK1, TNFSF10, TP53, TRADD. The following genes occurred in the programmed cell death pathway: BAX, BCL2, BIRC3, CASP3, CASP6, CASP7, CASP8, CDH1, CFLAR, FADD, FAS, MLKL, PPP1R13B, RIPK1, RIPK3, TNFSF10, TP53, TRADD.
The DyNet Analyzer application available in Cytoscape allowed the visual comparison between networks with ‘known’ interactions (‘String networks’) and newly created networks in CluePedia (based on the results from the GSE34317 database). Note that data used to create CluePedia networks were rma normalised (and were described in
Section 4.4.2). The DyNet Analyzer highlighted the most ‘rewired’ nodes [
39] in CluePedia networks (more strongly connected to different neighbours in different networks).
Figure 5,
Figure 6,
Figure 7,
Figure 8,
Figure 9,
Figure 10,
Figure 11,
Figure 12 and
Figure 13 refer to the process of apoptosis and
Figure 14,
Figure 15,
Figure 16,
Figure 17,
Figure 18,
Figure 19,
Figure 20 and
Figure 21 to the process of programmed cell death.
Figure 5 and
Figure 14 show differences/similarities between networks created for different cells at different developmental stages and the networks created based on the known interactions (using String-action), respectively, for apoptosis and programmed cell death. In addition, a reference network containing the union of all network states was generated.
Firstly, the nested networks of apoptosis created for the tested groups were compared to the nested network of apoptosis, in which connections were created based on the String-action database. Recall that the interactions stored in the String-database are derived from many different human tissues. Thus, it is expected that the interactions will differ to some extent from networks created for granulosa and theca cells originating from bovine ovarian follicles.
Next, the networks for groups A1, B1, C1 and A2 were compared to each other. A similar process was repeated for the nested networks of programmed cell death. In each case, edges in one network were coloured red, while edges in the other network were coloured green. Edges present in both networks were coloured grey.
Figure 5 shows created networks of apoptosis for granulosa cells originating from all developmental stages of follicles, from theca cells of newly selected follicles, the network created based on the String-action interactions, and also the DyNet Central Reference Network built based on all of them.
Figure 14 shows the created networks of programmed cell death for granulosa cells originating from all developmental stages of follicles, for theca cells of newly selected follicles, the network created based on the String-action interactions and also the DyNet Central Reference Network built based on all of them.
The comparison of the networks shows that the most similar were nested networks of apoptosis as well as programmed cell death created for granulosa cells of luteinising follicles (C1) and theca cells of newly selected follicles (A2).
In the two groups (C1 and A2) direct connections between
RIPK1,
RIPK3 and
MLKL were visualised in the networks of programmed cell death (
Figure 21). In the created networks the lack of direct connection between
BAX and
BCL2 in granulosa cells of newly selected follicles as well as follicles undergoing differentiation was also depicted.
The list of genes used to create the CluePedia networks for respective groups is shown in
Table A6 in
Appendix A. There was missing expression data for
MLKL in the granulosa cells (in group A1 and B1 there was only one
MLKL reading available). There was also missing data for
STK17A in group B1 and A1; and for
NAIP in group A1.
3. Discussion
The literature describes the use of animal models to study the reproductive processes occurring in humans [
1,
2]. In the presented work, we used databases on both cows and humans to expand our understanding of death processes. It should be noted that the results and conclusions expressed for dominant follicles undergoing luteinization are extrapolations from human databases. The results of this paper provide new information on the mechanisms involved in the death processes of ovarian follicles in cattle, a species that can serve as a model for studying reproductive processes in other animal species, including humans. Recently, Sinderewicz et al. [
40] described apoptosis of bovine granulosa cells. However, our study completes the knowledge of the death process in bovine ovarian follicles, demonstrating that bovine granulosa and theca cells are eliminated not only by apoptosis but also by programmed necrosis (RIPK-dependent necroptosis). In our study, the mRNA expression of the main factors related to necroptosis in bovine granulosa and theca cells isolated from both healthy and atretic follicle were detected:
RIPK1 and
RIPK3. Moreover, based on the systems biology approach, the death processes in the granulosa and theca cells of the dominant follicles were investigated. The nested networks technique was used based on MIC (strength) and Pearson correlation set to r = 0.7 in CluePedia. The nested networks were created for two terms: for programmed cell death and for apoptosis. CluePedia [
19] requires at least three replicates (samples) to conduct correlation analysis and create networks. Since these replicates were not available for theca of differentiating and luteinising follicles, CluePedia networks were created only for granulosa cells (at all developmental stages) and theca cells of newly selected follicles.
Studies have shown that the apoptotic process occurs in the early- and middle-stage bovine corpus luteum (CL) [
41] and in bovine granulosa cells [
40]. Sinderewicz et al. [
40] demonstrated an increase in factors involved in cell apoptosis, e.g., CASP8 of the atretic follicles compared to the healthy follicles. Moreover, our study of DEG based on the GSE34317 experimental data confirm that there is an increase in
CASP8 in granulosa cells from luteinizing follicles and in theca cells from newly selected follicles. It is well known that an activated CASP8 is required for cleaving the CASP3 promotor of the apoptotic pathway [
42]. In our study,
CASP3 was upregulated in group A1 vs. group A2 and in group A1 vs. group C1 (GSE34317 data). However, the interaction between CASP3 and CASP8 was missing in the apoptosis network in the granulosa cells undergoing differentiation. We described that in group B1, the FADD was needed for formation of the RIPK1, TRADD and CASP8 complex (thanks to the direct connection between FADD and RIPK1; between FADD and TRADD; and between TRADD and CASP8). No direct link was found between RIPK1 and TRADD in the granulosa cells of luteinising follicles, indicating that death processes are more complex in follicles undergoing luteinisation. It is important to know that RIPK1 combines with FADD, TRADD, RIPK3 and CASP8 to form complex II [
43]. Active CASP8 promotes the exogenous apoptosis pathway by inactivating RIPK1 and RIPK3 [
44]. The above interactions were found in our experimental data (GSE34317) based on gene expression and correlation networks.
RIPK1,
CASP8 and
TRADD were downregulated in group B1 vs. C1; A1 vs. C1; and A1 vs. A2. In contrast
RIPK1,
CASP8 and
TRADD were upregulated in group A2 vs. C1. Interactions between
RIPK1 and
CASP8;
CASP8 and
TRADD; and
TRADD and
RIPK1 were found in the nested networks of apoptosis created for group A1. However, in granulosa cells undergoing differentiation, the complex consisting of
RIPK1,
CASP8,
TRADD and
FADD was found in the nested network of Apoptosis. Note that in group B1 and group C1, no direct interaction between
RIPK1 and
TRADD was found. Thus, in the nested network for apoptosis, a connection between
RIPK1,
TRADD,
FADD and
CASP8 was found in the granulosa cells at all three developmental states and in the theca cells of newly selected follicles. These four genes are characteristic of apoptosis ongoing in the CL and indicate that apoptosis also takes place in the bovine granulosa cells (at all developmental stages) and theca cells originating from newly selected follicles. Thus, our results clearly describe that apoptosis takes place in granulosa and theca cells.
Recently, necroptosis was found in human granulosa cells [
45] and played an important role in the death of bovine CL [
28]. Zhang et al. [
46] found that during embryonic development RIPK1 can mediate apoptosis as well as necroptosis. Moreover, for successful embryogenesis FADD is needed (FADD suppresses RIPK1 and RIPK3 dependent necroptosis) [
46]. The differences in the expression of
RIPK1 and
RIPK3 between granulosa and theca of newly selected follicles may be due to the role of theca cells in suppressing apoptosis of the granulosa cells [
22]. In our results a difference was recorded in the mRNA expression of
RIPK1 and
RIPK3 between granulosa cells originated from the healthy and atretic follicles. Moreover, nested networks created for programmed cell death show a direct interaction between RIPK1 and RIPK3 in granulosa cells originated from bovine follicles of all developmental stages. Both RIPK1 and RIPK3 are needed for apoptosis, however low levels of RIPK1 and high levels of RIPK3 induce necroptosis [
47]. In the study of Walsh et al. [
48] (GSE34317), data they have recorded upregulation of
RIPK3 in group A2 vs. group C1.
RIPK3 has an anti-viral effect promoting cytokine gene expression [
49]. For instance, this occurs in the case of vaccinia virus infection during which RIPK3 dependent necroptosis mobilises immune cells against the virus [
50]. Jonczyk et al. [
29] confirmed that not only RIPKs, but also CYLD and MLKL are involved in the necroptotic pathway during prostaglandin F2
-induced CL regression. During necroptosis, CYLD causes deubiquitination of RIPKs because of recruitment of RIPKs by death receptors [
50]. In our study,
CYLD was downregulated in theca and granulosa cells from newly selected follicles compared to the theca and granulosa originating from luteinising follicles.
CYLD was upregulated in granulosa compared to theca cells of luteinising follicles (C1 vs. C2 and A1 vs. A2). In these two groups (C1 and C2) there was also a recorded difference in expression of
RIPK3 and
CASP8 (which were downregulated in group C1 vs. C2). Thus, the above results show that the necroptosis process takes place in both the granulosa and theca cells of the dominant follicle undergoing luteinisation. The phosphorylation of RIPK3 is crucial for the recruitment of MLKL [
13,
51] and is characteristic of necroptosis. In our study, the complex:
RIPK1,
RIPK3 and
MLKL was found in the nested network of programmed cell death for granulosa cells originating from follicles undergoing luteinisation (C1), and theca cells of newly selected follicles (A2). The similarity between expression of genes involved in death processes in granulosa cells of the luteinizing follicles and theca cells at all three developmental stages are also visualised on the PCA graph (see
Figure A1). In the nested network a direct connection between
RIPK3 and
MLKL was found in the theca cells originated from newly selected bovine follicles, and in granulosa cells of follicles undergoing luteinisation. The DEG results confirm
MLKL and
RIPK3 up-regulation in the theca of newly selected follicles compared to the theca from the follicles undergoing differentiation (based on the experimental data taken from the GEO database (as shown in
Table A5 in
Appendix A)). In contrast, in theca cells undergoing differentiation MLKL was downregulated compared to theca from luteinising follicles. Note that the experimental study did not show a difference between the expression of
RIPK1 and
RIPK3 in the theca cells originated from the healthy and atretic follicles. This difference was also not recorded in theca cells from newly selected and luteinising follicles.
There are studies confirming occurrence of both apoptosis as well as necroptosis in the granulosa cells [
40,
45]. To our knowledge, this paper demonstrates the occurrence of necroptosis in the bovine theca cells for the first time. This information might be used to implement necroptosis inhibitors allowing for manipulation of the death processes, this can have practical applications in reproduction programs. Necroptosis is associated with inflammatory diseases [
52]. TNF
-induced necroptosis promotes the expression of proinflammatory cytokines [
53]. Hou et al. [
52] show that PK68 can be used for targeting RIPK1, acting as a RIPK1 inhibitor. Furthermore, research by Zhu et al. [
53] found that induction of cytokine by necroptosis can be inhibited by targeting RIPK1 (using Nec-1s); RIPK3 (using GSK872) and inhibiting MLKL oligomerization using necrosulfonamide. In contrast, necroptosis can be promoted by TAM (Tyro3, Axl, and Mer) family of tyrosine kinases receptor, pharmacological or genetic targeting which results in inhibition of necroptotic death [
49]. Necroptosis can be blocked by necrostatin-1 (Nec-1) or derivatives, and the MLKL inhibitor necrosulfonamide (NSA) [
31]. Thus, pharmacological agents can be used to prolong the availability of the follicle pool during ageing (and in humans can possibly delay the menopause) [
31]. This showed that ovarian function and fertility of primates can be improved by pharmacological intervention targeting specific death processes [
31]. This is one of the reasons why identification of the mechanisms of cell death processes is important.
4. Materials and Methods
4.1. Experimental Methods
Ovaries, from dairy cows, irrespective of the stage of the estrous cycle, were collected at the slaughterhouse and transported to the laboratory in sterile Phosphate Buffered Saline within 30 min (PBS buffer (137 mM NaCl, 2.7 mM KCl, 10 mM Na2KPO4, 1.8 mM KH2PO4, pH = 7.4), completed with 0.5% gentamycin (Sigma-Aldrich, Steinheim, Germany; #G-1397)). Materials were collected throughout the whole year.
The follicular fluid (FF) was aspirated from antral ovarian follicles (diameter < 5 mm) by syringe. Then the antral cavity of each follicle was rinsed frequently with cold PBS to collect the granulosa cells. Granulosa cells were separated from the FF by centrifugation at 1200× g for 4 min. The theca layer was removed from the inner part of the follicles with forceps and washed in PBS by passing repeatedly through a 1 mL syringe. Theca and granulosa cells obtained from single follicles were collected and stored at −80 C until the RNA extraction process. The supernatant of FF was collected and kept frozen at −20 C until the concentrations of E2 and P4 were measured by the RIA method (using the DIAsource E2–RIA–CT Kit, KIP0629, DIAsource ImmunoAssays SA, Louvain-la-Neuve, Belgium and the DIAsource PROG–RIA–CT Kit, KIP1458, Diasource, ImmunoAssays SA, Louvain-la-Neuve, Belgium).
Granulosa cells and theca layer were divided into two categories: healthy (E2:P4 ratios > 1) and atretic (E2:P4 ratios < 0.01) based on the intrafollicular E2:P4 ratios and used for RIPK1 and RIPK3 mRNA expression examination.
4.2. Total RNA Extraction, Reverse Transcription (RT) and Real-Time PCR
The samples were homogenized and processed for RNA isolation according to manufacturer’s instructions (#031-100, Total RNA Mini Isolation Kit, AA Biotechnology, Poland). Samples were stored at −80 C until RT. Before use, RNA content and purity were evaluated by spectrophotometric measurement (NanoDrop 1000 ; Thermo Scientific, Wilmington, DE, USA). RT was performed using oligo (dT) 12–18 primers (#18418-012) by Maxima First Strand cDNA Synthesis Kit (#K1642, Fermentas, Thermo Fisher Scientific, Wilmington, DE, USA) in a total volume of 20 L.
The expression of mRNA for
RIPK1 and
RIPK3 was measured by Real-time PCR. Real-time PCR was performed with an ABI Prism 7900 (Applied Biosystems, Life Technologies, Foster City, CA, USA) sequence detection system using Maxima
® SYBR Green/ROX qPCR Master Mix (# K0222, Fermentas, Thermo Scientific, Wilmington, DE, USA). The PCR reactions were performed in 384-well plates. The results of mRNA transcription were normalized to the glyceraldehyde-3-phosphate dehydrogenase (
GAPDH, an internal control) mRNA level and were expressed as arbitrary units. The primers were designed using an online software package (
http://frodo.wi.mit.edu/primer3/input.htm (accessed on 15 March 2018)). The primer sequences and the sizes of the amplified fragments of the transcripts are shown in
Table A7 in
Appendix A. For the relative quantification of mRNA levels, Miner software was used (
http://www.miner.ewindup.info (accessed on 30 August 2018).
4.3. Estradiol and Progesterone Assays
Estradiol and P4 were measured by the radioimmunoassay method (DIAsource E2–RIA–CT Kit, KIP0629, DIAsource, ImmunoAssays SA, Louvain-la-Neuve,Belgium; PROG–RIA–CT Kit, KIP1458, Diasource, ImmunoAssays SA, Louvain-la-Neuve,Belgium) according to the manufacturer’s instructions.
4.4. Data Analysis and Statistics
4.4.1. RT-PCR Data Analysis
The mRNA expression of
RIPK1 and
RIPK3 was measured for granulosa and theca cells of bovine follicles. Statistical analyses were performed using GraphPad PRISM v.6.0 software (GraphPad Software, San Diego, CA, USA). All experimental data are shown as the mean ± SEM, and differences were considered to be statistically different at the 95% confidence level (
p < 0.05). Analyses were done using one-way ANOVA followed by Kruskal–Wallis’ multiple comparison test (
Figure 1 and
Figure 2).
4.4.2. Systems Biology Methods
To study the death processes in the granulosa cells (GC) and theca cells (TC) of pre-ovulatory ovarian follicles the dataset GSE34317 was used (publicly available in NCBI’s Gene Expression Omnibus (GEO)) [
37]. This is a dataset of gene expressions for 28,054 genes in the GC and TC of bovine dominant follicles at three different developmental stages. The chosen genes characterised as important for necrosis, apoptosis and atresia processes were identified using an online catalog of human genes and genetic disorders (OMIM) [
34]. Next, the chosen genes were selected from the GSE34317, followed by rma normalisation. Due to the lack of the annotation file, rma normalisation was performed in three steps: background correction using rma.background.correction function in R; followed by quantile normalisation using normalize.quantiles function in R; and logarithmic transformation using convert_log2 function in R [
54]. These functions are available in R packages preprocessCore and proteoMM. Due to the limited number of samples for which rma normalisation was successful, the resulting dataset contained the following smaller sample: GSE847251 (GCA), GSE847254 (GCA), GSE847256 (GHA), GSE847263 (GCB), GSE847264 (GCB), GSE847265 (GCB), GSE847266 (GCB), GSE847267 (GCB), GSE847279 (GHC), GSE847280 (GHC), GSE847282 (GHC), GSE847284 (TCA), GSE847286 (TCA), GSE847290 (THA). For instance, GSE847251 (GCA) means Granulosa Cow Group A (newly selected), sample identifier GSE847251; and THB stands for Theca Heifer Group B. Samples contained expression data recorded in either cows or heifers in granulosa and theca cells originated from one of the 3 developmental stages of follicles:
A (newly selected), B (undergoing differentiation) or C (undergoing luteinisation).
The data were divided into 6 groups (3 for granulosa and 3 for theca). The method in which samples were assigned to the specific groups is shown in
Table 1.
transformed raw data was used for Principal Component Analysis (PCA) and for analysing up- and down- regulated genes. PCA reduces the dimensionality of the dataset allowing for visualising similarities/dissimilarities of data using principal components of maximal variation [
38].
In addition, the list of genes used for differentially expressed gene (DEG) analysis and PCA were limited (compared to the list of genes retrieved from OMIM and used for creation of an IMEx network) due to zero values for expression of some genes recorded in the dataset. These genes were removed from the analysis, except results for
RIPK3. Zero values for
RIPK3 were recorded in 3 samples: GSE847252, GSE84725253 and GSE847255. In order to avoid an elimination of the results for
RIPK3, the samples with no recorded expression for
RIPK3 were removed. The final gene transcripts in the dataset are shown in
Table A8 in
Appendix A.


 ,
, 


