Article

A Gadolinium(III) Complex Based on the Thymine Nucleobase with Properties Suitable for Magnetic Resonance Imaging

by
Marta Orts-Arroyo
1,
Amadeo Ten-Esteve
2,
Sonia Ginés-Cárdenas
2,
Isabel Castro
1,
Luis Martí-Bonmatí
2,* and
José Martínez-Lillo
1,*
1
Instituto de Ciencia Molecular (ICMol), Universitat de València, c/Catedrático José Beltrán 2, Paterna, 46980 Valencia, Spain
2
Radiology Department and Biomedical Imaging Research Group (GIBI230), La Fe University and Polytechnic Hospital and La Fe Health Research Institute, 46026 Valencia, Spain
*
Authors to whom correspondence should be addressed.
Int. J. Mol. Sci. 2021, 22(9), 4586; https://doi.org/10.3390/ijms22094586
Submission received: 25 March 2021 / Revised: 19 April 2021 / Accepted: 23 April 2021 / Published: 27 April 2021
(This article belongs to the Special Issue Metal Complexes in Diagnosis and Therapy)

Abstract

:
The paramagnetic gadolinium(III) ion is used as contrast agent in magnetic resonance (MR) imaging to improve the lesion detection and characterization. It generates a signal by changing the relaxivity of protons from associated water molecules and creates a clearer physical distinction between the molecule and the surrounding tissues. New gadolinium-based contrast agents displaying larger relaxivity values and specifically targeted might provide higher resolution and better functional images. We have synthesized the gadolinium(III) complex of formula [Gd(thy)2(H2O)6](ClO4)3·2H2O (1) [thy = 5-methyl-1H-pyrimidine-2,4-dione or thymine], which is the first reported compound based on gadolinium and thymine nucleobase. 1 has been characterized through UV-vis, IR, SEM-EDAX, and single-crystal X-ray diffraction techniques, and its magnetic and relaxometric properties have been investigated by means of SQUID magnetometer and MR imaging phantom studies, respectively. On the basis of its high relaxivity values, this gadolinium(III) complex can be considered a suitable candidate for contrast-enhanced magnetic resonance imaging.

Graphical Abstract

1. Introduction

Thymine is one of the four natural nitrogen bases that are precursors and part of the structure of the deoxyribonucleic acid (DNA) macromolecule [1,2]. This pyrimidine base has been widely studied, in part because of the common mutations of DNA caused when adjacent thymines are irradiated by UV light and are dimerized, generating the well-known thymine dimers [2,3]. Furthermore, considerable effort has also been devoted to the rational design of drugs that might selectively inhibit thymine biosynthesis, thereby blocking DNA replication, especially in rapidly dividing malignant cells [2].
In comparison with other natural nucleobases, the coordination chemistry of thymine-based metal complexes has been much less investigated. Most of the thymine-containing complexes have been prepared with the nucleobase in the form of thyminate anion, that is, releasing one or two protons of its N-H groups, whereas the reported examples obtained with the thymine molecule acting through its carbonyl groups as a neutral ligand toward the metal are much scarcer [4,5,6,7]. In that respect, theoretical studies have been performed on metal clusters to investigate the preferential binding sites of the thymine molecule [8].
There exist some published thymine-based complexes that exhibit singular properties, as, for instance, the RuII-thymine complex [Ru(PPh3)2(thy)(bpy)]PF6 [where PPh3 = triphenylphosphine and bpy = 2,2′-bipyridine], which is a potent cytotoxic agent with the ability to bind to DNA, inducing apoptotic cell death in human colon carcinoma [6,7]. Thymine has also shown to be a highly specific ligand toward HgII metal ion [9,10]. The discovery of the linear thymine-HgII-thymine structure, which affords a high stabilization of thymine-thymine pairs in DNA, has led to the designing and development of recent thymine-based sensors [11,12,13].
Regarding lanthanide complexes, only two structures based on thyminate anion have been published so far, namely, the heteropolynuclear complexes of general formula [{Cp*RhIII(µ-thym)}4{LnIII(NO3)2}]+, where Ln = DyIII and ErIII, which form cationic metallacalix[4]arene-type systems [14]. Hence, no crystal structure of gadolinium complex based on thymine has been reported up to date.
As a continuation of our interest in investigating biomolecule-based complexes [15,16,17,18,19,20], herein we report the synthesis and characterization of a new gadolinium(III) complex of formula [Gd(thy)2(H2O)6](ClO4)3·2H2O (1) [thy = thymine], which exhibits a linearly disposed thymine-GdIII-thymine structure (Figure 1 and Figure S1). 1 displays the first reported crystal structure based on gadolinium and thymine and is a suitable candidate for contrast-enhanced magnetic resonance (MR) imaging applications.

2. Results and Discussion

2.1. Synthetic Procedure

Compound 1 was prepared from a mixture of Gd2O3 and thymine, which reacted in an aqueous suspension acidulated with perchloric acid, and was stirred at 60 °C for 1 h. The resulting solution was left to evaporate at room temperature for 1 week, thus generating colorless parallelepipeds of 1. Once synthesized, 1 is air-stable over a period of several days. In order to study its stability further, electronic absorption spectra of 1 were collected both in solid state and in aqueous solution (Figure 2 and Figure S2). Remarkably, the two spectra show the same absorption bands and different ones to that of the free thymine ligand (Figure S2), with this fact indicating the stability of 1 in aqueous solution (Figure 2a). SEM-EDAX analysis gave a molar ratio of 1:3 for the Gd/Cl relation in 1 (Figure 2b).

2.2. IR Spectroscopy

The infrared spectra of 1 and free thymine ligand are given in Figure S3. The infrared spectrum of thymine has been studied in detail in previous works [21,22], nevertheless, it has been included here just for comparison. The most interesting feature that is observed are the main vibrational bands associated to the two C=O groups, whose values for the free thymine ligand are 1735 and 1679 cm−1, respectively [21,22]. For 1, these vibrational bands are observed at 1747 and 1679 cm−1 (Figure S3), which is consistent with the coordination of the ligand through of only one C=O group [23].
The main vibrational bands associated to perchlorate anion are observed at 1145, 1112, and 1089 cm−1, which indicate the presence of this anion counterbalancing the positive charges of the cationic [Gd(thy)2(H2O)6]3+ complex of 1 (Figure S3).

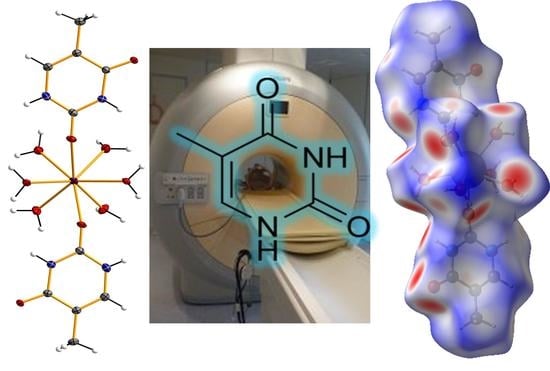
2.3. Description of the Crystal Structure

Crystal data and structure refinement parameters are summarized in Table 1. Compound 1 crystallizes in the monoclinic system with space group P21/c. Its crystal structure is made up of [Gd(thy)2(H2O)6]3+ cations, ClO4 anions, and water molecules of crystallization, which are held together mainly by electrostatic forces and H-bonding interactions. A [Gd(thy)2(H2O)6]3+ cation, three ClO4 anions, and two non-coordinating water molecules are present in the asymmetric unit of 1.
The GdIII ion in 1 is eight-coordinate and bonded to eight oxygen atoms, two oxygen atoms from carbonyl groups of two neutral thymine ligands, and six oxygen atoms of six water molecules (Figure 1). Given the neutral nature of the thymine molecule, coordination through the O(1) and O(3) atoms is expected (Figures S1 and S4). The average value of the Gd-O bond lengths [2.381(1) Å] is somewhat shorter than that of the Gd-Owater bond lengths [2.390(1) Å] (Table S1). The O-Gd-O bond angles show values covering the range of 70.24(6)–148.57(7)°. These values are in agreement with those reported for other species with a similar GdIII environment [24,25,26]. In 1, the thymine molecules are planar and form an angle between them of ca. 7.8(1)° with an intramolecular thymine-thymine separation of ca. 4.08 Å, which corresponds to the O(1)···O(3) distance. The C−C, C−N, and C−O bond lengths agree with those found in the literature for the thymine molecule (Table S1) [27].
In the crystal packing of 1, adjacent [Gd(thy)2(H2O)6]3+ cations are connected through H-bonding interactions that occur between thymine pairs, linking them into chains [N(3)···O(4a) = 2.763(3) Å and O(2)···N(10a) = 2.785(3) Å; (a) = x, y − 1, z], which grow along the b crystallographic axis (Figure S5). These chains are separated from each other through perchlorate anions, which interact with coordinated water molecules by means of H-bonding interactions involving the following set of atoms: O(3w)···O(11b) [2.944(3) Å; (b) = −x + 1, −y + 1, −z + 1], O(4w)···O(10b) [2.870(3) Å], O(4w)···O(15c) [2.847(3) Å; (c) = −x + 1, y − 1/2, −z + 3/2], and O(5w)···O(12) [2.713(3) Å] (Figure 3). The chains based on [Gd(thy)2(H2O)6]3+ cations are arranged forming a herringbone type structure, generating thymine planes that exhibit an angle of ca. 64(1)° (Figure 3b). The shortest Gd···Gd separation is 8.256(1) Å [Gd(1)···Gd(1d) distance; (d) = -x, −y + 1, −z + 1]. A supramolecular network is generated by additional H-bonding interactions involving coordinated and non-coordinated water molecules, along with weaker C-H···O interactions [the average value of the C···O distance being ca. 3.34 Å for C(13)···O(16), C(6)···O(5d) and C(13)···O(11e); (e) = −x + 1, y + 1/2, −z + 3/2], which contribute to stabilizing the crystal structure in 1 (Table 2).
To further analyze the coordination environment and geometry of the GdIII ion in 1, the SHAPE program was used [28]. In 1, the single GdIII ion exhibits a coordination number (CN) equal to 8. For Gd(1), a value of 0.307 was obtained and associated with a square antiprism (SAPR) geometry, the next and closer computed value being 1.733, which was assigned to a biaugmented trigonal prism (BTPR) geometry (Table 3). Hence, these calculated values allow us to assign the D4d symmetry to the Gd(1) ion in complex 1 (Table 3).

2.4. Analysis of the Hirshfeld Surfaces

Hirshfeld surfaces of the cationic [Gd(thy)2(H2O)6]3+ complex were calculated, and its closer intermolecular interactions were analyzed through the CrystalExplorer program [29,30]. These surfaces were mapped taking into account the distance from a point on the surface to the nearest atom outside (de) and inside (di) the surface. To overcome limitations related to the size of atoms, a normalized contact distance (dnorm) was also considered [29,30]. For compound 1, Hirshfeld surfaces are shown in Figure 4 and Figure S6, where the shorter contacts are displayed using red color [31]. Intermolecular O···H contacts between water molecules and between water molecules and carbonyl groups of the thymine molecules are the main interactions detected on the Hirshfeld surface (Figure 4 and Figure S6). The most important O···H contacts are those involving H-bonds between non-coordinated and coordinated water molecules, which are approximately 48% of the complete fingerprint plot, whereas the O···H interactions involving non-coordinated water molecules and carbonyl groups are highlighted from the full fingerprint as ca. 19% of the plot. Finally, additional N···H contacts involving non-coordinated water molecules and N-H groups of the thymine molecules only cover approximately 2% of the fingerprint plot (Figure 4).

2.5. Magnetic Properties

Dc magnetic susceptibility measurements were carried out on a freshly prepared microcrystalline sample of 1 in the 2–300 K temperature range and under an external magnetic field of 0.5 T. The χMT vs. T plot (χM being the molar magnetic susceptibility per GdIII ion) for compound 1 is given in Figure 5. At room temperature, the χMT value is ca. 7.89 cm3mol−1K, which is very close to that expected for a magnetically isolated GdIII ion (4f7 ion with gGd = 2.0, SGd = 7/2 and LGd = 0), that is, 7.88 cm3mol−1K [26,32]. Upon cooling, the χMT value approximately follows the Curie law to ca. 25 K with decreasing temperature, before χMT decreases, reaching a minimum value of ca. 7.21 cm3mol−1 K at 2 K. The decrease of the χMT value observed for complex 1 would likely be assignable to intermolecular interactions and/or very small zero-field splitting (ZFS) effects [32].
To analyze the magnetic behavior and fit the experimental data of the χMT vs. T plot for complex 1, the theoretical expression for the magnetic susceptibility of a single and isotropic SGd = 7/2 center was used [χM = (NμB2gGd2/3kB)SGd(SGd + 1)/(T − Θ)] [25]. Due to possible intermolecular interactions that can take place in 1, a Θ parameter was also included in this expression. The best least-squares fit gave the parameters gGd = 2.008 (1) and Θ = −0.039 (1) K with R = 1.9 × 10⁻⁵ for 1 {R being the agreement factor defined as Σi[(χMT)iobs − (χMT)icalcd]2/[(χMT)iobs]2}.
Field dependence of the molar magnetization (M) plot for 1 at 2 K is given in the inset of Figure 5. This plot exhibits a continuous increase of M with the applied magnetic field, showing a maximum value of M obtained for 1 (ca. 6.92 μB) at 5.0 T, which is as expected for a mononuclear GdIII complex [25]. The experimental data of the M vs. H plot were close to the Brillouin curve generated, with values of g and S of 2.0 and 7/2, respectively (Figure 5) [32].

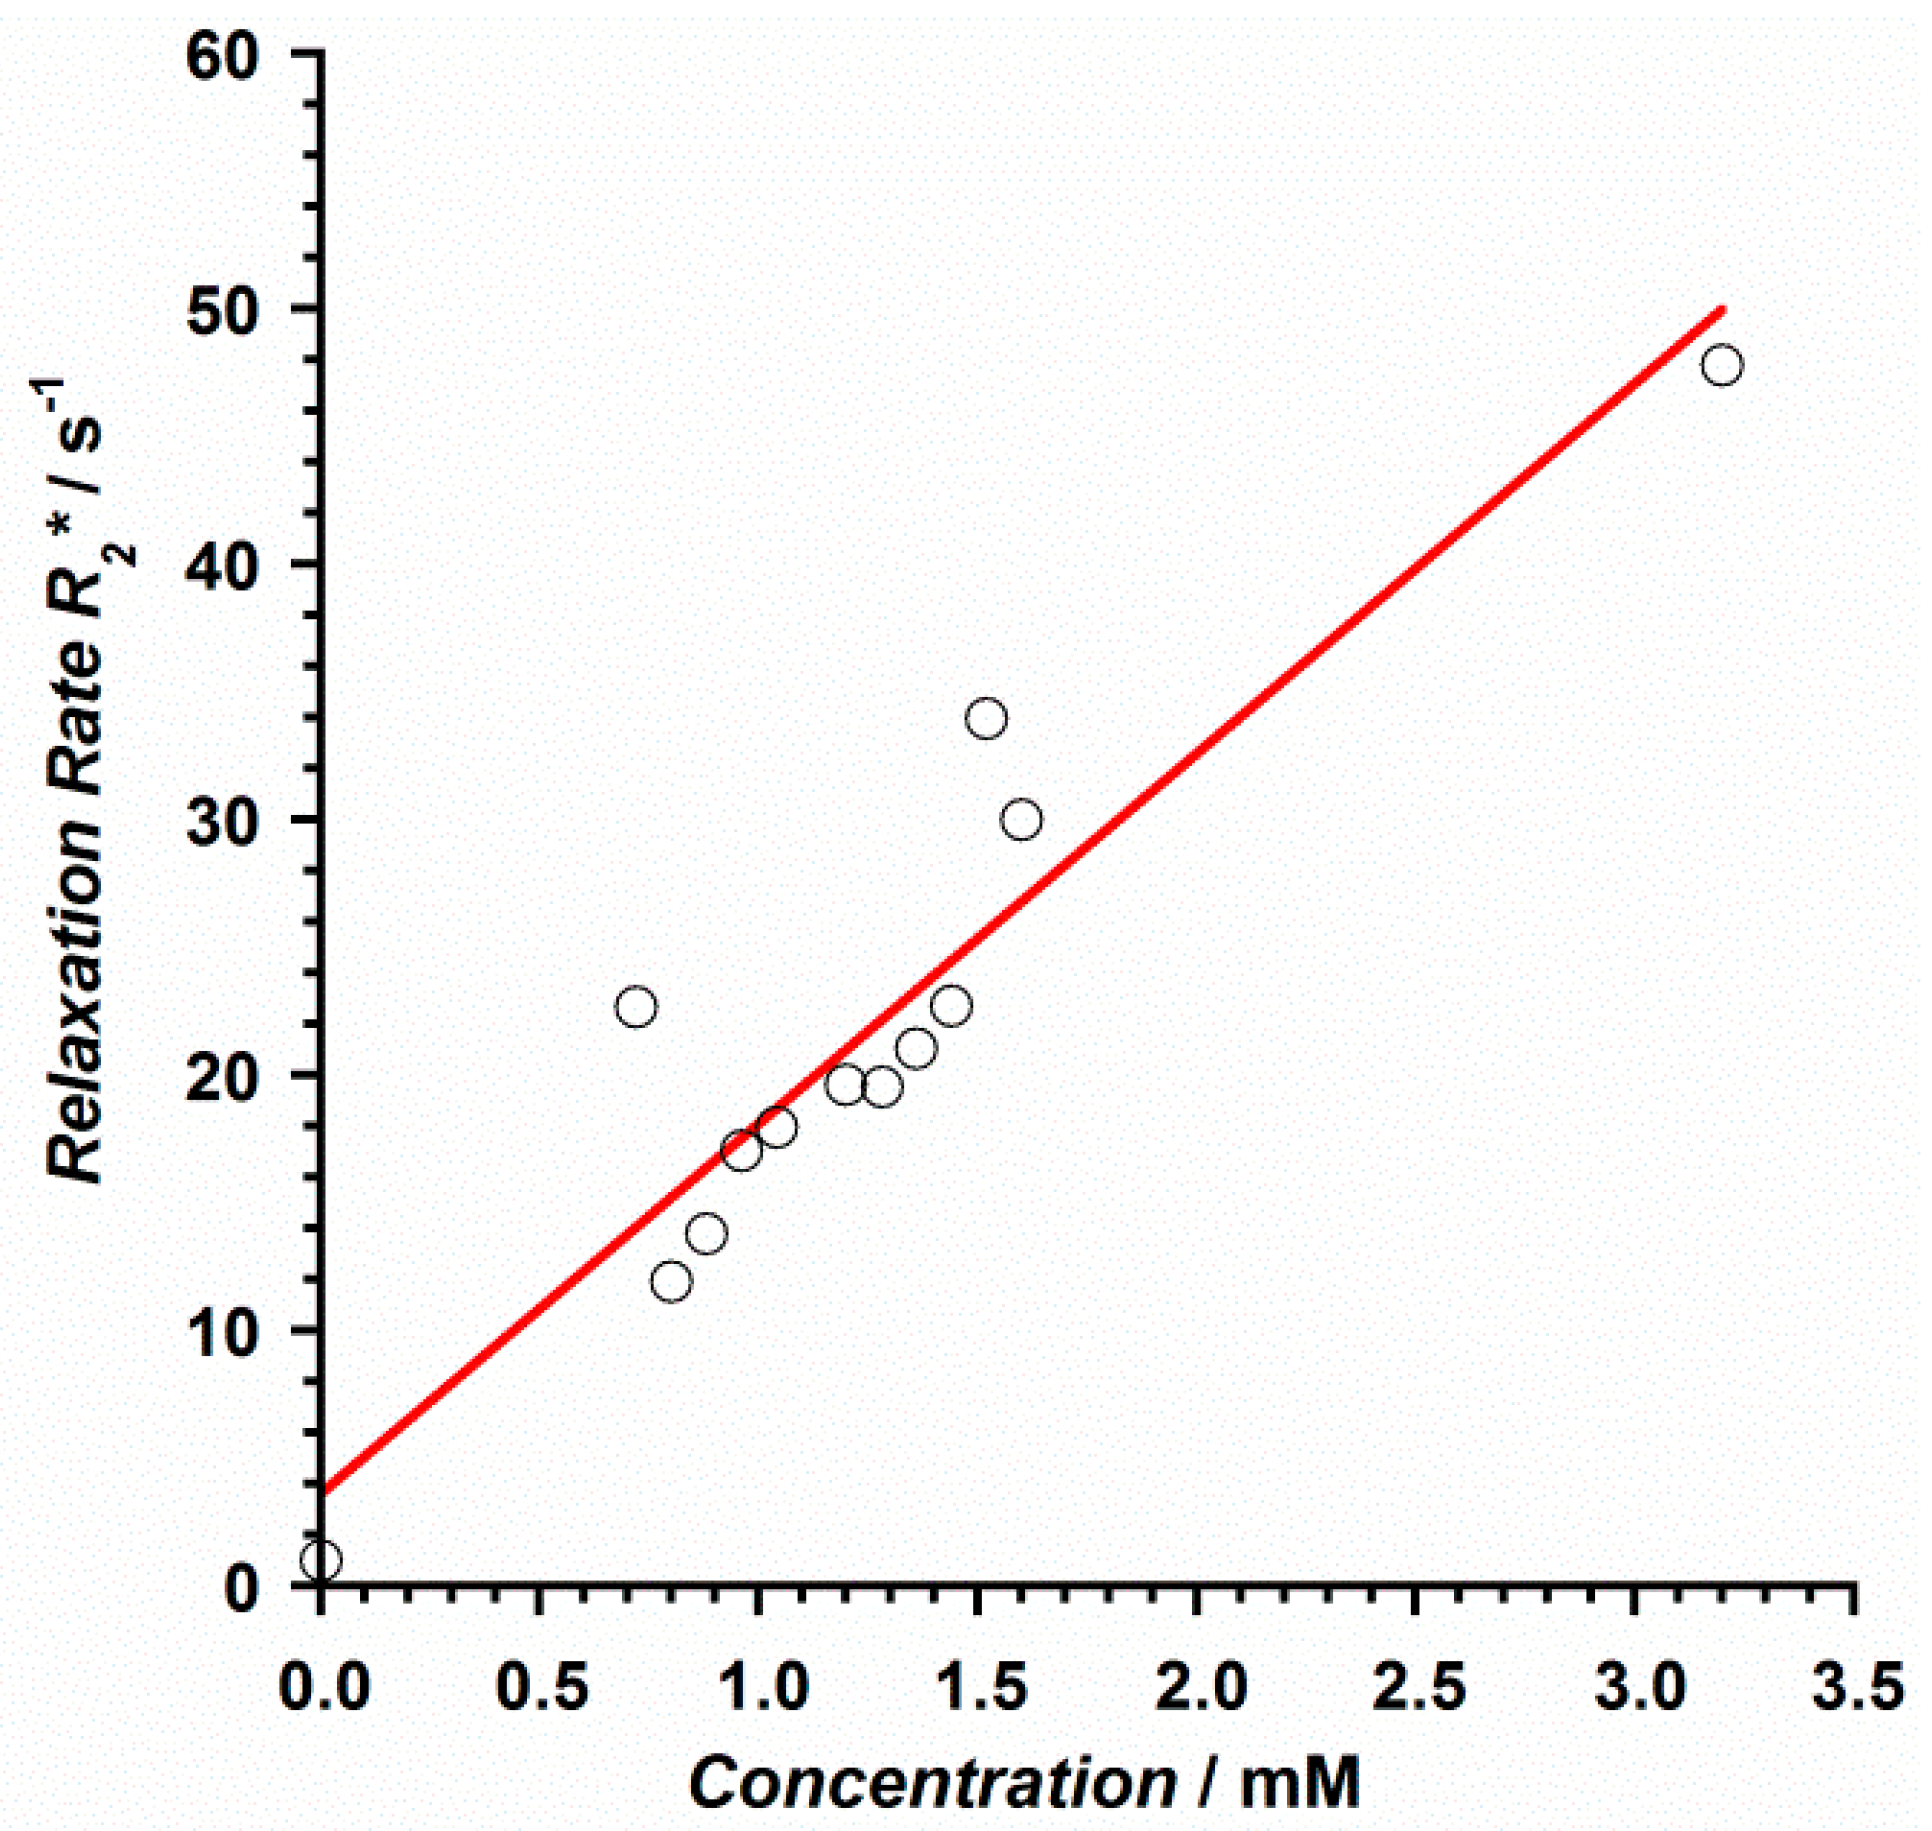
2.6. MR Imaging Phantom Studies

The relaxometric properties of compound 1 as a potential high-field MR imaging contrast agent were evaluated [33]. Thirteen samples of 1 were prepared in physiological serum with concentrations covering the range of 0.0–3.2 mM and were measured on a clinical MR scanner (Achieva 3T TX, Philips Healthcare, Best, The Netherlands) by using the volumetric head eight channels SENSE coil (Figure 6 and Figure S7).
The relaxation rate, denoted by R (and expressed in s−1), was obtained for each concentration through the calculation of the corresponding relaxation time T. R1 was obtained by calculating the T1 time from FFE sequences with 2°, 5°, 10°, 15°, 25°, and 45° flip angles, whereas r2 and r2* values were obtained after calculating T2 and T2* relaxation times from TSE and GRE sequences with 32 echo times each, TE1 = 10 ms, ∆TE = 10 ms and TE1 = 0.9 ms, ∆TE = 0.7 ms, respectively [34]. Thus, the longitudinal relaxivity (r1) of 1 at 3 T was determined to be 16.1 mM−1s−1, whereas the transversal relaxivities r2 and r2* values were 13.5 and 14.5 mM−1s−1, respectively (Figure 7 and Figure 8). These results show relaxivity values for 1 that are much higher than those of commercial MR imaging contrast agents currently employed on 3 T equipment [33], such as Magnevist, Gadovist, Prohance, Multihance, Dotarem, and Omniscan, among others [34], which makes 1 potentially useful. The fact that the GdIII ion in 1 exhibits a higher number of coordinate water molecules than the typical commercial contrast agents would enhance, at least in part, the common relaxivity values reported for these commercial contrast agents [34].

3. Materials and Methods

3.1. Reagents and Instruments

All of the manipulations were performed under aerobic conditions. All the commercial chemicals were used as received. CAUTION: Although no problems were encountered in this work, care should be taken when using the potentially explosive perchlorate anion (ClO4).
Elemental analyses (C, H, N) and X-ray microanalysis were performed by the Central Service for the Support to Experimental Research (SCSIE) at the University of Valencia. Scanning electron microscopy (SEM) images and results were obtained from a Hitachi S-4800 field emission scanning electron microscope (Hitachi Ltd., Tokyo, Japan). The electronic absorption spectra of 1 and thymine were measured at room temperature in a Jasco V-670 UV-vis-NIR spectrophotometer (Jasco Ltd., Tokyo, Japan) in the range of 600 to 1400 nm. Infrared spectra (IR) of 1 and thymine were recorded with a PerkinElmer Spectrum 65 FT-IR spectrometer (PerkinElmer Inc., Waltham, USA) in the range of 400 to 4000 cm−1. Variable-temperature, solid-state direct current (DC) magnetic susceptibility data down to 2.0 K were collected on a Quantum Design MPMS-XL SQUID magnetometer (Quantum Design, Inc., San Diego, CA, USA) equipped with a 5 T DC magnet. The experimental magnetic data were corrected for the diamagnetic contributions of the constituent atoms and also for the sample holder. MR data were collected on a Philips Achieva 3T clinical scanner (Philips Healthcare, Best, The Netherlands) with a volumetric head eight channels SENSE coil at La Fe University and Polytechnic Hospital.

3.2. Preparation of Compound

Synthesis of [Gd(thy)2(H2O)6](ClO4)3·2H2O (1)
A mixture of Gd2O3 (0.091 g, 0.25 mmol) and thymine (0.063 g, 0.50 mmol) in an aqueous suspension (5 mL) was acidulated with perchloric acid (1.0 mL, 2 M) and was stirred and heated at 60 °C for 1 h. The resulting solution was left to evaporate at room temperature for 1 week. Colorless parallelepipeds were obtained and were suitable for single-crystal X-ray diffraction studies. Yield: ca. 45%. Anal. Calcd. for C10H24N4O22Cl3Gd: C, 14.7; H, 3.0; N, 6.9. Found: C, 14.5; H, 3.0; N, 6.8. SEM-EDAX: a molar ratio of 1:3 for Gd/Cl was found for 1. IR (KBr pellet/cm−1): peaks were observed at 3399 (br), 3218 (m), 3063 (m), 2928 (m), 2813 (m), 1747 (s), 1679 (vs), 1635 (m), 1483 (w), 1449 (m), 1427 (w), 1383 (m), 1246 (m), 1205 (m), 1145 (vs), 1112 (vs), 1089 (vs), 935 (m), 835 (m), 815 (m), 760 (m), 744 (m), 627 (vs), 560 (m), 477 (m), 432 (m).

3.3. X-ray Data Collection and Structure Refinement

X-ray diffraction data from a single crystal of 1 with dimensions 0.34 × 0.12 × 0.05 mm3 was collected on a Bruker D8 Venture diffractometer (Bruker, Billerica, MA, USA) with graphite-monochromated Mo-Kα radiation (λ = 0.71073 Å). The structures were solved by standard direct methods and subsequently completed by Fourier recycling by using the SHELXTL software packages. The obtained model was refined with version 2018/1 of SHELXL against F2 on all data by full-matrix least squares [35]. All non-hydrogen atoms were anisotropically refined, whereas the hydrogen atoms of the thymine molecules were set in calculated positions and refined isotropically by using the riding model. The graphical manipulations were performed with the DIAMOND program [36]. The CCDC code for 1 is 2009091.

4. Conclusions

In summary, the preparation, crystal structure, magnetic properties, and MR imaging phantom studies of a novel GdIII complex based on the thymine nucleobase, of formula [Gd(thy)2(H2O)6](ClO4)3·2H2O (1) [thy = thymine], have been reported. 1 displays the first reported crystal structure based on gadolinium and thymine. Furthermore, 1 exhibits high relaxivity values and, therefore, can be considered a suitable candidate for further developments and MR analysis. Given that most of the thymine-containing complexes have been reported with this ligand in the form of thyminate anion, we presented in this work a singular strategy to prepare lanthanide compounds where the thymine molecule acts as a neutral ligand toward the metal ion. Further investigations dealing with the synthesis and characterization of this type of lanthanide complexes are now in progress in our group, incorporating other 4f ions and similar biomolecules.

Supplementary Materials

The following are available online at https://www.mdpi.com/article/10.3390/ijms22094586/s1, X-ray crystallographic data in CIF format for compound 1, Figures S1–S7, and Table S1.

Author Contributions

L.M.-B. and J.M.-L. conceived the idea and obtained funding for the project. M.O.-A. carried out the synthesis, the UV-vis-NIR measurements, the X-ray data collection, and the calculations through the SHAPE and CrystalExplorer programs. S.G.-C. and A.T.-E. performed the acquisition of the MR images, the phantoms, and the parametric map analysis. A.T.-E., L.M.-B., I.C., and J.M.-L. analyzed the data associated with all the experiments and wrote the manuscript, which all authors discussed and commented on. All authors have read and agreed to the published version of the manuscript.

Funding

This research was funded by the VLC-BIOMED Program (2017) of the University of Valencia [Subprogram A “Ayudas para el fomento de acciones preparatorias coordinadas UV-HUP/IIS La Fe”, Project 11-2017-A] and the Spanish Ministry of Science, Innovation and Universities [Project PID2019-109735GB-I00 and CEX2019-000919-M (Excellence Unit “María de Maeztu”)].

Institutional Review Board Statement

Not applicable.

Informed Consent Statement

Not applicable.

Data Availability Statement

The reported data are available on request from the corresponding author.

Acknowledgments

The authors thank Nicolás Moliner for assistance in SQUID measurements. M.O.-A. and J.M.-L. thank the Spanish “FPI fellowships” and “Ramón y Cajal” Programmes, respectively.

Conflicts of Interest

The authors declare no conflict of interest.

References

  1. Lippert, B.; Sanz Miguel, P.J. The renaissance of metal–pyrimidine nucleobase coordination chemistry. Acc. Chem. Res. 2016, 49, 1537–1545. [Google Scholar] [CrossRef] [PubMed]
  2. Somerville, R.L. Encyclopedia of Genetics; Academic Press: San Diego, CA, USA, 2001; pp. 1965–1966. [Google Scholar]
  3. Park, H.J.; Zhang, K.; Ren, Y.; Nadji, S.; Sinha, N.; Taylor, J.-S.; Kang, C.H. Crystal structure of a DNA decamer containing a cis-syn thymine dimer. Proc. Natl. Acad. Sci. USA 2002, 99, 15965–15970. [Google Scholar] [CrossRef] [Green Version]
  4. Sakate, M.; Hosoda, H.; Suzuki, T. Crystal structures of bis–[2-(pyridin-2-yl)phenyl-κ2N,C1]rhodium(III) complexes containing an acetonitrile or monodentate thyminate(1−) ligand. Acta Cryst. 2016, E72, 543–547. [Google Scholar] [CrossRef] [PubMed] [Green Version]
  5. Vegas, V.G.; Lorca, R.; Latorre, A.; Hassanein, K.; Gómez-García, C.J.; Castillo, O.; Somoza, A.; Zamora, F.; Amo-Ochoa, P. Copper(II)-thymine coordination polymer nanoribbons as potential oligonucleotide nanocarriers. Angew. Chem. Int. Ed. 2017, 56, 987–991. [Google Scholar] [CrossRef] [PubMed]
  6. Correa, R.S.; Freire, V.; Barbosa, M.I.F.; Bezerra, D.P.; Bomfim, L.M.; Moreira, D.R.M.; Soares, M.B.P.; Ellena, J.; Batista, A.A. Ru(II)–thyminate complexes: New metallodrug candidates against tumor cells. New J. Chem. 2018, 42, 6794–6802. [Google Scholar] [CrossRef]
  7. Silva, S.L.R.; Baliza, I.R.S.; Dias, R.B.; Sales, C.B.S.; Rocha, C.A.G.; Soares, M.B.P.; Correa, R.S.; Batista, A.A.; Bezerra, D.P. Ru(II)-thymine complex causes DNA damage and apoptotic cell death in human colon carcinoma HCT116 cells mediated by JNK/p38/ERK1/2 via a p53-independent signaling. Sci. Rep. 2019, 9, 11094. [Google Scholar] [CrossRef] [Green Version]
  8. De, H.; Paul, A.; Datta, A. Theoretical study of Au4 thymine, Au20 and Ag20 uracil and thymine complexes for surface enhanced Raman scattering. Comput. Theor. Chem. 2017, 1111, 1–13. [Google Scholar] [CrossRef]
  9. Kondo, J.; Yamada, T.; Hirose, C.; Okamoto, I.; Tanaka, Y.; Ono, A. Crystal structure of metallo DNA duplex containing consecutive Watson-Crick-like T-Hg(II)-T base pairs. Angew. Chem. Int. Ed. 2014, 24, 2385–2388. [Google Scholar] [CrossRef]
  10. Yamaguchi, H.; Šebera, J.; Kondo, J.; Oda, S.; Komuro, T.; Kawamura, T.; Dairaku, T.; Kondo, Y.; Okamoto, I.; Ono, A.; et al. The structure of metallo-DNA with consecutive thymine–HgII–thymine base pairs explains positive entropy for the metallo base pair formation. Nucleic Acids Res. 2014, 42, 4094–4099. [Google Scholar] [CrossRef]
  11. Kuriyama, M.; Haruta, K.; Dairaku, T.; Kawamura, T.; Kikkawa, S.; Inamoto, K.; Tsukamoto, H.; Kondo, Y.; Torigoe, H.; Okamoto, I.; et al. Hg2+-trapping beads: Hg2+-specific recognition through thymine–Hg(II)–thymine base pairing. Chem. Pharm. Bull. 2014, 62, 709–712. [Google Scholar] [CrossRef] [Green Version]
  12. Li, L.; Wen, Y.; Xu, L.; Xu, Q.; Song, S.; Zuo, X.; Yan, J.; Zhang, W.; Liu, G. Development of mercury (II) ion biosensors based on mercury-specific oligonucleotide probes. Biosens. Bioelectron. 2016, 75, 433–445. [Google Scholar] [CrossRef] [PubMed]
  13. Chun, H.J.; Kim, S.; Han, Y.D.; Kim, D.W.; Kim, K.R.; Kim, H.S.; Kim, J.H.; Yoon, H.C. Water-soluble mercury ion sensing based on the thymine-Hg2+-thymine base pair using retroreflective Janus particle as an optical signaling probe. Biosens. Bioelectron. 2018, 104, 138–144. [Google Scholar] [CrossRef] [PubMed]
  14. Kashima, A.; Sakate, M.; Ota, H.; Fuyuhiro, A.; Sunatsukia, Y.; Suzuki, T. Thyminate(2−)-bridged cyclic tetranuclear rhodium(III) complexes formed by a template of a sodium, calcium or lanthanoid ion. Chem. Commun. 2015, 51, 1889–1892. [Google Scholar] [CrossRef] [PubMed]
  15. Armentano, D.; Marino, N.; Mastropietro, T.F.; Martínez-Lillo, J.; Cano, J.; Julve, M.; Lloret, F.; De Munno, G. Self-assembly of a chiral carbonate- and cytidine-containing dodecanuclear Copper(II) Complex: A multiarm-supplied globular capsule. Inorg. Chem. 2008, 47, 10229–10231. [Google Scholar] [CrossRef] [PubMed]
  16. Martínez-Lillo, J.; Mastropietro, T.F.; Lappano, R.; Madeo, A.; Alberto, M.E.; Russo, N.; Maggiolini, M.; De Munno, G. Rhenium(IV) compounds inducing apoptosis in cancer cells. Chem. Commun. 2011, 47, 5283–5285. [Google Scholar] [CrossRef]
  17. Marino, N.; Armentano, D.; Mastropietro, T.F.; Julve, M.; De Munno, G.; Martínez-Lillo, J. Cubane-Type CuII4 and MnII2MnIII2 complexes based on pyridoxine: A versatile ligand for metal assembling. Inorg. Chem. 2013, 52, 11934–11943. [Google Scholar] [CrossRef]
  18. Armentano, D.; Barquero, M.A.; Rojas-Dotti, C.; Moliner, N.; De Munno, G.; Brechin, E.K.; Martínez-Lillo, J. Enhancement of intermolecular magnetic exchange through halogen···halogen interactions in bisadeninium rhenium(IV) salts. Cryst. Growth Des. 2017, 17, 5342–5348. [Google Scholar] [CrossRef] [Green Version]
  19. Orts-Arroyo, M.; Castro, I.; Lloret, F.; Martínez-Lillo, J. Field-induced slow relaxation of magnetisation in two one-dimensional homometallic dysprosium(III) complexes based on alpha- and beta-amino acids. Dalton Trans. 2020, 49, 9155–9163. [Google Scholar] [CrossRef]
  20. Orts-Arroyo, M.; Castro, I.; Martínez-Lillo, J. Detection of Hypoxanthine from inosine and unusual hydrolysis of immunosuppressive drug azathioprine through the formation of a diruthenium(III) system. Biosensors 2021, 11, 19. [Google Scholar] [CrossRef] [PubMed]
  21. Colarusso, P.; Zhang, K.-Q.; Guo, B.; Bernath, P.F. The infrared spectra of uracil, thymine, and adenine in the gas phase. Chem. Phys. Lett. 1997, 269, 39–48. [Google Scholar] [CrossRef]
  22. Singh, J.S. FTIR and Raman spectra and fundamental frequencies of biomolecule: 5-Methyluracil (thymine). J. Mol. Struct. 2008, 876, 127–133. [Google Scholar] [CrossRef]
  23. Azab, H.A.; Al-Deyab, S.S.; Anwar, Z.M.; El-Gawad, I.I.A.; Kamel, R.M. Comparison of the coordination tendency of amino acids, nucleobases, or mononucleotides toward the monomeric and dimeric lanthanide complexes with biologically important compounds. J. Chem. Eng. Data 2011, 56, 2613–2625. [Google Scholar] [CrossRef]
  24. Guillou, O.; Bergerat, P.; Kahn, O.; Bakalbassis, E.; Boubekeur, K.; Batail, P.; Guillot, M. Ferromagnetically coupled gadolinium(III)copper(II) molecular material. Inorg. Chem. 1992, 31, 110–114. [Google Scholar] [CrossRef]
  25. Cañadillas-Delgado, L.; Fabelo, O.; Cano, J.; Ruiz-Pérez, C. Magnetic Interactions in Oxo-Carboxylate Bridged Gadolinium(III) Complexes Synthesis, Crystal Structures and Magnetic Properties; Nova Science Publishers, Inc.: Hauppauge, NY, USA, 2010. [Google Scholar]
  26. Martínez-Lillo, J.; Cañadillas-Delgado, L.; Cano, J.; Lloret, F.; Julve, M.; Faus, J. A heteropentanuclear oxalato-bridged [ReIV4GdIII] complex: Synthesis, crystal structure and magnetic properties. Chem. Commun. 2012, 48, 9242–9244. [Google Scholar] [CrossRef] [PubMed]
  27. Portalone, G.; Bencivenni, L.; Colapietro, M.; Pieretti, A.; Ramondo, F. The Effect of hydrogen bonding on the structures of uracil and some methyl derivatives studied by experiment and theory. Acta Chem. Scand. 1999, 53, 57–68. [Google Scholar] [CrossRef] [Green Version]
  28. Llunell, M.; Casanova, D.; Cirera, J.; Alemany, P.; Alvarez, S. SHAPE 2.1; Universitat de Barcelona: Barcelona, Spain, 2013. [Google Scholar]
  29. Spackman, M.A.; Jayatilaka, D. Hirshfeld surface analysis. CrystEngComm 2009, 11, 19–32. [Google Scholar] [CrossRef]
  30. Turner, M.J.; McKinnon, J.J.; Wolff, S.K.; Grimwood, D.J.; Spackman, P.R.; Jayatilaka, D.; Spackman, M.A. Crystal Explorer 17; University of Western Australia: Perth, Australia, 2017. [Google Scholar]
  31. Orts-Arroyo, M.; Castro, I.; Lloret, F.; Martínez-Lillo, J. Molecular self-assembly in a family of oxo-bridged dinuclear ruthenium(IV) systems. Cryst. Growth Des. 2020, 20, 2044–2056. [Google Scholar] [CrossRef]
  32. Kahn, O. Molecular Magnetism; VCH: New York, NY, USA, 1993. [Google Scholar]
  33. Mousavi, B.; Chauvin, A.-S.; Moriggi, L.; Helm, L. Carbazole as linker for dinuclear gadolinium-based MRI contrast agents. Eur. J. Inorg. Chem. 2017, 5403–5412. [Google Scholar] [CrossRef]
  34. Rohrer, M.; Bauer, H.; Mintorovitch, J.; Requardt, M.; Weinmann, H.-J. Comparison of magnetic properties of MRI contrast media solutions at different magnetic field strengths. Investig. Radiol. 2005, 40, 715–724. [Google Scholar] [CrossRef] [PubMed] [Green Version]
  35. Bruker Analytical X-ray Instruments. SHELXL-2018/1; Bruker Analytical X-ray Instruments: Madison, WI, USA, 2018. [Google Scholar]
  36. Crystal Impact GbR. DIAMOND 4.5.0; Crystal Impact GbR: Bonn, Germany, 2018. [Google Scholar]
Figure 1. (a) Molecular structure of the thymine nucleobase (thy); (b) Mononuclear [Gd(thy)2(H2O)6]3+ complex in 1. ClO4 anions and non-coordinated water molecules have been omitted for clarity. Color code: purple, Gd; red, O; blue, N; black, C; white, H.
Ijms 22 04586 g001
Figure 2. (a) Electronic absorption spectra from samples of compound 1 in solid state (top) and in aqueous solution (bottom); (b) SEM-EDAX spectrum for compound 1.
Ijms 22 04586 g002
Figure 3. (a) View along the crystallographic c axis of the H-bonding interactions (green dashed lines) between perchlorate anions (capped sticks model) and [Gd(thy)2(H2O)6]3+ cations in 1. For the sake of clarity, H atoms are omitted and only coordinated water molecules are shown. Color code: purple, Gd; green, Cl; red, O; blue, N; grey, C; (b) View along the crystallographic a axis of the herringbone type structure of 1. H atoms, perchlorate anions, and non-coordinating water molecules have been omitted for clarity. Color code: purple, Gd; red, O; blue, N; grey, C.
Ijms 22 04586 g003
Figure 4. (Top) Hirshfeld surface mapped with dnorm function for 1; (bottom) Fingerprint plots for 1; (bottom, left) Intermolecular O···H contacts between non-coordinated and coordinated water molecules are highlighted from the full fingerprint; (bottom, right) Non-coordinated water molecules and thymine carbonyl groups are highlighted from the full fingerprint.
Ijms 22 04586 g004
Figure 5. χMT vs. T plot obtained for compound 1. The inset shows the field dependence of the molar magnetization (M) plot at 2.0 K for 1. The solid red lines represent the best fit of the experimental data.
Ijms 22 04586 g005
Figure 6. (a) MR imaging scanner (Philips Achieva 3T); (b) Samples of 1 prepared in physiological serum with concentrations covering the range of 0.0–3.2 mM; (c) MR images of the tube phantoms of 1; (d) T2 parametric map analysis.
Ijms 22 04586 g006
Figure 7. Relaxation rate vs. contrast concentration plot obtained for the relaxivities r1 (a) and r2 (b) of compound 1. The red line represents the best linear fit of the experimental data.
Ijms 22 04586 g007
Figure 8. Relaxation rate vs. contrast concentration plot obtained for the relaxivity r2* of compound 1. The red line represents the best linear fit of the experimental data.
Ijms 22 04586 g008
Table 1. Summary of the crystal data and structure refinement parameters for 1.
Compound1
CCDC2009091
FormulaC10H28N4O24Cl3Gd
Mr/g mol−1851.96
Crystal systemMonoclinic
Space groupP21/c
a13.192 (1)
b9.901 (1)
c20.985 (1)
α90
β95.18 (1)
γ90
V32729.8 (2)
Z4
Dc/g cm−32.073
μ (Mo − Kα)/mm−12.832
Goodness-of-fit on F21.081
R1 [I > 2σ (I)]/all0.0280/0.0325
wR2 [I > 2σ (I)]/all0.0703/0.0733
Table 2. Selected hydrogen-bonding interactions in 1 a.
D-H·AD-H/ÅH·A/ÅD·A/Å(DHA)/°
N(1)-H(1)···O(8f)0.8802.12(1)2.982(1)165.4(1)
N(3)-H(3)···O(4a)0.8801.89(1)2.763(1)175.6(1)
N(10)-H(10)···O(2g)0.8801.92(1)2.785(1)168.7(1)
O(1w)-H(1wA)···O(7)0.9512.05(1)2.986(1)168.4(1)
O(1w)-H(1wB)···O(4a)0.9531.77(1)2.677(1)159.1(1)
O(2w)-H(2wA)···O(2g)0.9481.75(1)2.691(1)169.2(1)
O(3w)-H(3wA)···O(11b)0.9532.07(1)2.944(1)151.0(1)
O(3w)-H(3wB)···O(7wf)0.9501.76(1)2.660(1)156.0(1)
O(4w)-H(4wA)···O(10b)0.9512.01(1)2.870(1)149.4(1)
O(4w)-H(4wB)···O(15c)0.9531.944(1)2.847(1)157.4(1)
O(5w)-H(5wA)···O(12)0.9501.77(1)2.713(1)169.2(1)
O(5w)-H(5wB)···O(14)0.9501.87(1)2.810(1)169.1(1)
O(6w)-H(6wA)···O(9h)0.9512.27(1)2.939(1)126.9(1)
O(6w)-H(6wA)···O(7wf)0.9512.31(1)2.986(1)127.4(1)
O(6w)-H(6wB)···O(8w)0.9531.75(1)2.694(1)171.9(1)
O(7w)-H(7wB)···O(8wc)0.9611.91(1)2.896(1)172.5(1)
O(8w)-H(8wA)···O(13)0.9541.91(1)2.855(1)170.8(1)
O(8w)-H(8wB)···O(15e)0.9531.92(1)2.846(1)163.9(1)
a Symmetry codes: (a) = x, y − 1, z; (b) = −x + 1, −y + 1, −z + 1; (c) = −x + 1, y − 1/2, −z + 3/2; (e) = −x + 1, y + 1/2, −z + 3/2; (f) = x, −y + 3/2, z − 1/2; (g) = x, y + 1, z; (h) = −x + 1, −y + 2, −z + 1.
Table 3. Selected values for possible geometries with coordination number (CN) equal to 8 obtained through the SHAPE program and from the structural parameters of complex 1 a.
HPYHBPYCUSAPRTDDJGBFJETBPYBTPRJSDTT
23.39216.3229.1710.3071.91315.65628.4711.7334.83010.015
a HPY: heptagonal pyramid (C7v); HBPY: hexagonal bipyramid (D6h); CU: cube (Oh); SAPR: square antiprism (D4d); TDD: triangular dodecahedron (D2d); JGBF: Johnson gyrobifastigium (D2d); JETBPY: Johnson elongated triangular bipyramid (D3h); BTPR: biaugmented trigonal prism (C2v); JSD: snub disphenoid (D2d); TT: triakis tetrahedron (Td).
Publisher’s Note: MDPI stays neutral with regard to jurisdictional claims in published maps and institutional affiliations.

