
Mechanically Strong Polyurethane Composites Reinforced with Montmorillonite-Modified Sage Filler (Salvia officinalis L.)

 ,
,  ,
,  and
and
Abstract
1. Introduction
- The incorporation of flame-retardant additives, also known as anti-pyrenes [34], into the reaction mixture at the component mixing stage,
- the application of compounds that contain flame-retardant functional groups (especially hydroxyl),
- the formation of a fire-retardant coating on the surface of the flammable foam.
2. Results and Discussion
2.1. Filler Characterization
2.2. PUR Composite Characterization
3. Materials and Methods
3.1. Materials
- Isocyanate compound—polymeric diphenylmethane diisocyanate, pMDI (Purocyn B; Purinova Company, Bydgoszcz, Poland);
- Polyol compound—polyether polyol (Stapanpol PS-2352, Stepan Company, Northfield, IL, USA);
- Catalysts—potassium octoate (Kosmos 75) and potassium acetate (Kosmos 33; Evonik Industry, Essen, Germany);
- Surfactant—silicone-based surfactant (Tegostab B8513, Evonik Industry, Essen, Germany);
- Blowing agent—pentane and cyclopentane (Sigma-Aldrich Corporation, Saint Louis, MO, USA);
- Surface modified montmorillonite clay, 15–35 wt.% octadecylamine, 0.5–5 wt.% aminopropyltriethoxysilane (Sigma-Aldrich Corporation, Saint Louis, MO, USA);
- Salvia residue (local company, Lodz, Poland);
- Montmorillonite clay, Nanomer® contains 15–35 wt.% octadecylamine, 0.5–5 wt.% aminopropyltriethoxysilane (Merck, Darmstadt, Germany).
3.2. Methods and Instruments
3.3. Polyurethane Composite Synthesis
4. Conclusions
Author Contributions
Funding
Data Availability Statement
Conflicts of Interest
References
- Kurańska, M.; Barczewski, R.; Barczewski, M.; Prociak, A.; Polaczek, K. Thermal Insulation and Sound Absorption Properties of Open-Cell Polyurethane Foams Modified with Bio-Polyol Based on Used Cooking Oil. Materials 2020, 13, 5673. [Google Scholar] [CrossRef]
- Thompson, R.C.; Moore, C.J.; Saal, F.S.V.; Swan, S.H. Plastics, the environment and human health: Current consensus and future trends. Philos. Trans. R. Soc. B Biol. Sci. 2009, 364, 2153–2166. [Google Scholar] [CrossRef]
- Payne, J.; McKeown, P.; Jones, M.D. A circular economy approach to plastic waste. Polym. Degrad. Stab. 2019, 165, 170–181. [Google Scholar] [CrossRef]
- Ioannidou, S.M.; Pateraki, C.; Ladakis, D.; Papapostolou, H.; Tsakona, M.; Vlysidis, A.; Kookos, I.K.; Koutinas, A. Sustainable production of bio-based chemicals and polymers via integrated biomass refining and bioprocessing in a circular bioeconomy context. Bioresour. Technol. 2020, 307, 123093. [Google Scholar] [CrossRef] [PubMed]
- Andersons, J.; Kirpluks, M.; Cabulis, P.; Kalnins, K.; Cabulis, U. Bio-based rigid high-density polyurethane foams as a structural thermal break material. Constr. Build. Mater. 2020, 260, 120471. [Google Scholar] [CrossRef]
- Wolski, K.; Cichosz, S.; Masek, A. Surface hydrophobisation of lignocellulosic waste for the preparation of biothermoelastoplastic composites. Eur. Polym. J. 2019, 118, 481–491. [Google Scholar] [CrossRef]
- Rincón, E.; Balu, A.M.; Luque, R.; Serrano, L. Insulating rigid polyurethane foams from laurel tree pruning based polyol. J. Appl. Polym. Sci. 2021, 138, 1–15. [Google Scholar] [CrossRef]
- Gama, N.V.; Ferreira, A.; Barros-Timmons, A. Polyurethane foams: Past, present, and future. Materials 2018, 11, 1841. [Google Scholar] [CrossRef] [PubMed]
- Dacewicz, E.; Grzybowska-Pietras, J. Polyurethane foams for domestic sewage treatment. Materials 2021, 14, 933. [Google Scholar] [CrossRef] [PubMed]
- Engels, H.W.; Pirkl, H.G.; Albers, R.; Albach, R.W.; Krause, J.; Hoffmann, A.; Casselmann, H.; Dormish, J. Polyurethanes: Versatile materials and sustainable problem solvers for today’s challenges. Angew. Chemie Int. Ed. 2013, 52, 9422–9441. [Google Scholar] [CrossRef] [PubMed]
- Joshi, M.; Adak, B.; Butola, B.S. Polyurethane nanocomposite based gas barrier films, membranes and coatings: A review on synthesis, characterization and potential applications. Prog. Mater. Sci. 2018, 97, 230–282. [Google Scholar] [CrossRef]
- Leszczyńska, M.; Ryszkowska, J.; Szczepkowski, L. Rigid polyurethane foam composites with nut shells. Polymers 2020, 65, 728–737. [Google Scholar] [CrossRef]
- Cichosz, S.; Masek, A. Superiority of cellulose non-solvent chemical modification over solvent-involving treatment: Application in polymer composite (part II). Materials 2020, 13, 2901. [Google Scholar] [CrossRef] [PubMed]
- Ivdre, A.; Abolins, A.; Sevastyanova, I.; Kirpluks, M.; Cabulis, U.; Merijs-Meri, R. Rigid polyurethane foams with various isocyanate indices based on polyols from rapeseed oil and waste PET. Polymers 2020, 12, 738. [Google Scholar] [CrossRef]
- De Menezes, A.J.; Pasquini, D.; Curvelo, A.A.D.S.; Gandini, A. Oxypropylation of Corn Starch Granules. Biomacromolecules 2007, 8, 2047–2050. [Google Scholar] [CrossRef]
- Kumar, A.K.; Sharma, S. Recent updates on different methods of pretreatment of lignocellulosic feedstocks: A review. Bioresour. Bioprocess. 2017, 4. [Google Scholar] [CrossRef]
- Barbu, M.C.; Sepperer, T.; Tudor, E.M.; Petutschnigg, A. Walnut and hazelnut shells: Untapped industrial resources and their suitability in lignocellulosic composites. Appl. Sci. 2020, 10, 6340. [Google Scholar] [CrossRef]
- Samat, N.; Sulaiman, M.A.; Ahmad, Z.; Anuar, H. A comparative study on the desiccant effect of polypropylene and polylactic acid composites reinforced with different lignocellulosic fibres. J. Appl. Sci. Eng. 2021, 24, 223–231. [Google Scholar] [CrossRef]
- Odalanowska, M.; Woźniak, M.; Ratajczak, I.; Zielińska, D.; Cofta, G.; Borysiak, S. Propolis and organosilanes as innovative hybrid modifiers in wood-based polymer composites. Materials 2021, 14, 464. [Google Scholar] [CrossRef]
- Liszkowska, J.; Borowicz, M.; Paciorek-Sadowska, J.; Isbrandt, M.; Czupryński, B.; Moraczewski, K. Assessment of photodegradation and biodegradation of RPU/PIR foams modified by natural compounds of plant origin. Polymers 2020, 12, 33. [Google Scholar] [CrossRef]
- Marson, A.; Masiero, M.; Modesti, M.; Scipioni, A.; Manzardo, A. Life Cycle Assessment of Polyurethane Foams from Polyols Obtained through Chemical Recycling. ACS Omega 2021, 6, 1718–1724. [Google Scholar] [CrossRef] [PubMed]
- Perrino, E.V.; Valerio, F.; Gannouchi, A.; Trani, A.; Mezzapesa, G. Ecological and Plant Community Implication on Essential Oils Composition in Useful Wild Officinal Species: A Pilot Case Study in Apulia (Italy). Plants 2021, 10, 574. [Google Scholar] [CrossRef]
- Flampouri, E.; Sotiropoulou, Ν.S.D.; Mavrikou, S.; Mouzaki-Paxinou, A.C.; Tarantilis, P.A.; Kintzios, S. Conductive polymer-based bioelectrochemical assembly for in vitro cytotoxicity evaluation: Renoprotective assessment of Salvia officinalis against carbon tetrachloride induced nephrotoxicity. Biochim. Biophys. Acta Gen. Subj. 2017, 1861, 2304–2314. [Google Scholar] [CrossRef] [PubMed]
- Capek, P.; Hříbalová, V.; Švandová, E.; Ebringerová, A.; Sasinková, V.; Masarová, J. Characterization of immunomodulatory polysaccharides from Salvia officinalis L. Int. J. Biol. Macromol. 2003, 33, 113–119. [Google Scholar] [CrossRef]
- Zhao, J.; Lou, J.; Mou, Y.; Li, P.; Wu, J.; Zhou, L. Diterpenoid tanshinones and phenolic acids from cultured hairy roots of salvia miltiorrhiza bunge and their antimicrobial activities. Molecules 2011, 16, 2259–2267. [Google Scholar] [CrossRef] [PubMed]
- Jiang, Y.; Zhang, L.; Rupasinghe, H.P.V. Antiproliferative effects of extracts from Salvia officinalis L. and Saliva miltiorrhiza Bunge on hepatocellular carcinoma cells. Biomed. Pharmacother. 2017, 85, 57–67. [Google Scholar] [CrossRef]
- Li, L.; Zhang, Y.; Ma, J.; Dong, W.; Song, Q.; Zhang, J.; Chu, L. Salvia miltiorrhiza injection ameliorates renal damage induced by lead exposure in mice. Sci. World J. 2014, 2014. [Google Scholar] [CrossRef]
- Strakowska, A.; Członka, S.; Strzelec, K. POSS compounds as modifiers for rigid polyurethane foams (Composites). Polymers 2019, 11, 1092. [Google Scholar] [CrossRef]
- Singh, H.; Jain, A.K. Ignition, Combustion, Toxicity, and Fire Retardancy of Polyurethane Foams: A Comprehensive Review. J. Appl. Polym. Sci. 2009, 111, 1115–1143. [Google Scholar] [CrossRef]
- Zhang, G.; Lin, X.; Zhang, Q.; Jiang, K.; Chen, W.; Han, D. Anti-flammability, mechanical and thermal properties of bio-based rigid polyurethane foams with the addition of flame retardants. RSC Adv. 2020, 10, 32156–32161. [Google Scholar] [CrossRef]
- Wang, S.X.; Zhao, H.B.; Rao, W.H.; Huang, S.C.; Wang, T.; Liao, W.; Wang, Y.Z. Inherently flame-retardant rigid polyurethane foams with excellent thermal insulation and mechanical properties. Polymer 2018, 153, 616–625. [Google Scholar] [CrossRef]
- Kaur, R.; Kumar, M. Addition of anti-flaming agents in castor oil based rigid polyurethane foams: Studies on mechanical and flammable behaviour. Mater. Res. Express 2020, 7. [Google Scholar] [CrossRef]
- Jiao, L.; Xiao, H.; Wang, Q.; Sun, J. Thermal degradation characteristics of rigid polyurethane foam and the volatile products analysis with TG-FTIR-MS. Polym. Degrad. Stab. 2013, 98, 2687–2696. [Google Scholar] [CrossRef]
- Strąkowska, A.; Członka, S.; Konca, P.; Strzelec, K. New Flame Retardant Systems Based on Expanded Graphite for Rigid Polyurethane Foams. Appl. Sci. 2020, 10, 5817. [Google Scholar] [CrossRef]
- Xu, W.; Wang, G.; Zheng, X. Research on highly flame-retardant rigid PU foams by combination of nanostructured additives and phosphorus flame retardants. Polym. Degrad. Stab. 2015, 111, 142–150. [Google Scholar] [CrossRef]
- Ye, L.; Meng, X.-Y.; Liu, X.-M.; Tang, J.-H.; Li, Z.-M. Flame-Retardant and Mechanical Properties of High-Density Rigid Polyurethane Foams Filled with Decabrominated Dipheny Ethane and Expandable Graphite. J. Appl. Polym. Sci. 2009, 111, 2373–2380. [Google Scholar] [CrossRef]
- Thirumal, M.; Khastgir, D.; Nando, G.B.; Naik, Y.P.; Singha, N.K. Halogen-free flame retardant PUF: Effect of melamine compounds on mechanical, thermal and flame retardant properties. Polym. Degrad. Stab. 2010, 95, 1138–1145. [Google Scholar] [CrossRef]
- Shi, L.; Li, Z.-M.; Xie, B.-H.; Wang, J.-H.; Tian, C.-R.; Yang, M.-B. Flame retardancy of different-sized expandable graphite particles for high-density rigid polyurethane foams. Polym. Int. 2006, 55, 862–871. [Google Scholar] [CrossRef]
- Lindholm, J.; Brink, A.; Wilen, C.-E.; Hupa, M. Cone Calorimeter Study of Inorganic Salts as Flame Retardants in Polyurethane Adhesive with Limestone Filler. J. Appl. Polym. Sci. 2012, 123, 1793–1800. [Google Scholar] [CrossRef]
- Chen, L.; Wang, Y.Z. A review on flame retardant technology in China. Part I: Development of flame retardants. Polym. Adv. Technol. 2010, 21, 1–26. [Google Scholar] [CrossRef]
- Zhao, P.; Guo, C.; Li, L. Exploring the effect of melamine pyrophosphate and aluminum hypophosphite on flame retardant wood flour/polypropylene composites. Constr. Build. Mater. 2018, 170, 193–199. [Google Scholar] [CrossRef]
- Fanglong, Z.; Qun, X.; Qianqian, F.; Rangtong, L.; Kejing, L. Influence of nano-silica on flame resistance behavior of intumescent flame retardant cellulosic textiles: Remarkable synergistic effect? Surf. Coatings Technol. 2016, 294, 90–94. [Google Scholar] [CrossRef]
- Ai, L.; Chen, S.; Zeng, J.; Yang, L.; Liu, P. Synergistic Flame Retardant Effect of an Intumescent Flame Retardant Containing Boron and Magnesium Hydroxide. ACS Omega 2019, 4, 3314–3321. [Google Scholar] [CrossRef] [PubMed]
- Zhou, F.; Zhang, T.; Zou, B.; Hu, W.; Wang, B.; Zhan, J.; Ma, C.; Hu, Y. Synthesis of a novel liquid phosphorus-containing flame retardant for flexible polyurethane foam: Combustion behaviors and thermal properties. Polym. Degrad. Stab. 2020, 171, 109029. [Google Scholar] [CrossRef]
- Fan, Q.; Han, G.; Cheng, W.; Tian, H.; Wang, D.; Xuan, L. Effect of intercalation structure of organo-modified montmorillonite/polylactic acid on wheat straw fiber/polylactic acid composites. Polymers 2018, 10, 896. [Google Scholar] [CrossRef] [PubMed]
- Gou, J.; Zhang, L.; Li, C. A new method combining modification of montmorillonite and crystal regulation to enhance the mechanical properties of polypropylene. Polym. Test. 2020, 82, 106236. [Google Scholar] [CrossRef]
- Xu, P.; Yu, Y.; Chang, M.; Chang, J. Preparation and characterization of bio-oil phenolic foam reinforced with montmorillonite. Polymers 2019, 11, 1471. [Google Scholar] [CrossRef]
- Zahedi, Y.; Fathi-Achachlouei, B.; Yousefi, A.R. Physical and mechanical properties of hybrid montmorillonite/zinc oxide reinforced carboxymethyl cellulose nanocomposites. Int. J. Biol. Macromol. 2018, 108, 863–873. [Google Scholar] [CrossRef]
- Xu, X.; Liu, F.; Jiang, L.; Zhu, J.Y.; Haagenson, D.; Wiesenborn, D.P. Cellulose Nanocrystals vs. Cellulose Nanofibrils: A Comparative Study on Their Microstructures and Effects as Polymer Reinforcing Agents. ACS Appl. Mater. Interfaces 2013, 5, 2999–3009. [Google Scholar] [CrossRef]
- Wulandari, W.T.; Rochliadi, A.; Arcana, I.M. Nanocellulose Prepared by Acid Hydrolysis of Isolated Cellulose from Sugarcane Bagasse. In Proceedings of the IOP Conference Series: Materials Science and Engineering, Solo, Indonesia, 8–9 September 2016; Volume 107, p. 012045. [Google Scholar]
- Gates, W.P.; Komadel, P.; Madejová, J.; Bujdák, J.; Stucki, J.W.; Kirkpatrick, R.J. Electronic and structural properties of reduced-charge montmorillonites. Appl. Clay Sci. 2000, 16, 257–271. [Google Scholar] [CrossRef]
- Hu, J.; Tan, X.; Ren, X.; Wang, X. Effect of humic acid on nickel(ii) sorption to Ca-montmorillonite by batch and EXAFS techniques study. Dalt. Trans. 2012, 41, 10803–10810. [Google Scholar] [CrossRef] [PubMed]
- Strankowski, M.; Włodarczyk, D.; Piszczyk, Ł.; Strankowska, J. Polyurethane Nanocomposites Containing Reduced Graphene Oxide, FTIR, Raman, and XRD Studies. J. Spectrosc. 2016, 2016. [Google Scholar] [CrossRef]
- Cichosz, S.; Masek, A. Thermal Behavior of Green Cellulose-Filled Thermoplastic Elastomer Polymer Blends. Molecules 2020, 25, 1279. [Google Scholar] [CrossRef] [PubMed]
- Cichosz, S.; Masek, A.; Rylski, A. Cellulose Modification for Improved Compatibility with the Polymer Matrix: Mechanical Characterization of the Composite Material. Materials 2020, 13, 5519. [Google Scholar] [CrossRef]
- Cichosz, S.; Masek, A. Cellulose fibers hydrophobization via a hybrid chemical modification. Polymers 2019, 11, 1174. [Google Scholar] [CrossRef] [PubMed]
- Bryśkiewicz, A.; Zieleniewska, M.; Przyjemska, K.; Chojnacki, P.; Ryszkowska, J. Modification of flexible polyurethane foams by the addition of natural origin fillers. Polym. Degrad. Stab. 2016, 132, 32–40. [Google Scholar] [CrossRef]
- Bueno-Ferrer, C.; Hablot, E.; Garrigós, M.D.C.; Bocchini, S.; Averous, L.; Jiménez, A. Relationship between Morphology, Properties and Degradation Parameters of Novative Biobased Thermoplastic Polyurethanes Obtained from Dimer Fatty Acids. Polym. Degrad. Stab. 2012, 97, 1964–1969. [Google Scholar] [CrossRef]
- Zheng, X.; Wang, G.; Xu, W. Roles of organically-modified montmorillonite and phosphorous flame retardant during the combustion of rigid polyurethane foam. Polym. Degrad. Stab. 2014, 101, 32–39. [Google Scholar] [CrossRef]
- Zieleniewska, M.; Leszczyński, M.K.; Szczepkowski, L.; Bryśkiewicz, A.; Krzyżowska, M.; Bień, K.; Ryszkowska, J. Development and applicational evaluation of the rigid polyurethane foam composites with egg shell waste. Polym. Degrad. Stab. 2016, 132, 78–86. [Google Scholar] [CrossRef]


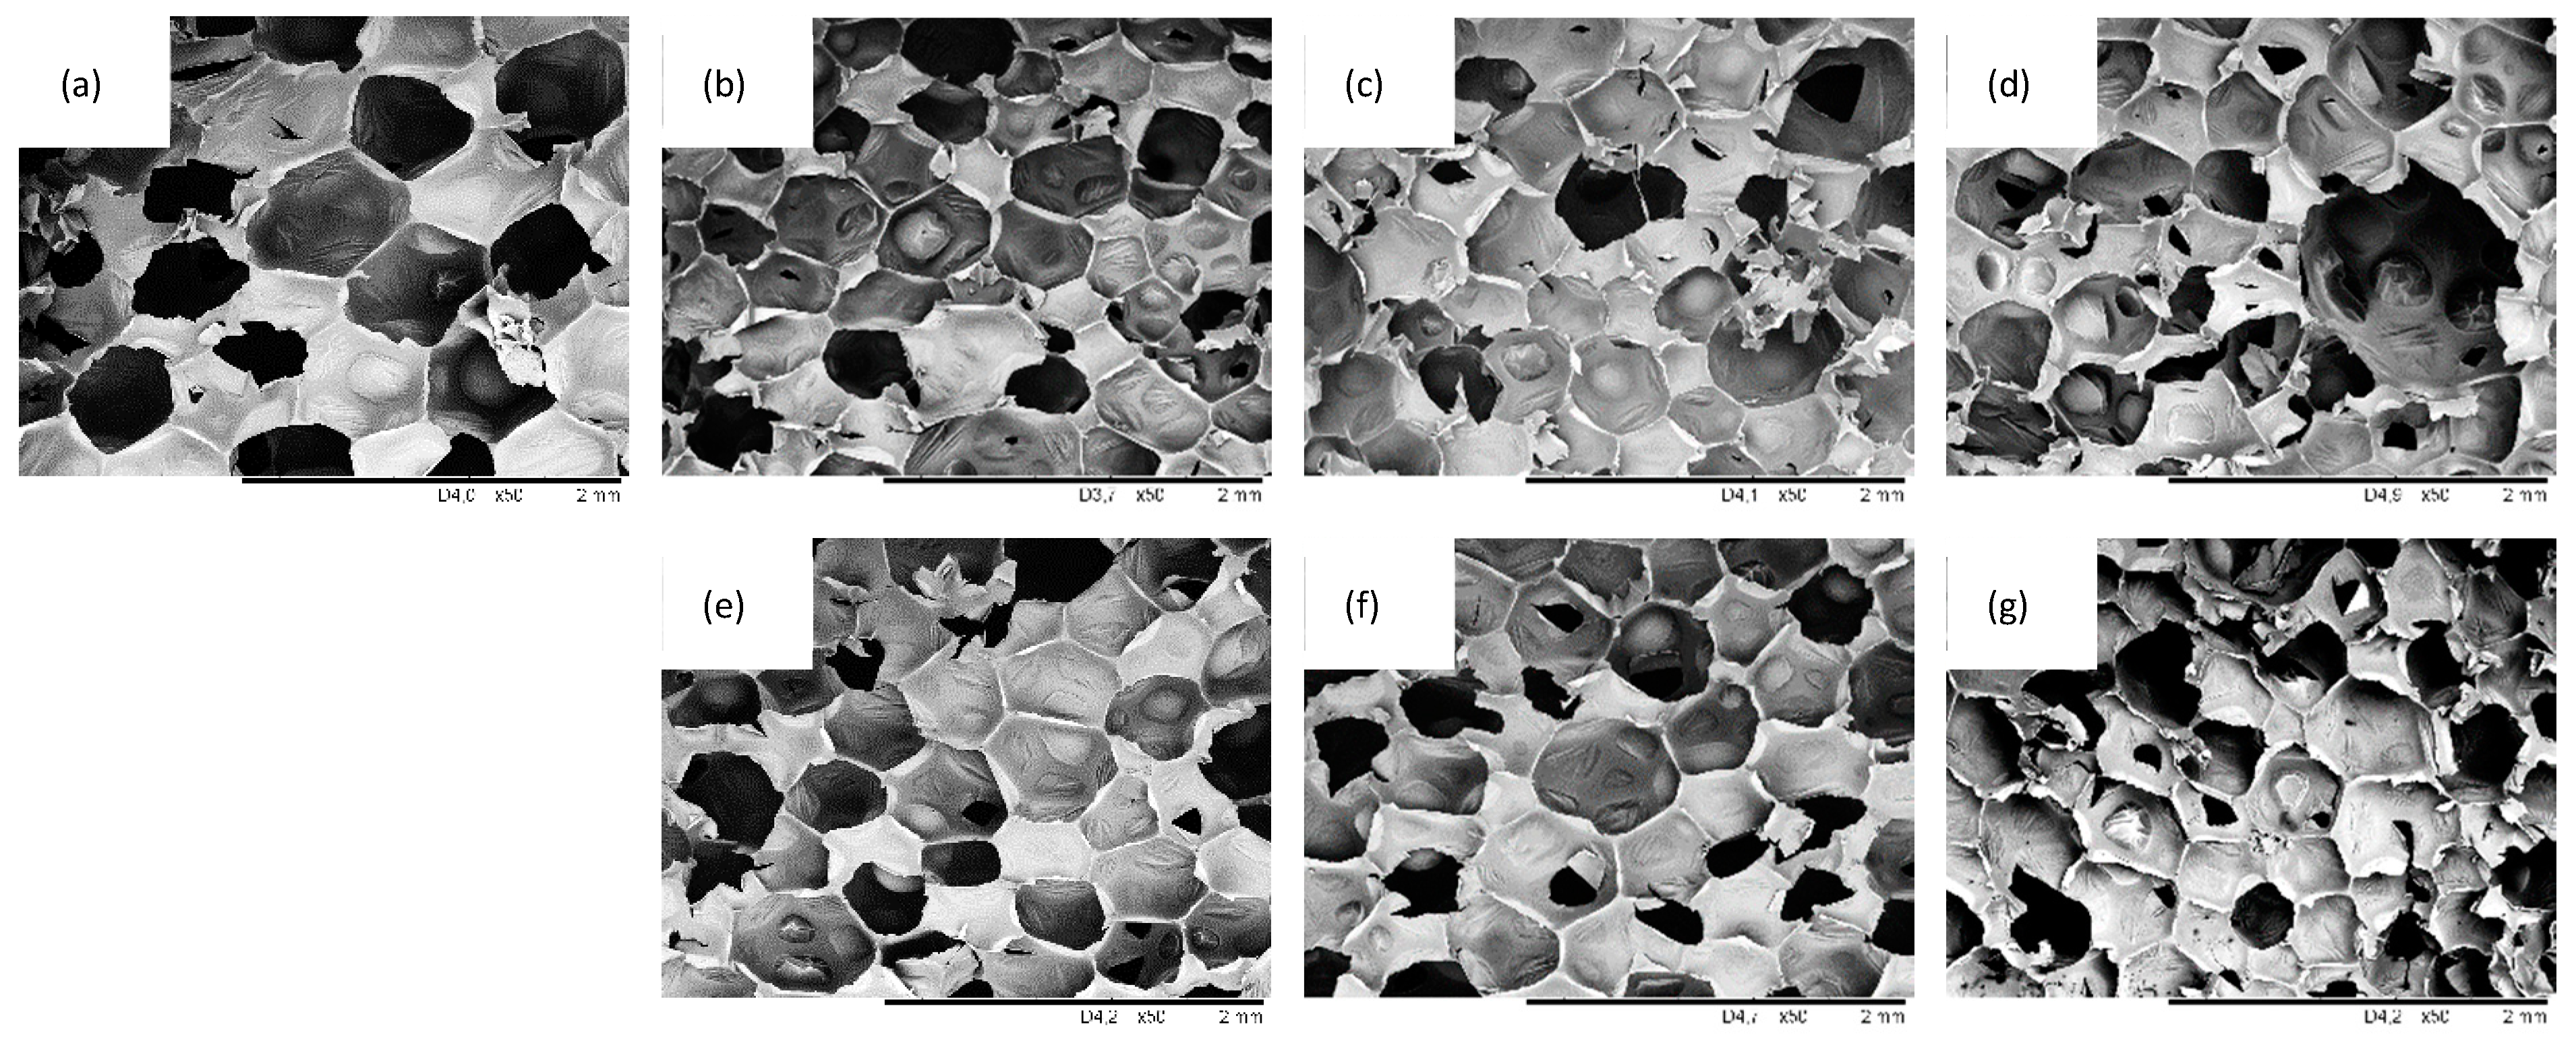
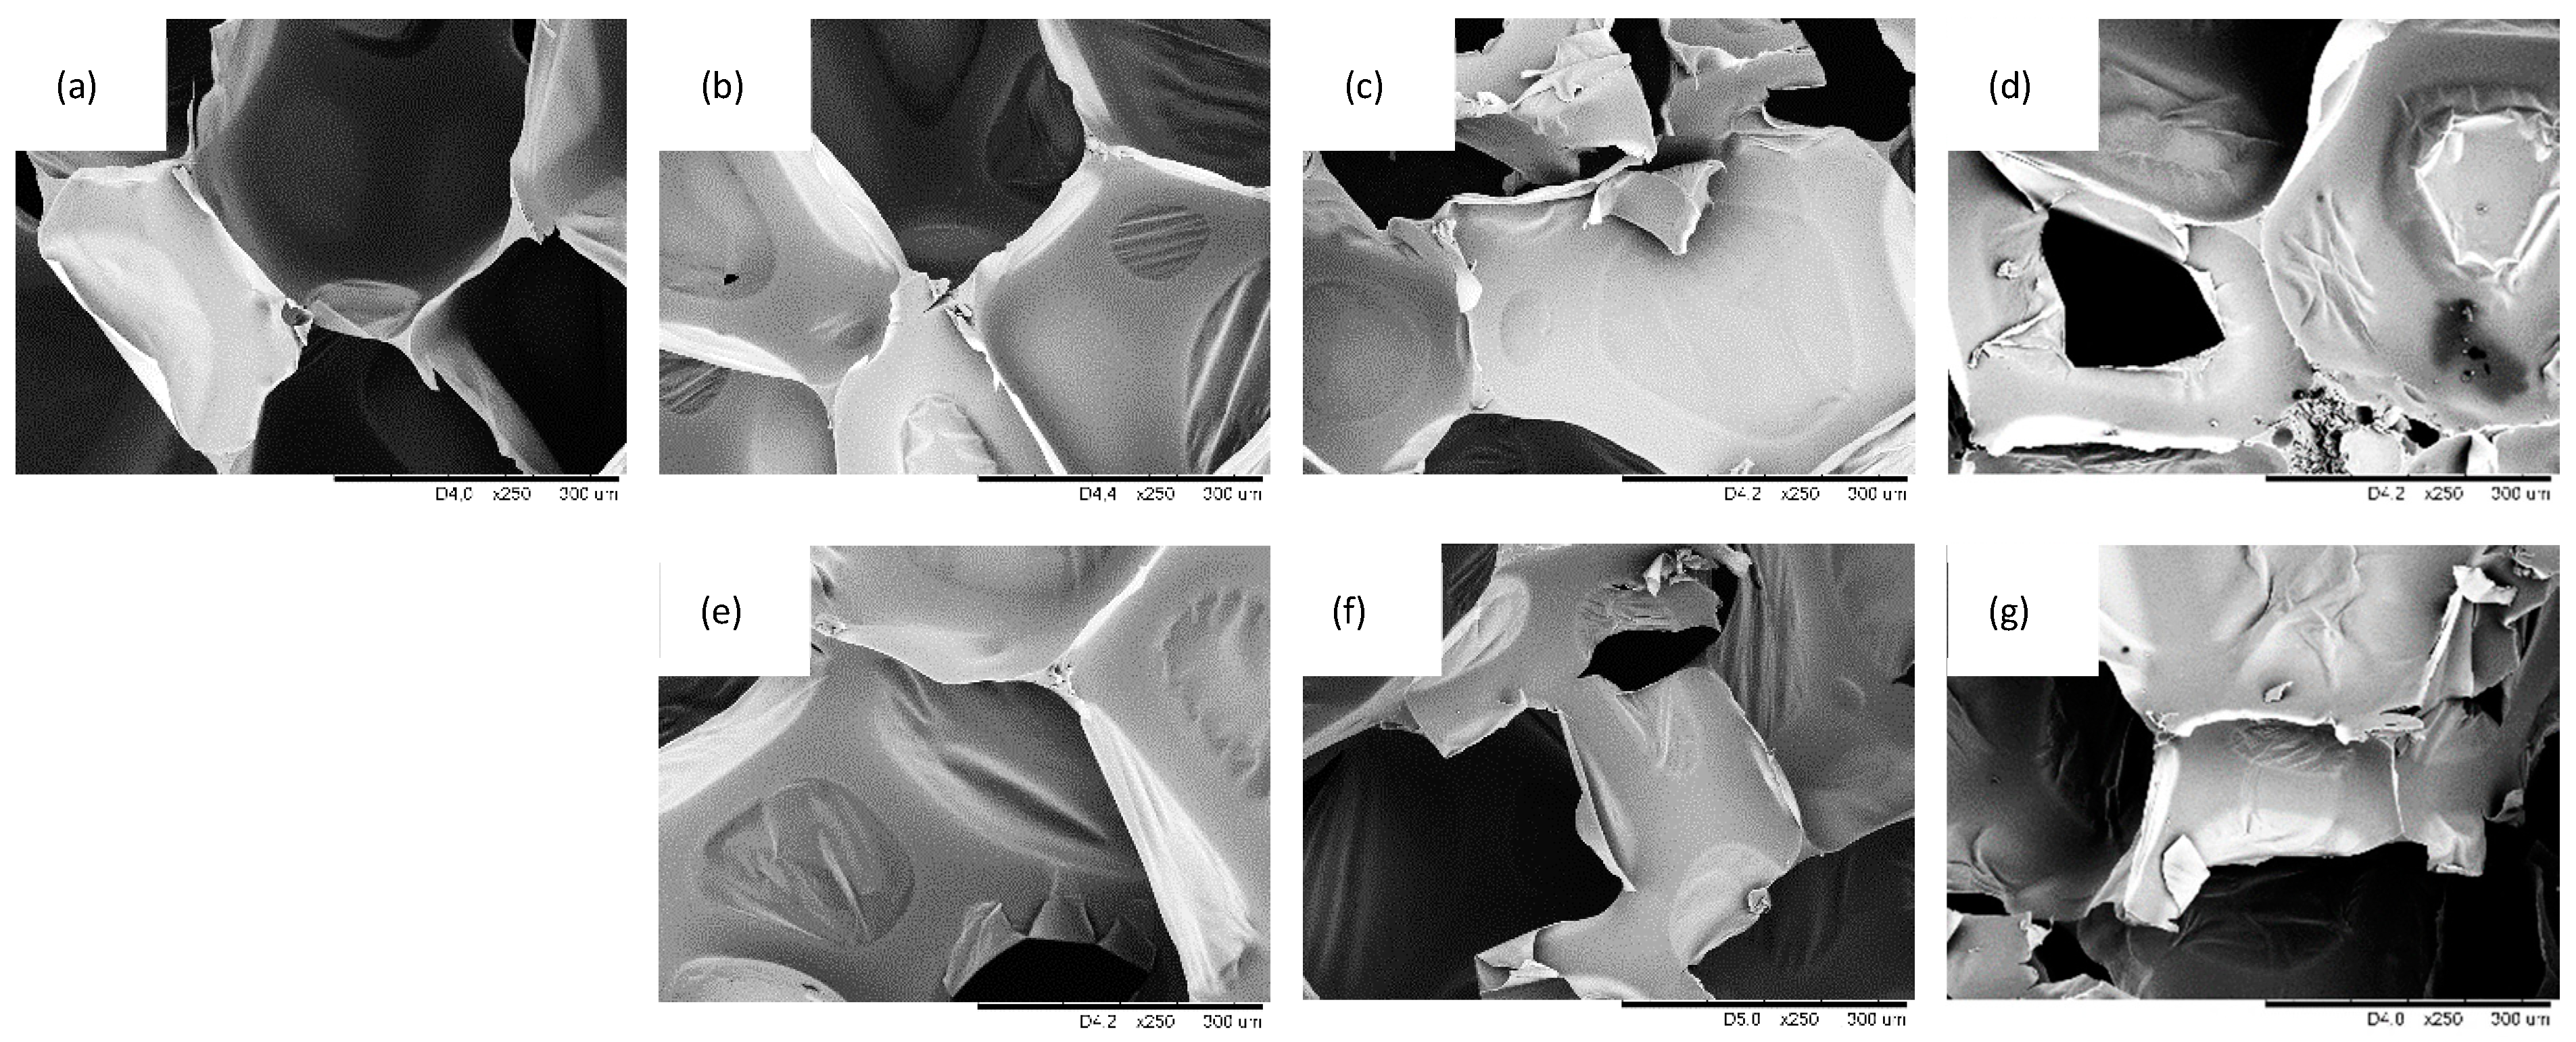
| Cell Size (µm) | Closed Cell Content (%) | Apparent Density (kg m∓3) | Thermal Conductivity (W m−1K−1) | |
|---|---|---|---|---|
| PUR-0 | 347 ± 6 | 87.4 ± 0.6 | 35.4 ± 0.8 | 0.025 |
| PUR-SO-1 | 338 ± 6 | 87.0 ± 0.5 | 36.2 ± 0.9 | 0.026 |
| PUR-SO-2 | 296 ± 5 | 86.1 ± 0.7 | 36.9 ± 0.6 | 0.028 |
| PUR-SO-5 | 296 ± 4 | 83.0 ± 0.9 | 37.6 ± 0.6 | 0.035 |
| PUR-SO/MMT-1 | 310 ± 5 | 88.2 ± 0.6 | 35.7 ± 0.8 | 0.025 |
| PUR-SO/MMT-2 | 289 ± 6 | 88.0 ± 0.7 | 36.1 ± 0.7 | 0.027 |
| PUR-SO/MMT-5 | 285 ± 7 | 86.5 ± 0.7 | 37.0 ± 0.8 | 0.030 |
| Sample | T5% (°C) | T10% (°C) | T50% (°C) | Char Residue (at 600 °C) | Tmax (°C) | Vmax (%/min) |
|---|---|---|---|---|---|---|
| SO | 101 | 195 | 355 | 12.2 | 309 | 0.0025 |
| SO/MMT | 95 | 223 | 501 | 40.1 | 307 | 0.0039 |
| PUR-O | 207 | 241 | 397 | 27.6 | 315 | 0.0051 |
| PUR-SO-1 | 191 | 231 | 425 | 29.6 | 313 | 0.0051 |
| PUR-SO-2 | 189 | 233 | 423 | 26.4 | 313 | 0.0050 |
| PUR-SO-5 | 195 | 239 | 419 | 24.2 | 315 | 0.0045 |
| PUR-SO/MMT-1 | 197 | 239 | 443 | 27.9 | 317 | 0.0048 |
| PUR-SO/MMT-2 | 205 | 241 | 449 | 29.1 | 315 | 0.0048 |
| PUR-SO/MMT-5 | 203 | 235 | 457 | 31.0 | 317 | 0.0049 |
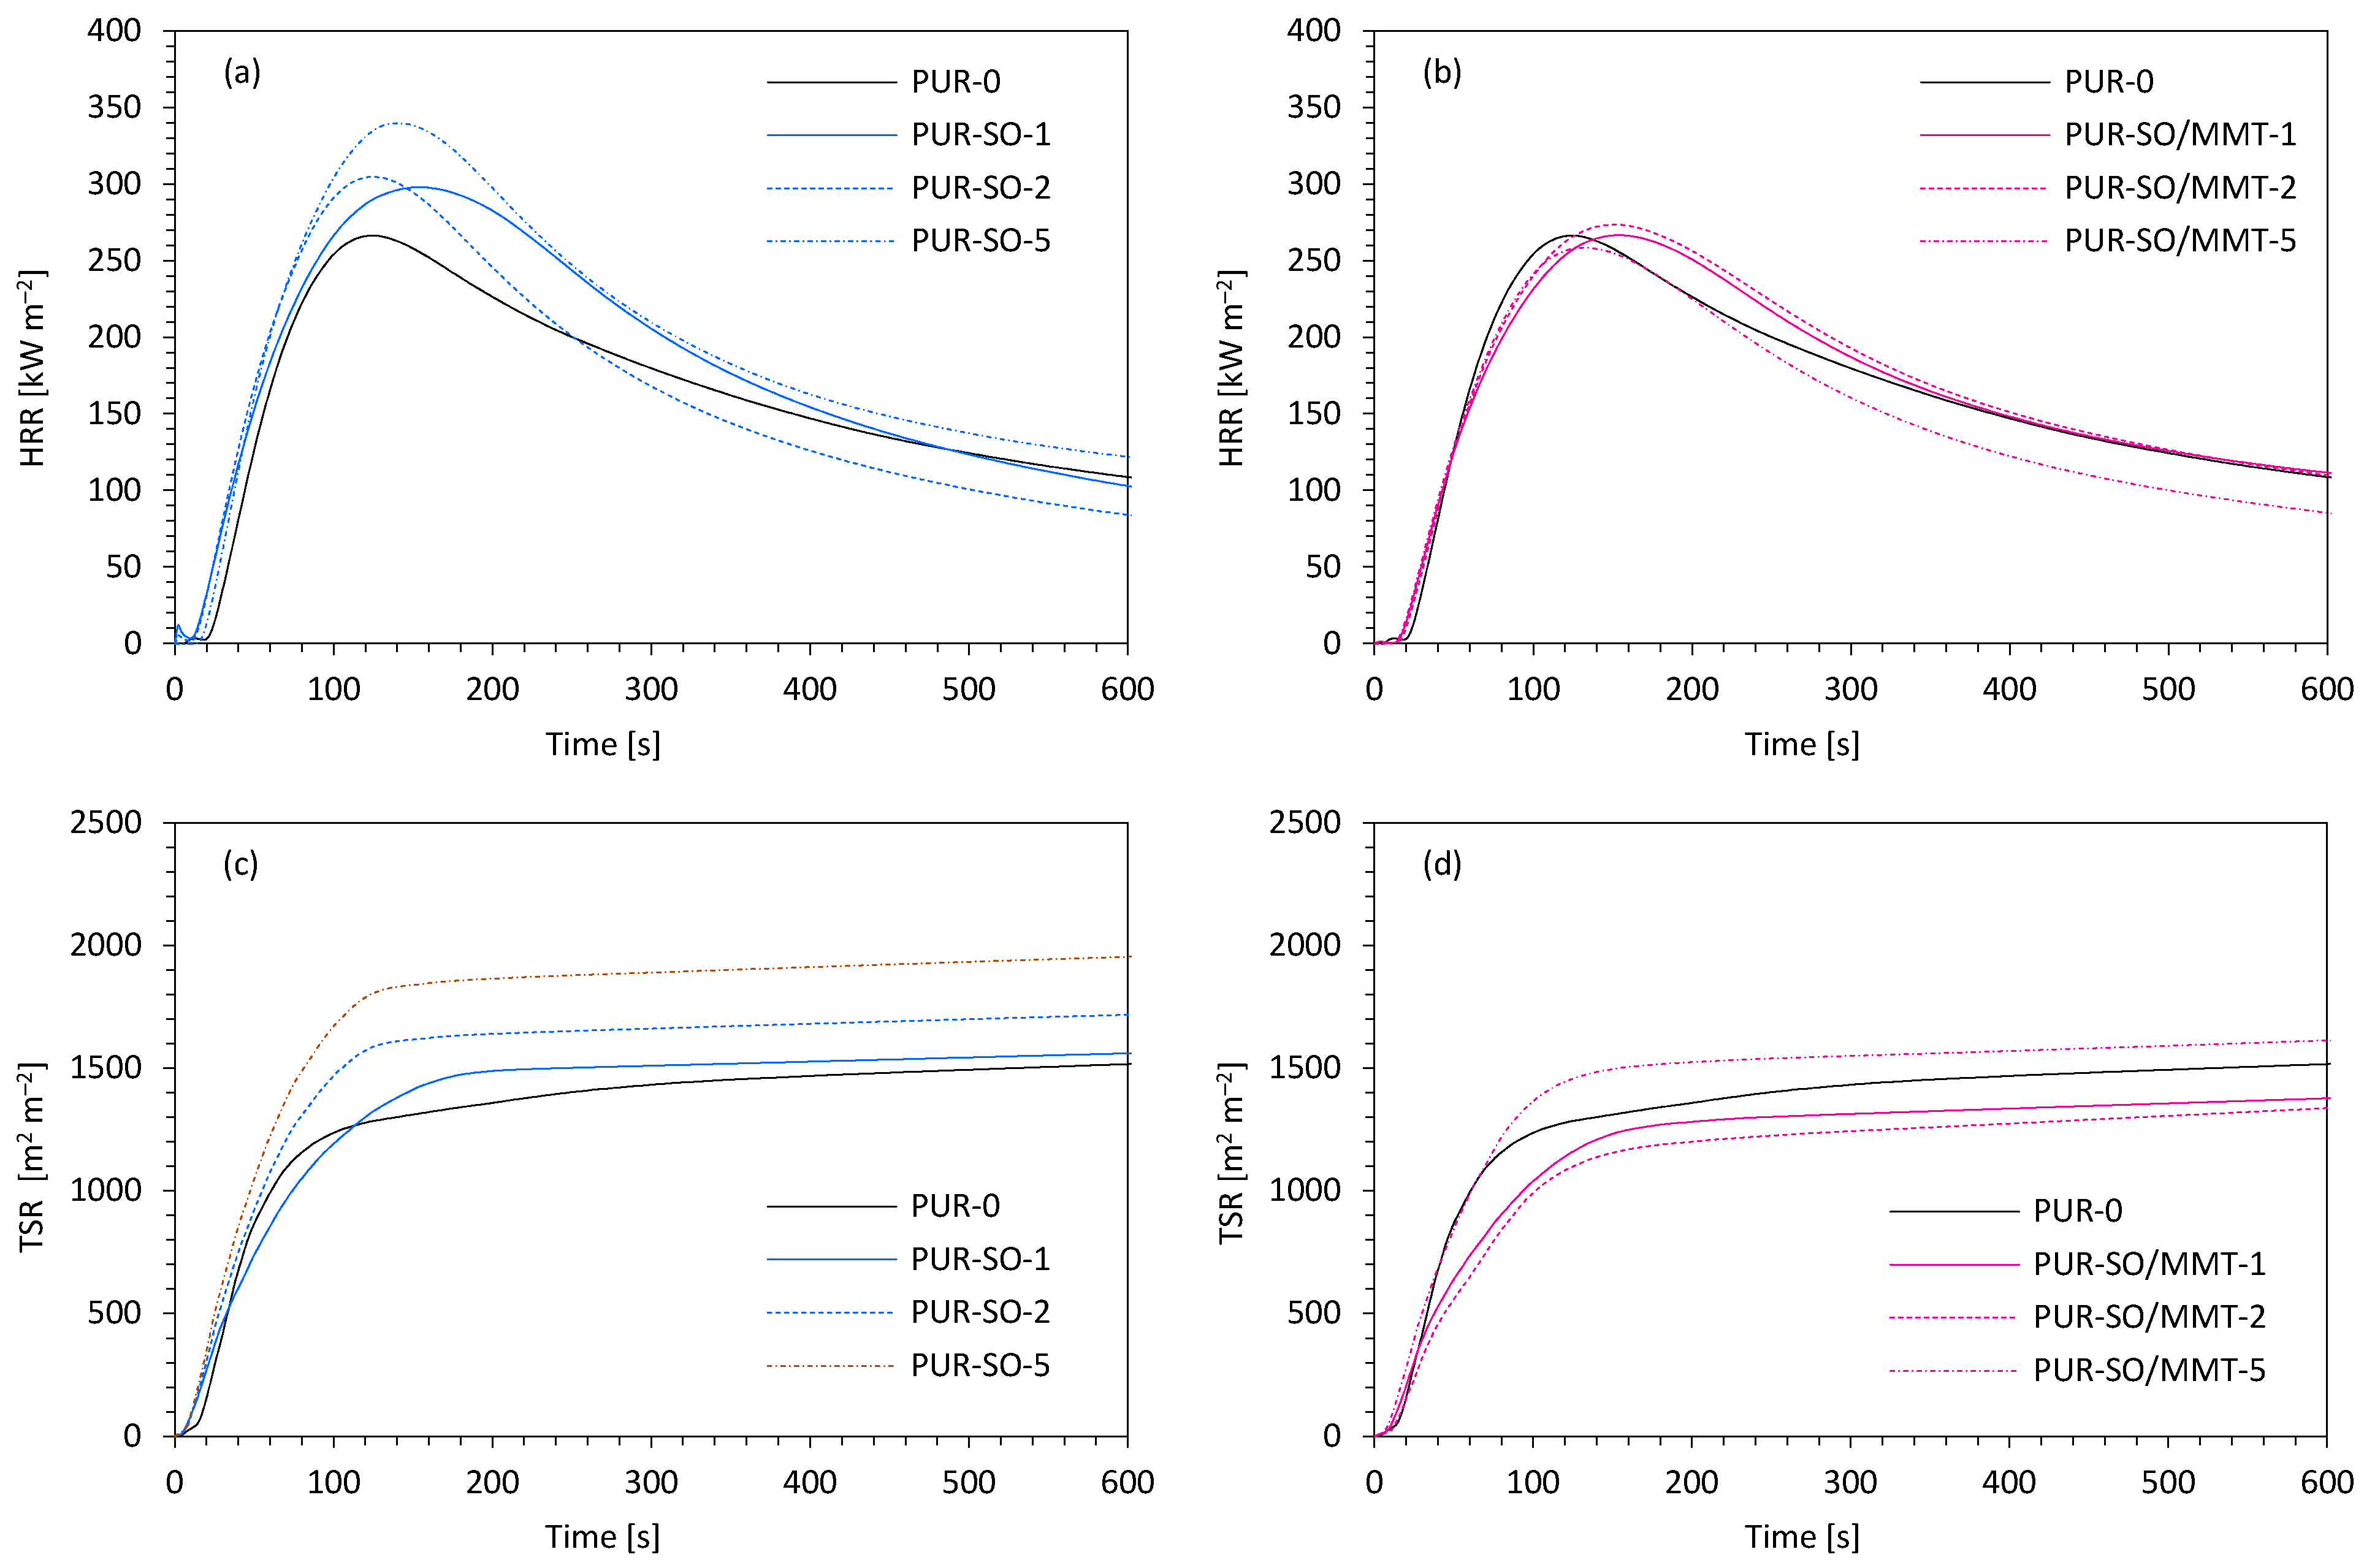
| Sample | IT (s) | pHRR (kW m−2) | TSR (m2 m−2) | THR (MJ m−2) | COY (kg kg−1) | CO2Y (kg kg−1) | COY/CO2Y (-) | LOI (%) |
|---|---|---|---|---|---|---|---|---|
| PUR-0 | 4 | 265 | 1490 | 21.7 | 0.272 | 0.266 | 1.02 | 20.4 |
| PUR-SO-1 | 4 | 280 | 1550 | 21.9 | 0.370 | 0.311 | 1.19 | 20.2 |
| PUR-SO-2 | 3 | 292 | 1650 | 22.4 | 0.376 | 0.342 | 1.10 | 20.1 |
| PUR-SO-5 | 3 | 340 | 1890 | 23.6 | 0.434 | 0.363 | 1.20 | 19.5 |
| PUR-SO/MMT-1 | 5 | 254 | 1380 | 21.1 | 0.312 | 0.260 | 1.20 | 21.1 |
| PUR-SO/MMT-2 | 4 | 250 | 1330 | 21.0 | 0.334 | 0.299 | 1.12 | 21.3 |
| PUR-SO/MMT-5 | 4 | 272 | 1550 | 21.9 | 0.356 | 0.313 | 1.14 | 20.8 |
| System | Compound | Content (wt.% to polyol) | |||
|---|---|---|---|---|---|
| Polyol system | Polyether polyol (Stepanpol PS2352) | 100 | |||
| Blowing agent (pentane/cyclopentane, 1:1, v/v) | 11 | ||||
| Surfactant (Tegostab B8513) | 2.5 | ||||
| Catalyst (Kosmos 33) | 6 | ||||
| Catalyst (Kosmos 75) | 0.8 | ||||
| Water | 0.5 | ||||
| unmodified SO filler | 0 (PUR-0) | 1 (PUR-SO-1) | 2 (PUR-SO-2) | 5 (PUR-SO-5) | |
| MMT-modified SO filler | 0 (PUR-0) | 1 (PUR-SO/MMT-1) | 2 (PUR-SO/MMT-2) | 5 (PUR-SO/MMT-5) | |
| Isocyanate system | polymeric diphenyl methane diisocyanate, pMDI (Purocyn B) | 160 | |||
Publisher’s Note: MDPI stays neutral with regard to jurisdictional claims in published maps and institutional affiliations. |
© 2021 by the authors. Licensee MDPI, Basel, Switzerland. This article is an open access article distributed under the terms and conditions of the Creative Commons Attribution (CC BY) license (https://creativecommons.org/licenses/by/4.0/).
Share and Cite
Członka, S.; Kairytė, A.; Miedzińska, K.; Strąkowska, A.; Adamus-Włodarczyk, A. Mechanically Strong Polyurethane Composites Reinforced with Montmorillonite-Modified Sage Filler (Salvia officinalis L.). Int. J. Mol. Sci. 2021, 22, 3744. https://doi.org/10.3390/ijms22073744
Członka S, Kairytė A, Miedzińska K, Strąkowska A, Adamus-Włodarczyk A. Mechanically Strong Polyurethane Composites Reinforced with Montmorillonite-Modified Sage Filler (Salvia officinalis L.). International Journal of Molecular Sciences. 2021; 22(7):3744. https://doi.org/10.3390/ijms22073744
Chicago/Turabian StyleCzłonka, Sylwia, Agnė Kairytė, Karolina Miedzińska, Anna Strąkowska, and Agnieszka Adamus-Włodarczyk. 2021. "Mechanically Strong Polyurethane Composites Reinforced with Montmorillonite-Modified Sage Filler (Salvia officinalis L.)" International Journal of Molecular Sciences 22, no. 7: 3744. https://doi.org/10.3390/ijms22073744
APA StyleCzłonka, S., Kairytė, A., Miedzińska, K., Strąkowska, A., & Adamus-Włodarczyk, A. (2021). Mechanically Strong Polyurethane Composites Reinforced with Montmorillonite-Modified Sage Filler (Salvia officinalis L.). International Journal of Molecular Sciences, 22(7), 3744. https://doi.org/10.3390/ijms22073744