
Palmitoylethanolamide Modulation of Microglia Activation: Characterization of Mechanisms of Action and Implication for Its Neuroprotective Effects

 , , ,
, , ,  ,
,  , , ,
, , ,  , , , and
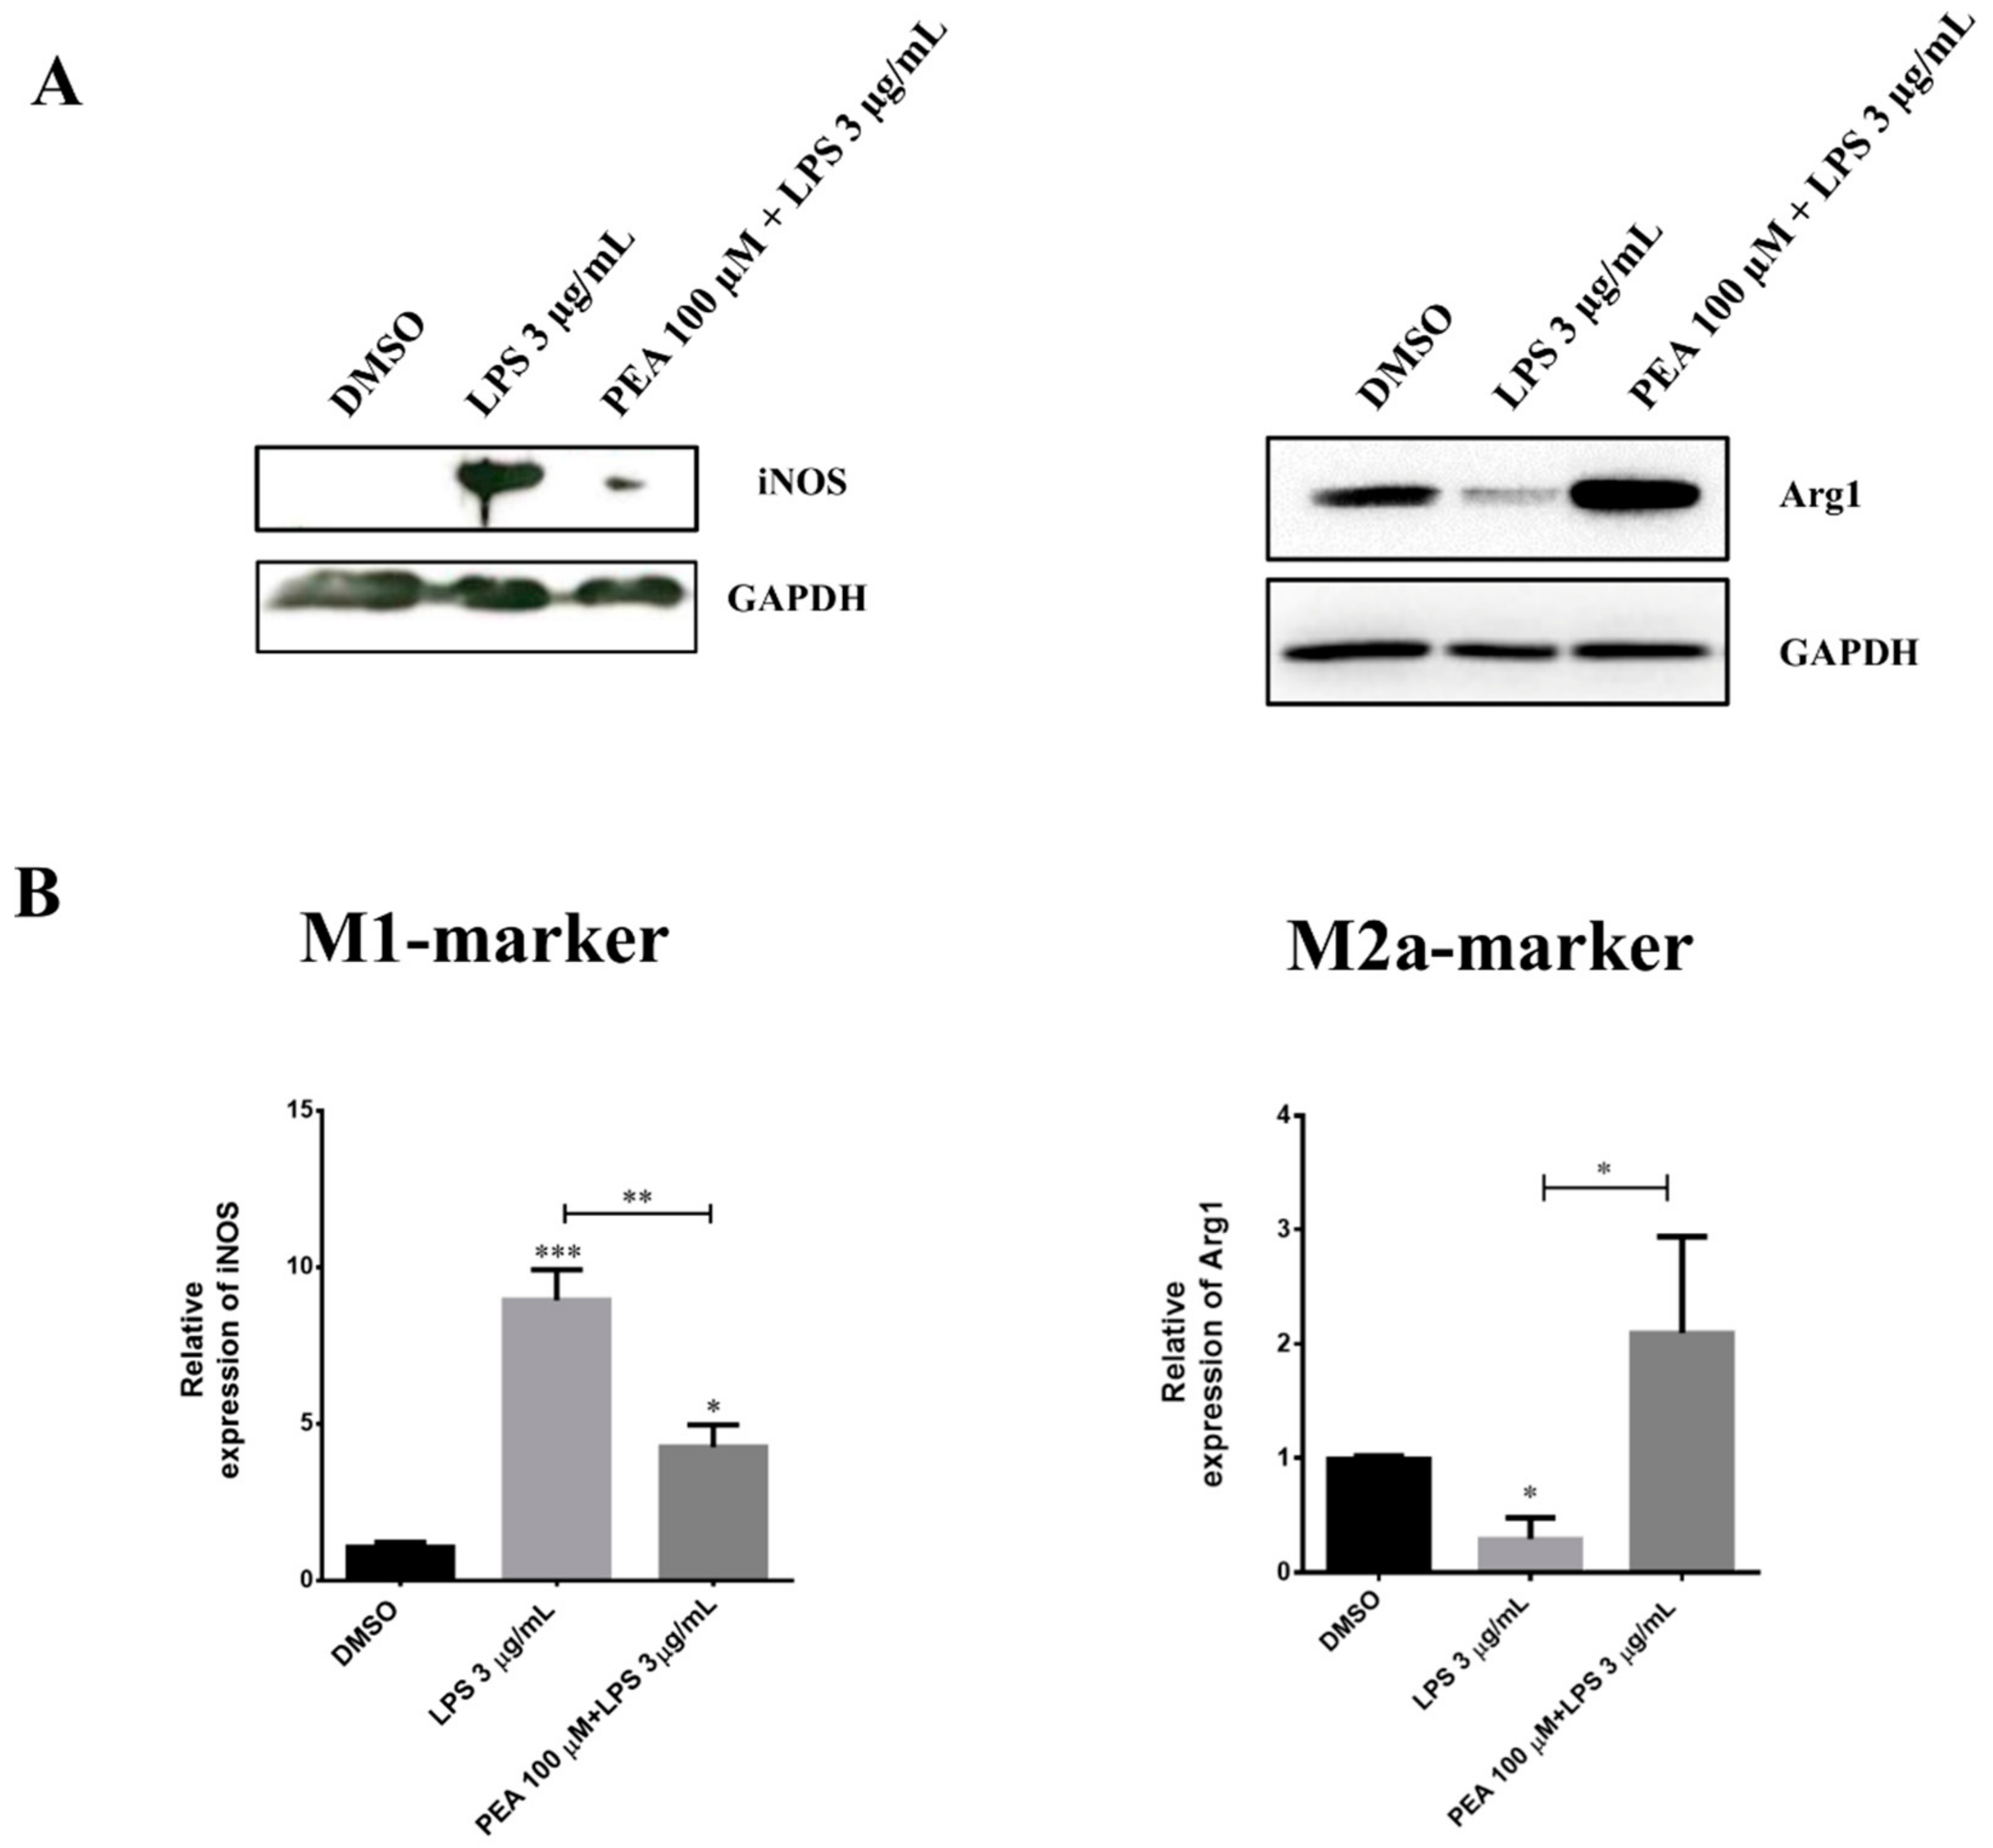
Abstract
1. Introduction
2. Results
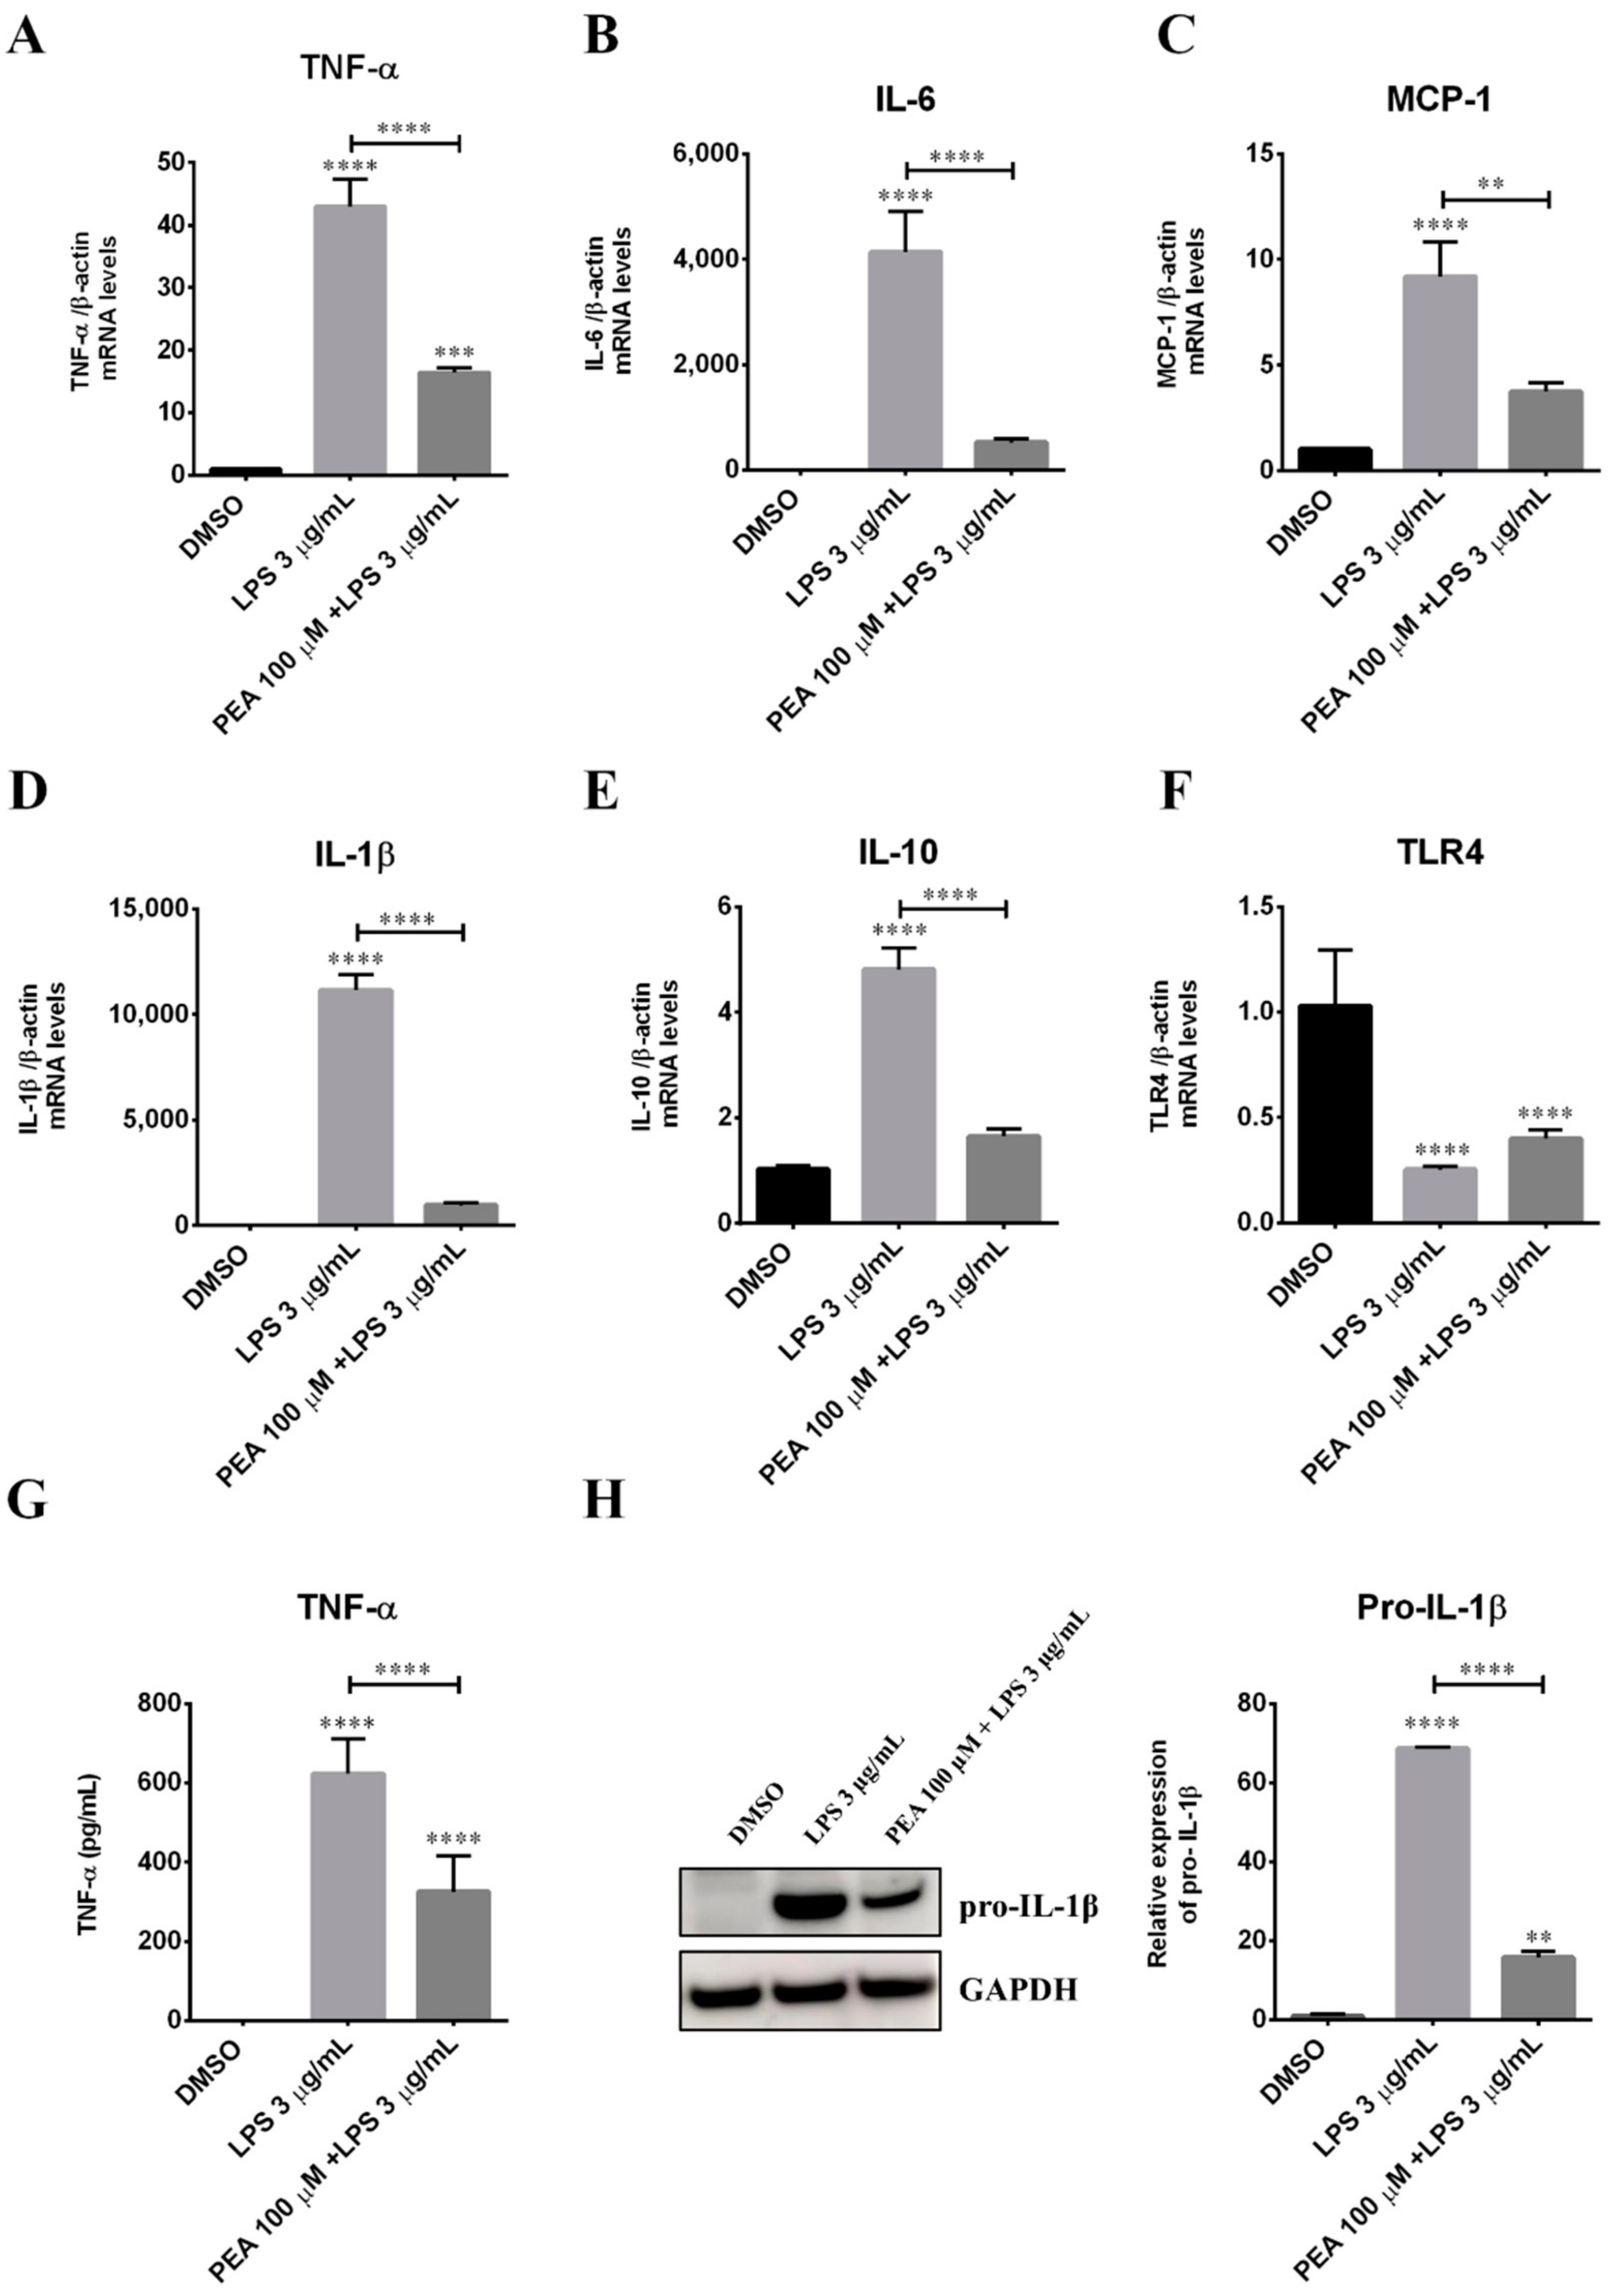
2.1. PEA Pre-Treatment Counteracts M1 Microglia Polarization Induced by LPS Treatment
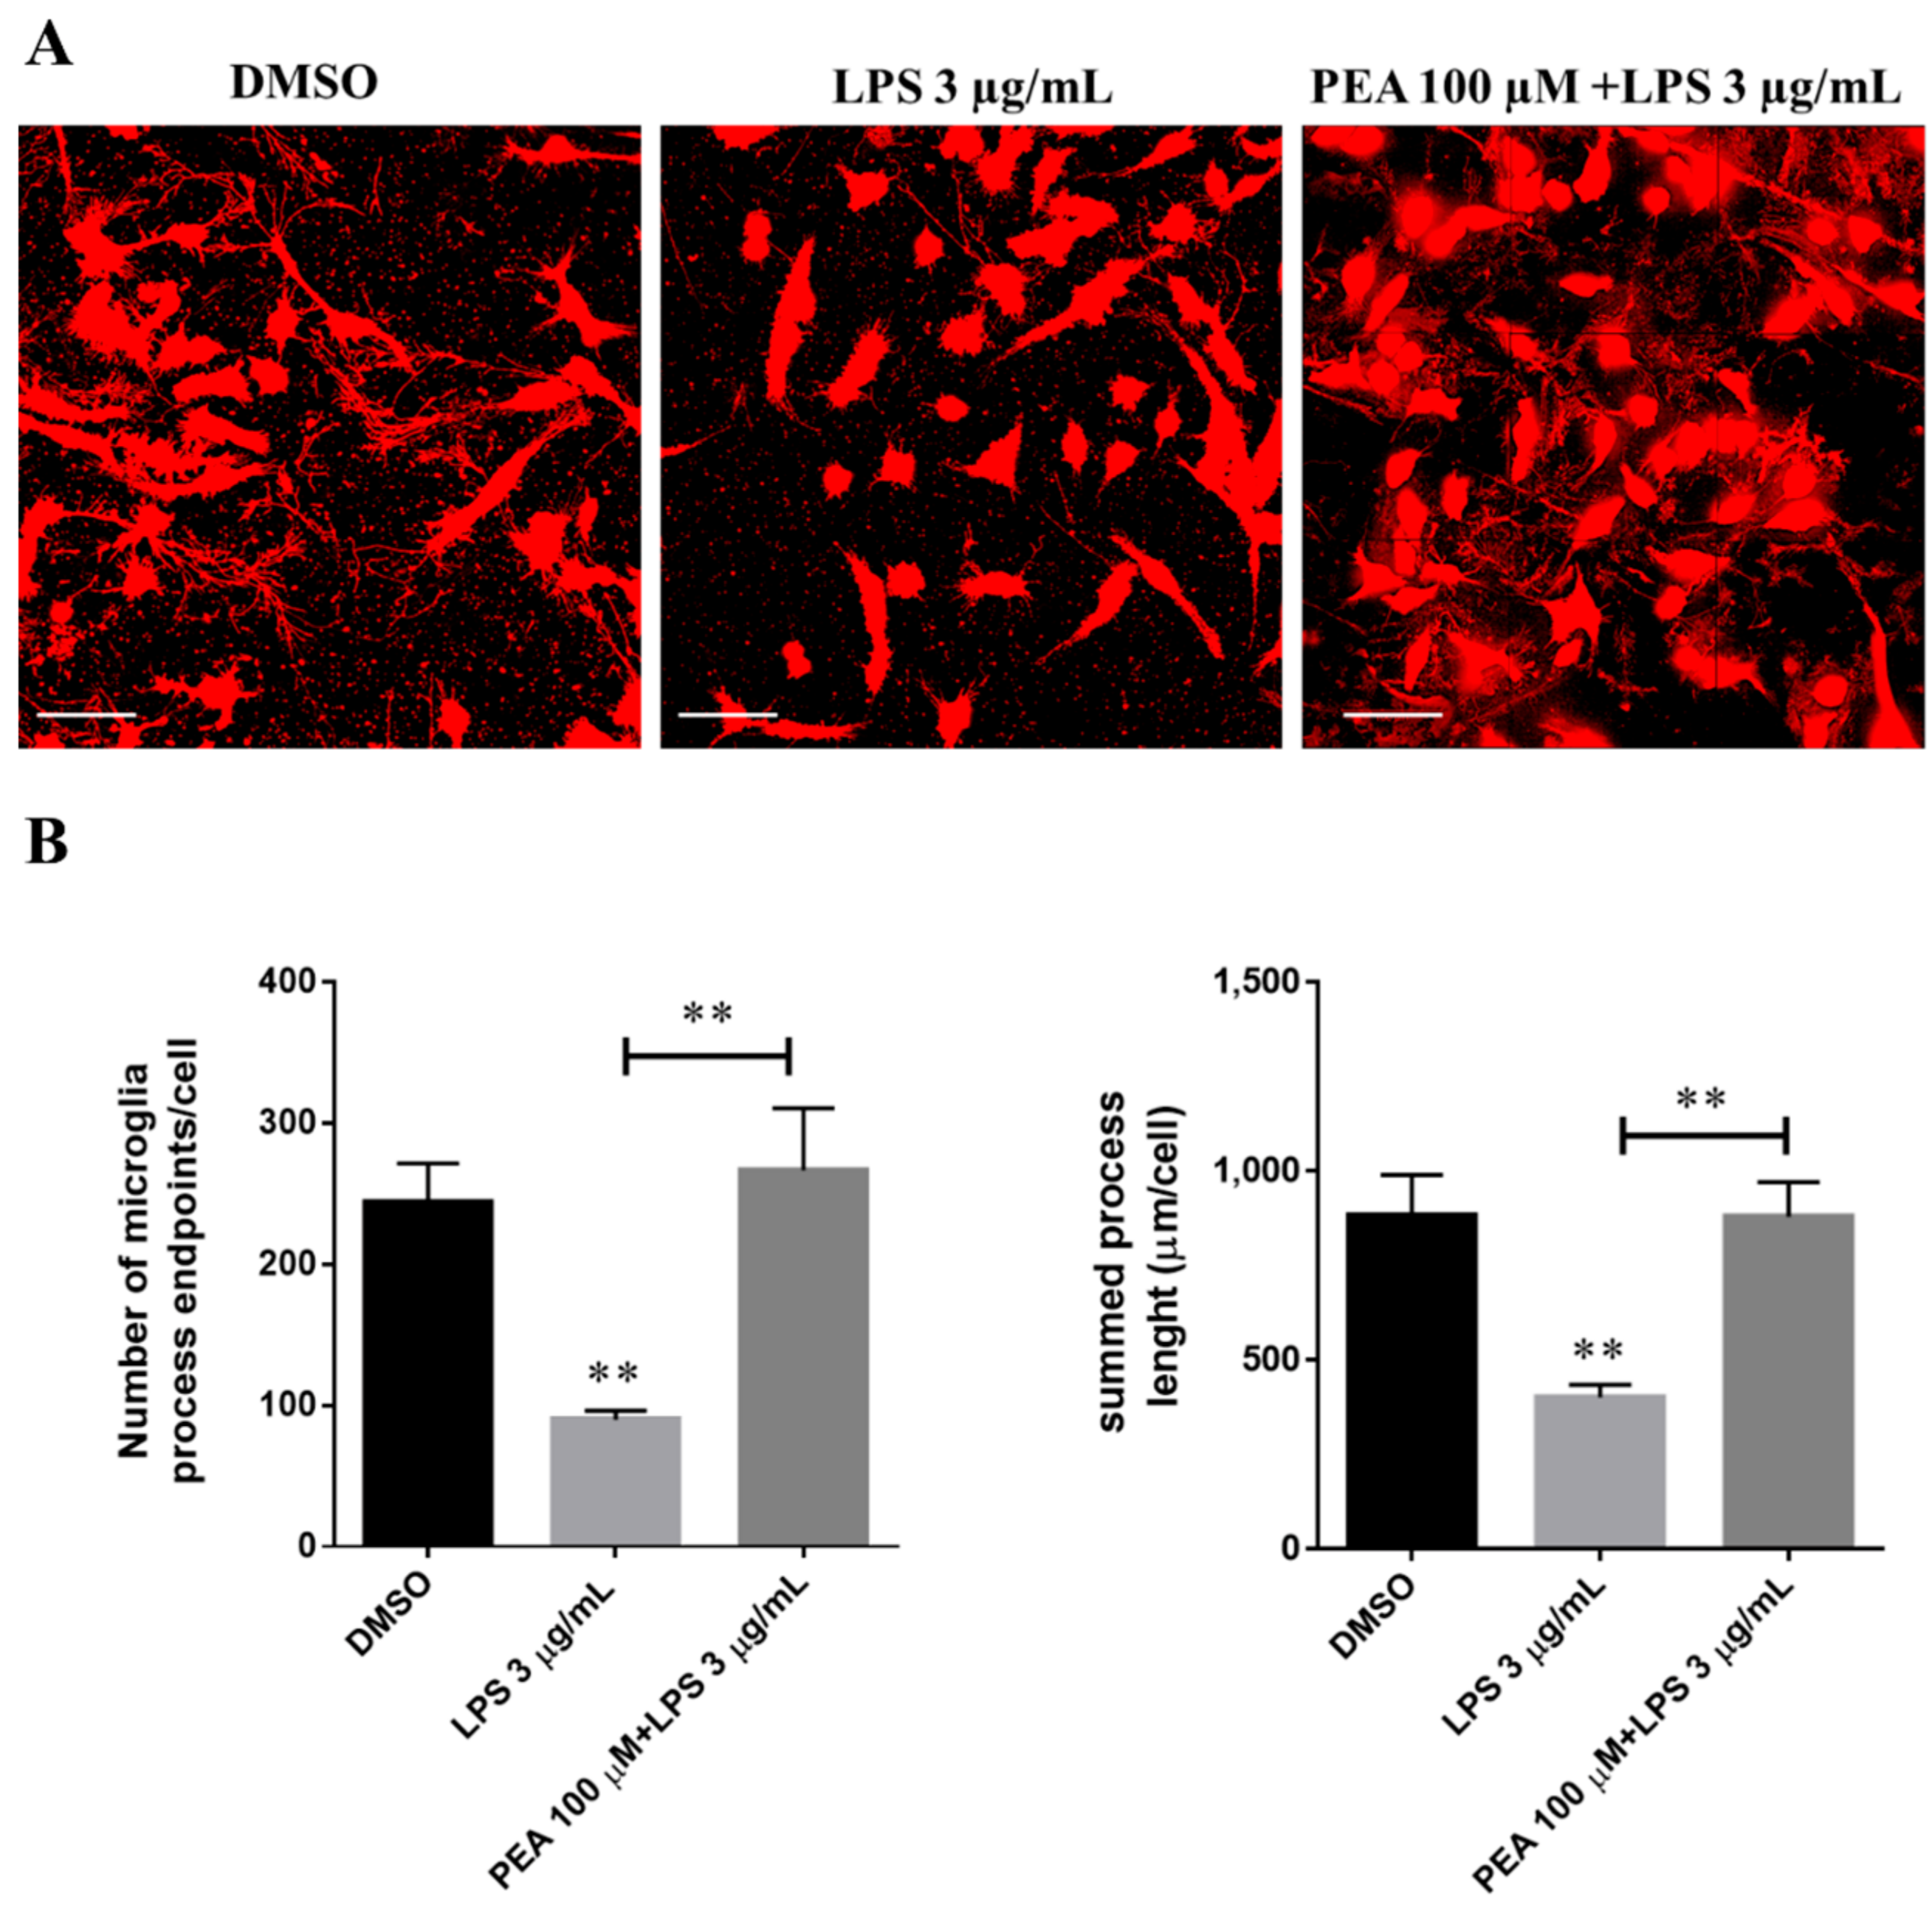
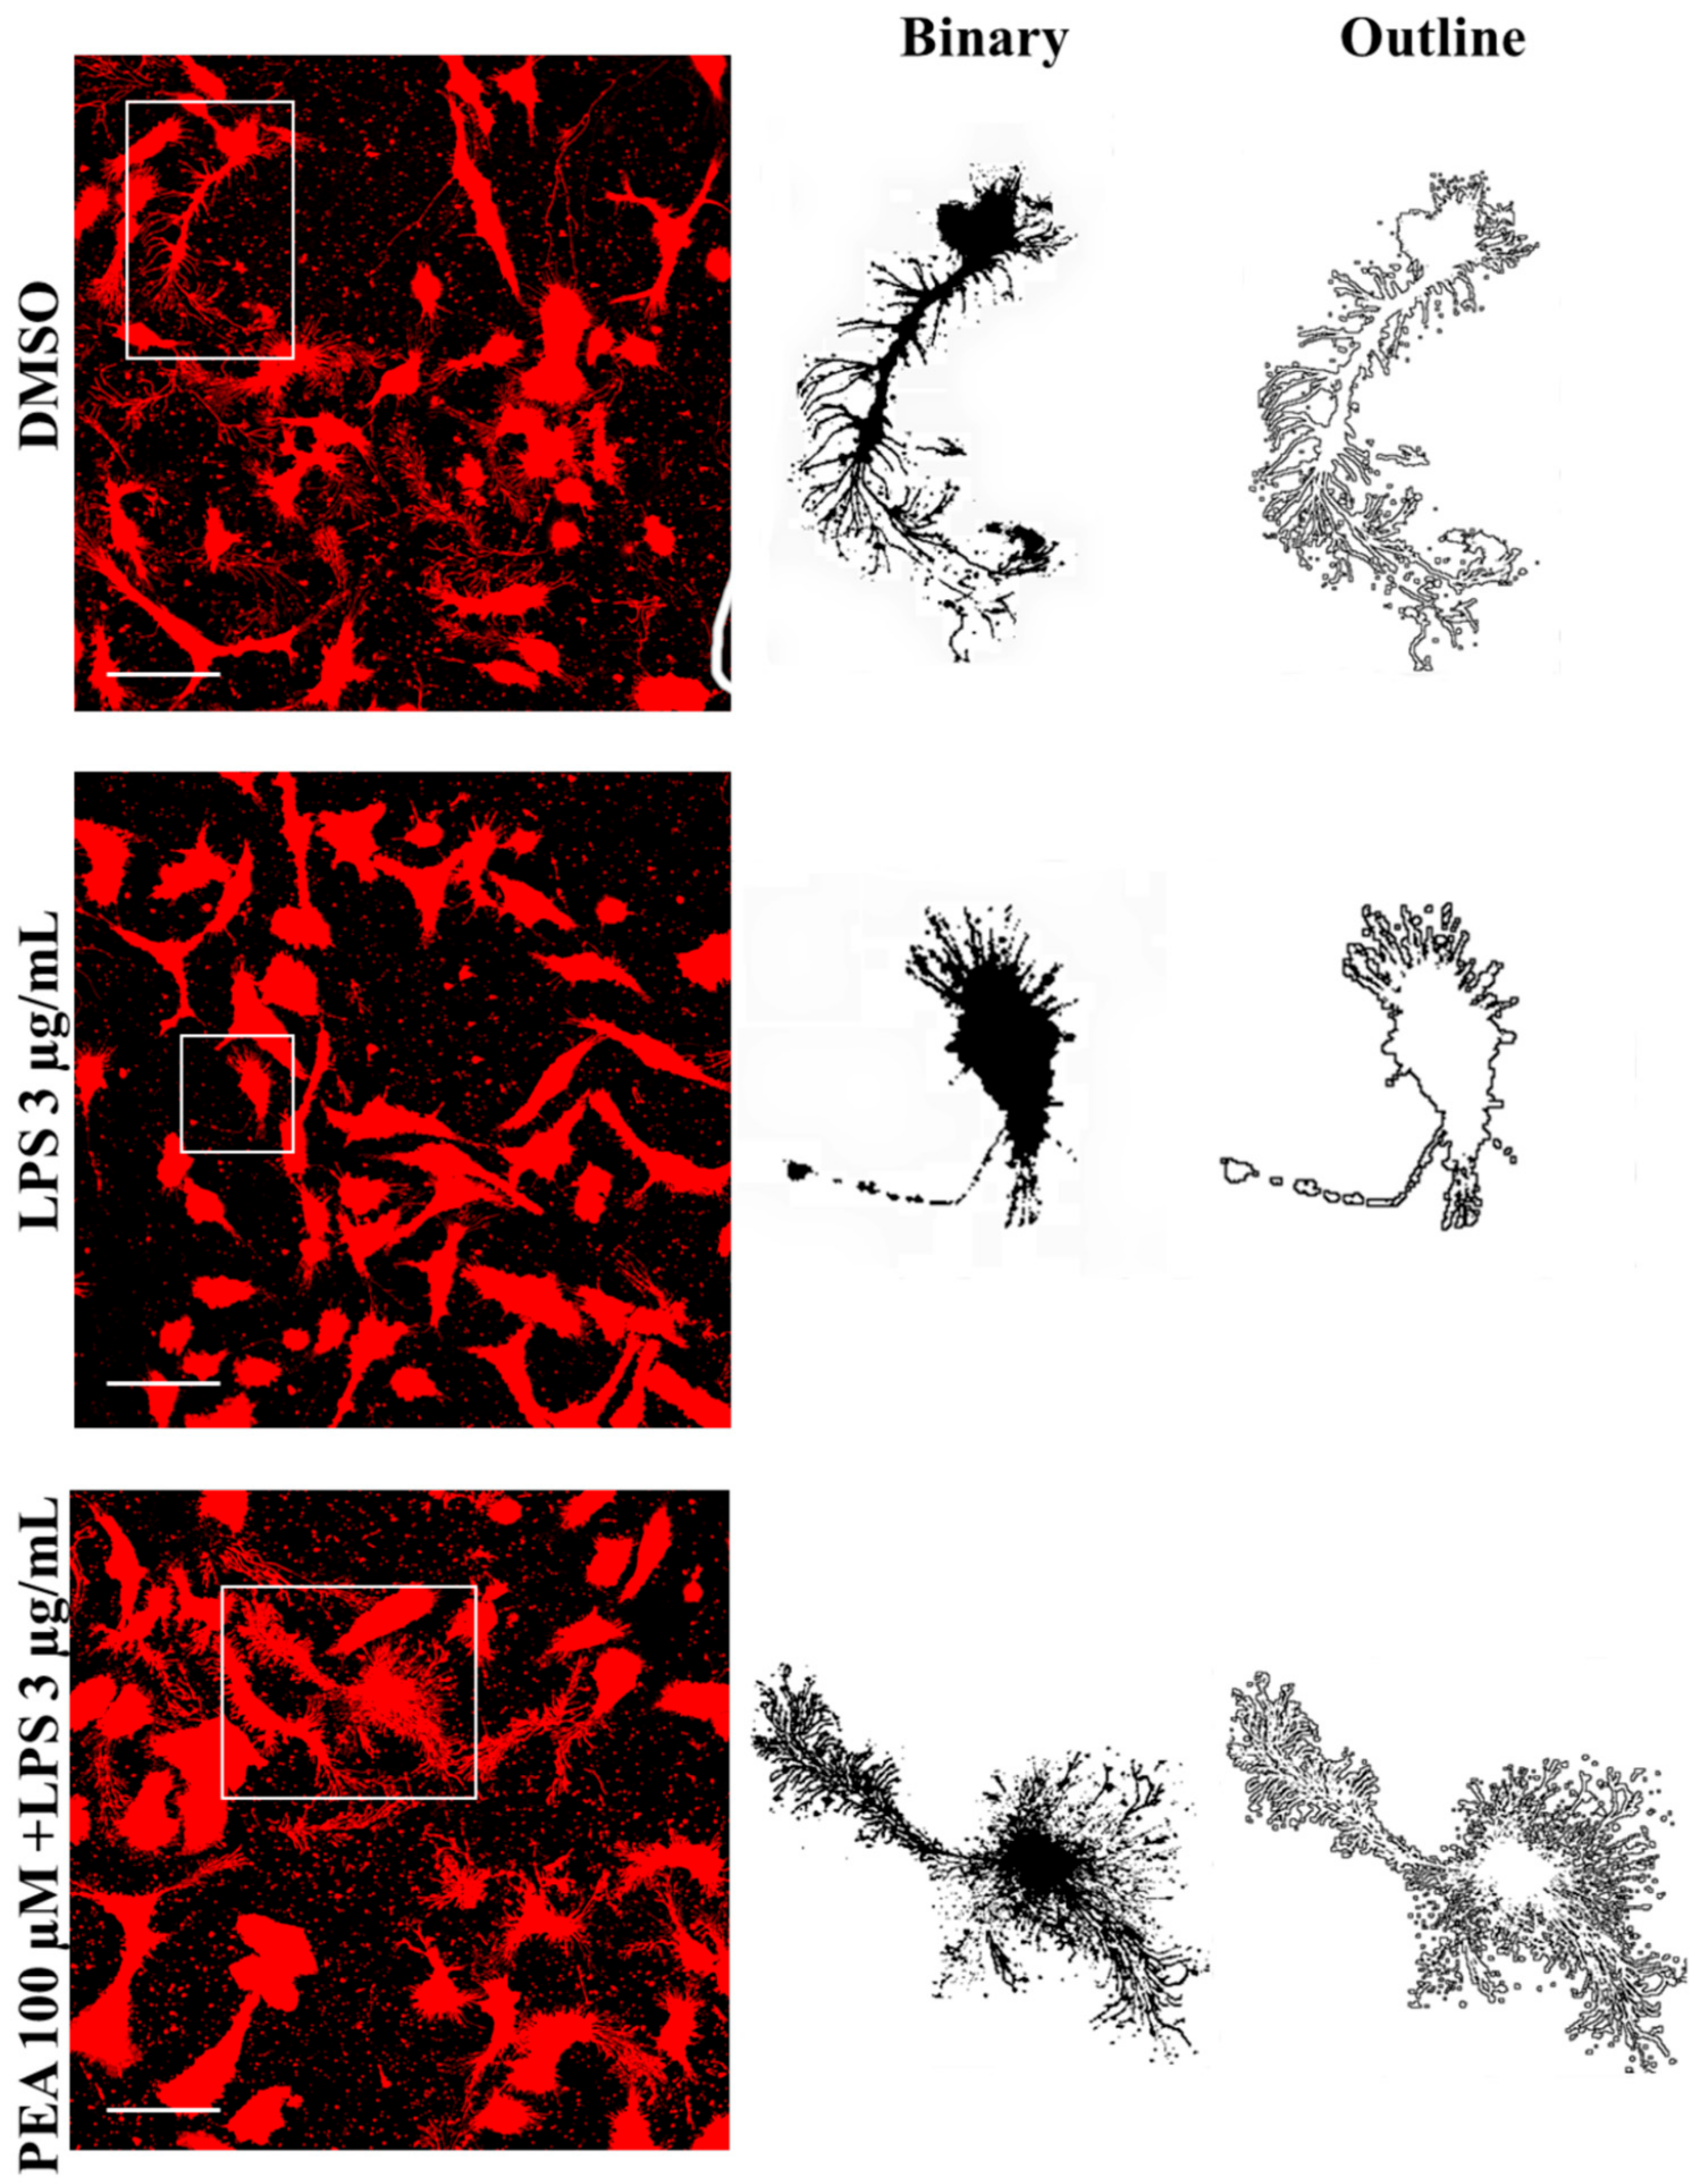
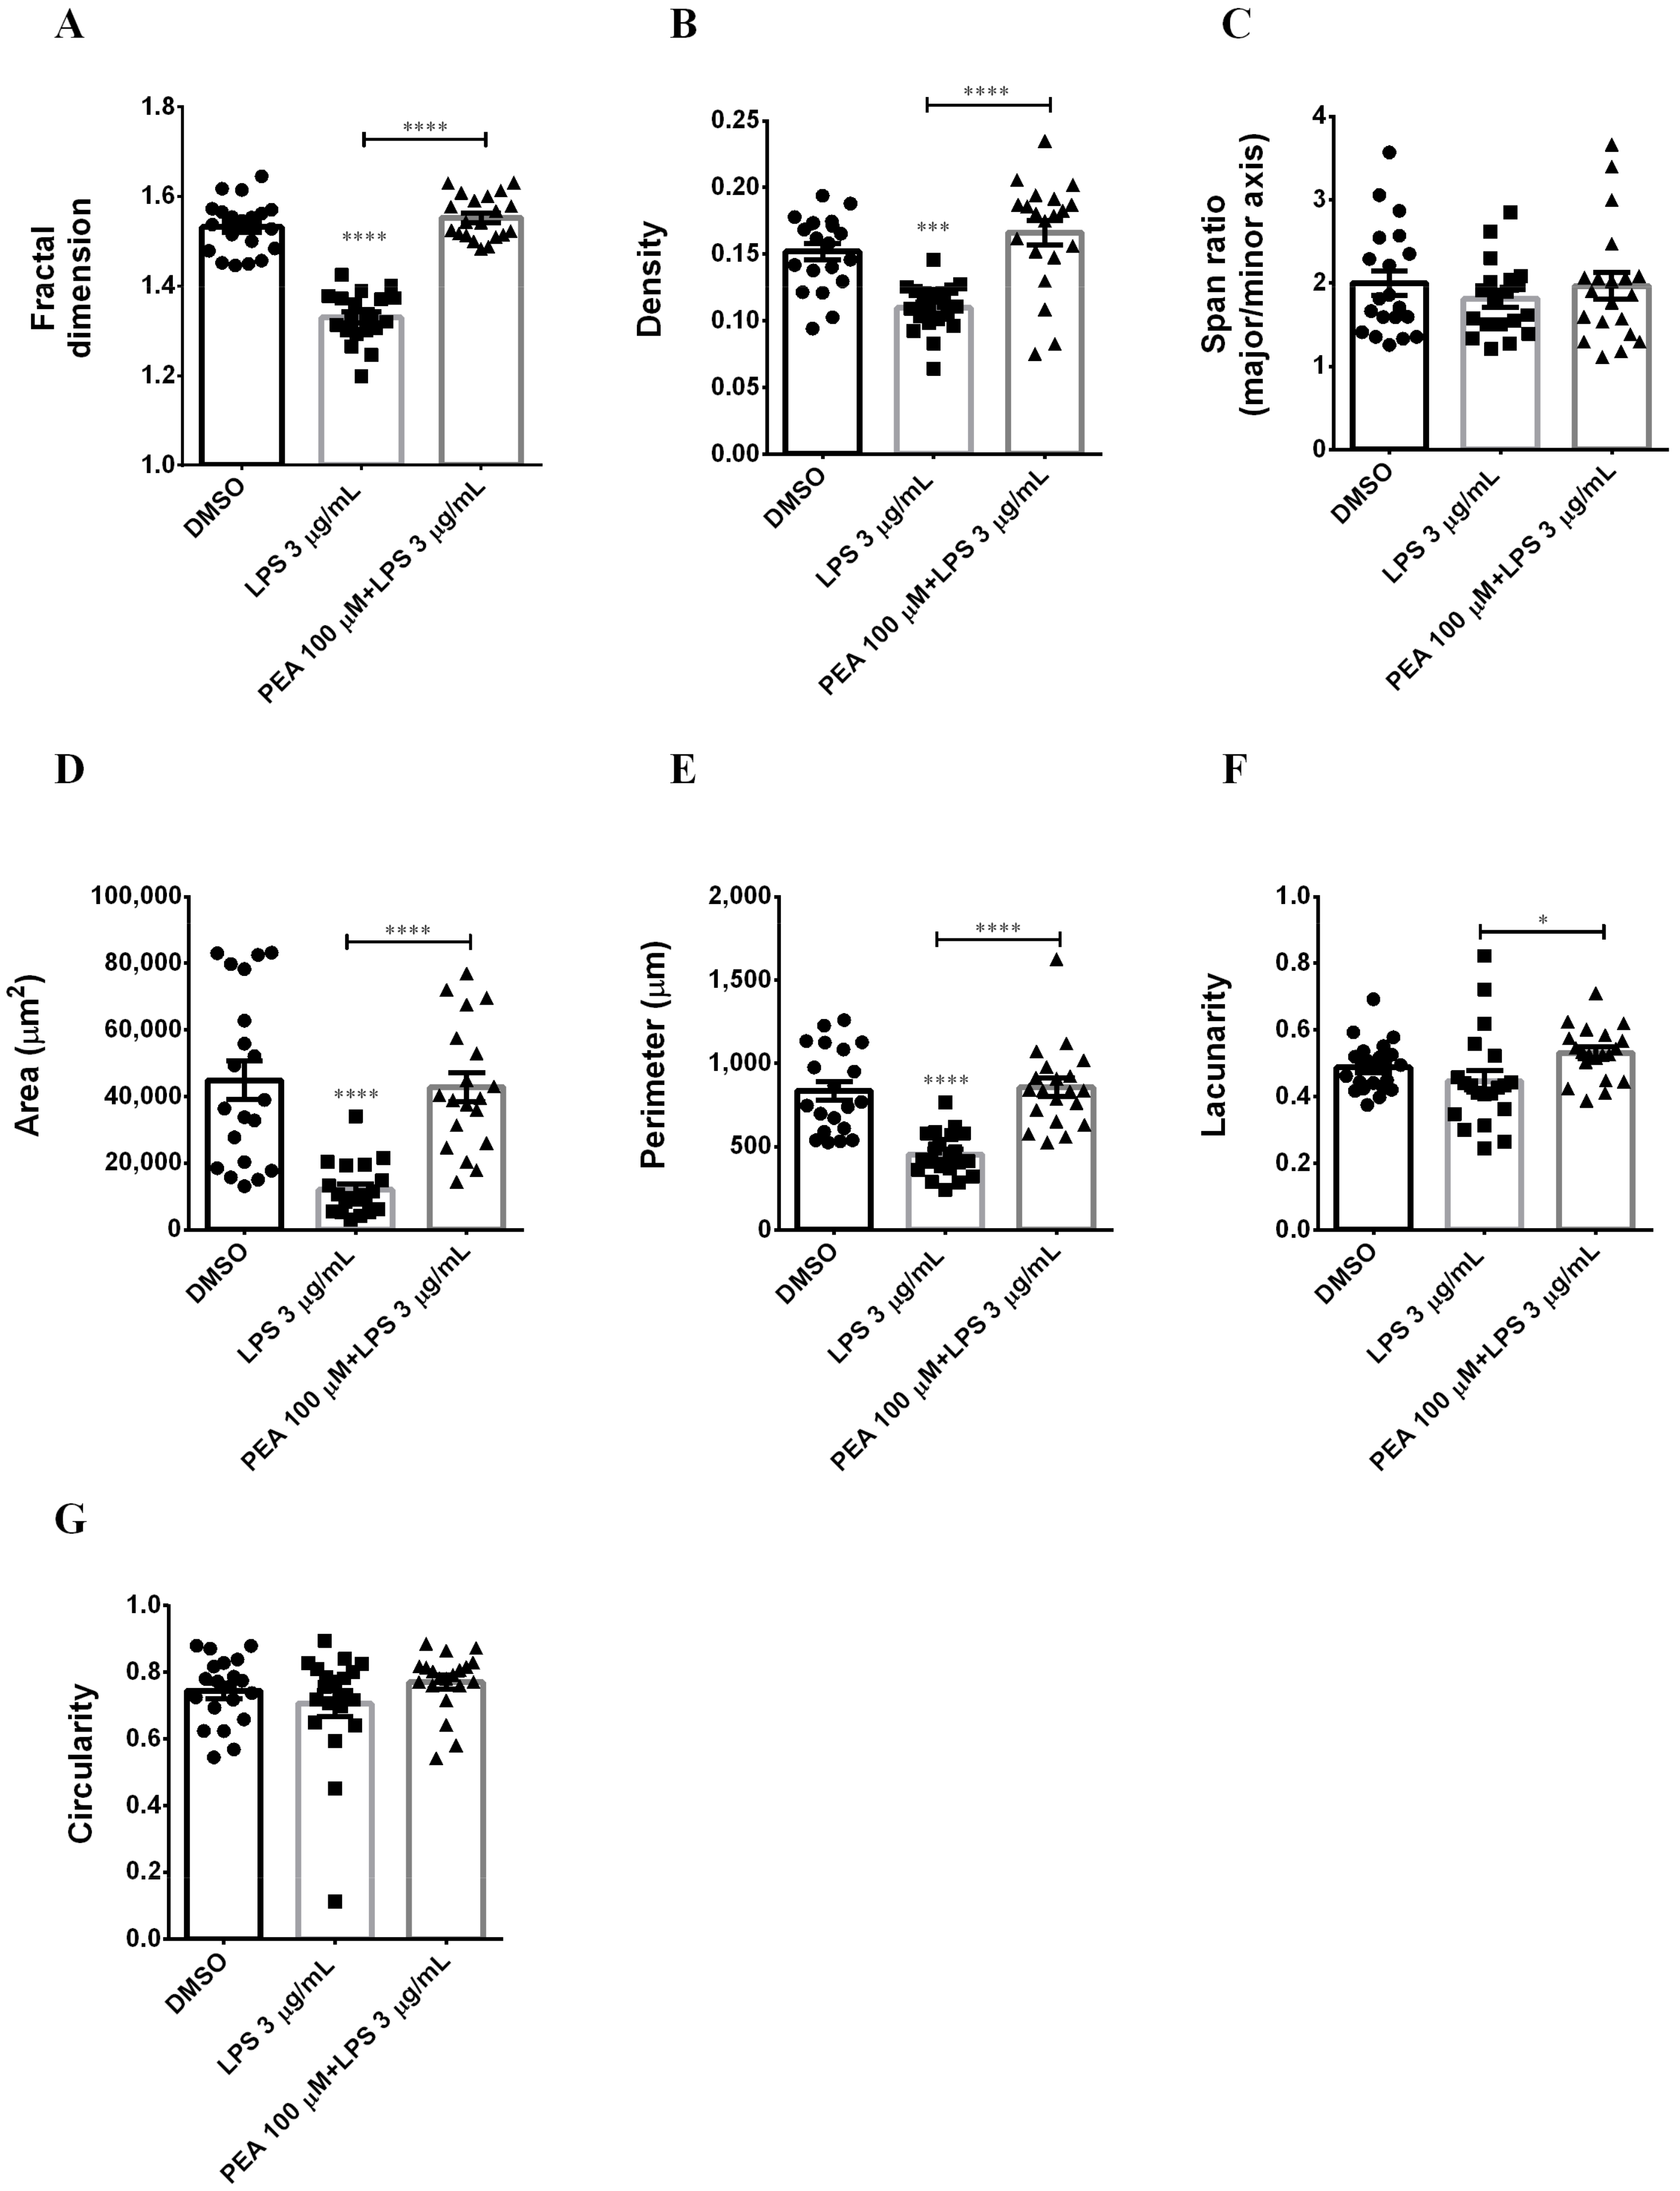
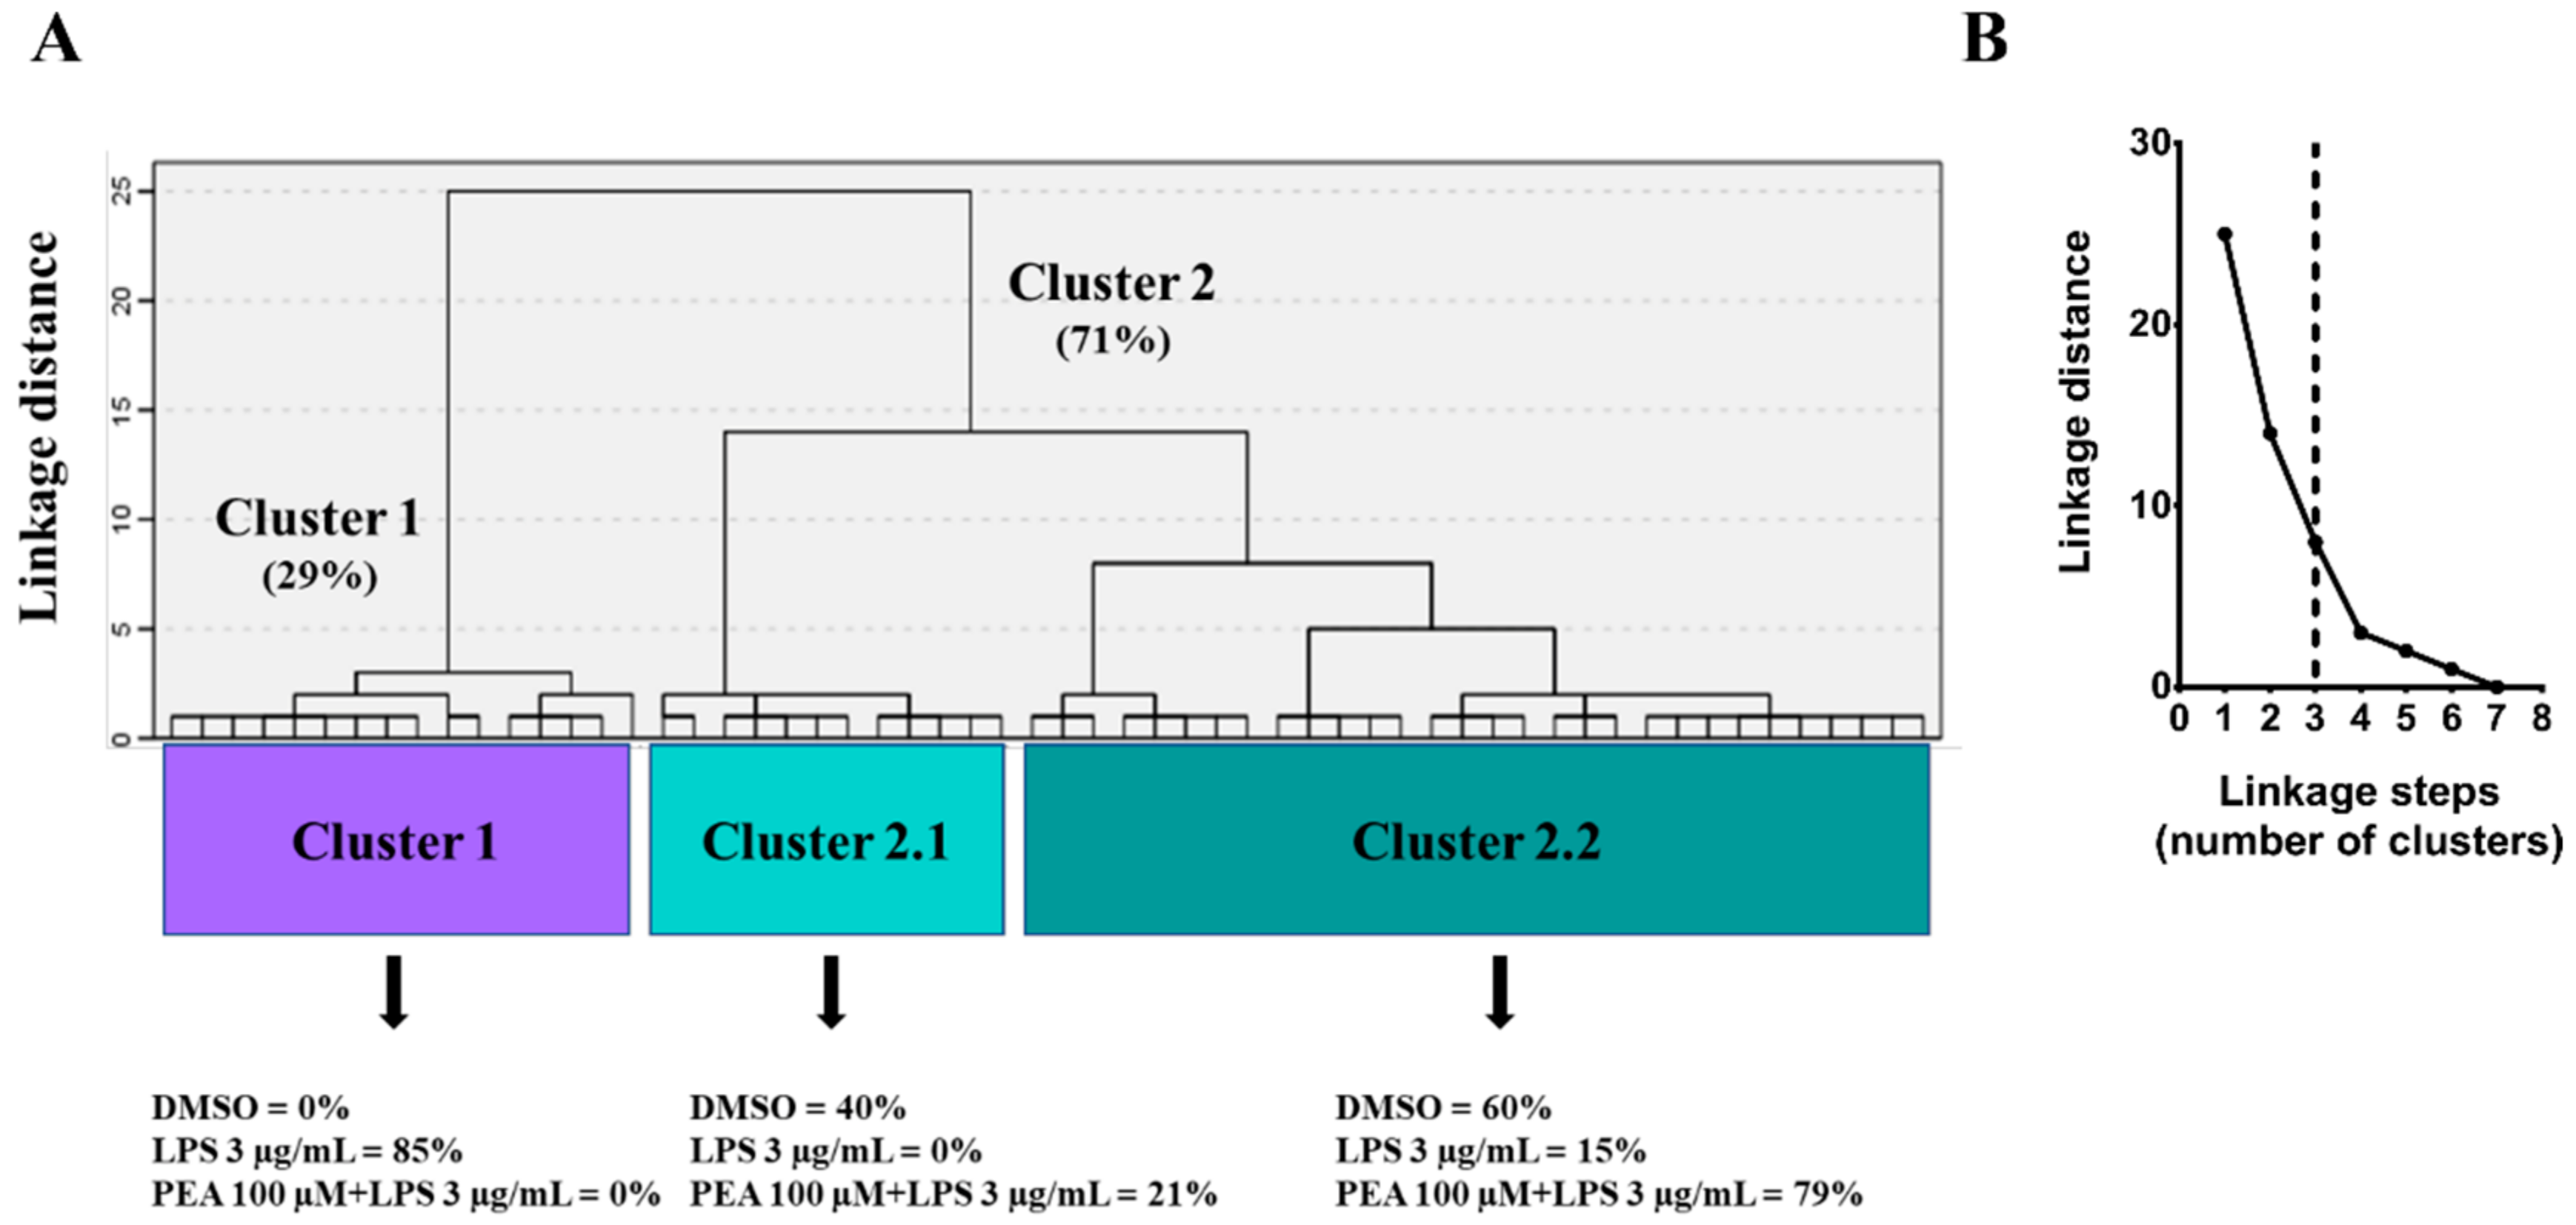
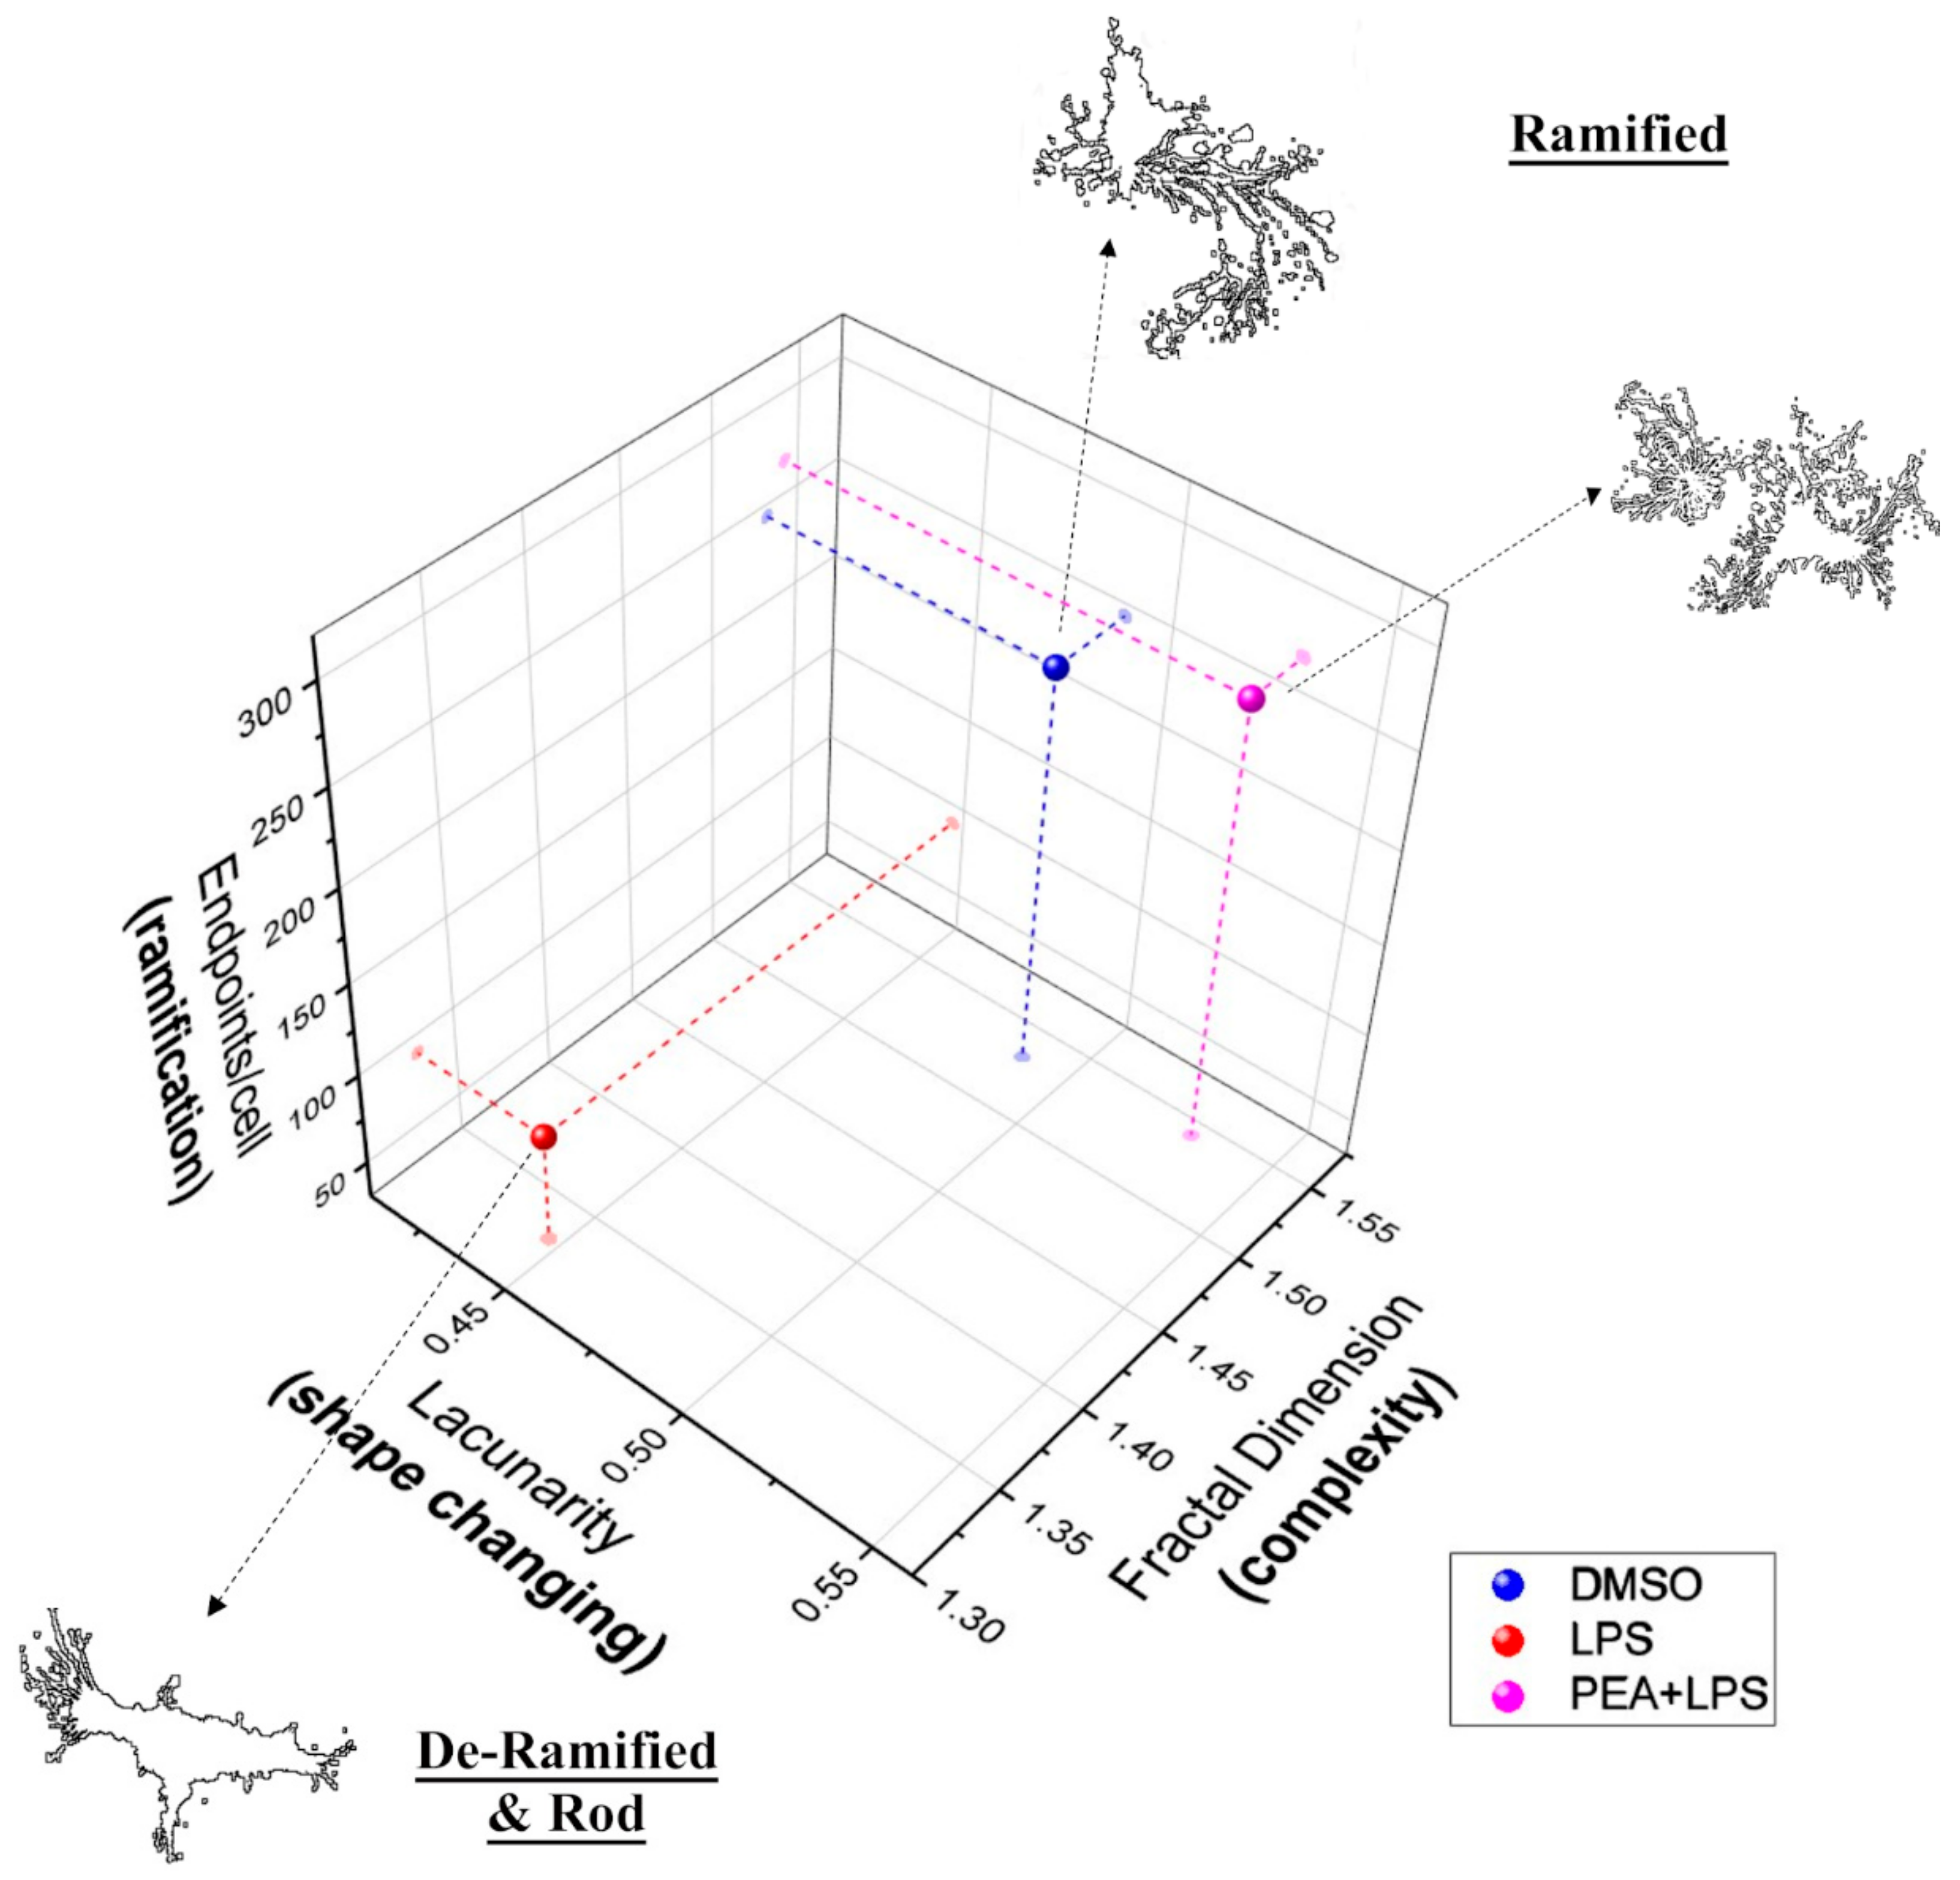
2.2. PEA Pre-Treatment Prevents Microglia De-Ramification Induced by LPS Treatment
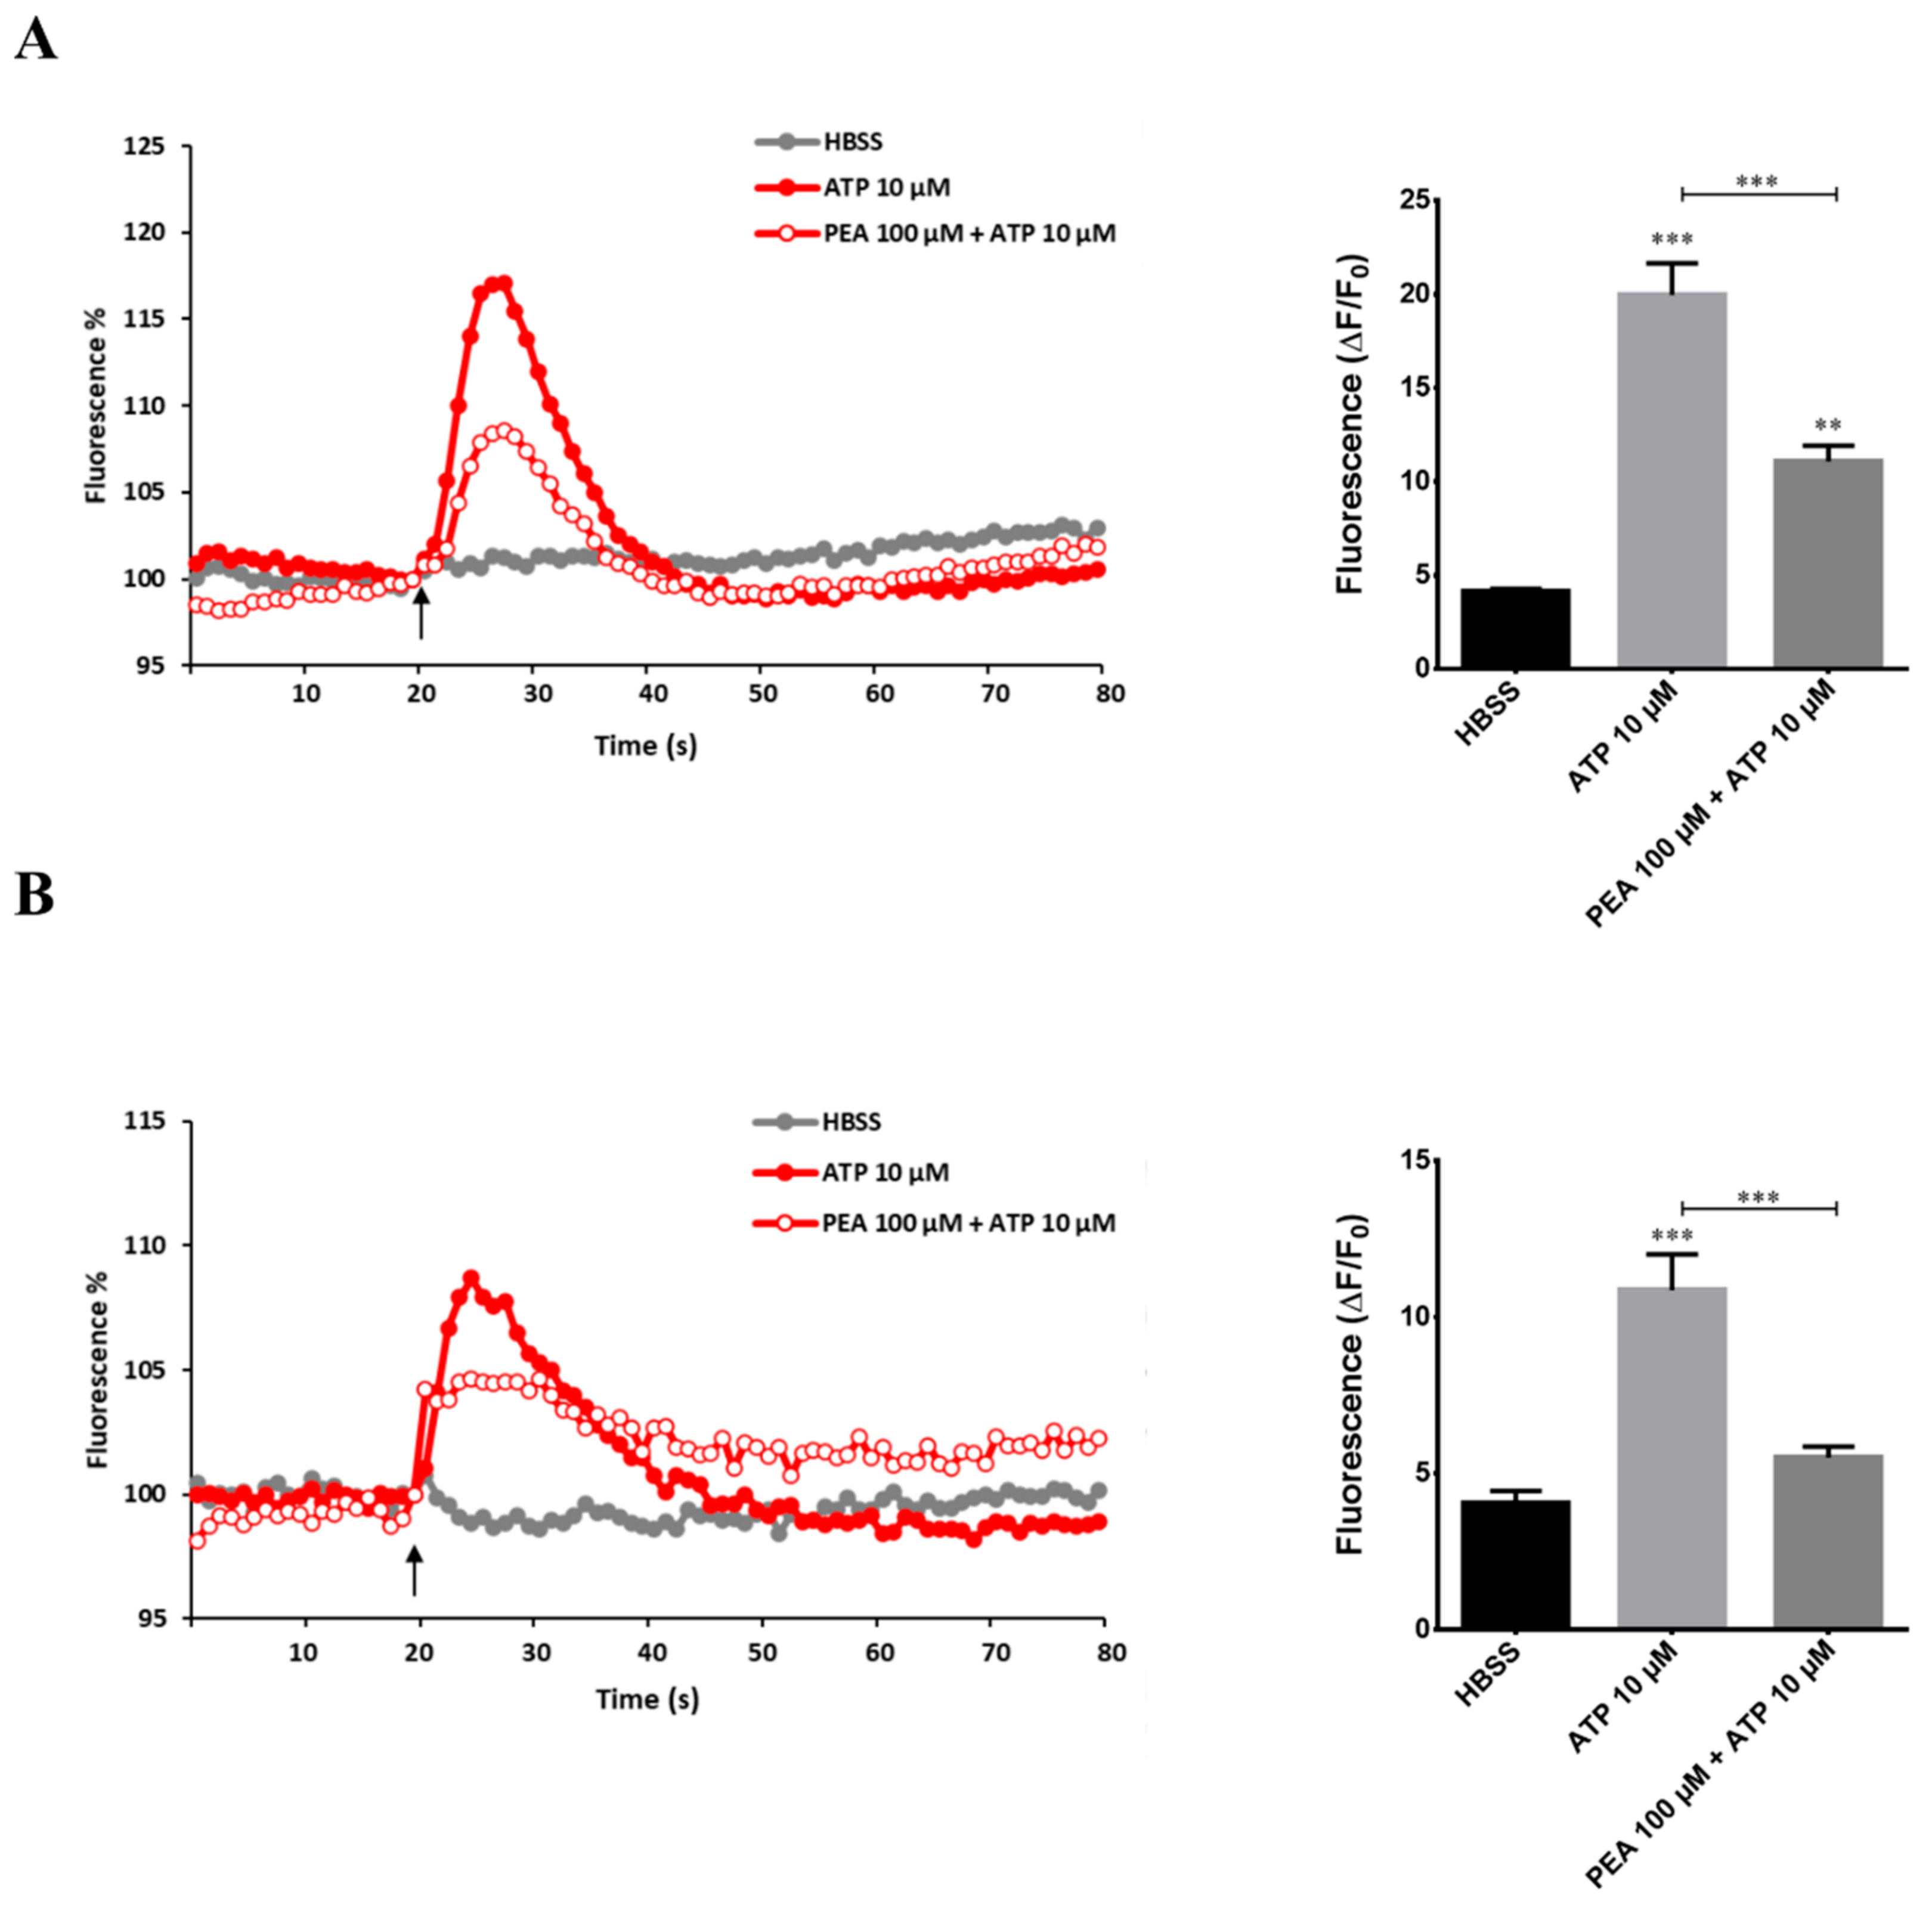
2.3. PEA Inhibits ATP-Induced Intracellular Ca2+ Increase in N9 and Primary Microglial Cells
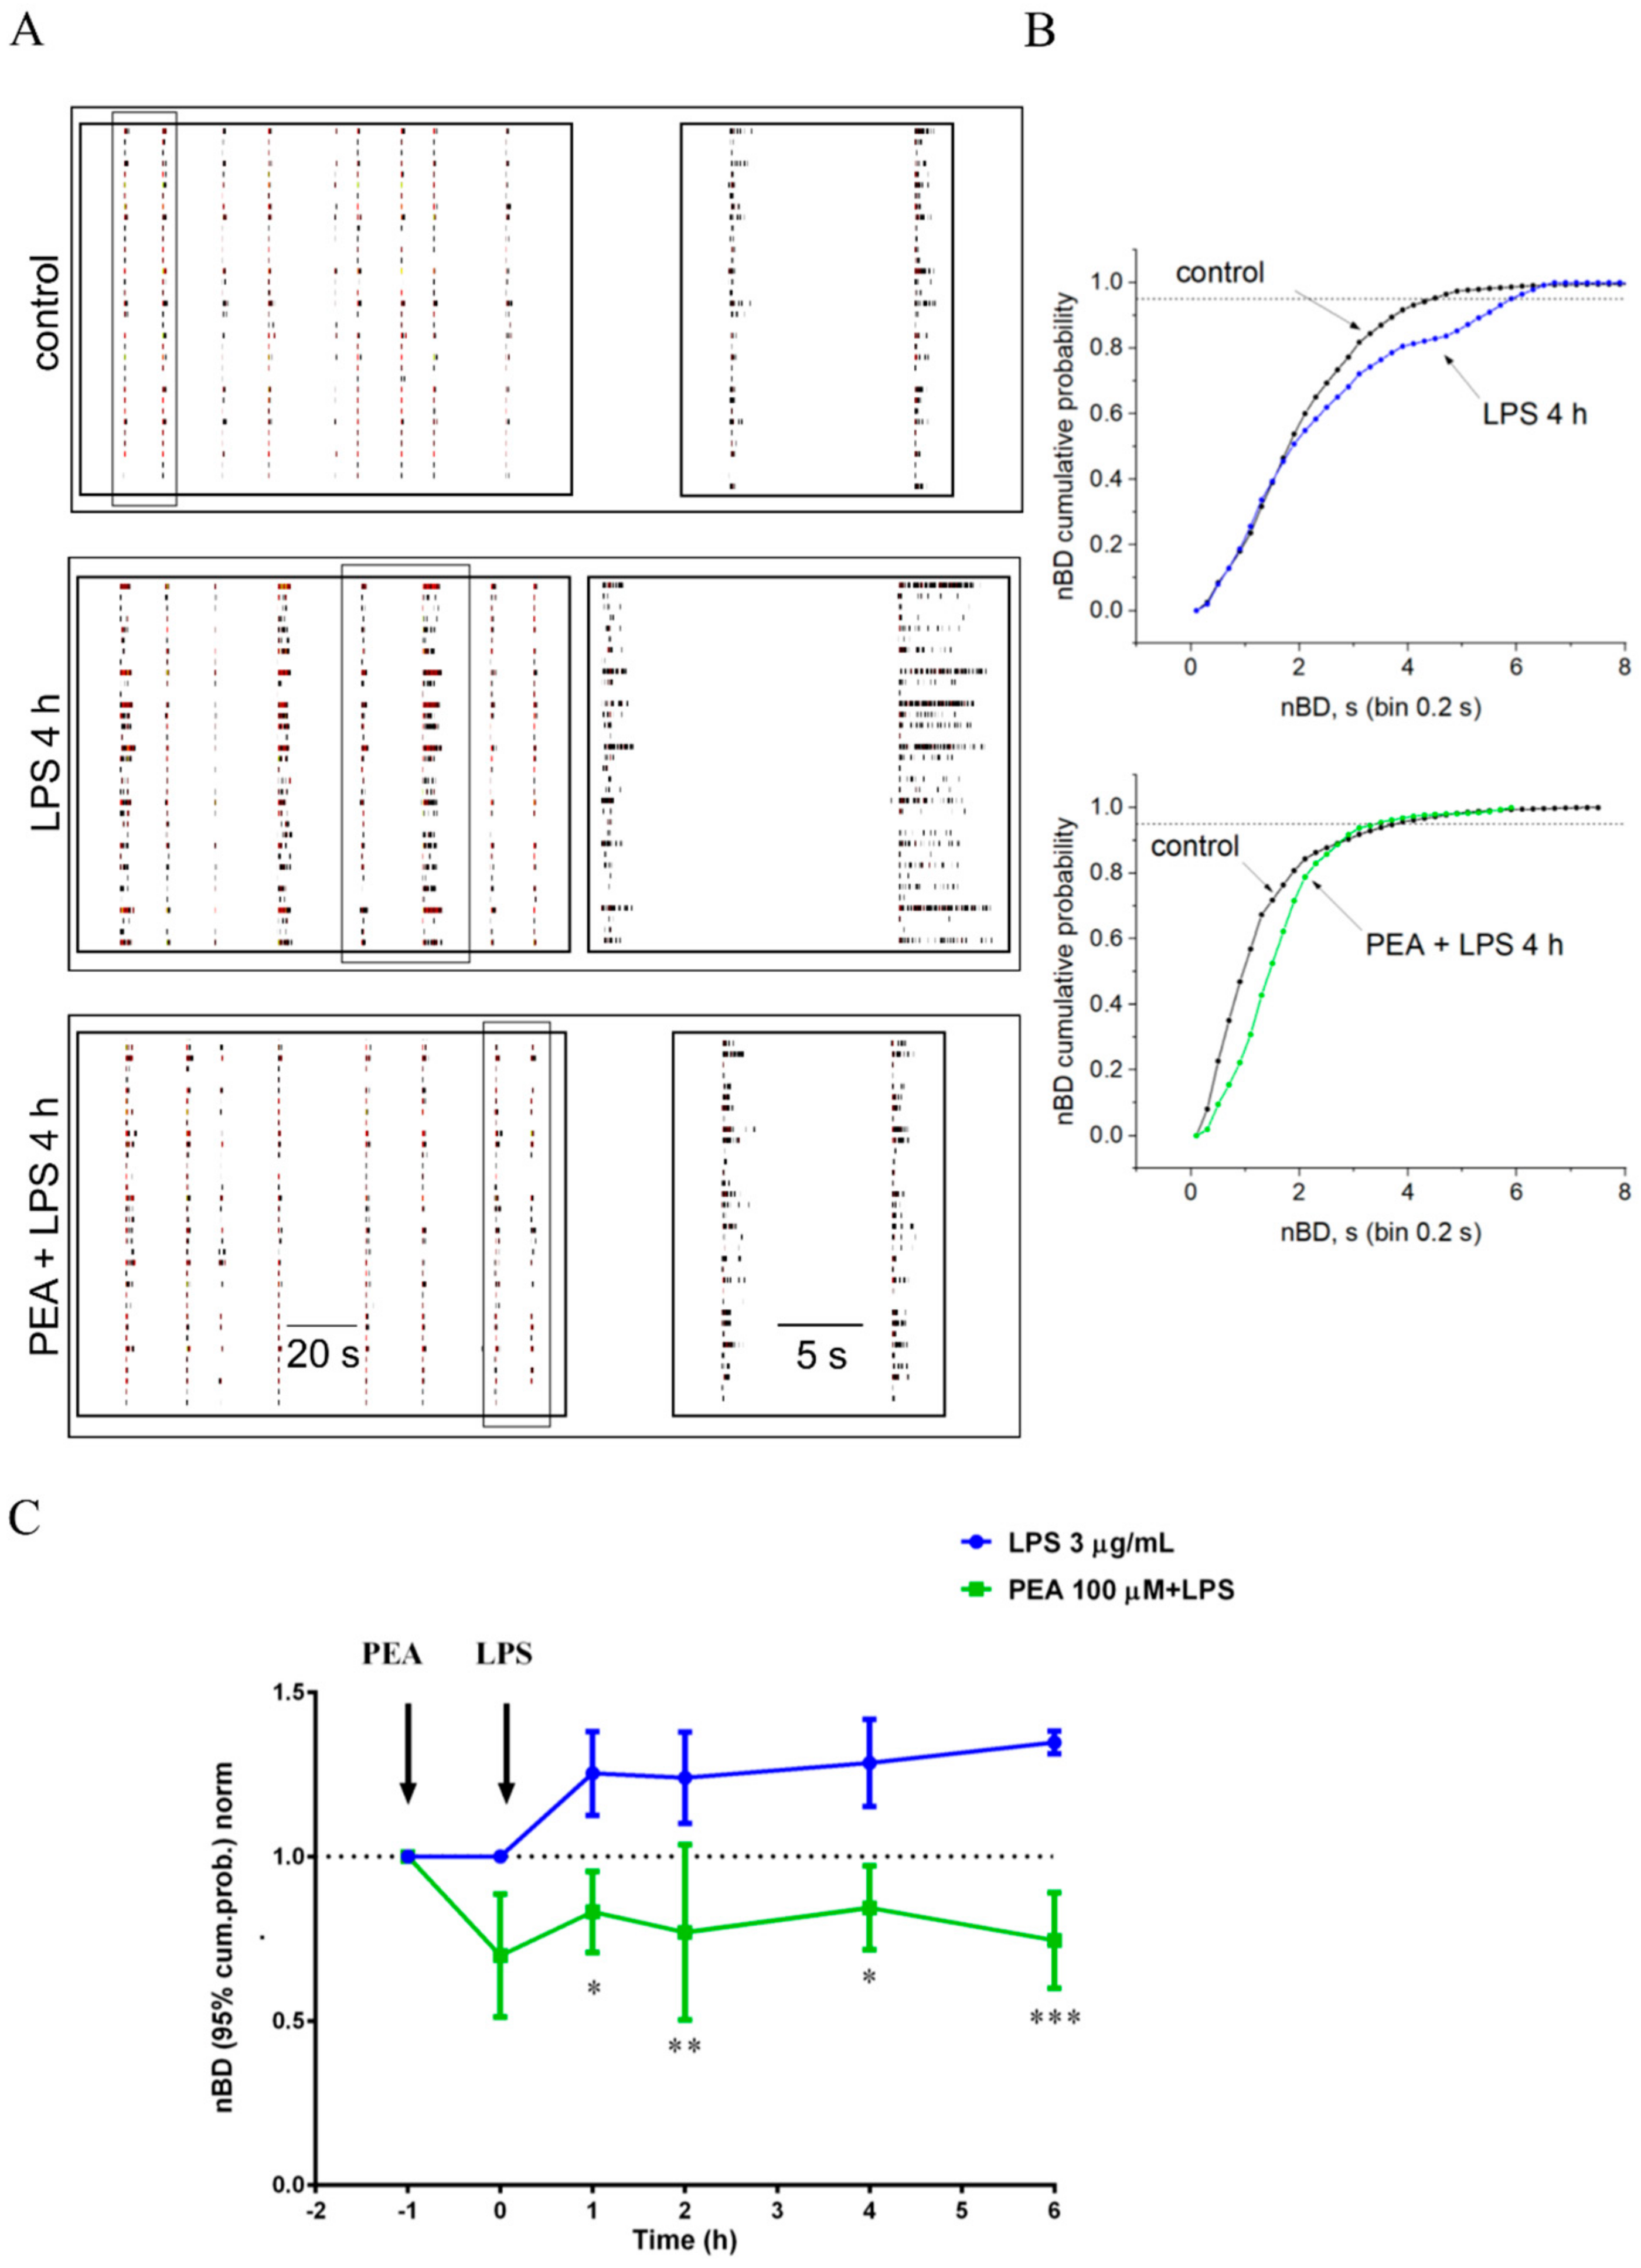
2.4. PEA Prevents LPS-Induced Hyperexcitability in Primary Cortical Cultures
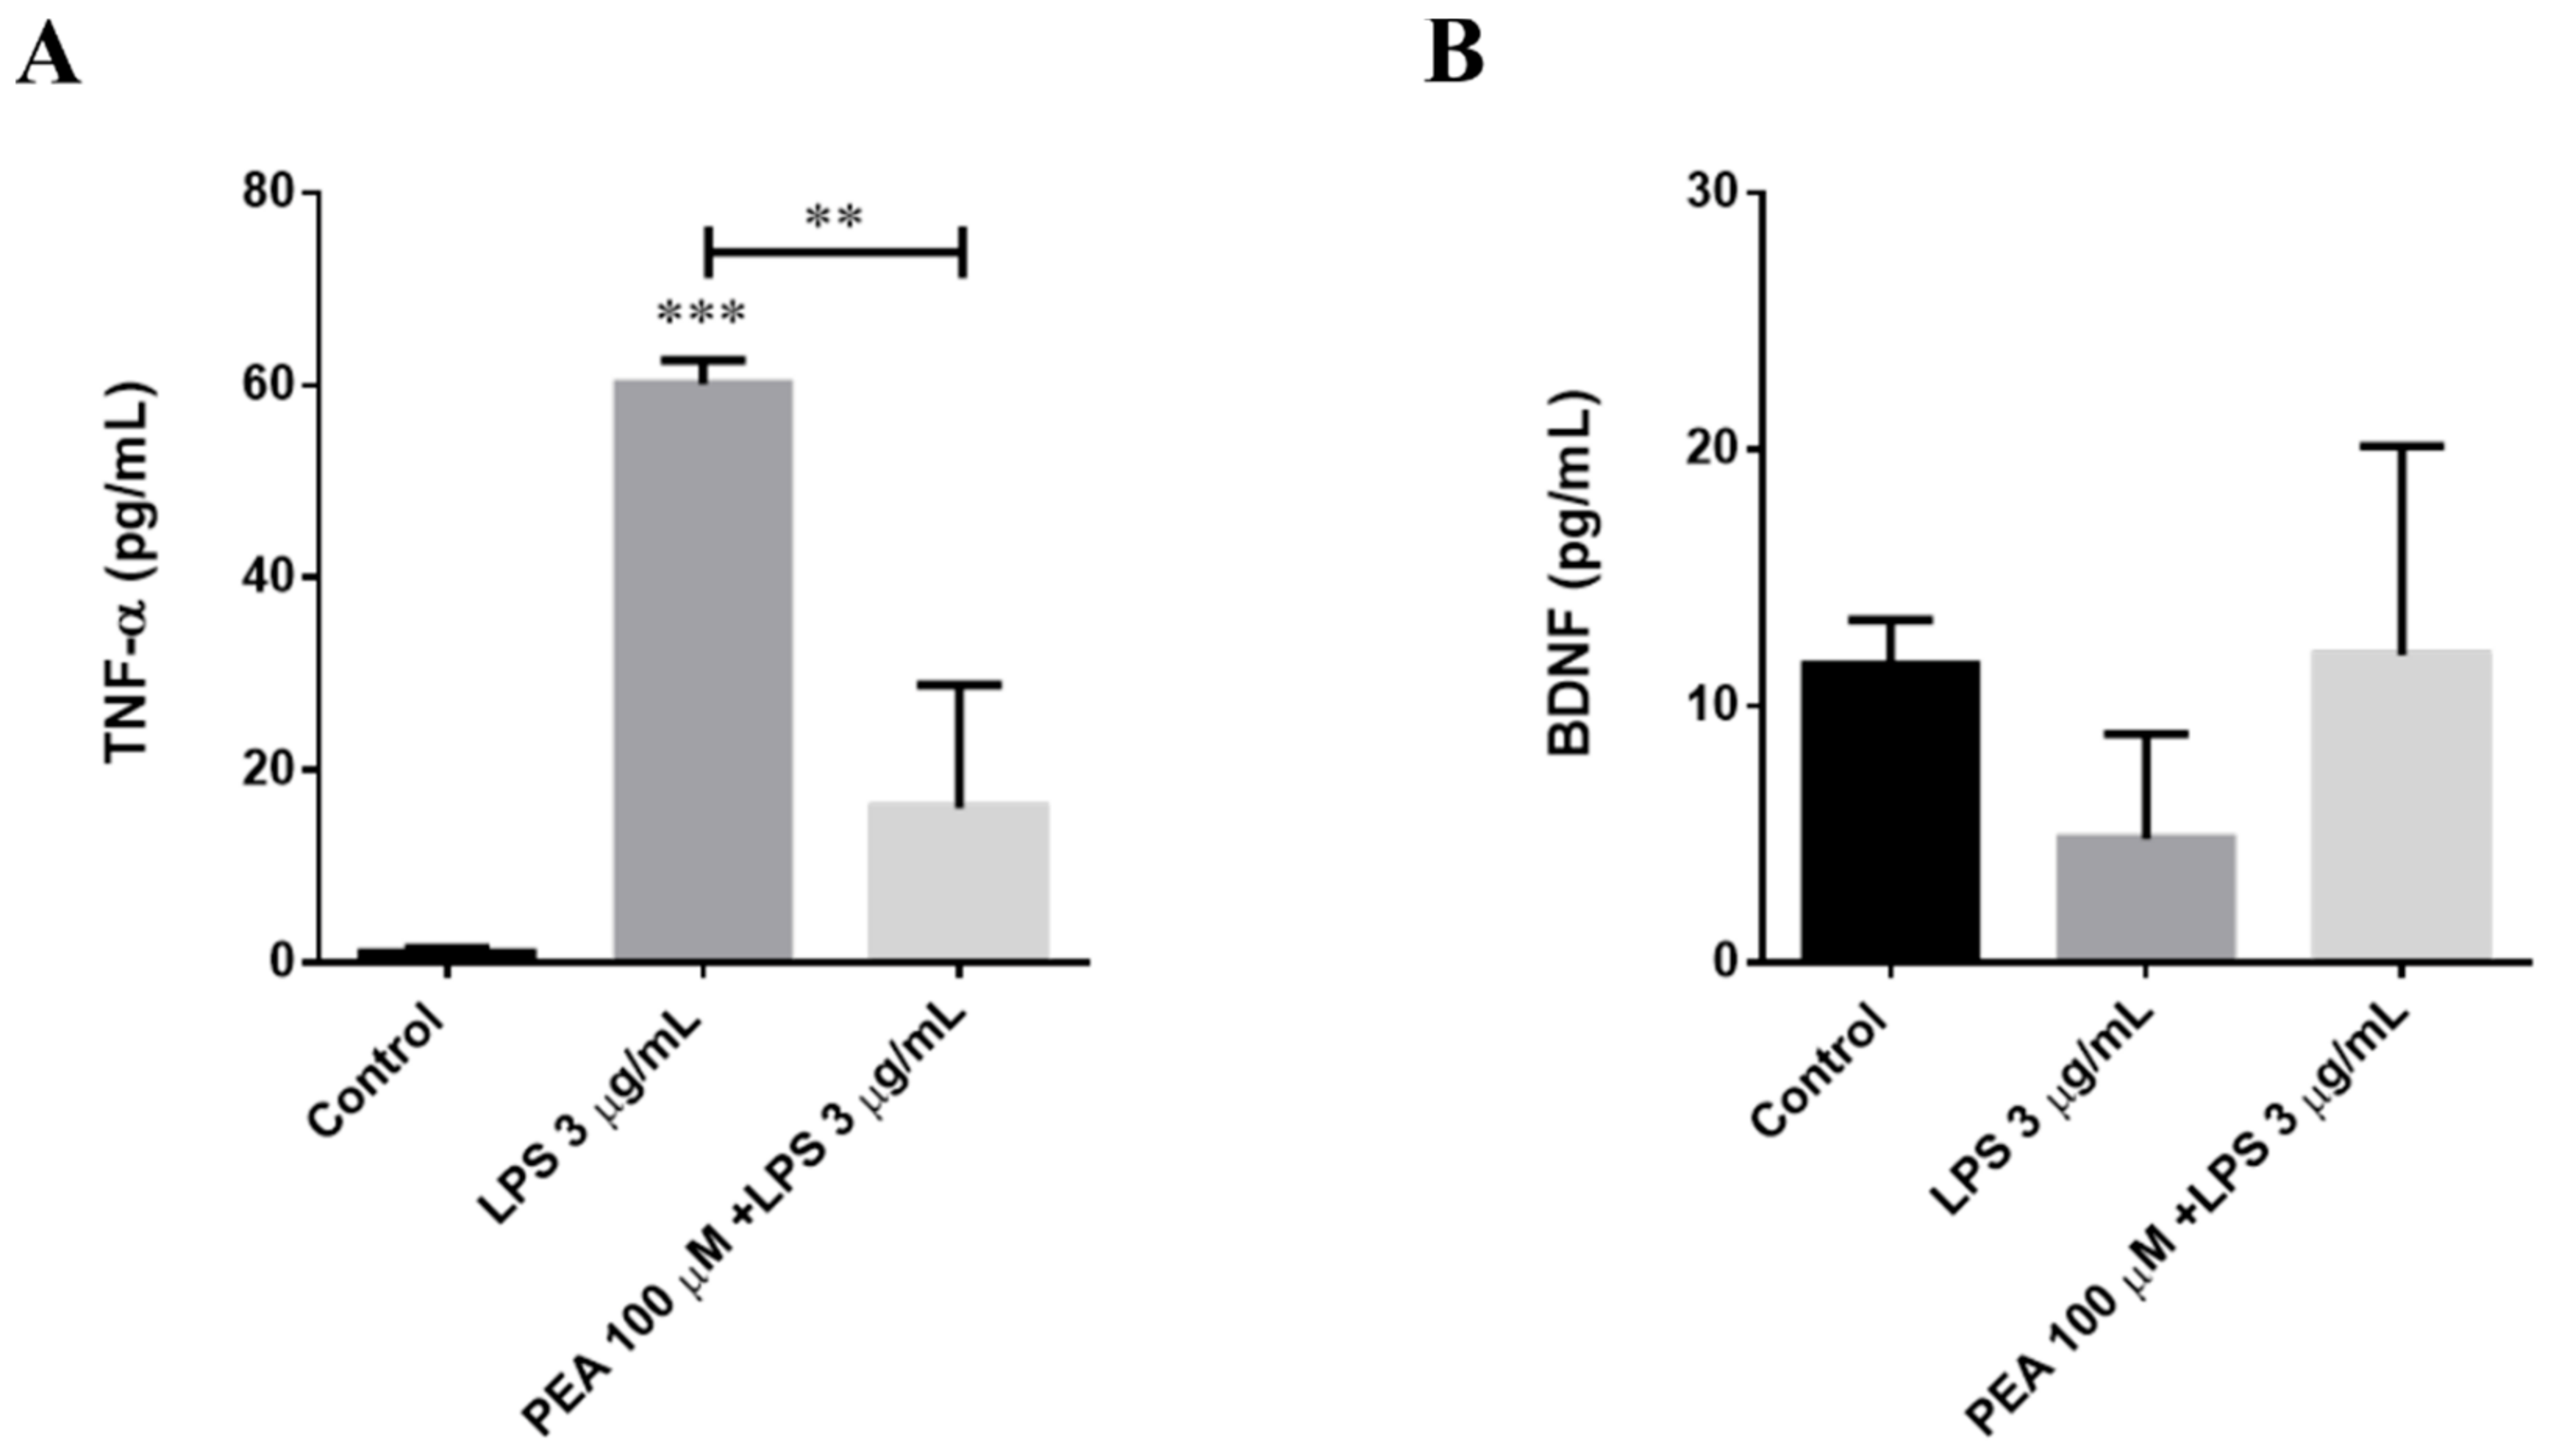
2.5. PEA Counteracts LPS-Induced TNF-α Release in Primary Cortical Cultures
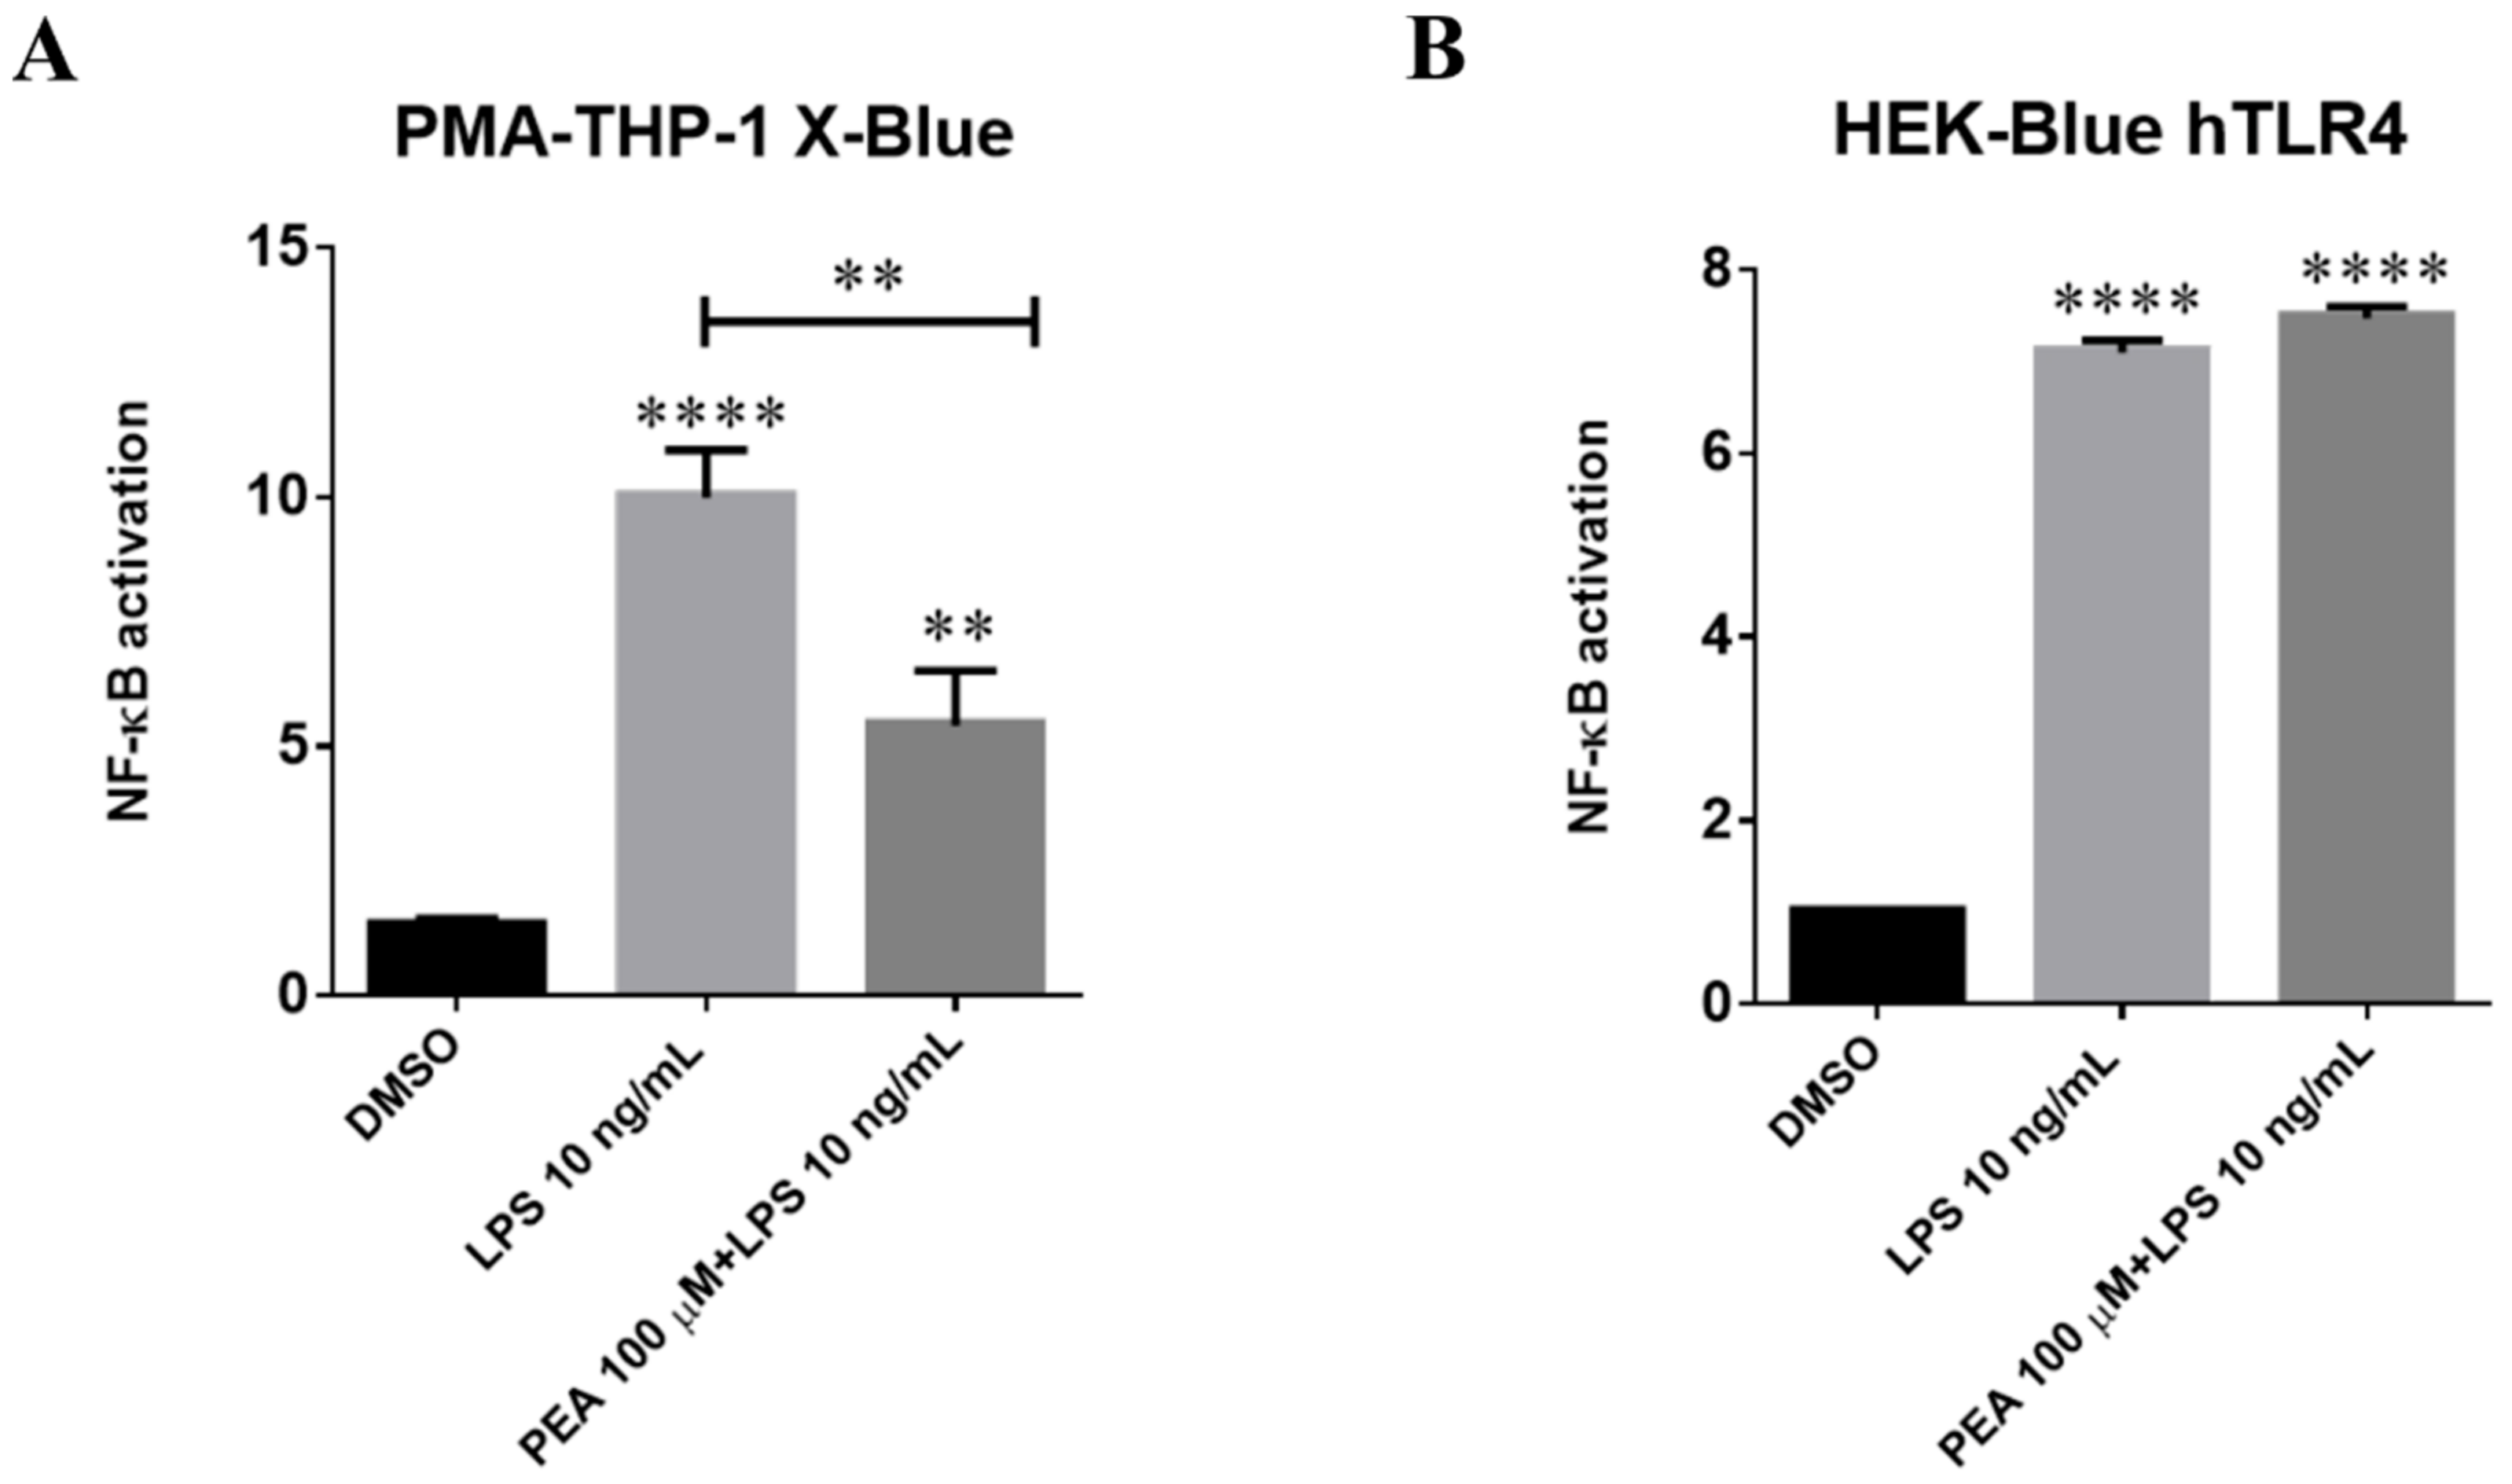
2.6. PEA Counteracts LPS-Induced Nf-κB Activation in Juman PMA-THP-1 X-Blue Cells and This Effect Is Not Mediated by Interaction with TLR4
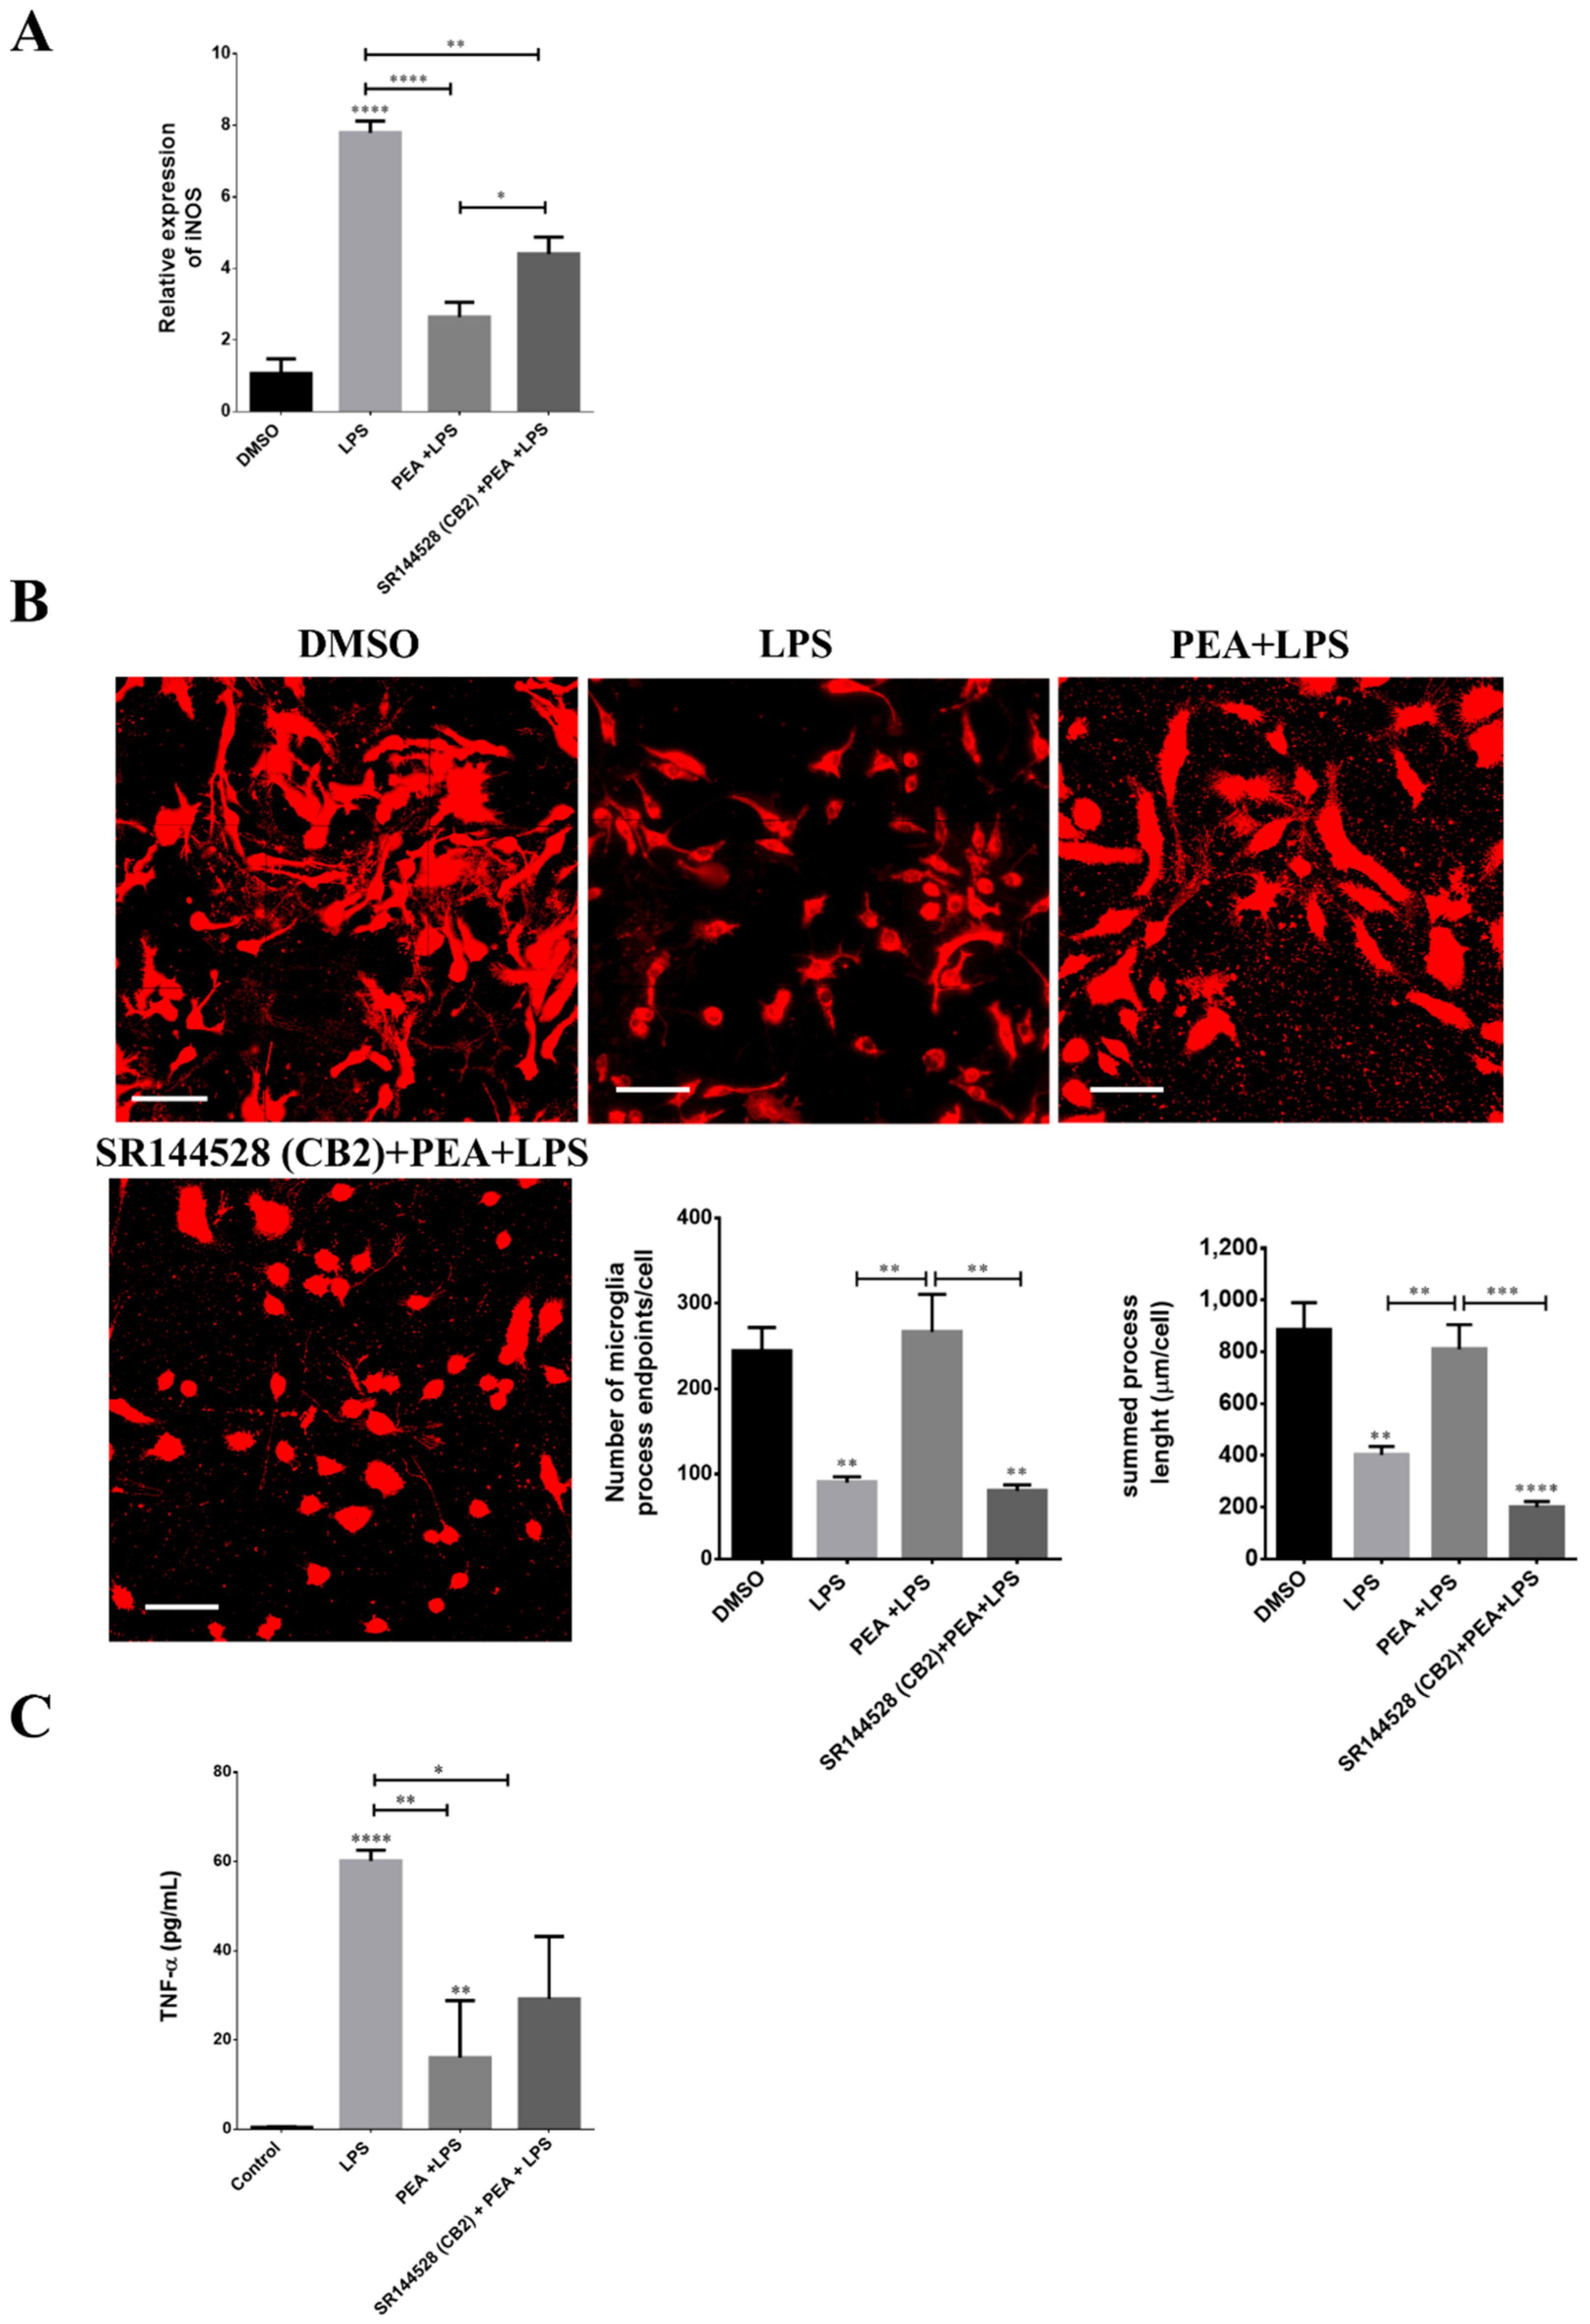
2.7. CB2 Receptor Is Partially Involved in PEA-Induced Effects on Microglia
3. Discussion
4. Materials and Methods
4.1. Cell Cultures
4.2. Chemicals
4.3. Real-Time PCR Analysis
4.4. Western Blot Analysis
4.5. Immunofluorescence
4.6. Morphological Analysis
4.7. Intracellular Calcium Mobilization Assay
4.8. Electrophysiological Recordings by MEA System
4.9. TNF-α and BDNF Concentration Measurements
4.10. SEAP Assay
Supplementary Materials
Author Contributions
Funding
Institutional Review Board Statement
Informed Consent Statement
Data Availability Statement
Conflicts of Interest
References
- Kettenmann, H.; Hanisch, U.-K.; Noda, M.; Verkhratsky, A. Physiology of microglia. Physiol. Rev. 2011, 91, 461–553. [Google Scholar] [CrossRef] [PubMed]
- Ransohoff, R.M.; Perry, V.H. Microglial physiology: Unique stimuli, specialized responses. Annu Rev. Immunol. 2009, 27, 119–145. [Google Scholar] [CrossRef]
- Kigerl, K.A.; Gensel, J.C.; Ankeny, D.P.; Alexander, J.K.; Donnelly, D.J.; Popovich, P.G. Identification of two distinct macrophage subsets with divergent effects causing either neurotoxicity or regeneration in the injured mouse spinal cord. J. Neurosci. Off. J. Soc. Neurosci. 2009, 29, 13435–13444. [Google Scholar] [CrossRef]
- Mattace Raso, G.; Russo, R.; Calignano, A.; Meli, R. Palmitoylethanolamide in CNS health and disease. Pharmacol. Res. 2014, 86, 32–41. [Google Scholar] [CrossRef] [PubMed]
- Facci, L.; Dal Toso, R.; Romanello, S.; Buriani, A.; Skaper, S.D.; Leon, A. Mast cells express a peripheral cannabinoid receptor with differential sensitivity to anandamide and palmitoylethanolamide. Proc. Natl. Acad. Sci. USA 1995, 92, 3376–3380. [Google Scholar] [CrossRef] [PubMed]
- Redlich, S.; Ribes, S.; Schütze, S.; Nau, R. Palmitoylethanolamide stimulates phagocytosis of Escherichia coli K1 by macrophages and increases the resistance of mice against infections. J. Neuroinflamm. 2014, 11, 108. [Google Scholar] [CrossRef]
- Guida, F.; Luongo, L.; Boccella, S.; Giordano, M.E.; Romano, R.; Bellini, G.; Manzo, I.; Furiano, A.; Rizzo, A.; Imperatore, R.; et al. Palmitoylethanolamide induces microglia changes associated with increased migration and phagocytic activity: Involvement of the CB2 receptor. Sci. Rep. 2017, 7, 375. [Google Scholar] [CrossRef]
- McKimmie, C.S.; Fazakerley, J.K. In response to pathogens, glial cells dynamically and differentially regulate Toll-like receptor gene expression. J. Neuroimmunol. 2005, 169, 116–125. [Google Scholar] [CrossRef]
- Marinelli, C.; Di Liddo, R.; Facci, L.; Bertalot, T.; Conconi, M.T.; Zusso, M.; Skaper, S.D.; Giusti, P. Ligand engagement of Toll-like receptors regulates their expression in cortical microglia and astrocytes. J. Neuroinflamm. 2015, 12, 244. [Google Scholar] [CrossRef]
- Nomura, F.; Akashi, S.; Sakao, Y.; Sato, S.; Kawai, T.; Matsumoto, M.; Nakanishi, K.; Kimoto, M.; Miyake, K.; Takeda, K.; et al. Cutting edge: Endotoxin tolerance in mouse peritoneal macrophages correlates with down-regulation of surface toll-like receptor 4 expression. J. Immunol. 2000, 164, 3476–3479. [Google Scholar] [CrossRef]
- Hines, D.J.; Hines, R.M.; Mulligan, S.J.; Macvicar, B.A. Microglia processes block the spread of damage in the brain and require functional chloride channels. Glia 2009, 57, 1610–1618. [Google Scholar] [CrossRef]
- Buttini, M.; Limonta, S.; Boddeke, H.W. Peripheral administration of lipopolysaccharide induces activation of microglial cells in rat brain. Neurochem. Int. 1996, 29, 25–35. [Google Scholar] [CrossRef]
- Karperien, A.; Jelinek, H.; Milosevic, N. Lacunarity Analysis and Classification of Microglia in Neuroscience. In Proceedings of the ESMTB 2011: 8th European Conference on Mathematical and Theoretical Biology, Krakow, Poland, 28 June–2 July 2011. [Google Scholar] [CrossRef]
- Thorndike, R.L. Who belongs in the family? Psychometrika 1953, 18, 267–276. [Google Scholar] [CrossRef]
- Domercq, M.; Vázquez-Villoldo, N.; Matute, C. Neurotransmitter signaling in the pathophysiology of microglia. Front. Cell Neurosci. 2013, 7, 49. [Google Scholar] [CrossRef]
- Samuels, S.E.; Lipitz, J.B.; Dahl, G.; Muller, K.J. Neuroglial ATP release through innexin channels controls microglial cell movement to a nerve injury. J. Gen. Physiol. 2010, 136, 425–442. [Google Scholar] [CrossRef]
- Wu, X.; Pan, L.; Liu, Y.; Jiang, P.; Lee, I.; Drevensek-Olenik, I.; Zhang, X.; Xu, J. Cell-cell communication induces random spikes of spontaneous calcium oscillations in multi-BV-2 microglial cells. Biochem. Biophys. Res. Commun. 2013, 431, 664–669. [Google Scholar] [CrossRef] [PubMed]
- Gullo, F.; Amadeo, A.; Donvito, G.; Lecchi, M.; Costa, B.; Constanti, A.; Wanke, E. Atypical “seizure-like” activity in cortical reverberating networks in vitro can be caused by LPS-induced inflammation: A multi-electrode array study from a hundred neurons. Front. Cell Neurosci. 2014, 8, 361. [Google Scholar] [CrossRef] [PubMed]
- Gullo, F.; Ceriani, M.; D’Aloia, A.; Wanke, E.; Constanti, A.; Costa, B.; Lecchi, M. Plant Polyphenols and Exendin-4 Prevent Hyperactivity and TNF-α Release in LPS-Treated In vitro Neuron/Astrocyte/Microglial Networks. Front. Neurosci. 2017, 11, 500. [Google Scholar] [CrossRef] [PubMed]
- Zhang, P.; Liu, W.; Peng, Y.; Han, B.; Yang, Y. Toll like receptor 4 (TLR4) mediates the stimulating activities of chitosan oligosaccharide on macrophages. Int. Immunopharmacol. 2014, 23, 254–261. [Google Scholar] [CrossRef]
- Ghosh, S.; Karin, M. Missing pieces in the NF-kappaB puzzle. Cell 2002, 109, S81–S96. [Google Scholar] [CrossRef]
- Karin, M.; Ben-Neriah, Y. Phosphorylation meets ubiquitination: The control of NF-[kappa]B activity. Annu. Rev. Immunol. 2000, 18, 621–663. [Google Scholar] [CrossRef]
- Facchini, F.A.; Di Fusco, D.; Barresi, S.; Luraghi, A.; Minotti, A.; Granucci, F.; Monteleone, G.; Peri, F.; Monteleone, I. Effect of chemical modulation of toll-like receptor 4 in an animal model of ulcerative colitis. Eur. J. Clin. Pharm. 2020, 76, 409–418. [Google Scholar] [CrossRef] [PubMed]
- D’Aloia, A.; Arrigoni, F.; Tisi, R.; Palmioli, A.; Ceriani, M.; Artusa, V.; Airoldi, C.; Zampella, G.; Costa, B.; Cipolla, L. Synthesis, Molecular Modeling and Biological Evaluation of Metabolically Stable Analogues of the Endogenous Fatty Acid Amide Palmitoylethanolamide. Int. J. Mol. Sci. 2020, 21, 9074. [Google Scholar] [CrossRef] [PubMed]
- Howlett, A.C.; Barth, F.; Bonner, T.I.; Cabral, G.; Casellas, P.; Devane, W.A.; Felder, C.C.; Herkenham, M.; Mackie, K.; Martin, B.R.; et al. International Union of Pharmacology. XXVII. Classification of cannabinoid receptors. Pharmacol. Rev. 2002, 54, 161–202. [Google Scholar] [CrossRef] [PubMed]
- Maresz, K.; Carrier, E.J.; Ponomarev, E.D.; Hillard, C.J.; Dittel, B.N. Modulation of the cannabinoid CB2 receptor in microglial cells in response to inflammatory stimuli. J. Neurochem. 2005, 95, 437–445. [Google Scholar] [CrossRef] [PubMed]
- Ma, L.; Jia, J.; Liu, X.; Bai, F.; Wang, Q.; Xiong, L. Activation of murine microglial N9 cells is attenuated through cannabinoid receptor CB2 signaling. Biochem. Biophys. Res. Commun. 2015, 458, 92–97. [Google Scholar] [CrossRef] [PubMed]
- Iannotti, M.A.; Di Marzo, V.; Petrosino, S. Endocannabinoids and endocannabinoid-related mediators: Targets, metabolism and role in neurological disorders. Prog. Lipid Res. 2016, 62, 107–128. [Google Scholar] [CrossRef] [PubMed]
- Beggiato, S.; Tomasini, M.C.; Ferraro, L. Palmitoylethanolamide (PEA) as a potential therapeutic agent in Alzheimer’s disease. Front. Pharmacol. 2019, 10, 821. [Google Scholar] [CrossRef]
- Truini, A.; Biasiotta, A.; Di Stefano, G.; La Cesa, S.; Leone, C.; Cartoni, C.; Federico, V.; Petrucci, M.T.; Cruccu, G. Palmitoylethanolamide restores myelinated-fibre function in patients with chemotherapy-induced painful neuropathy. CNS Neurol. Disord. Drug Targets 2011, 10, 916–920. [Google Scholar] [CrossRef]
- Lo Verme, J.; Fu, J.; Astarita, G.; La Rana, G.; Russo, R.; Calignano, A.; Piomelli, D. The Nuclear Receptor Peroxisome Proliferator-Activated Receptor-α Mediates the Anti-Inflammatory Actions of Palmitoylethanolamide. Mol. Pharmacol. 2005, 67, 15–19. [Google Scholar] [CrossRef] [PubMed]
- Di Marzo, V.; Melck, D.; Orlando, P.; Bisogno, T.; Zagoory, O.; Bifulco, M.; Vogel, Z.; De Petrocellis, L. Palmitoylethanolamide inhibits the expression of fatty acid amide hydrolase and enhances the anti-proliferative effect of anandamide in human breast cancer cells. Biochem. J. 2001, 358, 249–255. [Google Scholar] [CrossRef] [PubMed]
- Subhramanyam, C.S.; Wang, C.; Hu, Q.; Dheen, S.T. Microglia-mediated neuroinflammation in neurodegenerative diseases. Semin. Cell Dev. Biol. 2019, 94, 112–120. [Google Scholar] [CrossRef] [PubMed]
- Block, M.L.; Zecca, L.; Hong, J.S. Microglia-mediated neurotoxicity: Uncovering the molecular mechanisms. Nat. Rev. Neurosci. 2007, 8, 57–69. [Google Scholar] [CrossRef] [PubMed]
- Lawson, L.J.; Perry, V.H.; Dri, P.; Gordon, S. Heterogeneity in the distribution and morphology of microglia in the normal adult mouse brain. Neuroscience 1990, 39, 151–170. [Google Scholar] [CrossRef]
- Ransohoff, R.M. A polarizing question: Do M1 and M2 microglia exist? Nat. Neurosci. 2016, 19, 987–991. [Google Scholar] [CrossRef] [PubMed]
- Tang, Y.; Le, W. Differential Roles of M1 and M2 Microglia in Neurodegenerative Diseases. Mol. Neurobiol. 2016, 53, 1181–1194. [Google Scholar] [CrossRef]
- Rivolta, I.; Binda, A.; Molteni, L.; Rizzi, L.; Bresciani, E.; Possenti, R.; Fehrentz, J.A.; Verdie, P.; Martinez, J.; Omeljaniuk, R.J.; et al. JMV5656, A Novel Derivative of TLQP-21, Triggers the Activation of a Calcium-Dependent Potassium Outward Current in Microglial Cells. Front. Cell Neurosci. 2017, 11, 41. [Google Scholar] [CrossRef]
- Wang, X.; Li, C.; Chen, Y.; Hao, Y.; Zhou, W.; Chen, C.; Yu, Z. Hypoxia enhances CXCR4 expression favoring microglia migration via HIF-1alpha activation. Biochem. Biophys. Res. Commun. 2008, 371, 283–288. [Google Scholar] [CrossRef]
- Ohto, U.; Fukase, K.; Miyake, K.; Satow, Y. Crystal structures of human MD-2 and its complex with antiendotoxic lipid IVa. Science 2007, 316, 1632–1634. [Google Scholar] [CrossRef]
- Cotrina, M.L.; Lin, J.H.; López-García, J.C.; Naus, C.C.; Nedergaard, M. ATP-mediated glia signaling. J. Neurosci. Off. J. Soc. Neurosci. 2000, 20, 2835–2844. [Google Scholar] [CrossRef]
- Schipke, C.G.; Boucsein, C.; Ohlemeyer, C.; Kirchhoff, F.; Kettenmann, H. Astrocyte Ca2+ waves trigger responses in microglial cells in brain slices. Faseb J. Off. Publ. Fed. Am. Soc. Exp. Biol. 2002, 16, 255–257. [Google Scholar] [CrossRef]
- Verderio, C.; Matteoli, M. ATP mediates calcium signaling between astrocytes and microglial cells: Modulation by IFN-gamma. J. Immunol. 2001, 166, 6383–6391. [Google Scholar] [CrossRef]
- Pires, M.; Raischel, F.; Vaz, S.H.; Cruz-Silva, A.; Sebastião, A.M.; Lind, P.G. Modeling the functional network of primary intercellular Ca2+ wave propagation in astrocytes and its application to study drug effects. J. Biol. 2014, 356, 201–212. [Google Scholar] [CrossRef] [PubMed]
- Zeng, Y.; Lv, X.; Zeng, S.; Tian, S.; Li, M.; Shi, J. Sustained depolarization-induced propagation of [Ca2+]i oscillations in cultured DRG neurons: The involvement of extracellular ATP and P2Y receptor activation. Brain Res. 2008, 1239, 12–23. [Google Scholar] [CrossRef]
- Santello, M.; Bezzi, P.; Volterra, A. TNFα controls glutamatergic gliotransmission in the hippocampal dentate gyrus. Neuron 2011, 69, 988–1001. [Google Scholar] [CrossRef] [PubMed]
- Stellwagen, D.; Malenka, R.C. Synaptic scaling mediated by glial TNF-alpha. Nature 2006, 440, 1054–1059. [Google Scholar] [CrossRef] [PubMed]
- Costello, D.A.; Lyons, A.; Denieffe, S.; Browne, T.C.; Cox, F.F.; Lynch, M.A. Long term potentiation is impaired in membrane glycoprotein CD200-deficient mice: A role for Toll-like receptor activation. J. Biol. Chem. 2011, 286, 34722–34732. [Google Scholar] [CrossRef]
- Showalter, V.M.; Compton, D.R.; Martin, B.R.; Abood, M.E. Evaluation of binding in a transfected cell line expressing a peripheral cannabinoid receptor (CB2): Identification of cannabinoid receptor subtype selective ligands. J. Pharmacol. Exp. Ther. 1996, 278, 989–999. [Google Scholar] [PubMed]
- Losurdo, M.; Pedrazzoli, M.; D’Agostino, C.; Elia, C.A.; Massenzio, F.; Lonati, E.; Mauri, M.; Rizzi, L.; Molteni, L.; Bresciani, E.; et al. Intranasal delivery of mesenchymal stem cell-derived extracellular vesicles exerts immunomodulatory and neuroprotective effects in a 3xTg model of Alzheimer’s disease. Stem Cells Transl. Med. 2020, 9, 1068–1084. [Google Scholar] [CrossRef] [PubMed]
- Fernández-Arjona, M.D.M.; Grondona, J.M.; Granados-Durán, P.; Fernández-Llebrez, P.; López-Ávalos, M.D. Microglia Morphological Categorization in a Rat Model of Neuroinflammation by Hierarchical Cluster and Principal Components Analysis. Front. Cell Neurosci. 2017, 11, 235. [Google Scholar] [CrossRef] [PubMed]
- Morrison, H.; Young, K.; Qureshi, M.; Rowe, R.K.; Lifshitz, J. Quantitative microglia analyses reveal diverse morphologic responses in the rat cortex after diffuse brain injury. Sci. Rep. 2017, 7, 13211. [Google Scholar] [CrossRef]
- Gullo, F.; Maffezzoli, A.; Dossi, E.; Wanke, E. Short-latency cross- and autocorrelation identify clusters of interacting cortical neurons recorded from multi-electrode array. J. Neurosci. Methods 2009, 181, 186–198. [Google Scholar] [CrossRef]
- Gullo, F.; Mazzetti, S.; Maffezzoli, A.; Dossi, E.; Lecchi, M.; Amadeo, A.; Krawjeski, J.; Wanke, E. Orchestration of “presto” and “largo” synchrony in up-down activity of cortical networks. Front. Neural Circuits 2010, 4, 11. [Google Scholar] [CrossRef]


Publisher’s Note: MDPI stays neutral with regard to jurisdictional claims in published maps and institutional affiliations. |
© 2021 by the authors. Licensee MDPI, Basel, Switzerland. This article is an open access article distributed under the terms and conditions of the Creative Commons Attribution (CC BY) license (http://creativecommons.org/licenses/by/4.0/).
Share and Cite
D’Aloia, A.; Molteni, L.; Gullo, F.; Bresciani, E.; Artusa, V.; Rizzi, L.; Ceriani, M.; Meanti, R.; Lecchi, M.; Coco, S.; et al. Palmitoylethanolamide Modulation of Microglia Activation: Characterization of Mechanisms of Action and Implication for Its Neuroprotective Effects. Int. J. Mol. Sci. 2021, 22, 3054. https://doi.org/10.3390/ijms22063054
D’Aloia A, Molteni L, Gullo F, Bresciani E, Artusa V, Rizzi L, Ceriani M, Meanti R, Lecchi M, Coco S, et al. Palmitoylethanolamide Modulation of Microglia Activation: Characterization of Mechanisms of Action and Implication for Its Neuroprotective Effects. International Journal of Molecular Sciences. 2021; 22(6):3054. https://doi.org/10.3390/ijms22063054
Chicago/Turabian StyleD’Aloia, Alessia, Laura Molteni, Francesca Gullo, Elena Bresciani, Valentina Artusa, Laura Rizzi, Michela Ceriani, Ramona Meanti, Marzia Lecchi, Silvia Coco, and et al. 2021. "Palmitoylethanolamide Modulation of Microglia Activation: Characterization of Mechanisms of Action and Implication for Its Neuroprotective Effects" International Journal of Molecular Sciences 22, no. 6: 3054. https://doi.org/10.3390/ijms22063054
APA StyleD’Aloia, A., Molteni, L., Gullo, F., Bresciani, E., Artusa, V., Rizzi, L., Ceriani, M., Meanti, R., Lecchi, M., Coco, S., Costa, B., & Torsello, A. (2021). Palmitoylethanolamide Modulation of Microglia Activation: Characterization of Mechanisms of Action and Implication for Its Neuroprotective Effects. International Journal of Molecular Sciences, 22(6), 3054. https://doi.org/10.3390/ijms22063054