Article

Molecular Mechanisms and Tumor Biological Aspects of 5-Fluorouracil Resistance in HCT116 Human Colorectal Cancer Cells

1
Department of Biochemistry and Molecular Biology, Faculty of Pharmaceutical Sciences, Tokyo University of Science, 2641 Yamazaki, Noda, Chiba 278-8510, Japan
2
Department of Gene Regulation, Faculty of Pharmaceutical Sciences, Tokyo University of Science, 2641 Yamazaki, Noda, Chiba 278-8510, Japan
*
Author to whom correspondence should be addressed.
Int. J. Mol. Sci. 2021, 22(6), 2916; https://doi.org/10.3390/ijms22062916
Submission received: 1 February 2021 / Revised: 26 February 2021 / Accepted: 10 March 2021 / Published: 13 March 2021
(This article belongs to the Special Issue Targeted Cancer Therapy and Mechanisms of Resistance)

Abstract

:
5-Fluorouracil (5-FU) is a cornerstone drug used in the treatment of colorectal cancer (CRC). However, the development of resistance to 5-FU and its analogs remain an unsolved problem in CRC treatment. In this study, we investigated the molecular mechanisms and tumor biological aspects of 5-FU resistance in CRC HCT116 cells. We established an acquired 5-FU-resistant cell line, HCT116RF10. HCT116RF10 cells were cross-resistant to the 5-FU analog, fluorodeoxyuridine. In contrast, HCT116RF10 cells were collaterally sensitive to SN-38 and CDDP compared with the parental HCT16 cells. Whole-exome sequencing revealed that a cluster of genes associated with the 5-FU metabolic pathway were not significantly mutated in HCT116 or HCT116RF10 cells. Interestingly, HCT116RF10 cells were regulated by the function of thymidylate synthase (TS), a 5-FU active metabolite 5-fluorodeoxyuridine monophosphate (FdUMP) inhibiting enzyme. Half of the TS was in an active form, whereas the other half was in an inactive form. This finding indicates that 5-FU-resistant cells exhibited increased TS expression, and the TS enzyme is used to trap FdUMP, resulting in resistance to 5-FU and its analogs.

1. Introduction

Colorectal cancer (CRC) is the third-most common cancer in the world [1], and 5-Fluorouracil (5-FU) is the most important chemotherapeutic agent used in its treatment [2,3]. 5-FU is also widely used to treat other cancers, such as gastric, pancreatic, breast, ovarian, and head and neck cancers [2,3]. 5-FU is converted to 5-fluorodeoxyuridine monophosphate (FdUMP), which is a potent inhibitor of thymidylate synthase (TS) [3,4,5]. FdUMP forms a covalent complex with TS in the presence of 5,10-methylenetetrahydrofolate (CH2–THF) [2,3,5]. The inhibition of TS depletes the intracellular dTTP pool and subsequently inhibits DNA synthesis [2,3,4,5]. Another effect by which 5-FU can exert its cytotoxic action is its incorporation as fluorodeoxyuridine triphosphate (FdUTP) and fluorouridine triphosphate (FUTP) into DNA and RNA, respectively [2,3,4]. Experimental and clinical studies indicate that continuous exposure of CRC cells to 5-FU results in acquired resistance to 5-FU and its derivatives. This is often caused by common cancer resistance mechanisms, such as drug inactivation, drug efflux, drug target alterations, bypass pathway activation, DNA damage repair, and cell death [2,3]. 5-FU resistance is correlated with the level of TS protein and enzymatic activity in cancer cells [2,3,6,7,8]. In addition, high TS protein and RNA expression levels in tumor tissue is also a useful biomarker for poor prognosis for 5-FU-based chemotherapy in CRC patients [2,3,9]. Furthermore, 5-FU sensitivity is influenced by the expression levels of dihydropyrimidine dehydrogenase (DPD) [9,10], which converts 5-FU to dihydrofluorouracil (DHFU) during the catabolic process [2,3,4,9,10]. However, 5-FU resistance has not yet been circumvented clinically.
In this study, we established a 5-FU-resistant HCT116 CRC cell line (HCT116RF3 and HCT116RF10) and analyzed its biological features. HCT116RF10 cells, which are cross-resistant to the 5-FU analog fluorodeoxyuridine (FUdR), were collaterally sensitive to SN-38 and CDDP compared with the parental HCT16 cells. In addition, HCT116RF10 cells exhibited a lower ability to form tumor spheres compared with parental HCT116 cells. Notably, HCT116RF10 cells maintained the tumor sphere formation ability compared with HCT116 cells under 5-FU exposure conditions. Furthermore, a gene cluster associated with 5-FU metabolic pathway was not significantly mutated in HCT116 and HCT116RF10 cells as determined by whole-exome sequencing. We found that HCT116RF10 cells regulate intracellular TS states in which half of the TS enzyme is in a functional form and the other half exists as an FdUMP-covalent complex (inactive form). These findings provide a better understanding of resistance to anticancer 5-FU and its analogs.

2. Results

2.1. Establishment of the 5-Fluorouracil-Resistant HCT116 Cells

To elucidate the mechanisms underlying resistance to 5-FU, we generated a variant of the HCT116 human colorectal cancer cell line that was resistant to 5-FU, an important anticancer drug used for CRC treatment [2,3]. We established 5-FU-resistant HCT116RF3 or HCT116RF10 cells by repeated exposure of parental HCT116 cells to stepwise increasing concentrations of 5-FU over a period of approximately 12 weeks at 3 μM and 14 weeks at 10 μM, respectively (Figure 1a). The EC50 of 5-FU in HCT116RF3 (intermediate variant) and HCT116RF10 cells were determined by a WST-8 assay after continuous exposure for 72 h. As shown in Table 1 and Figure 1b, the EC50 value of the 5-FU-resistant HCT11 6 cells was higher (1.5 × 10⁻⁵ M in HCT116RF3 and 2.9 × 10⁻⁵ M in HCT116RF10 cells) than that of sensitive, parental HCT116 cells (5.1 × 10⁻⁶ M). The RI was approximately 2.9 for HCT116RF3 cells and 5.7 for HCT116RF10 cells (Table 1). In addition, similar results were obtained by colony formation assay (Figure 1c,d). The EC50 value of 5-FU-resistant HCT116 cells was significantly higher (1.6 × 10⁻⁵ M in HCT116RF3 and 3.8 × 10⁻⁵ M in HCT116RF10 cells) than that of the parental HCT116 cells (5.5 × 10⁻⁶ M) (Table 1). The RI of HCT116RF3 and HCT116RF10 cells was approximately 2.9 and 6.9, respectively (Table 1). Furthermore, parental HCT116, HCT116RF3, and HCT116RF10 cells exhibited nearly similar morphological features (Figure 1e).

2.2. Anticancer Drug Response of the 5-FU-Resistant HCT116 Cells

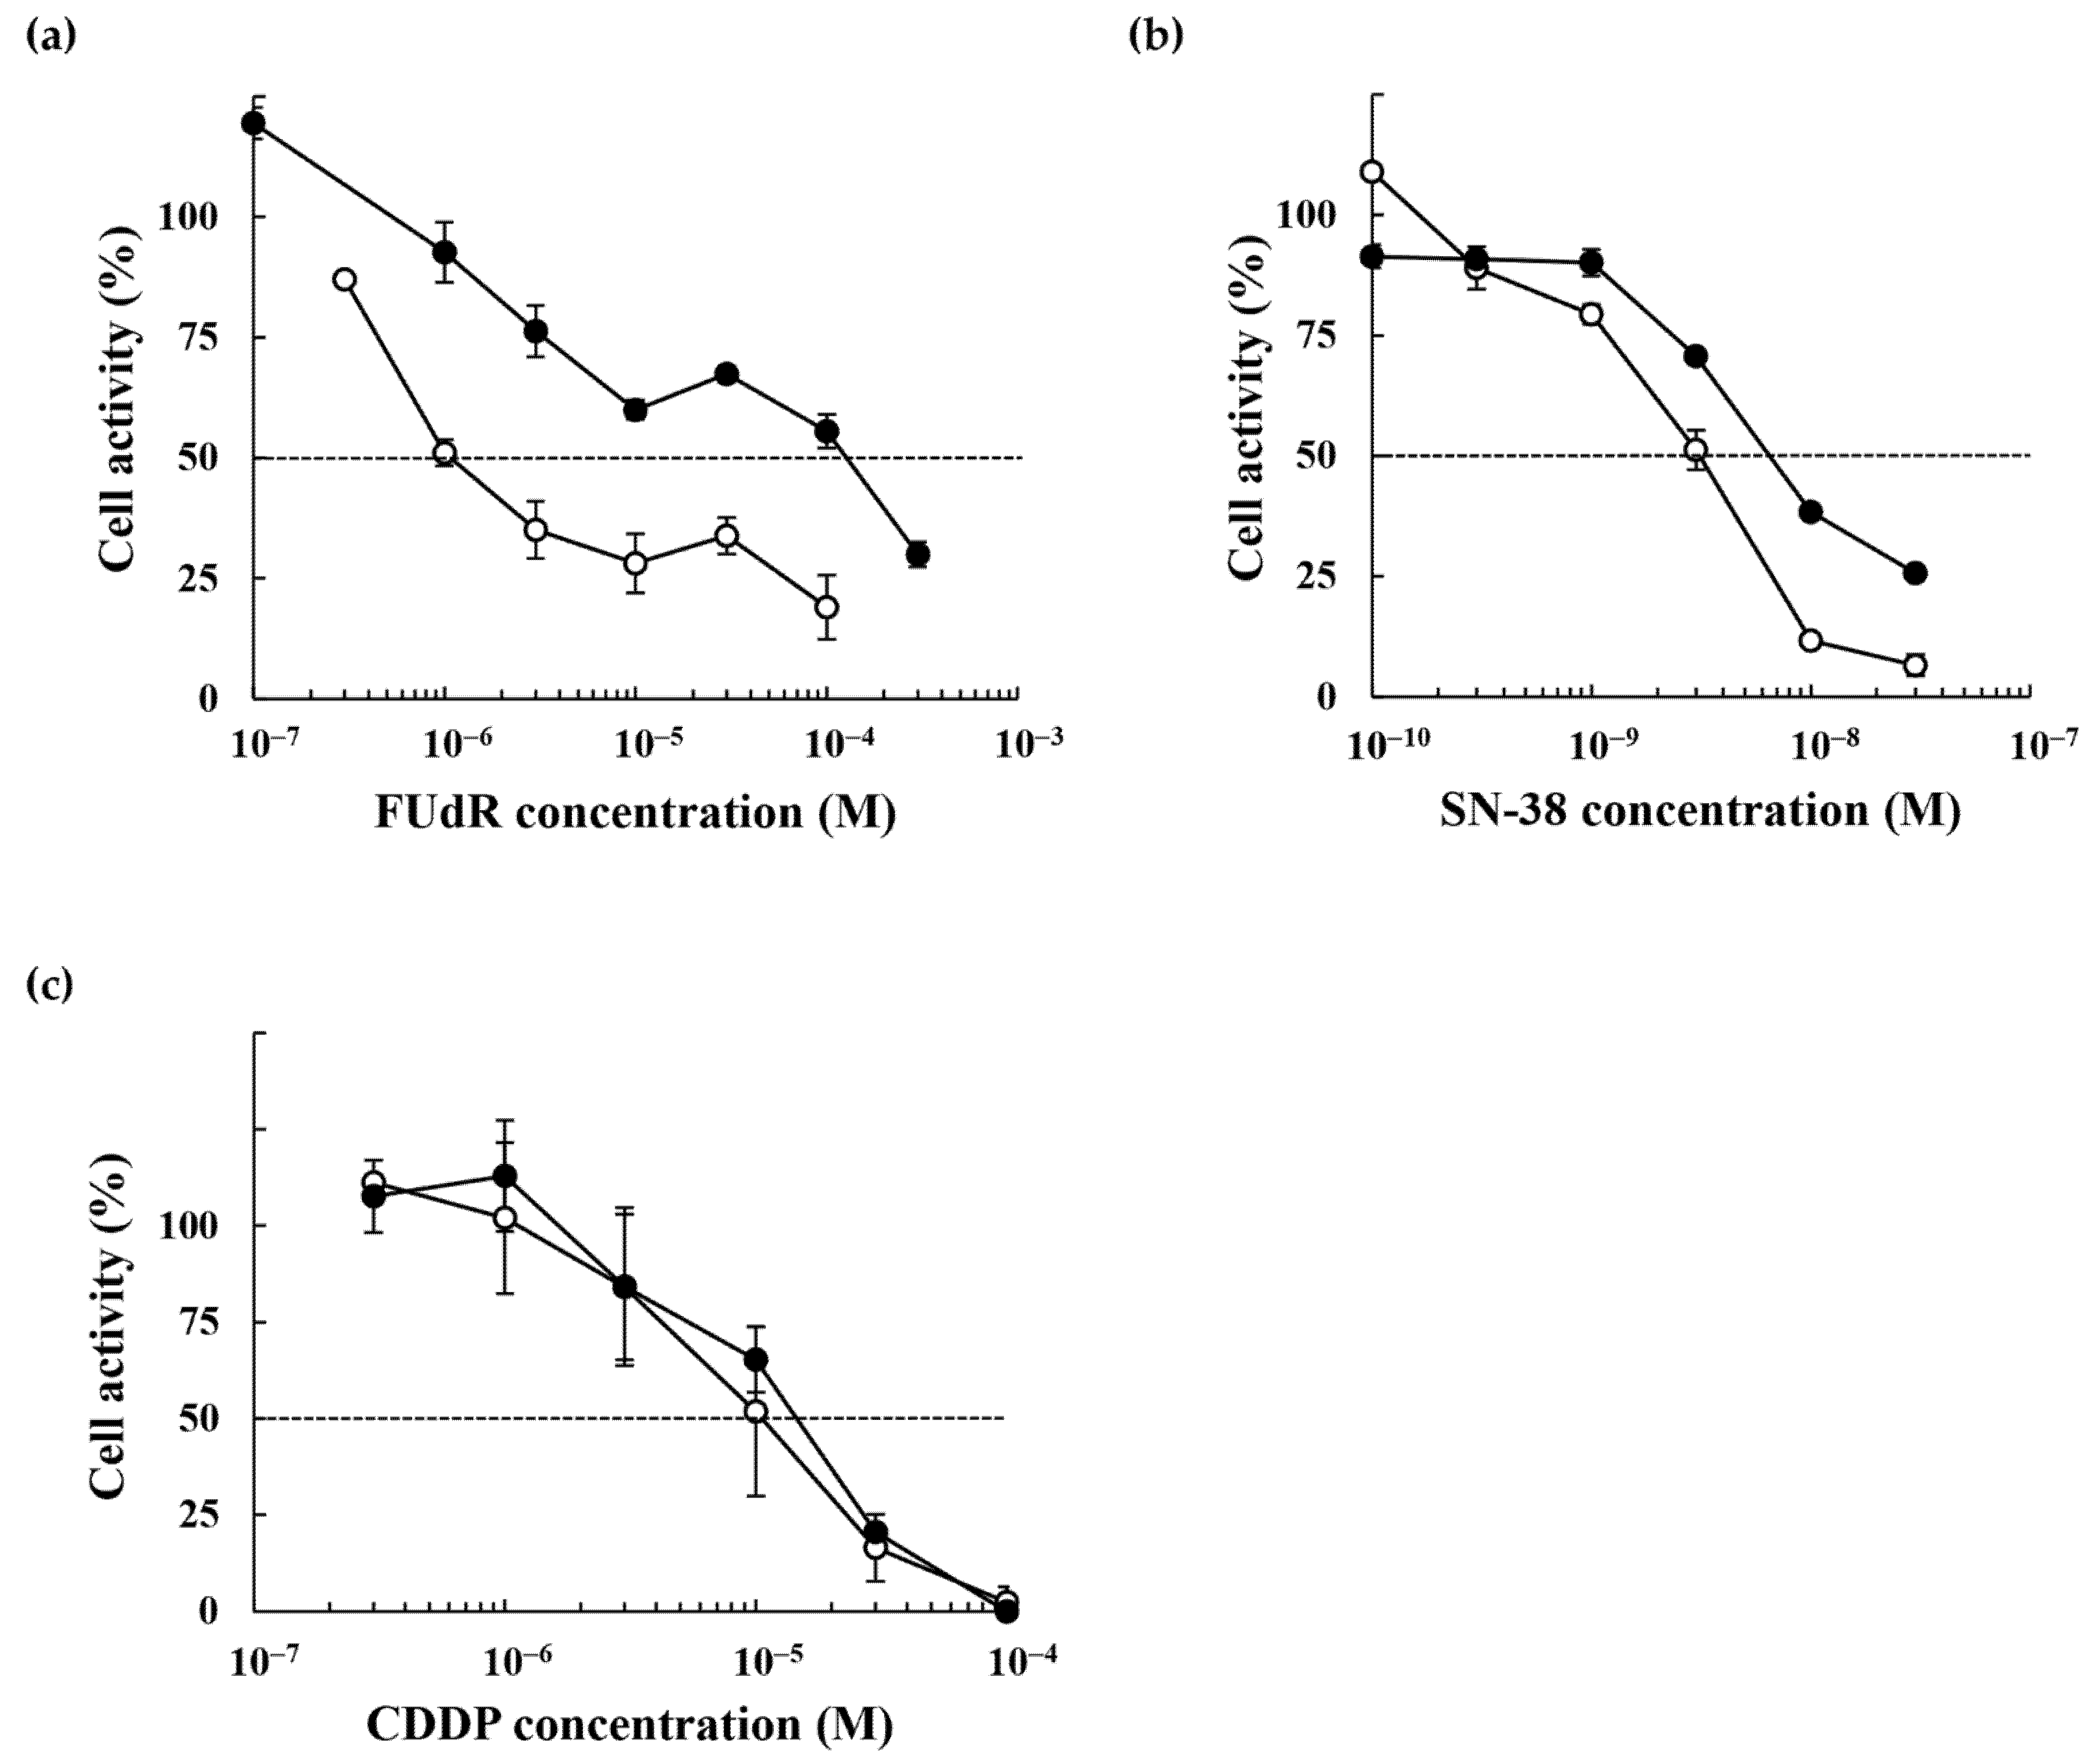
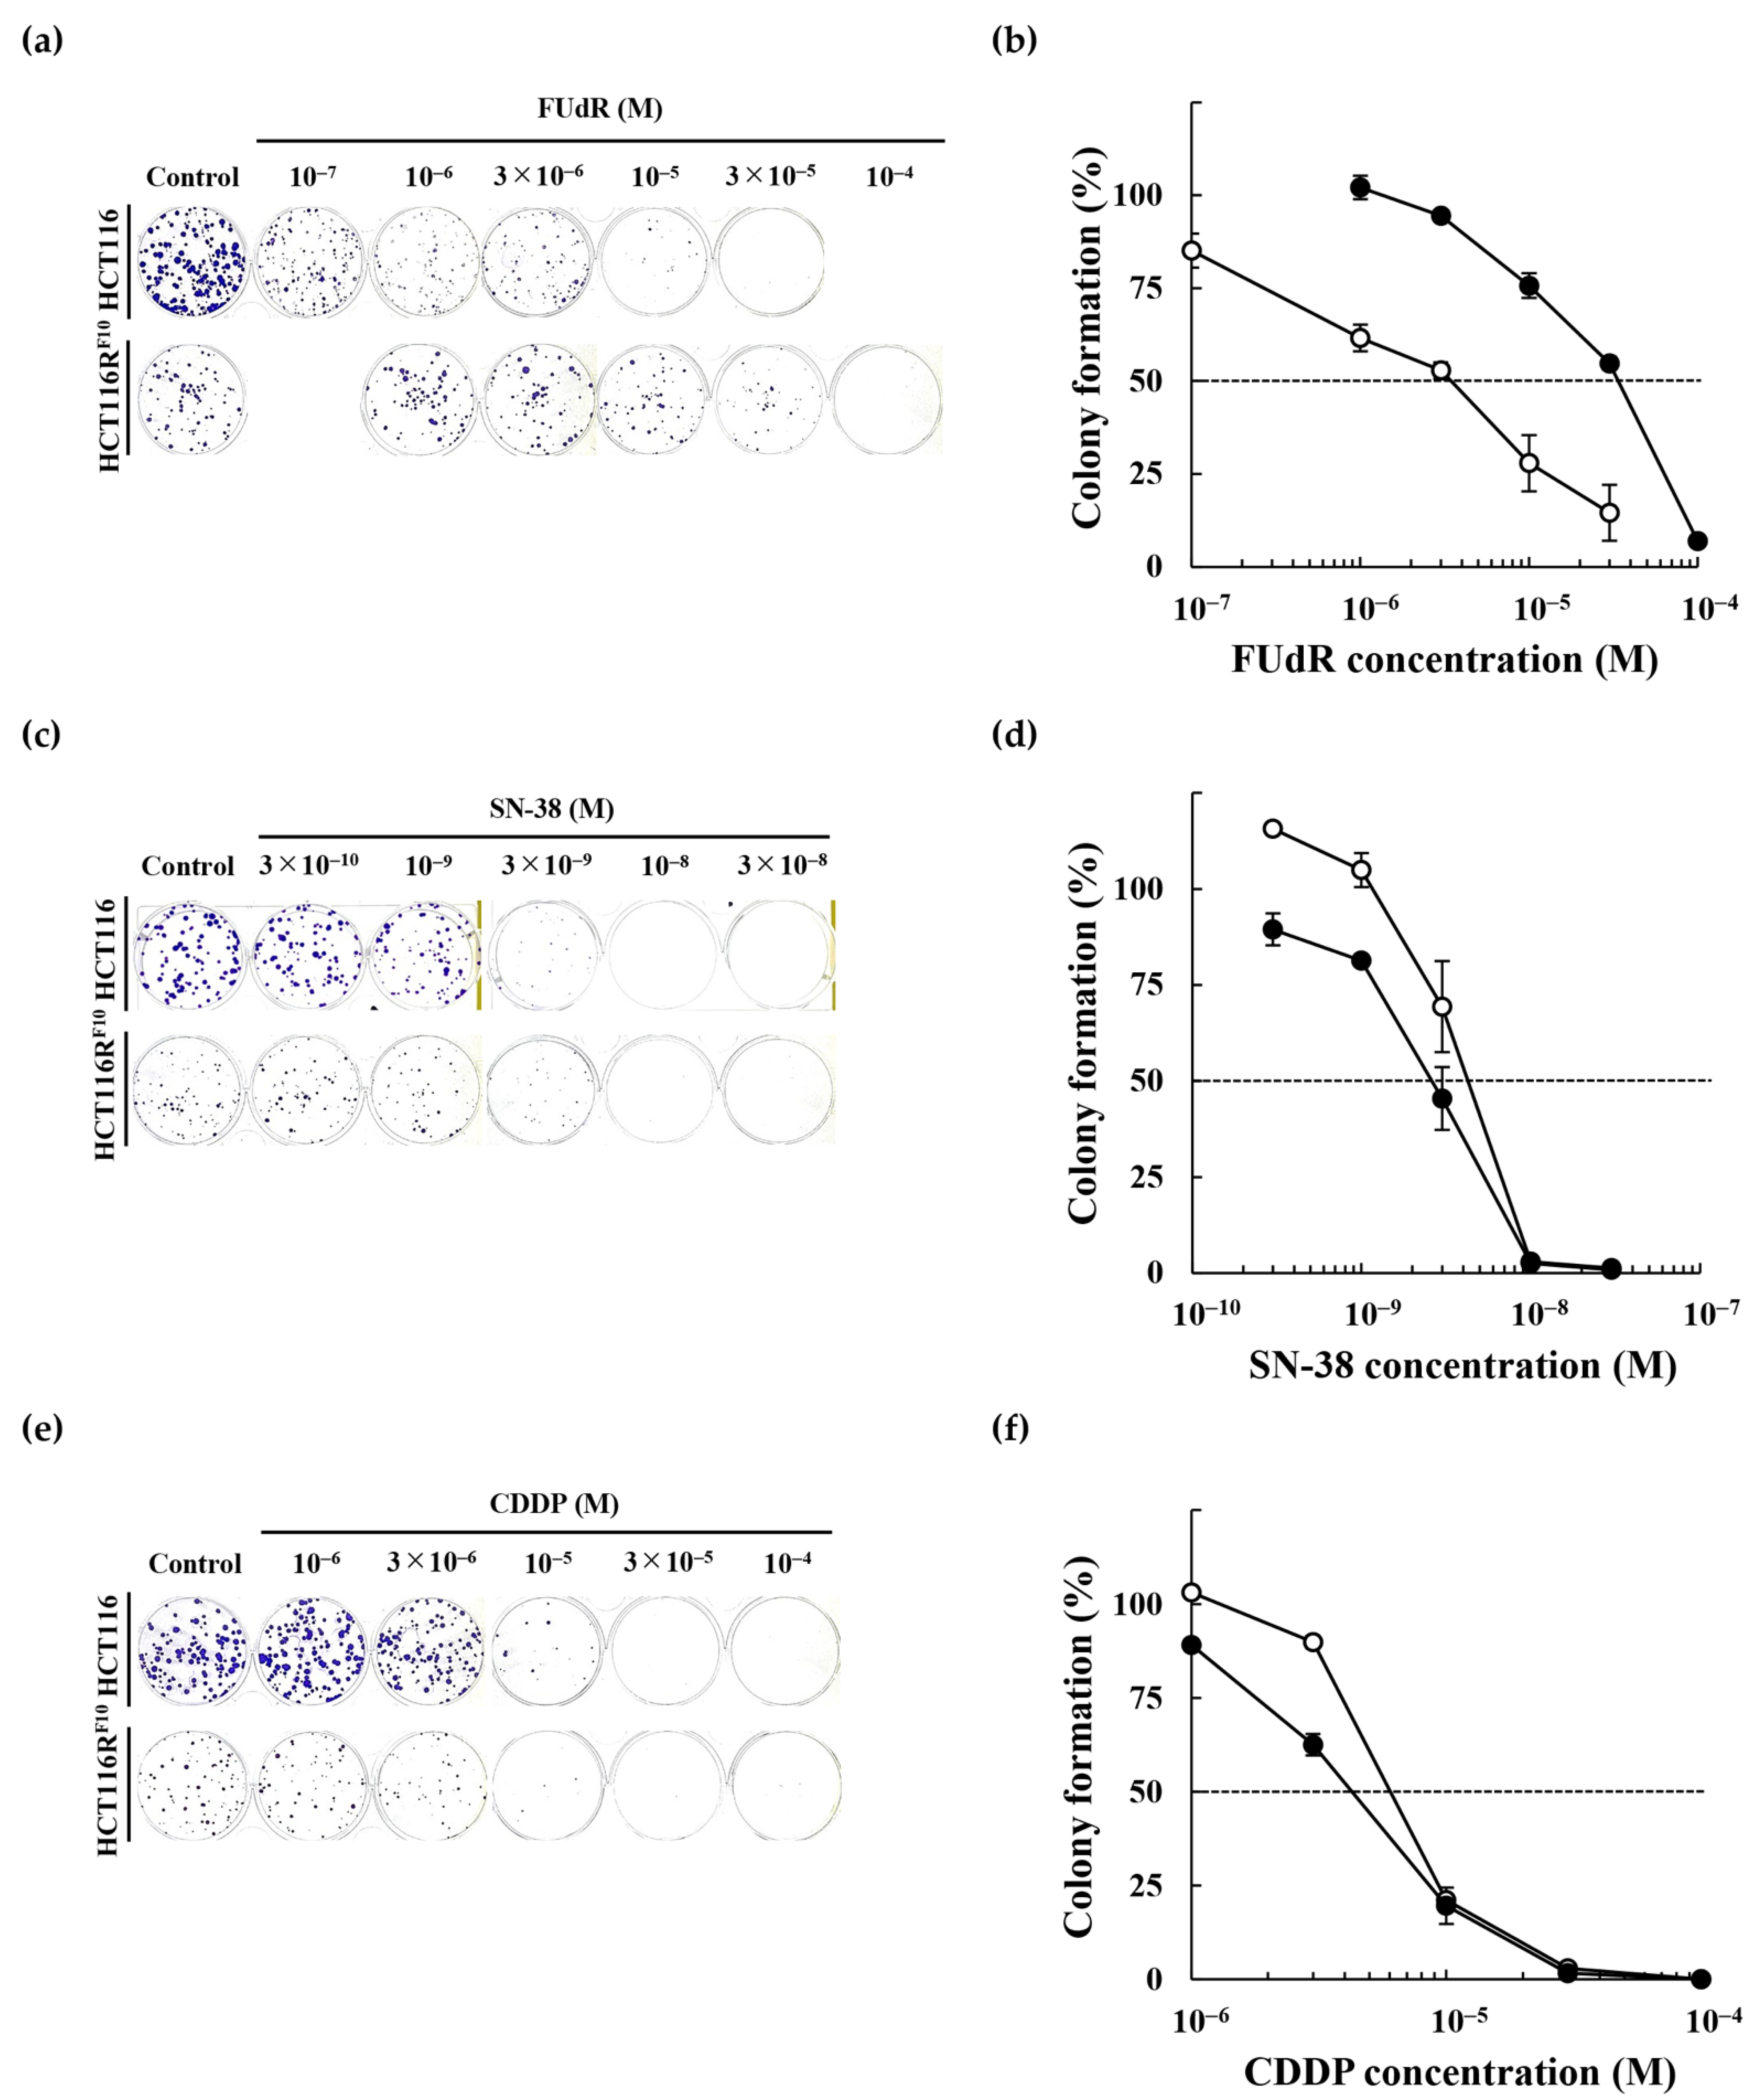
We examined the effects of several anticancer drugs, including the 5-FU analog FUdR, SN-38, an active metabolite of irinotecan, and CDDP, on the proliferation of parental HCT116 and 5-FU-resistant HCT116RF10 cells by WST-8 (Figure 2) and colony formation assays (Figure 3). As shown in Table 2 and Figure 2a, HCT116RF10 cells were 80.0-fold (EC50 = 1.2 × 10⁻⁴ M) more resistant to FUdR than parental HCT116 cells (EC50 = 1.5 × 10⁻⁶ M). In contrast, the resistant index for SN-38 and CDDP was 2.1-fold (EC50 = 6.6 × 10⁻⁹ M in HCT116RF10 cells; 3.1 × 10⁻⁹ M in HCT116 cells) and 1.4-fold (EC50 = 1.4 × 10⁻⁵ M in HCT116RF10 cells; 1.0 × 10⁻⁵ M in HCT116 cells), respectively (Table 2, Figure 2b,c). Similarly, for the colony-forming assay, HCT116RF10 cells were 9.7-fold (EC50 = 3.3 × 10⁻⁵ M) more resistant to FUdR than the parental HCT116 cells (EC50 = 3.4 × 10⁻⁶ M) (Figure 3a). In addition, the RI of SN-38 and CDDP was 0.7-fold (EC50 = 3.0 × 10⁻⁹ M in HCT116RF10 cells; 4.2 × 10⁻⁹ M in HCT116 cells) and 0.9-fold (EC50 = 4.5 × 10⁻⁶ M in HCT116RF10 cells; 5.2 × 10⁻⁶ M in HCT116 cells), respectively (Table 2, Figure 3b,c). These results indicate that 5-FU-resistant HCT116RF10 cells exhibit cross-resistance to FUdR but collateral sensitivity to the anticancer drugs SN-38 and CDDP. This finding suggests that the HCT116RF10 cells are resistant not only to 5-FU but also to other 5-FU deoxyribose analogs such as FUdR.

2.3. Biological Features of the 5-FU-Resistant HCT116 Cells

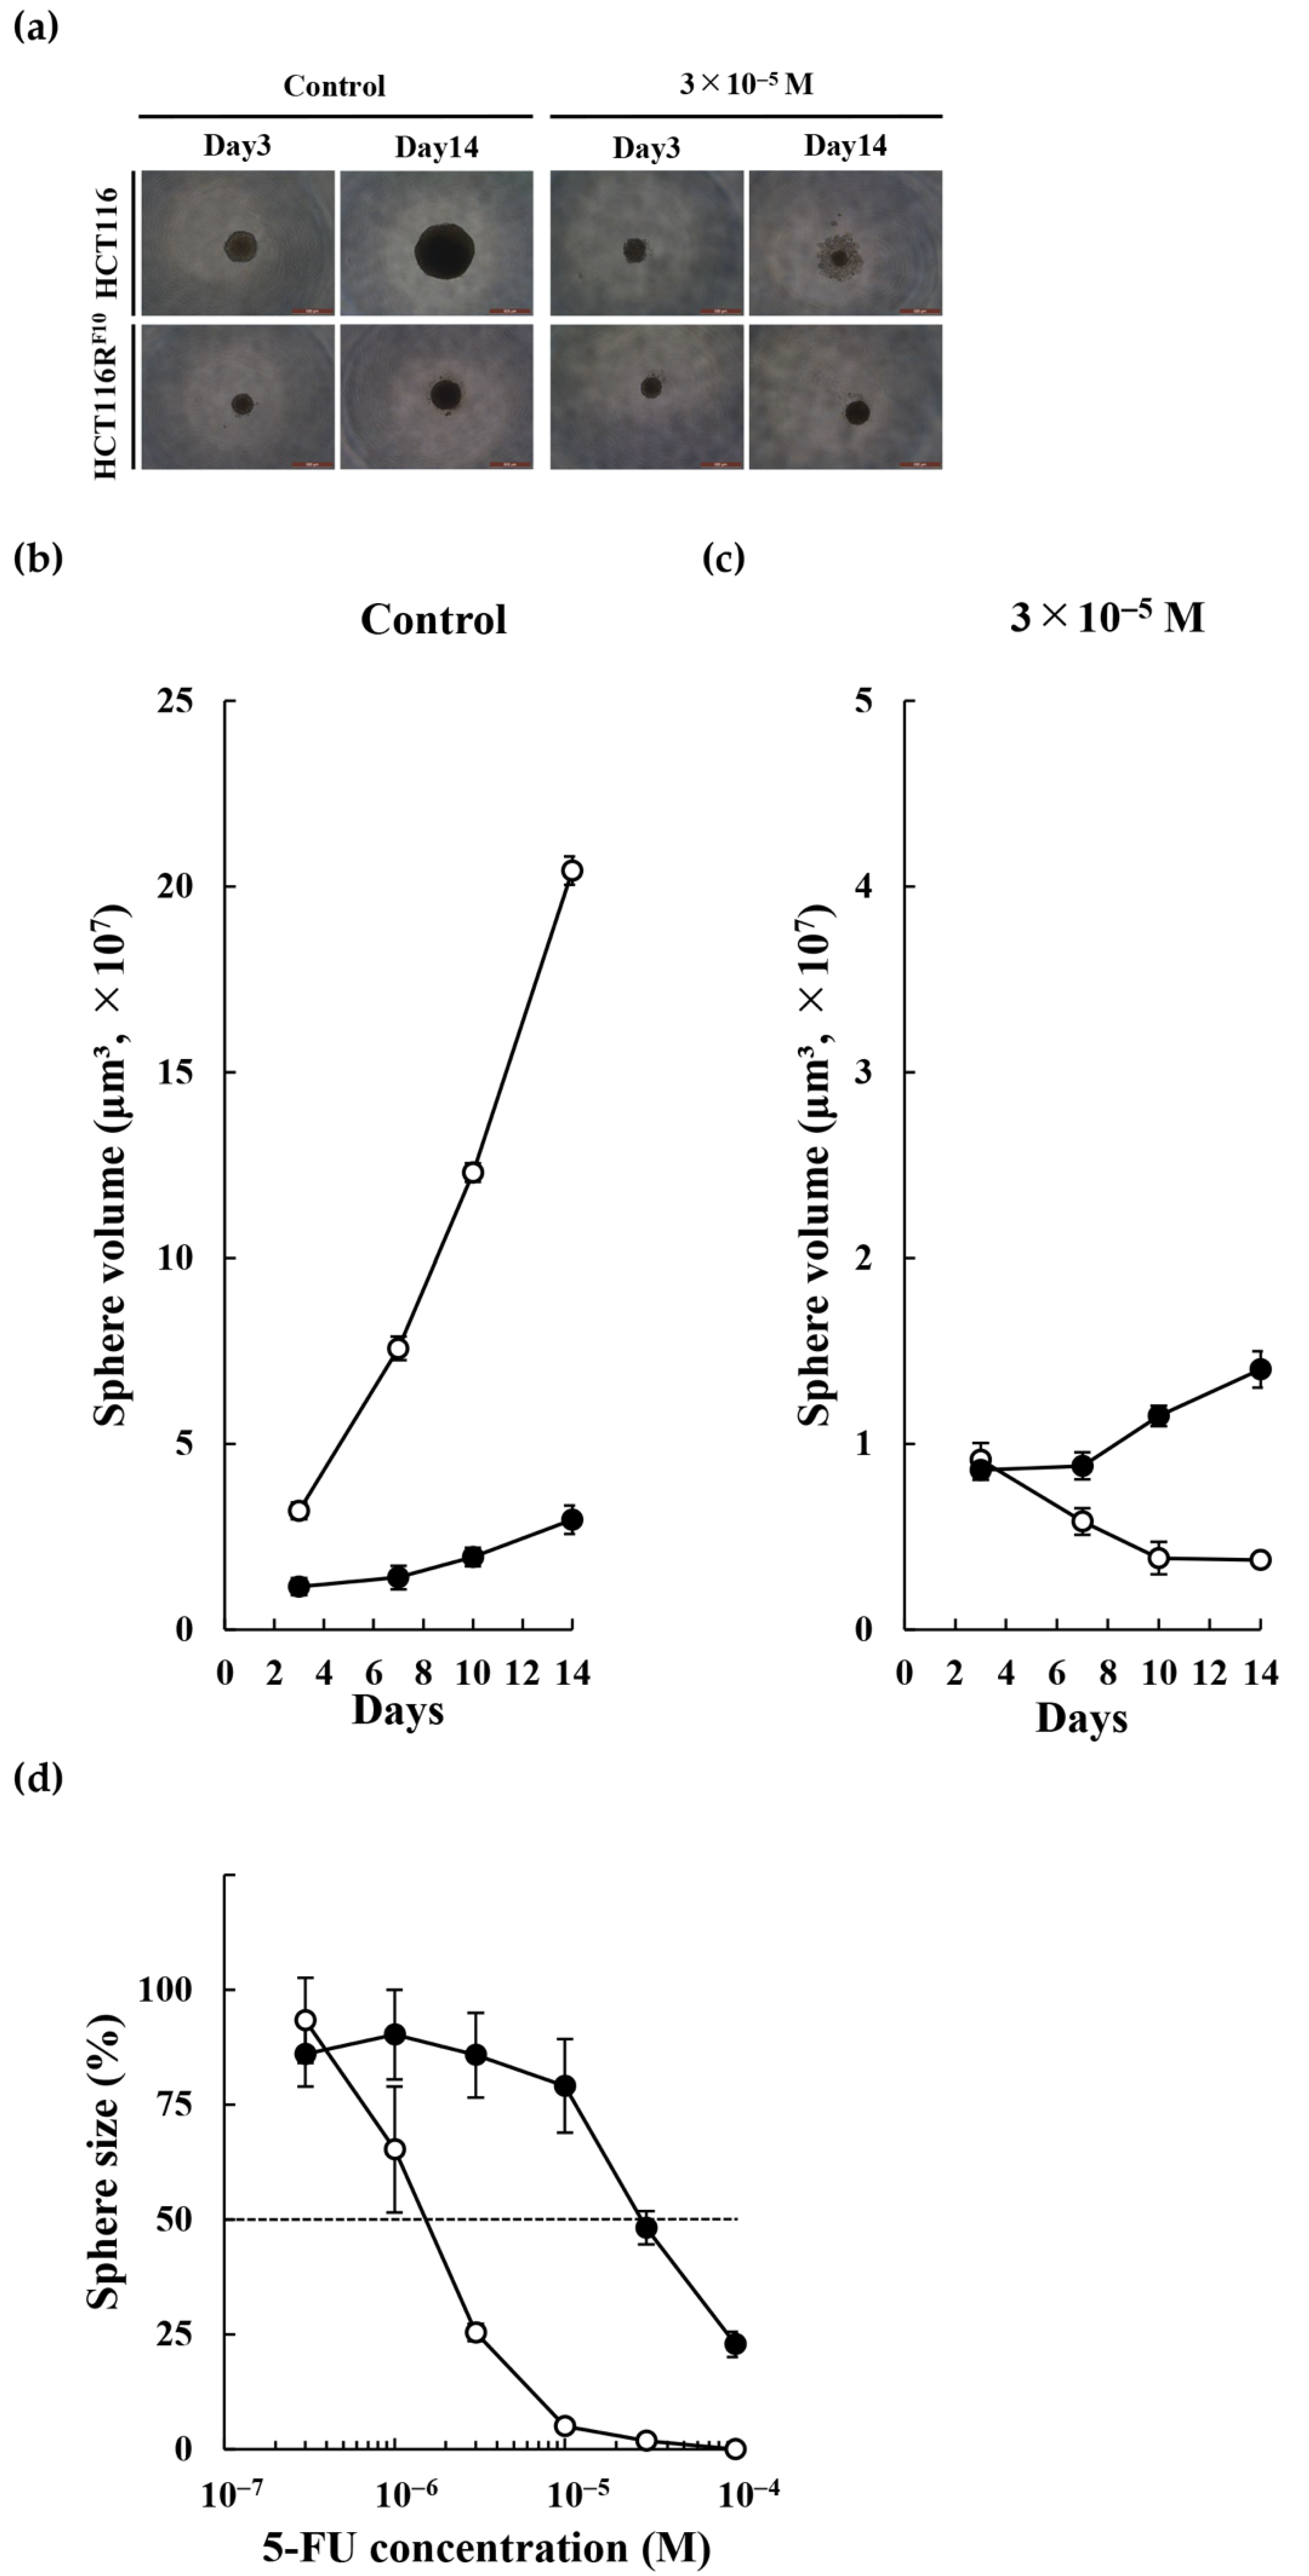
We analyzed the tumor sphere formation ability of HCT116RF10 cells and parental HCT116 cells in three-dimensional cell culture experiments (Figure 4). HCT116RF10 cells exhibited a lower ability to form tumor spheres compared with parental HCT116 cells under untreated conditions (Figure 4a left panel and b). Interestingly, HCT116RF10 cells maintained a tumor sphere formation ability compared with parent HCT116 cells during 5-FU treatment conditions (Figure 4a,c). We next examined the sensitivity of parental HCT116 and HCT116RF10 tumor sphere cells to 5-FU. As shown in Figure 4d, HCT116RF10 cells were 18.7-fold (EC50 = 2.8 × 10⁻⁵ M) more resistant to 5-FU than parental HCT116 cells (EC50 = 1.5 × 10⁻⁶ M). These data indicate that 5-FU-resistant HCT116RF10 cells are less prone to tumorigenesis than sensitive, parental HCT116 cells, but formed tumor spheres that retained a higher 5-FU resistance.

2.4. Exome Sequencing Analysis of HCT116 Parent Cells and 5-FU-Resistant HCT116RF10 Cells

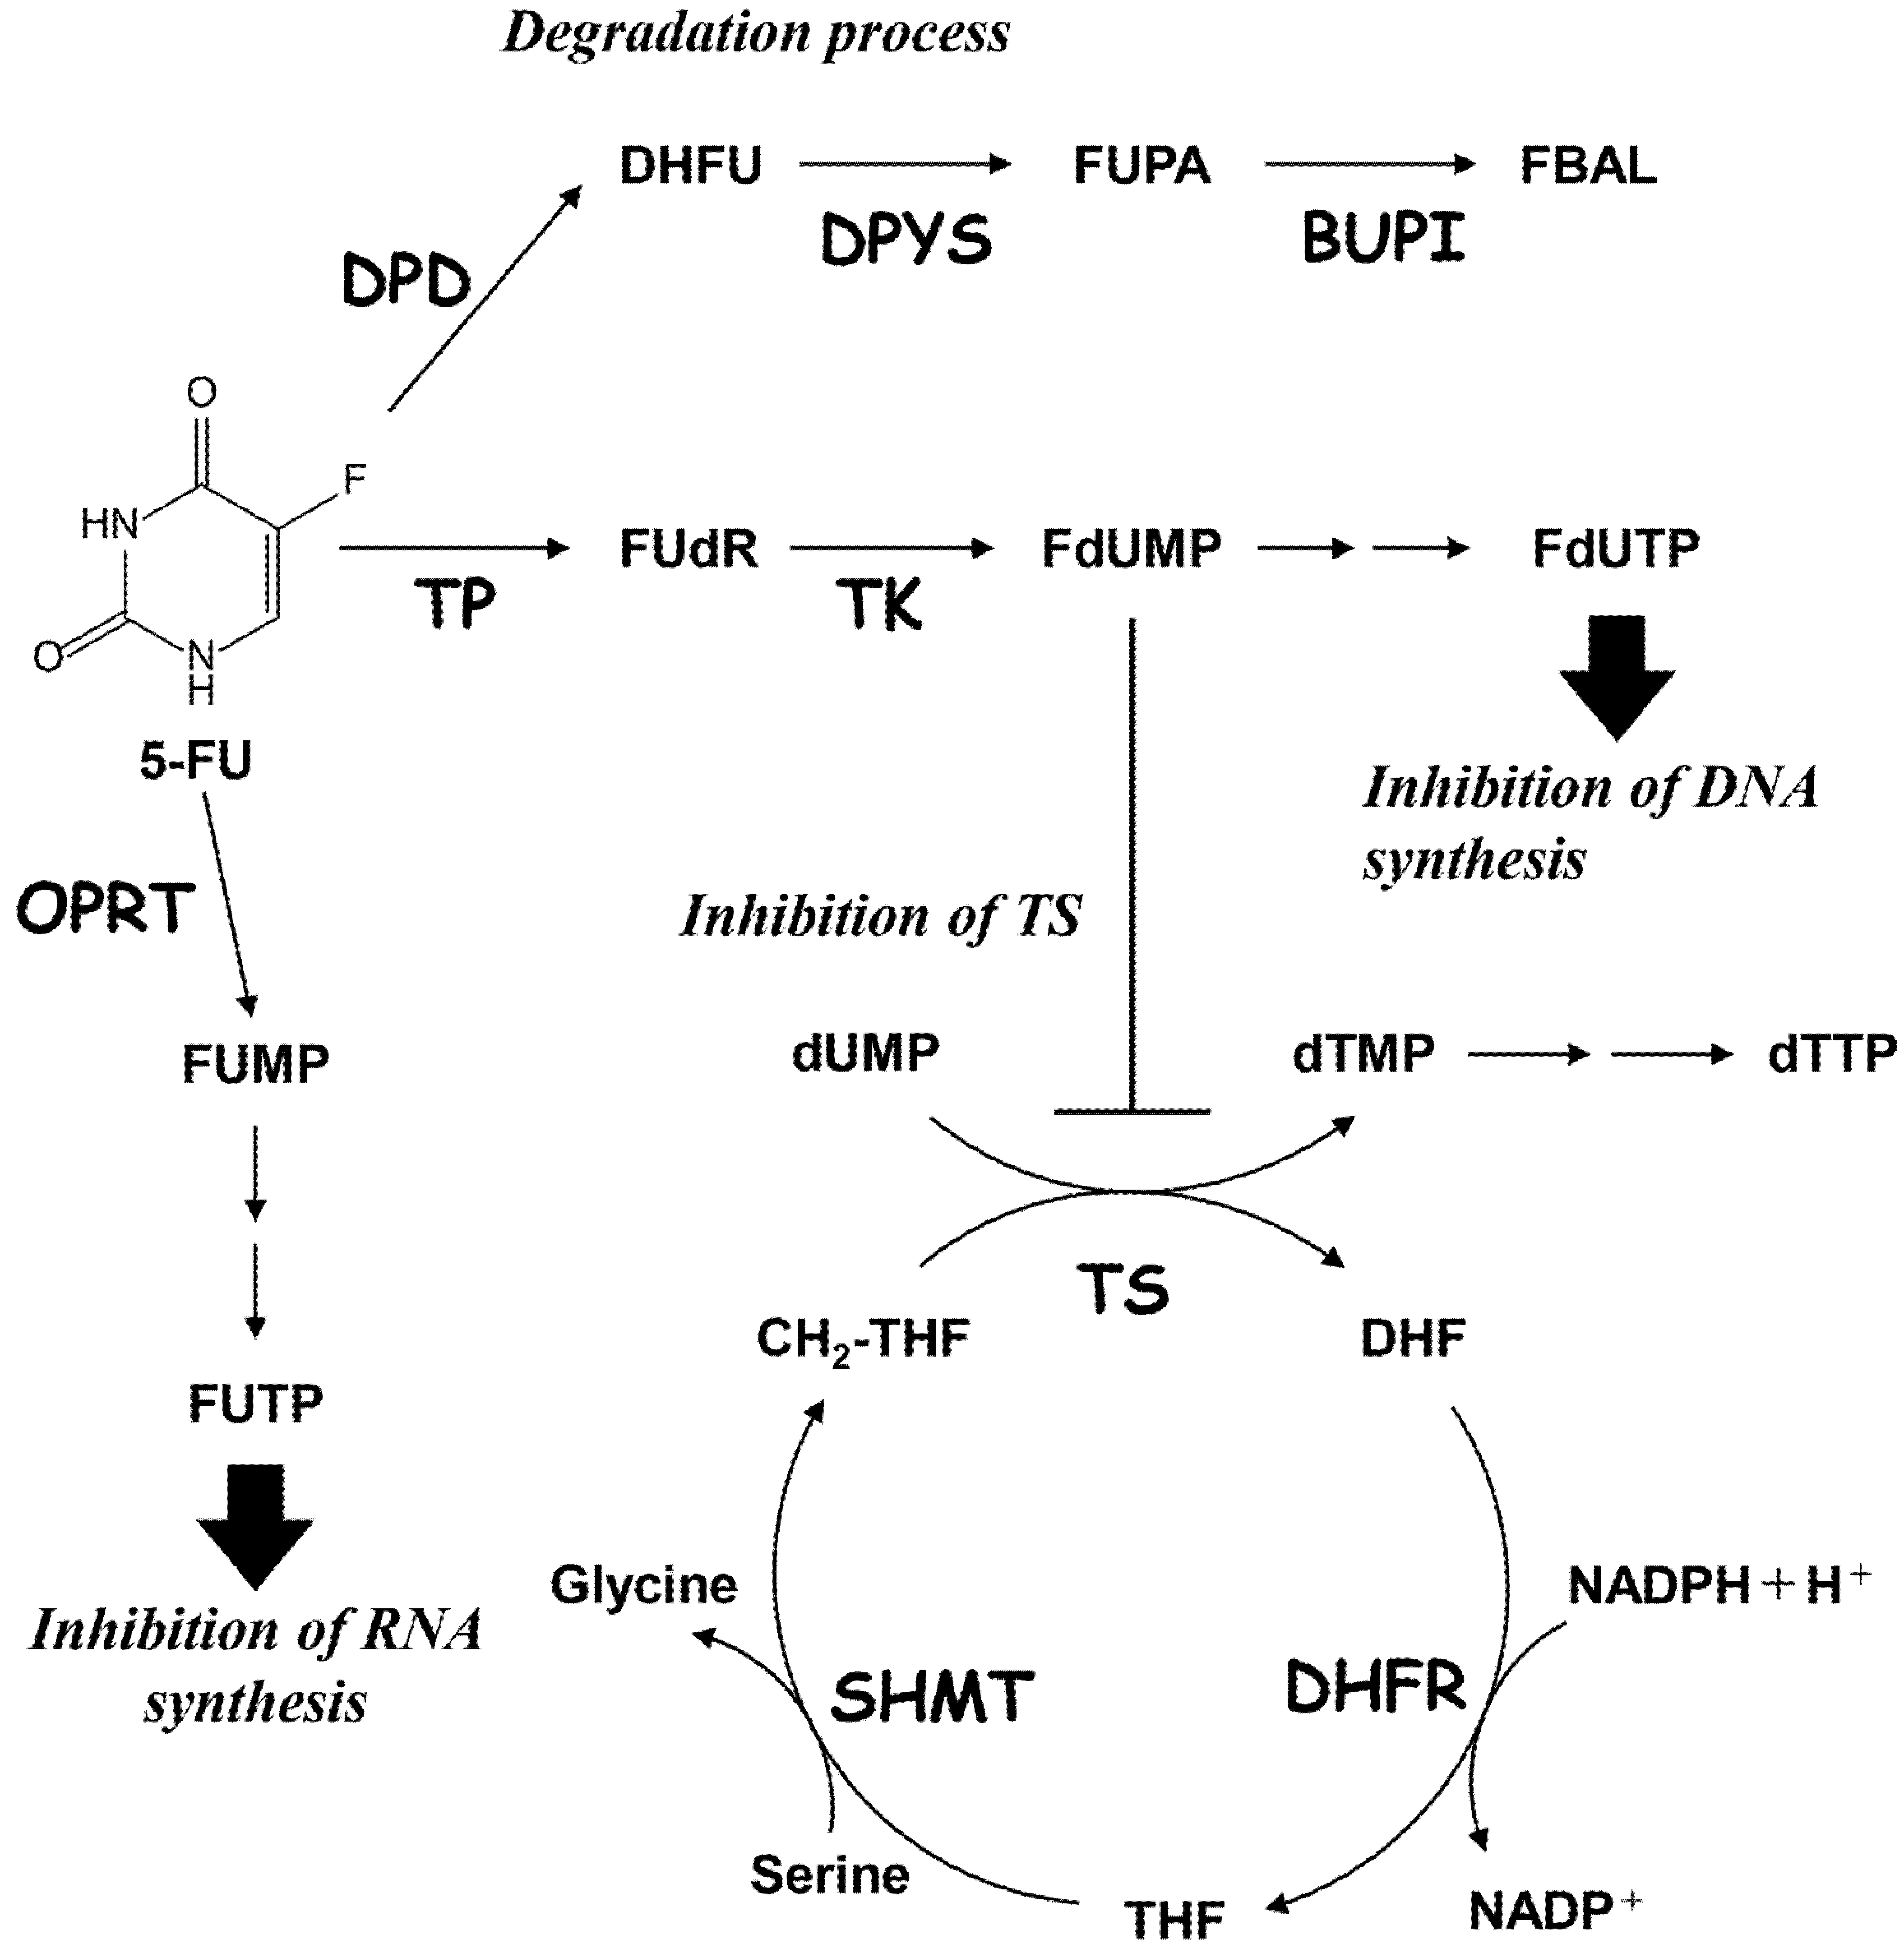
We analyzed variants of 5-FU metabolic pathway-related enzyme genes, including TYMS, which encodes for TS, and DPYD, which encodes for DPD in HCT116 and HCT116RF10 cells. TS is a major intracellular target of 5-FU, whereas DPD catalyzes the rate-limiting step in the catabolism of 5-FU [2,3,11]. The pathways involved in the metabolism of 5-FU and its analog FUdR are shown in Figure 5. The genetic alteration status of nearly all of the 5-FU metabolic pathway-related genes was of similar status in both cells. Importantly, the variants of TYMS and DPYD in HCT116 and HCT116RF10 cells contained heterozygous mutations or intron variants. We identified two TYMS intron variants, 454+197_454+202delTTTTTT and 454+199_454+202delTTTT, in HCT116RF10 cells. In contrast, only one TYMS intron variant, 454+200_454+202delTTT, was present in sensitive parental HCT116 cells. Similarly, the three DPYD variants, 2999A>T, 2623-59T>G, and 2442+78delA, were present in the HCT116RF10 cells. In addition, three DPYD variants, 2442+77_2442+delAA, 40-461delT, and -113T>C, were present in HCT116 cells. Herein, we show that one of the DPYD heterozygous variants, 2999A>T, is a missense mutation (Asp1000Val) in DPD of 5-FU-resistant HCT116RF10 cells.

2.5. Regulation of TS and DPD in HCT116 Parent Cell and 5-FU-Resistant HCT116RF10 Cells

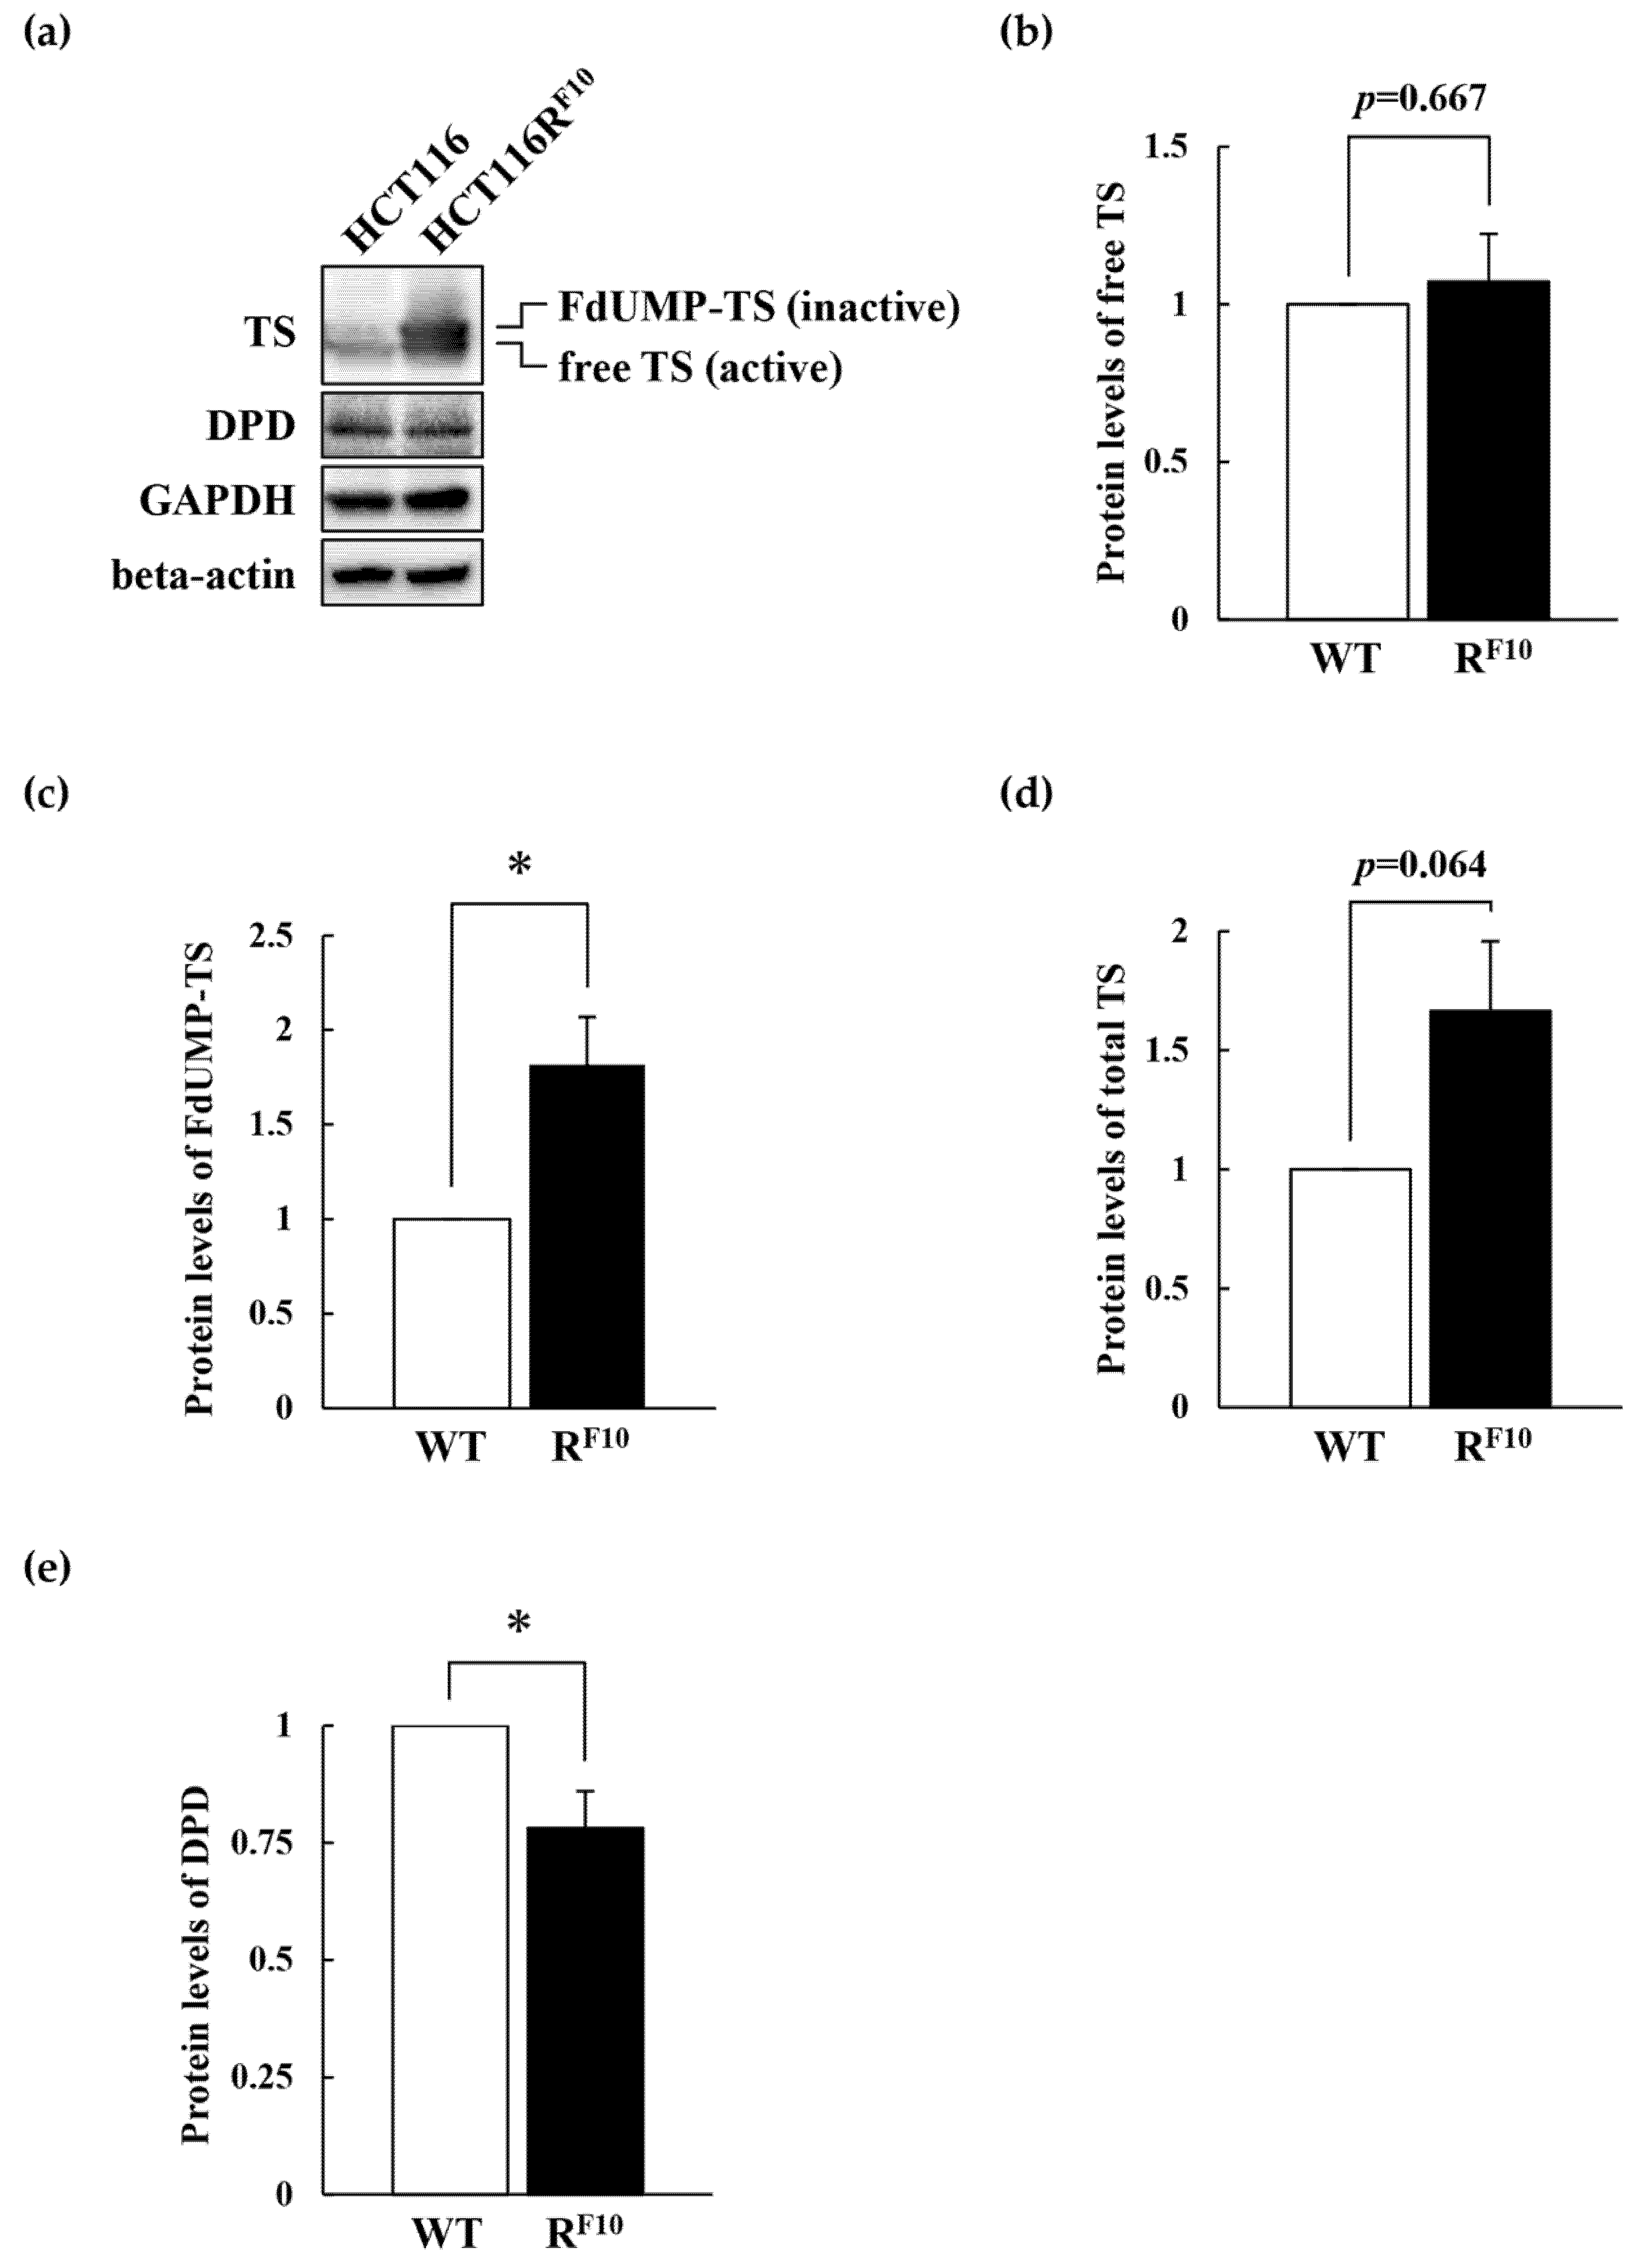
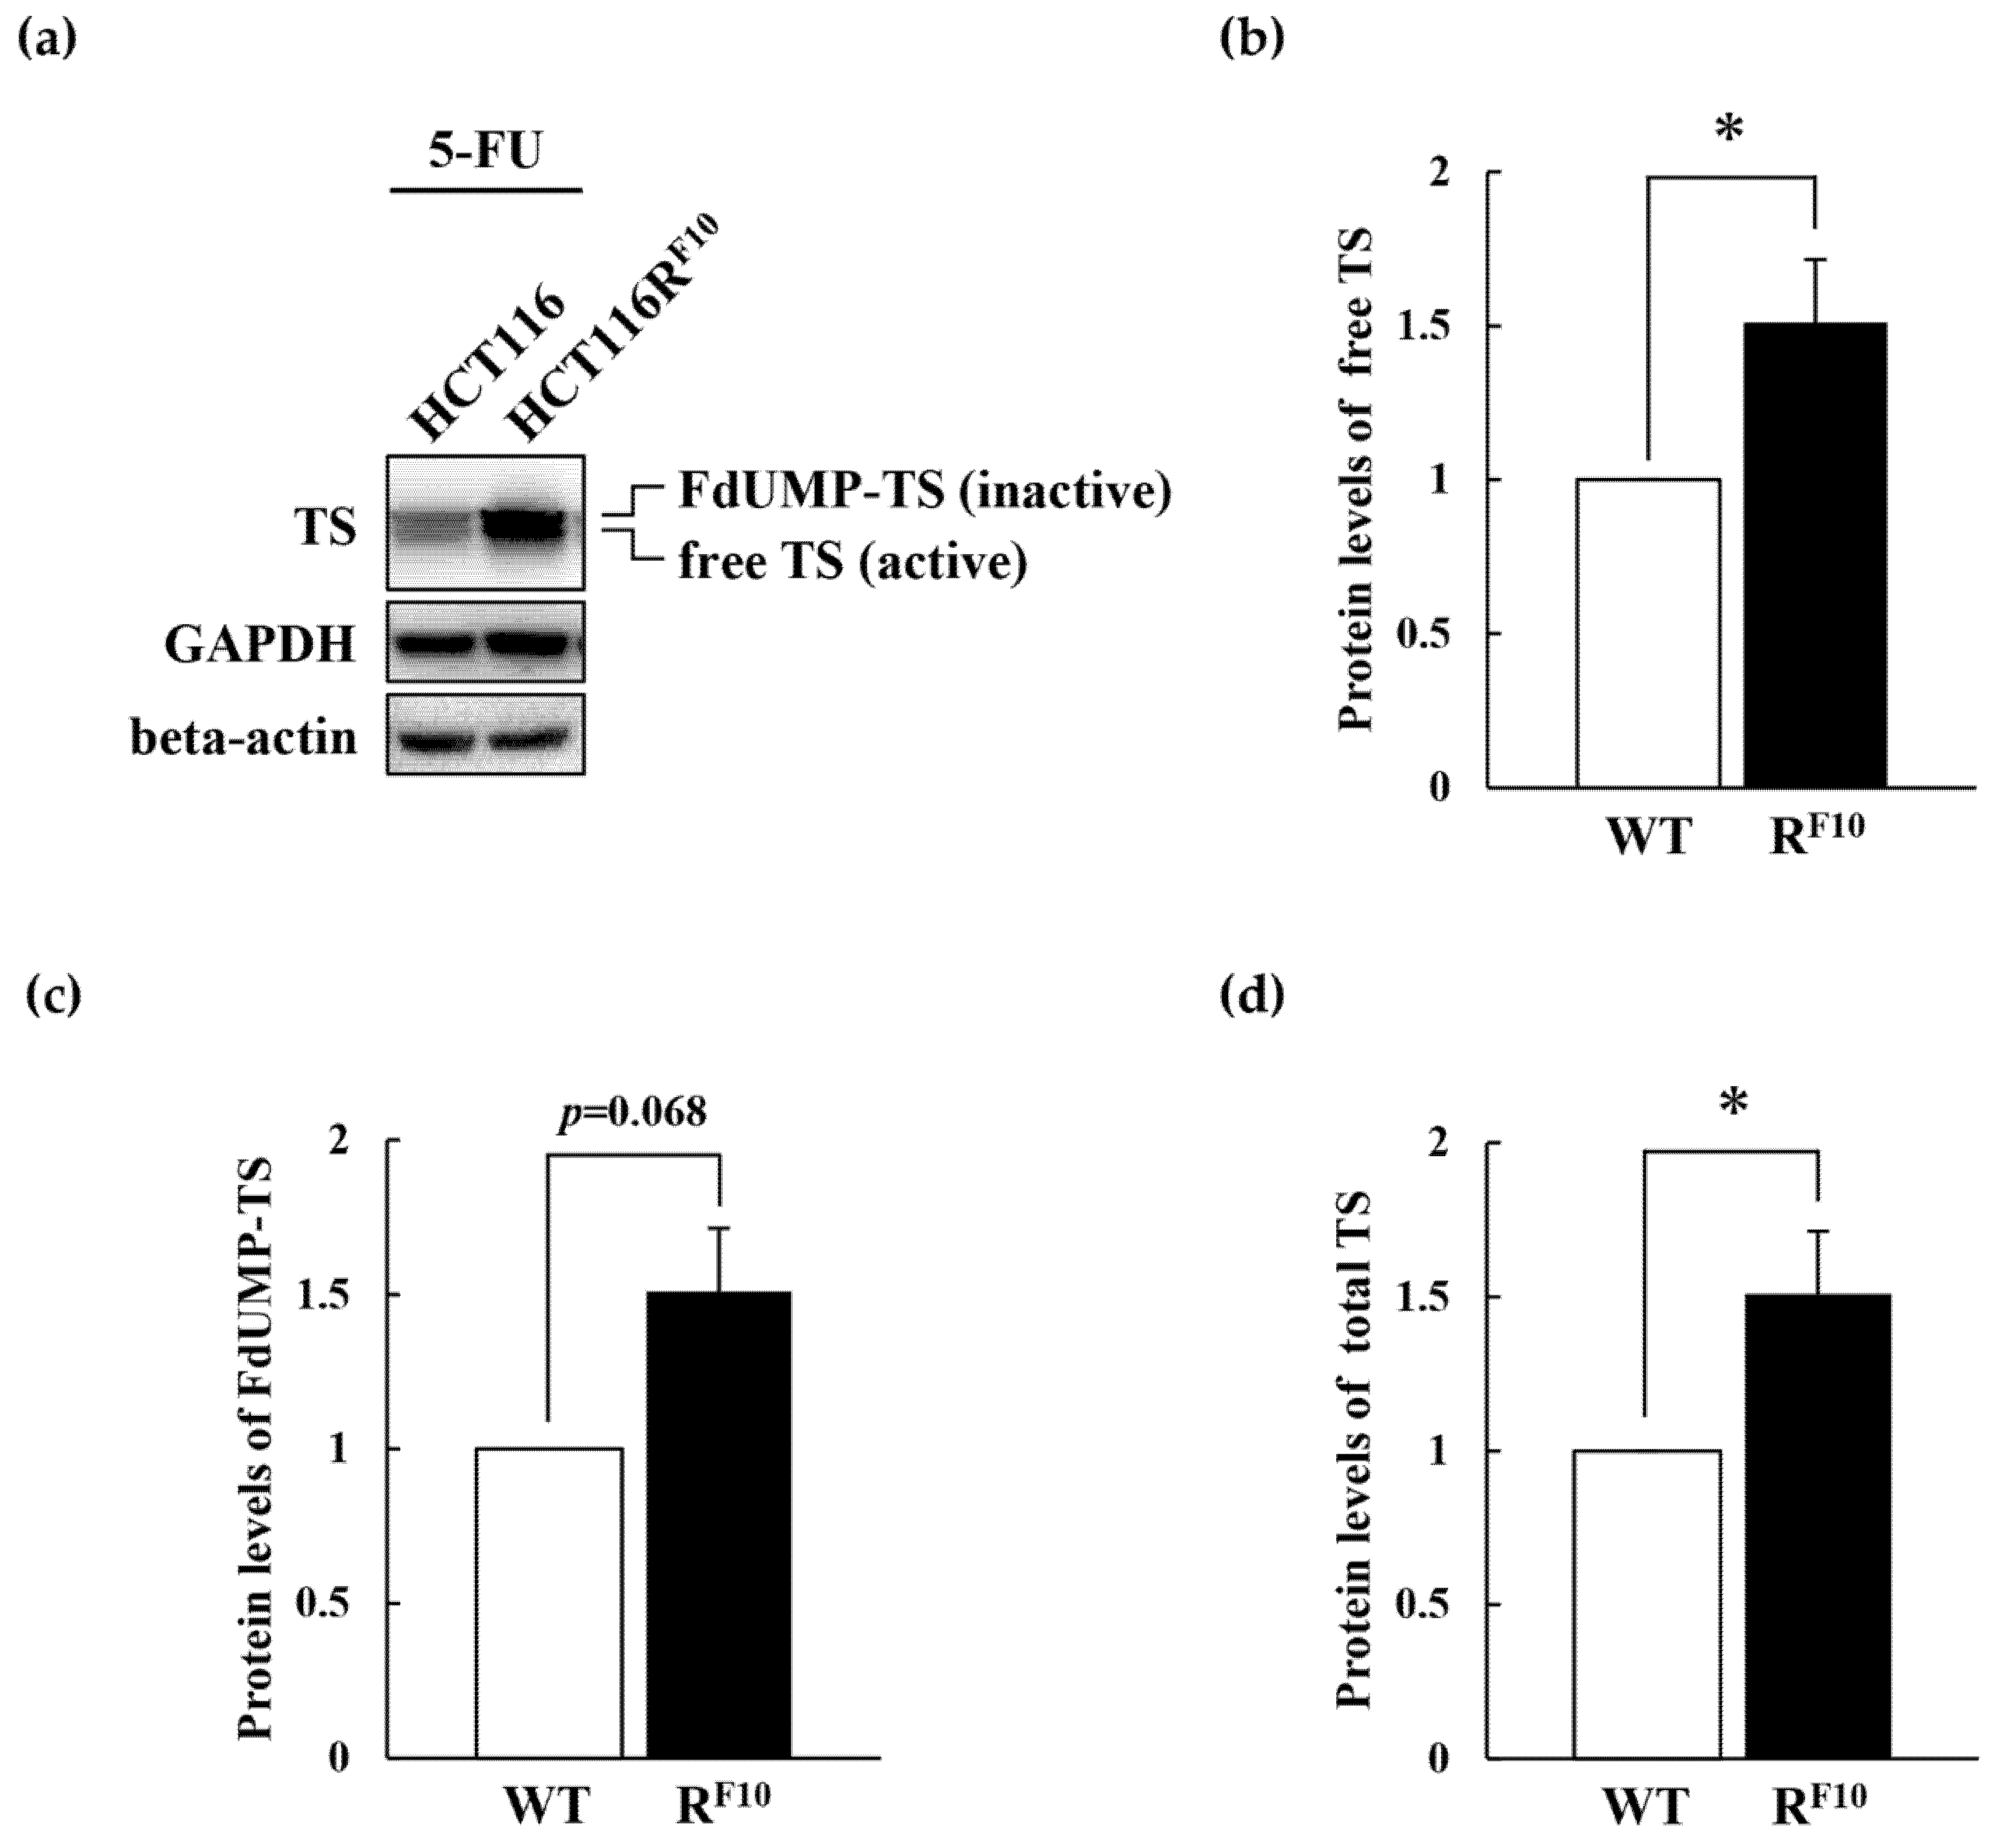
To elucidate the association of TS and DPD expression with 5-FU resistance, we analyzed TS and DPD expression levels in parental HCT116 and 5-FU-resistant HCT116RF10 cells by Western blot analysis (Figure 6a). Interestingly, as shown in Figure 6a (top panel) and 6b, free-TS protein levels were almost identical in HCT116RF10 and HCT116 cells. Conversely, the FdUMP–TS covalent complex was 1.8-fold higher in HCT116RF10 cells than in HCT116 cells (Figure 6a top panel and 6c). Importantly, it should be noted that total TS, the free form, the FdUMP-covalent form, and total TS was overexpressed in HCT116RF10 cells rather than in HCT116 cells (Figure 6a top panel and Figure 6d). The upper band of TS, indicated FdUMP-covalent form, which represents TS in ternary complexes and is correlated with the intracellular concentration of FdUMP [12,13,14]. In addition, DPD protein levels were slightly decreased in HCT116RF10 cells than in parental HCT116 cells (Figure 6a second panel and Figure 6e). GAPDH and beta-actin were used as an internal controls (Figure 6a third and bottom panels). In parental HCT116 cells and HCT116RF10 cells, both internal control proteins, GAPDH and beta-actin, had similar levels. After treatment with 1 × 10⁻⁴ M 5-FU for 24 h, the protein levels of free TS, FdUMP–TS covalent complex, and total TS were individually about 1.5-fold higher in HCT116RF10 cells than in parental HCT116 cells (Figure 7a–d). Intriguingly, these data indicated that the proportion of active free TS in the intracellular total TS was highly regulated in the 5-FU resistant HCT116RF10 cells. These findings suggested that the regulation of TS status, which includes the balance of active free TS or the inactive FdUMP–TS covalent complex, may confer resistance to 5-FU.

3. Discussion

5-FU and its derivatives are widely used in anticancer chemotherapy [2,3]. Studies to date have shown that cancer cells develop resistance to 5-FU through complex mechanisms [2,3]. Of note, the TS enzyme and other enzymes involved in 5-FU anabolism or catabolism are often altered in expression or function to promote 5-FU resistance [2,3]. In addition, altered cell death and autophagy, expression/functional changes in drug transporters, epigenetic changes, and non-coding RNA (i.e., microRNA and long non-coding RNA) dysfunction represent putative 5-FU-resistant mechanisms [2,3]. It has been widely believed that TS is the main molecular mechanism that influences 5-FU sensitivity and targeting TS is a major strategy for reversing 5-FU resistance. Importantly, there are currently no specific therapies to overcome 5-FU resistance.
We established a 5-FU-resistant cell line, HCT116RF10, and analyzed its characteristics. Importantly, HCT116RF10 cells were cross-resistant to the 5-FU analog, FUdR (Figure 2 and Figure 3). In contrast, HCT116RF10 cells did not exhibit cross-resistance to the anticancer drugs, SN-38 and CDDP (Figure 2 and Figure 3). Similarly, Boyer et al. also reported that 5-FU-resistant HCT116 cells were not cross-resistant to oxaliplatin or irinotecan [15]. In addition, the sensitivities to 5-FU and FUdR were similar to the levels observed individually in parental HCT116 cells. Of note, previous reports indicated that FUdR is more potent than 5-FU and that the inhibition of cell proliferation was approximately 10- to 100-fold higher than that of 5-FU in multiple cancer cell lines [16,17,18]. These findings suggest that the common target or mechanism of action of 5-FU and FUdR is the key to 5-FU resistance in this resistant cell model. Furthermore, our results revealed that HCT116RF10 cells are resistant to 5-FU and its derivatives, but are not multidrug resistant.
To elucidate the underlying cause of 5-FU resistance, we investigated 5-FU metabolism-related genes, including TYMS and DPYD, in HCT116RF10 and parent HCT116 cells by using whole-exome sequencing. The results revealed that the genetic alteration of almost all of the 5-FU metabolic pathway-related genes was similar in status, intron variants, and heterozygous mutation in both cells (Table 3). Interestingly, we found that the one functional DPD mutation, Asp1000Val, is present in HCT116RF10 cells. However, the effects of DPYD missense mutation on 5-FU resistance are not well understood.
Next, to evaluate TS and DPD in HCT116RF10 and parent HCT116 cells, we analyzed the expression of these genes by Western blot analysis (Figure 6). 5-FU and FUdR are converted to FdUMP, and it has been shown to form a covalent complex with TS in the presence of CH2-THF [2,3,5]. Our results indicated that the free-TS protein (active form) levels were similar in HCT116RF10 and HCT116 cells. Interestingly, the FdUMP–TS covalent complex (inactive form) was higher in HCT116RF10 cells than in HCT116 cells. Notably, this result indicates that TS is not overexpressed, but rather there are two types of TS in HCT116RF10 cells: free TS and FdUMP-coupled TS. We observed that 5-FU-resistant HCT116RF10 cells exhibit upregulated TYMS expression and use a fraction of TS to trap FdUMP, resulting in resistance to 5-FU and its analogs. In addition, our data suggest that the regulation of the TS complex, which refers to the balance of the active free-TS form and the inactive FdUMP–TS covalent complex, may confer to 5-FU resistance.
Numerous studies have shown that TYMS gene amplification, leading to mRNA and enzyme overproduction, is a major mechanism of resistance to fluoropyrimidines 5-FU and FUdR and their derivatives [19]. Also, free TS binds to its own mRNA, resulting in translational repression, that is, translational autoregulation [12,20,21,22,23]. Indeed, TS ligands, including 5-FU, disrupt the interaction of the TS enzyme with TS mRNA, leading to translational derepression and enzyme upregulation [12,22,23]. Additionally, to translational derepression, enzyme stabilization has been indicated as the primary mechanism of TS induction by fluoropyrimidines in human colon and ovarian cancer cell lines [24,25,26]. Furthermore, it is proposed that fluoropyrimidine-mediated increases in TS levels occur through an effect on enzyme stability with no effect on its mRNA [25,27]. It is also suggested that TS stabilization could be the result of conformational changes that may occur upon the formation of a ternary complex, reducing the susceptibility of the TS enzyme to proteolysis [28]. These findings indicated that understanding translational derepression and enzyme stabilization as the process of TS induction has significance for elucidating the mechanism of resistance acquisition. Further investigation is needed on the functions of the FdUMP–TS covalent complex and free TS in both translational regulation and enzyme stabilization for fluoropyrimidine resistance mechanisms using 5-FU-resistance and 5-FU-sensitive parental HCT116 cell lines. Collectively, our findings provide a better understanding of the anticancer drugs, 5-FU and its fluoropyrimidine derivatives, with respect to resistance mechanisms and anticancer treatment strategies.

4. Materials and Methods

4.1. Reagents

The anticancer drugs 5-FU, FUdR, CDDP, and SN-38 were obtained from FUJIFILM Wako Pure Chemical Corporation (Osaka, Japan). 5-FU, CDDP, and SN-38 were stored as 100 mM stocks in dimethyl sulfoxide (DMSO, Sigma-Aldrich; Merck KGaA, Darmstadt, Germany) at −20 °C. FUdR was stored as a 20 mM stock solution in ultrapure water at −20 °C.

4.2. Cell Culture

The human colon cancer cell line HCT116 was obtained from the American Type Culture Collection. Parental and 5-FU-resistant HCT116 cell lines were cultured in DMEM medium containing 10% heat-inactivated fetal bovine serum, 100 units/mL penicillin, and 100 μg/mL streptomycin in a 37 °C incubator under an atmosphere containing 5% CO2 and 100% relative humidity.

4.3. Generation of the 5-FU-Resistant HCT116 Cell Line

5-FU-resistant HCT116 cells were obtained by continuous exposure of cells to 3 μM 5-FU for approximately 12 weeks and following at 10 μM for an approximate 14-week period. A derivative of HCT116 was isolated and named HCT116RF3 or HCT116RF10. The HCT116RF10 cells were maintained in culture in the presence of 10 μM 5-FU.

4.4. Cell Viability by WST-8 Assay

Cell viability assays were performed as previously described [29]. Cell viability was determined using the WST-8 (Cell Counting Kit-8) cell proliferation assay (Dojindo, Tokyo, Japan). Briefly, cells were seeded into 96-well plates (1000 cells per well) in triplicate and then treated with various concentrations of anticancer drugs or DMSO and water (as a negative control). Following incubation for 72 h, WST-8 reagent was added to each well and the plate was placed in a 5% CO2 incubator at 37 °C for an additional 1 h. Optical density was measured at 450 nm on a Tecan microplate reader (Mannedorf, Switzerland). The EC50 value was defined as the concentration of drug producing 50% inhibition of cell proliferation. The resistance index (RI) was defined as the ratio of EC50 values between the resistant and parental cell lines. Experiments were repeated at least three times.

4.5. Colony Formation Assay

Colony formation assay was performed as previously described [29,30,31,32]. HCT116 and HCT116RF10 cells were dissociated with Accutase, suspended in medium, inoculated into 6-well plates (200 cells per well) in triplicate, and then incubated overnight. The cells were treated with various concentrations of drugs or with solvent (DMSO or water) as a negative control. After incubation for 10 days, cells were fixed with 4% formaldehyde solution and stained with 0.1% (w/v) crystal violet, and the number of colonies in each well was counted.

4.6. Tumor Sphere Assay

HCT116 and HCT116RF10 cells were seeded into 96-well PrimeSurface® plate 96U (Sumitomo Bakelite Co., Ltd., Tokyo, Japan) plates (1000 cells per well) in triplicate and then treated with various concentrations of 5-FU or DMSO (as a negative control). Following incubation for 14 days, tumor sphere size was monitored once every 3–4 days. Tumor sphere volume (V) was calculated using the following formula: V = ab2/2 (a and b are the long and short diameters of the tumor sphere, respectively).

4.7. Exome Sequencing Analysis

DNA extraction was performed as previously described [29]. Genomic DNA was extracted from cells (5 × 10⁶ cells) by using a DNeasy Tissue Kit (QIAGEN, Venlo, Netherlands), according to the manufacturer’s instructions. Exome sequencing of parental HCT116 and HCT116RF10 cells was performed by APRO Life Science Institute, Inc. (Tokushima, Japan) and Macrogen Global Headquarters (Seoul, Korea).

4.8. Western Blot Analysis

Western blot analysis was performed as previously described [29,32,33,34]. The antibodies used were rabbit anti-thymidylate synthase (D5B3) monoclonal antibody (9045S, 1:1000, Cell Signaling Technologies, Danvers, MA, USA), mouse anti-DPYD (A-5) monoclonal antibody (sc-376712, 1:1000, Santa Cruz Biotechnology, Dallas, TX, USA), rabbit anti-GAPDH antibody (2275-PC-100, 1:20,000, Trevigen, Gaithersburg, MD, USA), mouse anti-beta-actin monoclonal antibody (A19178-200UL, 1:20,000, Sigma-Aldrich), horseradish peroxidase-linked anti-rabbit IgG (1:20,000, GE Healthcare, Pittsburgh, PA, USA), and horseradish peroxidase-linked whole antibody anti-mouse IgG (1:20,000, GE Healthcare).

4.9. Statistical Analysis

The data are presented as means ± standard deviation. The significance of differences among groups was evaluated using a Student’s t-test; p < 0.05 was considered statistically significant.

Author Contributions

Conceptualization, A.S.; investigation, C.K., Y.O. and A.S.; writing—original draft preparation, A.S.; writing—review and editing, C.K., Y.O. and A.S.; visualization, C.K., Y.O. and A.S.; project administration, A.S. All authors have read and agreed to the published version of the manuscript.

Funding

This research received no external funding.

Institutional Review Board Statement

Not applicable.

Informed Consent Statement

Not applicable.

Data Availability Statement

Not applicable.

Acknowledgments

We thank Yusuke Wataya (Okayama University) for their helpful discussions.

Conflicts of Interest

The authors declare no conflict of interest.

References

  1. Bray, F.; Ferlay, J.; Soerjomataram, I.; Siegel, R.L.; Torre, L.A.; Jemal, A. Global cancer statistics 2018: GLOBOCAN estimates of incidence and mortality worldwide for 36 cancers in 185 countries. CA Cancer J. Clin. 2018, 68, 394–424. [Google Scholar] [CrossRef] [PubMed] [Green Version]
  2. Longley, D.B.; Harkin, D.P.; Johnston, P.G. 5-fluorouracil: Mechanisms of action and clinical strategies. Nat. Rev. Cancer 2003, 3, 330–338. [Google Scholar] [CrossRef] [PubMed]
  3. Blondy, S.; David, V.; Verdier, M.; Mathonnet, M.; Perraud, A.; Christou, N. 5-Fluorouracil resistance mechanisms in colorectal cancer: From classical pathways to promising processes. Cancer Sci. 2020, 111, 3142–3154. [Google Scholar] [CrossRef] [PubMed]
  4. Heidelberger, C. Fluorinated pyrimidines. Prog. Nucleic Acid. Res. Mol. Biol. 1965, 4, 1–50. [Google Scholar]
  5. Santi, D.V. Perspective on the design and biochemical pharmacology of inhibitors of thymidylate synthetase. J. Med. Chem. 1980, 23, 103–111. [Google Scholar] [CrossRef]
  6. Copur, S.; Aiba, K.; Drake, J.C.; Allegra, C.J.; Chu, E. Thymidylate synthase gene amplification in human colon cancer cell lines resistant to 5-fluorouracil. Biochem. Pharmacol. 1995, 49, 1419–1426. [Google Scholar] [CrossRef]
  7. Johnston, P.G.; Lenz, H.J.; Leichman, C.G.; Danenberg, K.D.; Allegra, C.J.; Danenberg, P.V.; Leichman, L. Thymidylate synthase gene and protein expression correlate and are associated with response to 5-fluorouracil in human colorectal and gastric tumors. Cancer Res. 1995, 55, 1407–1412. [Google Scholar]
  8. Wang, W.; Marsh, S.; Cassidy, J.; McLeod, H.L. Pharmacogenomic dissection of resistance to thymidylate synthase inhibitors. Cancer Res. 2001, 61, 5505–5510. [Google Scholar]
  9. Popat, S.; Matakidou, A.; Houlston, R.S. Thymidylate synthase expression and prognosis in colorectal cancer: A systematic review and meta-analysis. J. Clin. Oncol. 2004, 22, 529–536. [Google Scholar] [CrossRef]
  10. Ishibiki, Y.; Kitajima, M.; Sakamoto, K.; Tomiki, Y.; Sakamoto, S.; Kamano, T. Intratumoural thymidylate synthase and dihydropyrimidine dehydrogenase activities are good predictors of 5-fluorouracil sensitivity in colorectal cancer. J. Int. Med. Res. 2003, 31, 181–187. [Google Scholar] [CrossRef]
  11. Zhang, N.; Yin, Y.; Xu, S.J.; Chen, W.S. 5-Fluorouracil: Mechanisms of resistance and reversal strategies. Molecules 2008, 13, 1551–1569. [Google Scholar] [CrossRef] [PubMed] [Green Version]
  12. Chu, E.; Koeller, D.M.; Johnston, P.G.; Zinn, S.; Allegra, C.J. Regulation of thymidylate synthase in human colon cancer cells treated with 5-fluorouracil and interferon-gamma. Mol. Pharmacol. 1993, 43, 527–533. [Google Scholar] [PubMed]
  13. Drake, J.C.; Allegra, C.J.; Johnston, P.G. Immunological quantitation of thymidylate synthase-FdUMP-5,10-methylenetetrahydrofolate ternary complex with the monoclonal antibody TS 106. Anticancer Drugs 1993, 4, 431–435. [Google Scholar] [CrossRef] [PubMed]
  14. Mori, R.; Futamura, M.; Tanahashi, T.; Tanaka, Y.; Matsuhashi, N.; Yamaguchi, K.; Yoshida, K. 5FU resistance caused by reduced fluoro-deoxyuridine monophosphate and its reversal using deoxyuridine. Oncol. Lett. 2017, 14, 3162–3168. [Google Scholar] [CrossRef] [Green Version]
  15. Boyer, J.; McLean, E.G.; Aroori, S.; Wilson, P.; McCulla, A.; Carey, P.D.; Longley, D.B.; Johnston, P.G. Characterization of p53 wild-type and null isogenic colorectal cancer cell lines resistant to 5-fluorouracil, oxaliplatin, and irinotecan. Clin. Cancer Res. 2004, 10, 2158–2167. [Google Scholar] [CrossRef] [PubMed] [Green Version]
  16. Laskin, J.D.; Evans, R.M.; Slocum, H.K.; Burke, D.; Hakala, M.T. Basis for natural variation in sensitivity to 5-fluorouracil in mouse and human cells in culture. Cancer Res. 1979, 39, 383–390. [Google Scholar]
  17. Yoshioka, A.; Tanaka, S.; Hiraoka, O.; Koyama, Y.; Hirota, Y.; Ayusawa, D.; Seno, T.; Garrett, C.; Wataya, Y. Deoxyribonucleoside triphosphate imbalance. 5-Fluorodeoxyuridine-induced DNA double strand breaks in mouse FM3A cells and the mechanism of cell death. J. Biol. Chem. 1987, 262, 8235–8241. [Google Scholar] [CrossRef]
  18. Yamada, M.; Nakagawa, H.; Fukushima, M.; Shimizu, K.; Hayakawa, T.; Ikenaka, K. In vitro study on intrathecal use of 5-fluoro-2′-deoxyuridine (FdUrd) for meningeal dissemination of malignant brain tumors. J. Neurooncol. 1998, 37, 115–121. [Google Scholar] [CrossRef]
  19. Peters, G.J.; Backus, H.H.; Freemantle, S.; van Triest, B.; Codacci-Pisanelli, G.; van der Wilt, C.L.; Smid, K.; Lunec, J.; Calvert, A.H.; Marsh, S.; et al. Induction of thymidylate synthase as a 5-fluorouracil resistance mechanism. Biochim. Biophys. Acta 2002, 1587, 194–205. [Google Scholar] [CrossRef] [Green Version]
  20. Chu, E.; Koeller, D.M.; Casey, J.L.; Drake, J.C.; Chabner, B.A.; Elwood, P.C.; Zinn, S.; Allegra, C.J. Autoregulation of human thymidylate synthase messenger RNA translation by thymidylate synthase. Proc. Natl. Acad. Sci. USA 1991, 88, 8977–8981. [Google Scholar] [CrossRef] [Green Version]
  21. Chu, E.; Voeller, D.; Koeller, D.M.; Drake, J.C.; Takimoto, C.H.; Maley, G.F.; Maley, F.; Allegra, C.J. Identification of an RNA binding site for human thymidylate synthase. Proc. Natl. Acad. Sci. USA 1993, 90, 517–521. [Google Scholar] [CrossRef] [Green Version]
  22. Keyomarsi, K.; Samet, J.; Molnar, G.; Pardee, A.B. The thymidylate synthase inhibitor, ICI D1694, overcomes translational detainment of the enzyme. J. Biol. Chem. 1993, 268, 15142–15149. [Google Scholar] [CrossRef]
  23. Chu, E.; Allegra, C.J. The role of thymidylate synthase as an RNA binding protein. Bioessays 1996, 18, 191–198. [Google Scholar] [CrossRef]
  24. Kitchens, M.E.; Forsthoefel, A.M.; Barbour, K.W.; Spencer, H.T.; Berger, F.G. Mechanisms of acquired resistance to thymidylate synthase inhibitors: The role of enzyme stability. Mol. Pharmacol. 1999, 56, 1063–1070. [Google Scholar] [CrossRef] [PubMed] [Green Version]
  25. Kitchens, M.E.; Forsthoefel, A.M.; Rafique, Z.; Spencer, H.T.; Berger, F.G. Ligand-mediated induction of thymidylate synthase occurs by enzyme stabilization. Implications for autoregulation of translation. J. Biol. Chem. 1999, 274, 12544–12547. [Google Scholar] [CrossRef] [Green Version]
  26. Marverti, G.; Ligabue, A.; Paglietti, G.; Corona, P.; Piras, S.; Vitale, G.; Guerrieri, D.; Luciani, R.; Costi, M.P.; Frassineti, C.; et al. Collateral sensitivity to novel thymidylate synthase inhibitors correlates with folate cycle enzymes impairment in cisplatin-resistant human ovarian cancer cells. Eur. J. Pharmacol. 2009, 615, 17–26. [Google Scholar] [CrossRef]
  27. Washtien, W.L. Increased levels of thymidylate synthetase in cells exposed to 5-fluorouracil. Mol. Pharmacol. 1984, 25, 171–177. [Google Scholar] [PubMed]
  28. Mohsen, A.W.; Aull, J.L.; Payne, D.M.; Daron, H.H. Ligand-induced conformational changes of thymidylate synthase detected by limited proteolysis. Biochemistry 1995, 34, 1669–1677. [Google Scholar] [CrossRef] [PubMed]
  29. Ogino, Y.; Sato, A.; Uchiumi, F.; Tanuma, S.I. Cross resistance to diverse anticancer nicotinamide phosphoribosyltransferase inhibitors induced by FK866 treatment. Oncotarget 2018, 9, 16451–16461. [Google Scholar] [CrossRef] [PubMed] [Green Version]
  30. Ogino, Y.; Sato, A.; Uchiumi, F.; Tanuma, S.I. Genomic and tumor biological aspects of the anticancer nicotinamide phosphoribosyltransferase inhibitor FK866 in resistant human colorectal cancer cells. Genomics 2019, 111, 1889–1895. [Google Scholar] [CrossRef] [PubMed]
  31. Inada, M.; Shindo, M.; Kobayashi, K.; Sato, A.; Yamamoto, Y.; Akasaki, Y.; Ichimura, K.; Tanuma, S.I. Anticancer effects of a non-narcotic opium alkaloid medicine, papaverine, in human glioblastoma cells. PLoS ONE 2019, 14, e0216358. [Google Scholar] [CrossRef] [PubMed] [Green Version]
  32. Ogino, Y.; Sato, A.; Kawano, Y.; Aoyama, T.; Uchiumi, F.; Tanuma, S.I. Association of ABC Transporter With Resistance to FK866, a NAMPT Inhibitor, in Human Colorectal Cancer Cells. Anticancer Res. 2019, 39, 6457–6462. [Google Scholar] [CrossRef] [PubMed] [Green Version]
  33. Sato, A.; Satake, A.; Hiramoto, A.; Wataya, Y.; Kim, H.S. Protein expression profiles of necrosis and apoptosis induced by 5-fluoro-2′-deoxyuridine in mouse cancer cells. J. Proteome Res. 2010, 9, 2329–2338. [Google Scholar] [CrossRef] [PubMed]
  34. Sato, A.; Nakama, K.; Watanabe, H.; Satake, A.; Yamamoto, A.; Omi, T.; Hiramoto, A.; Masutani, M.; Wataya, Y.; Kim, H.S. Role of activating transcription factor 3 protein ATF3 in necrosis and apoptosis induced by 5-fluoro-2′-deoxyuridine. FEBS J. 2014, 281, 1892–1900. [Google Scholar] [CrossRef] [PubMed]
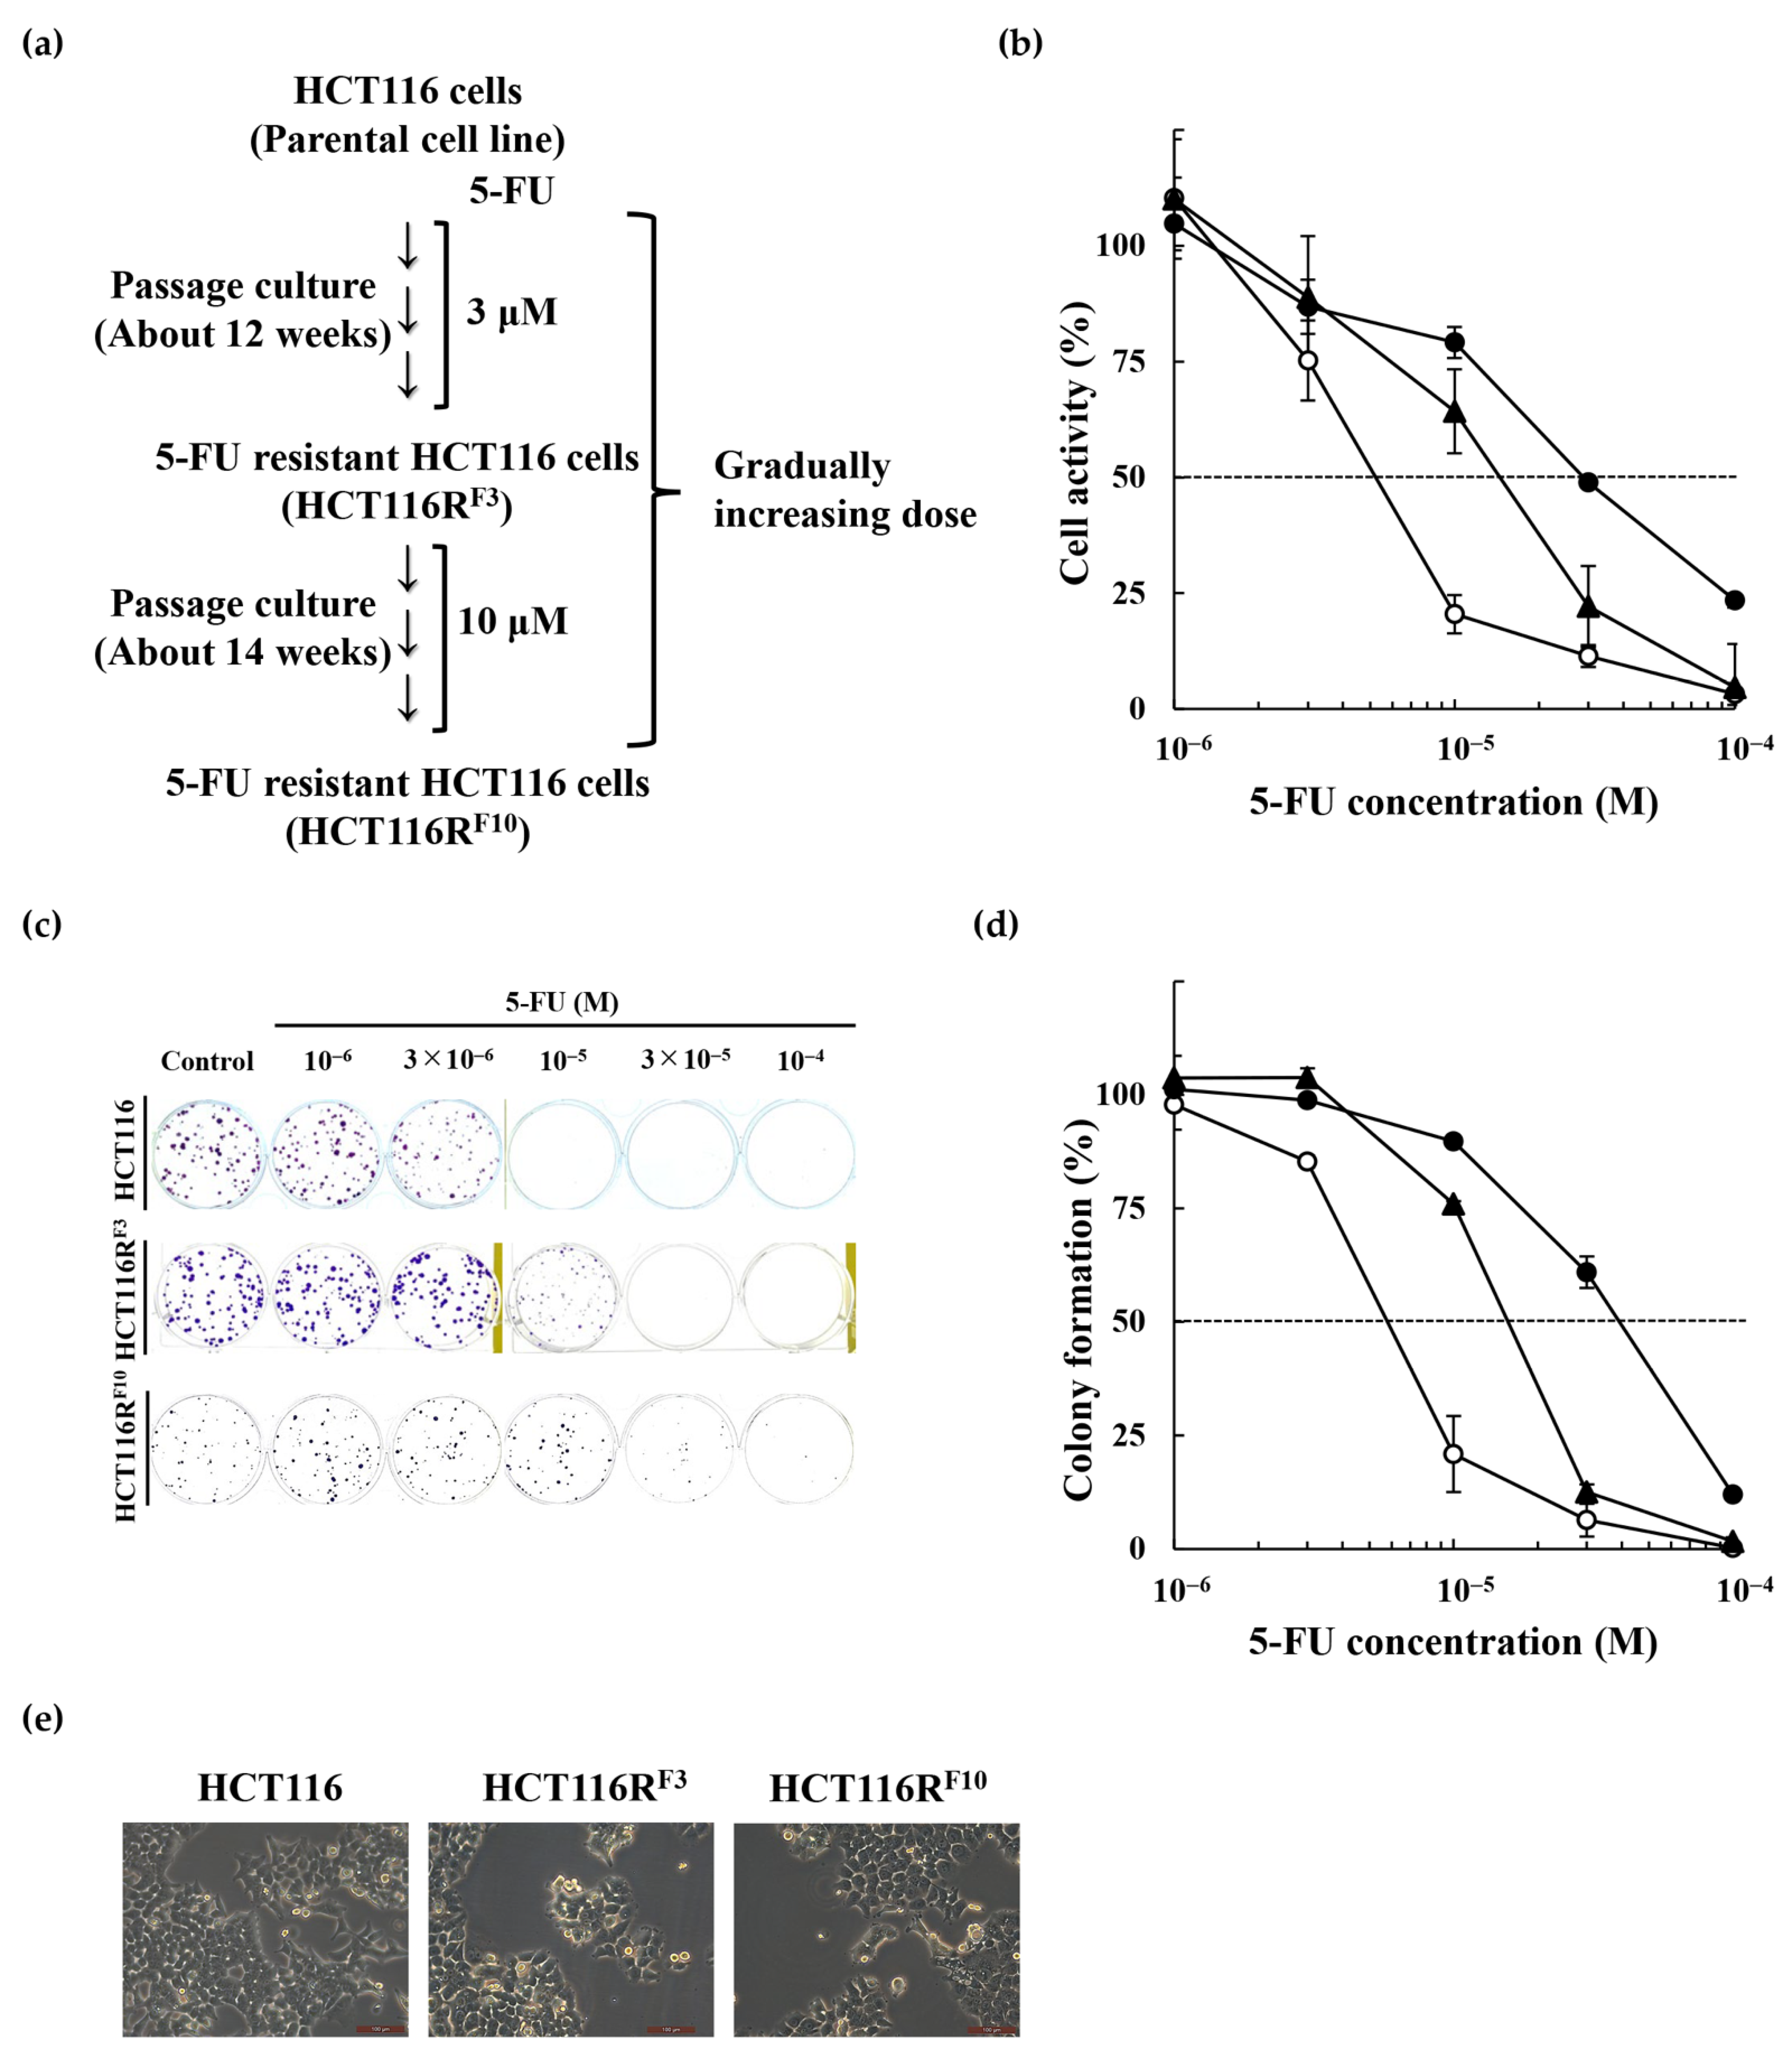
Figure 1. Establishment of HCT116RF10, a 5-FU-resistant derivative of the human colorectal cancer cell line HCT116. (a) Scheme for the establishment of the 5-FU-resistant HCT116 cells (HCT116RF10). (b) HCT116RF10 and parental HCT116 cells were tested for cell viability after a 72 h treatment with 5-FU. Results represent the averages of three independent experiments with error bars showing ±SE from triplicates. (c) Drug sensitivities of HCT116RF10 and HCT116 using the colony formation assay. HCT116RF10 and HCT116 cells were treated with the indicated concentration of 5-FU and incubated for 10 days. (d) HCT116 cells: Colony formation (%) represents the average of two independent experiments, each performed in duplicate, with error bars showing ±SE of four measurement values. HCT116RF3 and RF10 cells: Colony formation (%) represents the average of three independent experiments, each performed in triplicate, with error bars showing ±SE of nine measurement values. White circle, HCT116 cells; black triangle, HCT116RF3 cells; black circle, HCT116RF10 cells. (e) Morphological features were analyzed using a Leica DMi1 microscope with LAS V4.12 at 200× magnification. Scale bar = 100 μm.
Ijms 22 02916 g001
Figure 2. Sensitivity of 5-FU-resistant HCT116RF10 and parental HCT116 cells to FUdR, SN-38, and CDDP. The cell proliferation WST-8 assay of HCT116RF10 and parental HCT116 cells after a 72 h treatment with (a) FUdR, (b) SN-38, and (c) CDDP. Results represent the averages of two independent experiments, with error bars showing ±SE of triplicates. White circle, HCT116 cells; black circle, HCT116RF10 cells.
Ijms 22 02916 g002
Figure 3. Sensitivity of 5-FU-resistant HCT116RF10 and parental HCT116 cells to FUdR, SN-38, and CDDP. Colony formation by HCT116RF10 and parental HCT116 cells after 10 days of treatment with (a,b) FUdR, (c,d) SN-38, and (e,f) CDDP. Colony formation (%) represents the averages of two independent experiments each performed in duplicate (b) or triplicate (d,f), with error bars showing ±SE of four (b) or six (d,f) measurement values. White circle, HCT116 cells; black circle, HCT116RF10 cells.
Ijms 22 02916 g003
Figure 4. Tumor sphere formation of 5-FU-resistant HCT116RF10 and parental HCT116 cells. (a) Tumor sphere formation was analyzed using a Leica DMi1 microscope with 50× magnification. Scale bar = 500 μm. HCT116RF10 and parental HCT116 cells were treated with or without 3 × 10⁻⁵ M 5-FU for 3 or 14 days. Control, no 5-FU, solvent (DMSO) alone. To assess the ability of HCT116RF10 and parental HCT116 cells to form tumor spheres, the cells were treated with solvent alone (b) or 3 × 10⁻⁵ M 5-FU (c) for 14 days. Tumor sphere size was calculated as described in the Materials and Methods. White circle, HCT116 cells; black circle, HCT116RF10 cells. (d) Drug sensitivity of 5-FU in HCT116 and HCT116RF10 tumor spheres. Tumor sphere formation by HCT116RF10 and parental HCT116 cells after a 14-day treatment with 5-FU at the indicated concentrations. Results are the averages for groups of three tumor spheres each with error bars showing SE. White circle, HCT116 cells; black circle, HCT116RF10 cells.
Ijms 22 02916 g004
Figure 5. Metabolic pathways associated with 5-FU. 5-FU, 5-fluorouracil; DHFU, dihydrofluorouracil; FUPA, fluoroureidopropionate; FBAL, fluoroalanine; FUdR, fluorodeoxyuridine; FdUMP, fluorodeoxyuridine monophosphate; FdUTP, fluorodeoxyuridine triphosphate; FUMP, fluorouridine monophosphate; FUTP, fluorouridine triphosphate; dUMP, deoxyuridine monophosphate; dTMP, deoxythymidine monophosphate; dTTP, deoxythymidine triphosphate; CH2-THF, 5,10-methylenetetrahydrofolate; DHF, dihydrofolate; THF; tetrahydrofolate; TS, thymidylate synthase; DPD, dihydropyrimidine dehydrogenase; DPYS, dihydro pyrimidase; DHFR, dihydrofolate reductase; BUPI, β-ureido propionase; TP, thymidine phosphorylase; TK, thymidine kinase; SHMT, serine hydroxymethyltransferase; and OPRT, orotate phosphoribosyltransferase 1.
Ijms 22 02916 g005
Figure 6. Protein levels of TS and DPD in 5-FU-resistant HCT116RF10 and parental HCT116 cells. (a) Whole-cell lysates were prepared from parental HCT116 and HCT116RF10 cells. Protein levels of TS, DPD, GAPDH, and beta-actin were measured by Western blot analysis. The expression levels of GAPDH and beta-actin were used as an internal control. Data are representative of at least three independent experiments. Protein levels of (b) free TS, (c) FdUMP-TS, (d) total TS, and (e) DPD in parental HCT116 and HCT116RF10 cells. Levels of TS and DPD protein in HCT116RF10 cells are represented by the ratio of TS or DPD density to GAPDH density relative to the value for parental HCT116 cells. Results represent the averages of three independent experiments with error bars showing ±SE of triplicates. * p < 0.05.
Ijms 22 02916 g006
Figure 7. Protein levels of TS in 5-FU-resistant HCT116RF10 and parental HCT116 cells after treatment with 5-FU. (a) Whole-cell lysates were prepared from parental HCT116 and HCT116RF10 cells after 24 h treatment with 1 × 10⁻⁴ M 5-FU. Protein levels of TS, GAPDH, and beta-actin were measured by Western blot analysis. Data are representative of at least three independent experiments. Protein levels of (b) free TS, (c) FdUMP-TS, and (d) total TS in parental HCT116 and HCT116RF10 cells. Levels of TS protein in HCT116RF10 cells are represented by the ratio of TS density to GAPDH density relative to the value for parental HCT116 cells. Results represent the averages of three independent experiments with error bars showing ±SE of triplicates. * p < 0.05.
Ijms 22 02916 g007
Table 1. Sensitivity of 5-fluorouracil in the parental HCT116, HCT116RF3 and HCT116RF10 cells.
Cell lineEC50 (M)RI
WST-8 AssayCFAWST-8 AssayCFA
HCT1165.1 × 10−65.5 × 10−611
HCT116RF31.5 × 10−51.6 × 10−52.92.9
HCT116RF102.9 × 10−53.8 × 10−55.76.9
Note. EC50, 50% effective concentration; R, resistant; F3, fluorouracil 3 × 10⁻⁶ M; F10, fluorouracil 10 × 10−6 M; RI, resistance index.
Table 2. Sensitivities of several anticancer agents in the parental HCT116 and HCT116RF10 cells.
EC50 (M, WST-8)EC50 (M, CFA)
HCT116HCT116RF10RIHCT116HCT116RF10RI
FUdR1.5 × 10−61.2 × 10−480.03.4 × 10−63.3 × 10−59.7
SN-383.1 × 10−96.6 × 10−92.14.2 × 10−93.0 × 10−90.7
CDDP1.0 × 10−51.4 × 10−51.45.2 × 10−64.5 × 10−60.9
Note: EC50, 50% effective concentration; RF10, resistant to fluorouracil 10 × 10−6 M; RI, resistance index.
Table 3. Mutations of 5-FU metabolic enzyme genes in the parental HCT116 and HCT116RF10 cells.
Gene SymbolHCT116HCT116RF10
DPYDwt
mt(c.2908-58G>C)het
mt(.2907+55C>T)hom
wt
wt
mt(c.2442+77_2442+78delAA)het
mt(c.2059-94G>T)het
mt(c.1740+40A>G)hom
mt(c.1740+39C>T)het
mt(c.1627A>G)het
mt(c.234-123G>C)het
mt(c.40-461delT)het
mt(c.-113T>C)het
mt(c.2999A>T)het
mt(c.2908-58G>C)het
mt(.2907+55C>T)hom
mt(c.2623-59T>G)het
mt(c.2442+78delA)het
wt
mt(c.2059-94G>T)het
mt(c.1740+40A>G)hom
mt(c.1740+39C>T)het
mt(c.1627A>G)het
mt(c.234-123G>C)het
wt
wt
DPYSmt(c.1444-145C>T)hom
mt(c.951-113T>C)hom
mt(c.424-62G>T)hom
mt(c.265-58T>C)hom
mt(c.216C>T)hom
mt(c.-1T>C)hom
mt(c.1444-145C>T)hom
mt(c.951-113T>C)hom
mt(c.424-62G>T)hom
mt(c.265-58T>C)hom
mt(c.216C>T)hom
mt(c.-1T>C)hom
BUPIn.d.n.d.
TPn.d.n.d.
TK1mt(c.393+168C>T)het
mt(c.393+1G>A)het
mt(c.225A>G)het
mt(c.98+97_98+101delCCCCT)het
mt(c.33T>C)het
wt
wt
mt(c.225A>G)het
mt(c.98+97_98+101delCCCCT)het
mt(c.33T>C)het
TK2mt(c.619-53A>G)het
mt(c.619-63C>G)het
mt(c.156+836G>A)het
mt(c.156+742G>A)het
mt(c.125-116G>A)het
mt(c.-30C>G)het
mt(c.-38A>G)het
mt(c.619-53A>G)het
mt(c.619-63C>G)het
mt(c.156+836G>A)het
mt(c.156+742G>A)het
mt(c.125-116G>A)het
mt(c.-30C>G)het
mt(c.-38A>G)het
TYMSmt(c.97T>C)het
mt(c.280-43G>A)hom
mt(c.454+50T>C)hom
wt
wt
mt(c.454+200_454+202delTTT)hom
mt(c.556+123_556+126delATTG)hom
mt(c.*19C>T)hom
mt(c.*89A>G)het
mt(c.97T>C)het
mt(c.280-43G>A)hom
mt(c.454+50T>C)hom
mt(c.454+197_454+202delTTTTTT)het
mt(c.454+199_454+202delTTTT)het
wt
mt(c.556+123_556+126delATTG)hom
mt(c.*19C>T)hom
mt(c.*89A>G)het
DHFR1wt
wt
mt(c.-204T>C)het
mt(c.137-25T>G)het
mt(c.137-43T>C)het
mt(c.-204T>C)het
DHFR2mt(c.247C>G)hommt(c.247C>G)hom
SHMT1mt(c.*66C>T)het
mt(c.*47C>G)het
mt(c.1420C>T)het
mt(c.1171+59A>G)het
mt(c.1054+141C>T)het
mt(c.815-23C>T)het
mt(c.601+174C>T)het
mt(c.601+173G>A)het
mt(c.243-256A>G)het
mt(c.-19-101T>C)hom
mt(c.*66C>T)het
mt(c.*47C>G)het
mt(c.1420C>T)het
mt(c.1171+59A>G)het
mt(c.1054+141C>T)het
mt(c.815-23C>T)het
mt(c.601+174C>T)het
mt(c.601+173G>A)het
mt(c.243-256A>G)het
mt(c.-19-101T>C)hom
SHMT2mt(c.595-6G>A)het
mt(c.717+14dupG)het
mt(c.1279+30G>A)het
mt(c.595-6G>A)het
mt(c.717+14dupG)het
mt(c.1279+30G>A)het
Note. wt, wild-type; mt, mutation-type; n.d., not detected; hom, homozygous; het, heterozygous.
Publisher’s Note: MDPI stays neutral with regard to jurisdictional claims in published maps and institutional affiliations.