
Endothelial Nox5 Expression Modulates Glucose Uptake and Lipid Accumulation in Mice Fed a High-Fat Diet and 3T3-L1 Adipocytes Treated with Glucose and Palmitic Acid

 , ,
, ,  ,
,  and
and 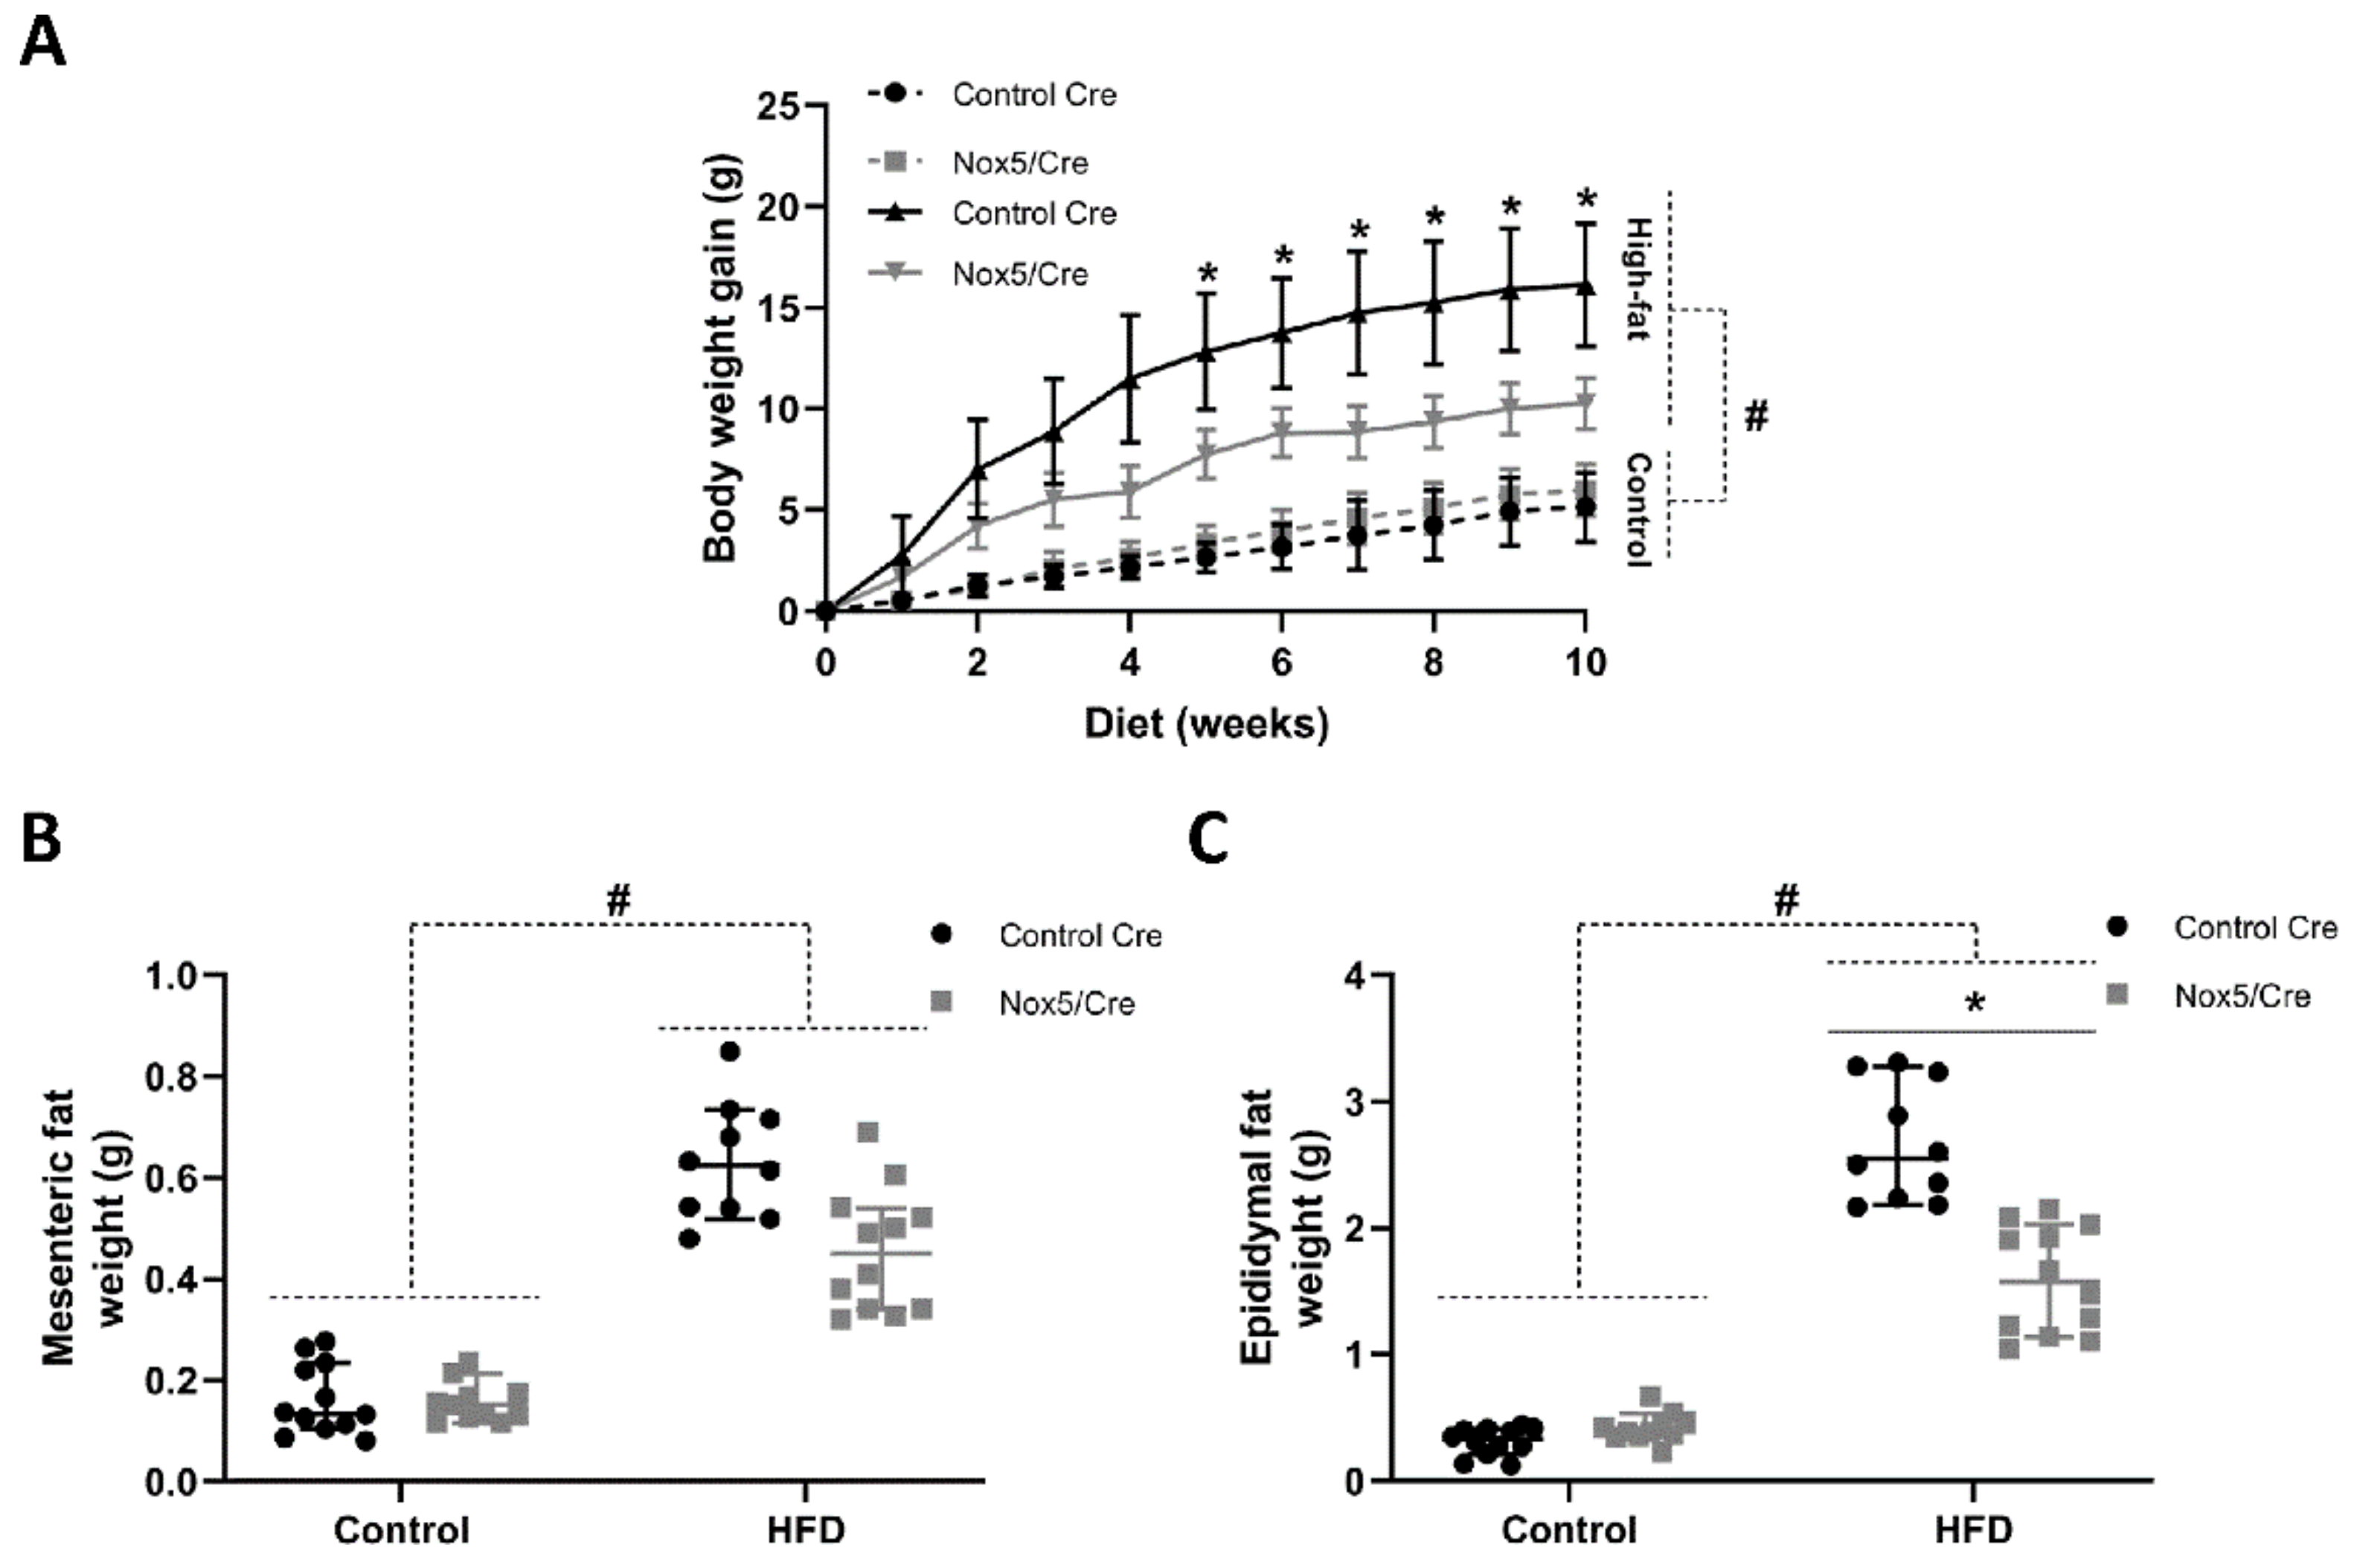
Abstract
1. Introduction
2. Results
2.1. Endothelial NOX5 Expression Reduced Body Weight Gain and Adipose Tissue Weight in Mice Fed a High-Fat Diet
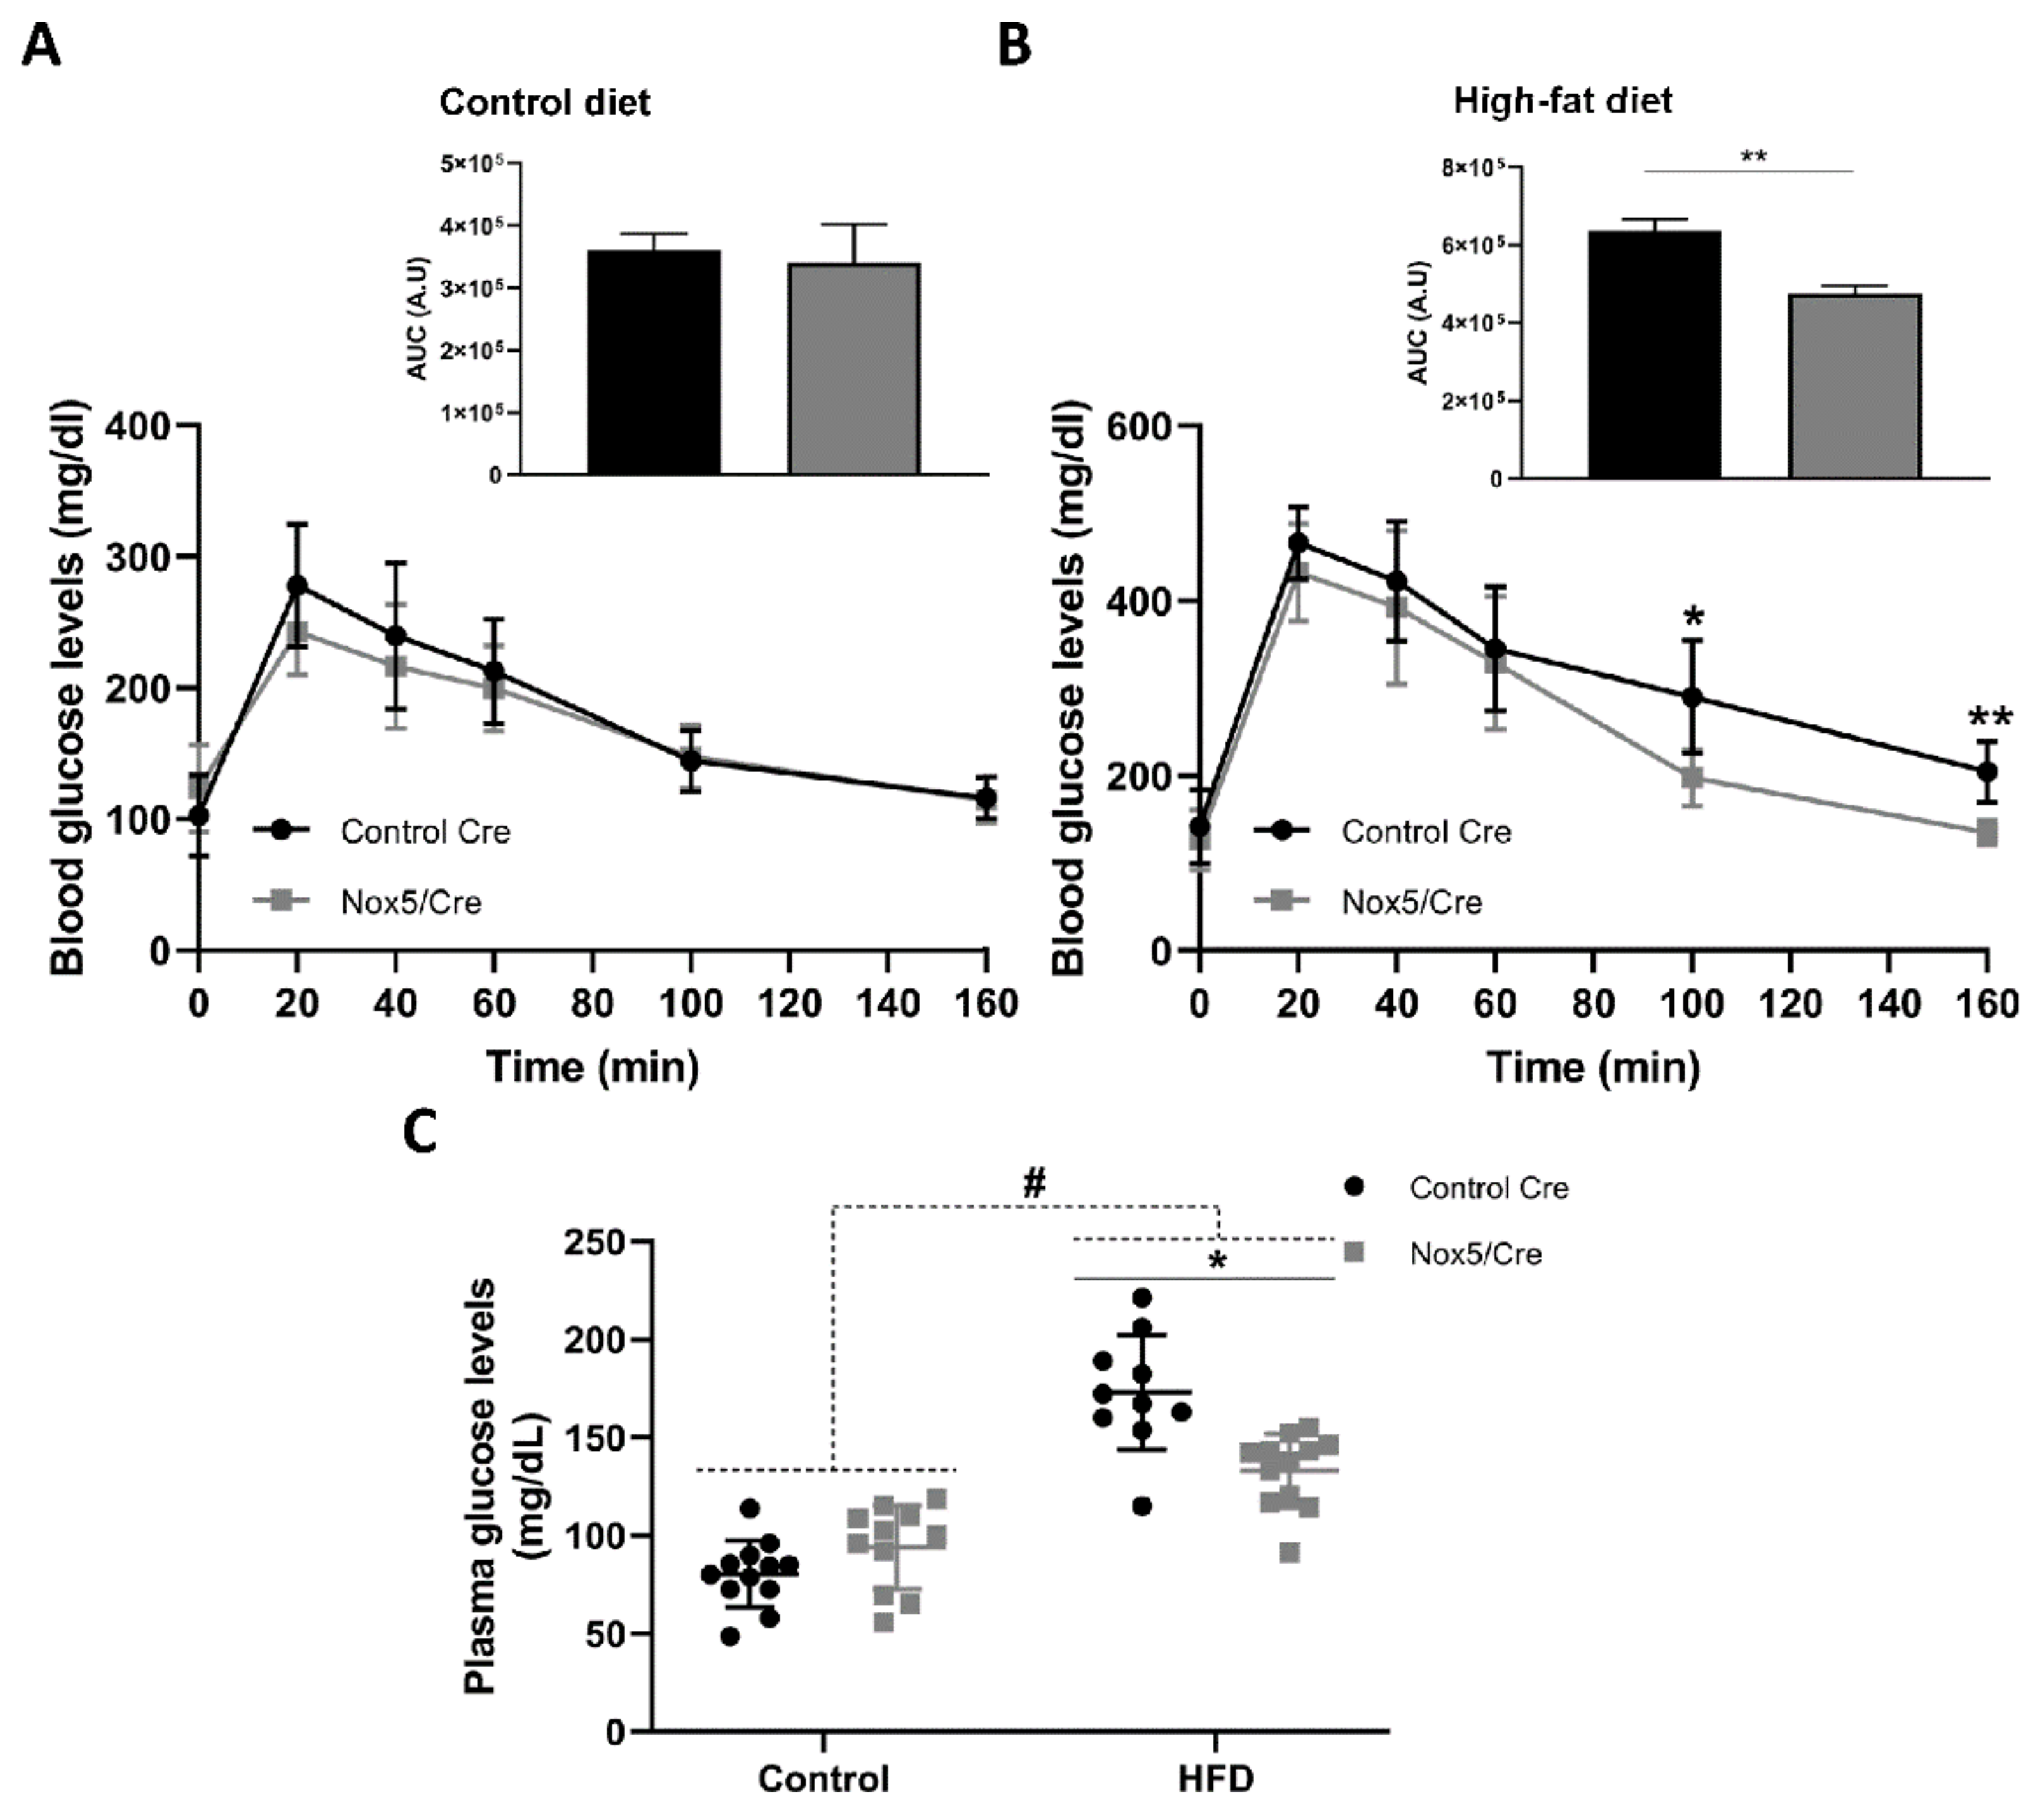
2.2. Endothelial NOX5 Expression in Mice Fed a High-Fat Diet Enhanced Glucose Sensitivity
2.3. Endothelial Expression of NOX5 in Mice Fed a High-Fat Diet Increased the Expression of Genes Related to Glucose Uptake Pathway in Adipose Tissue
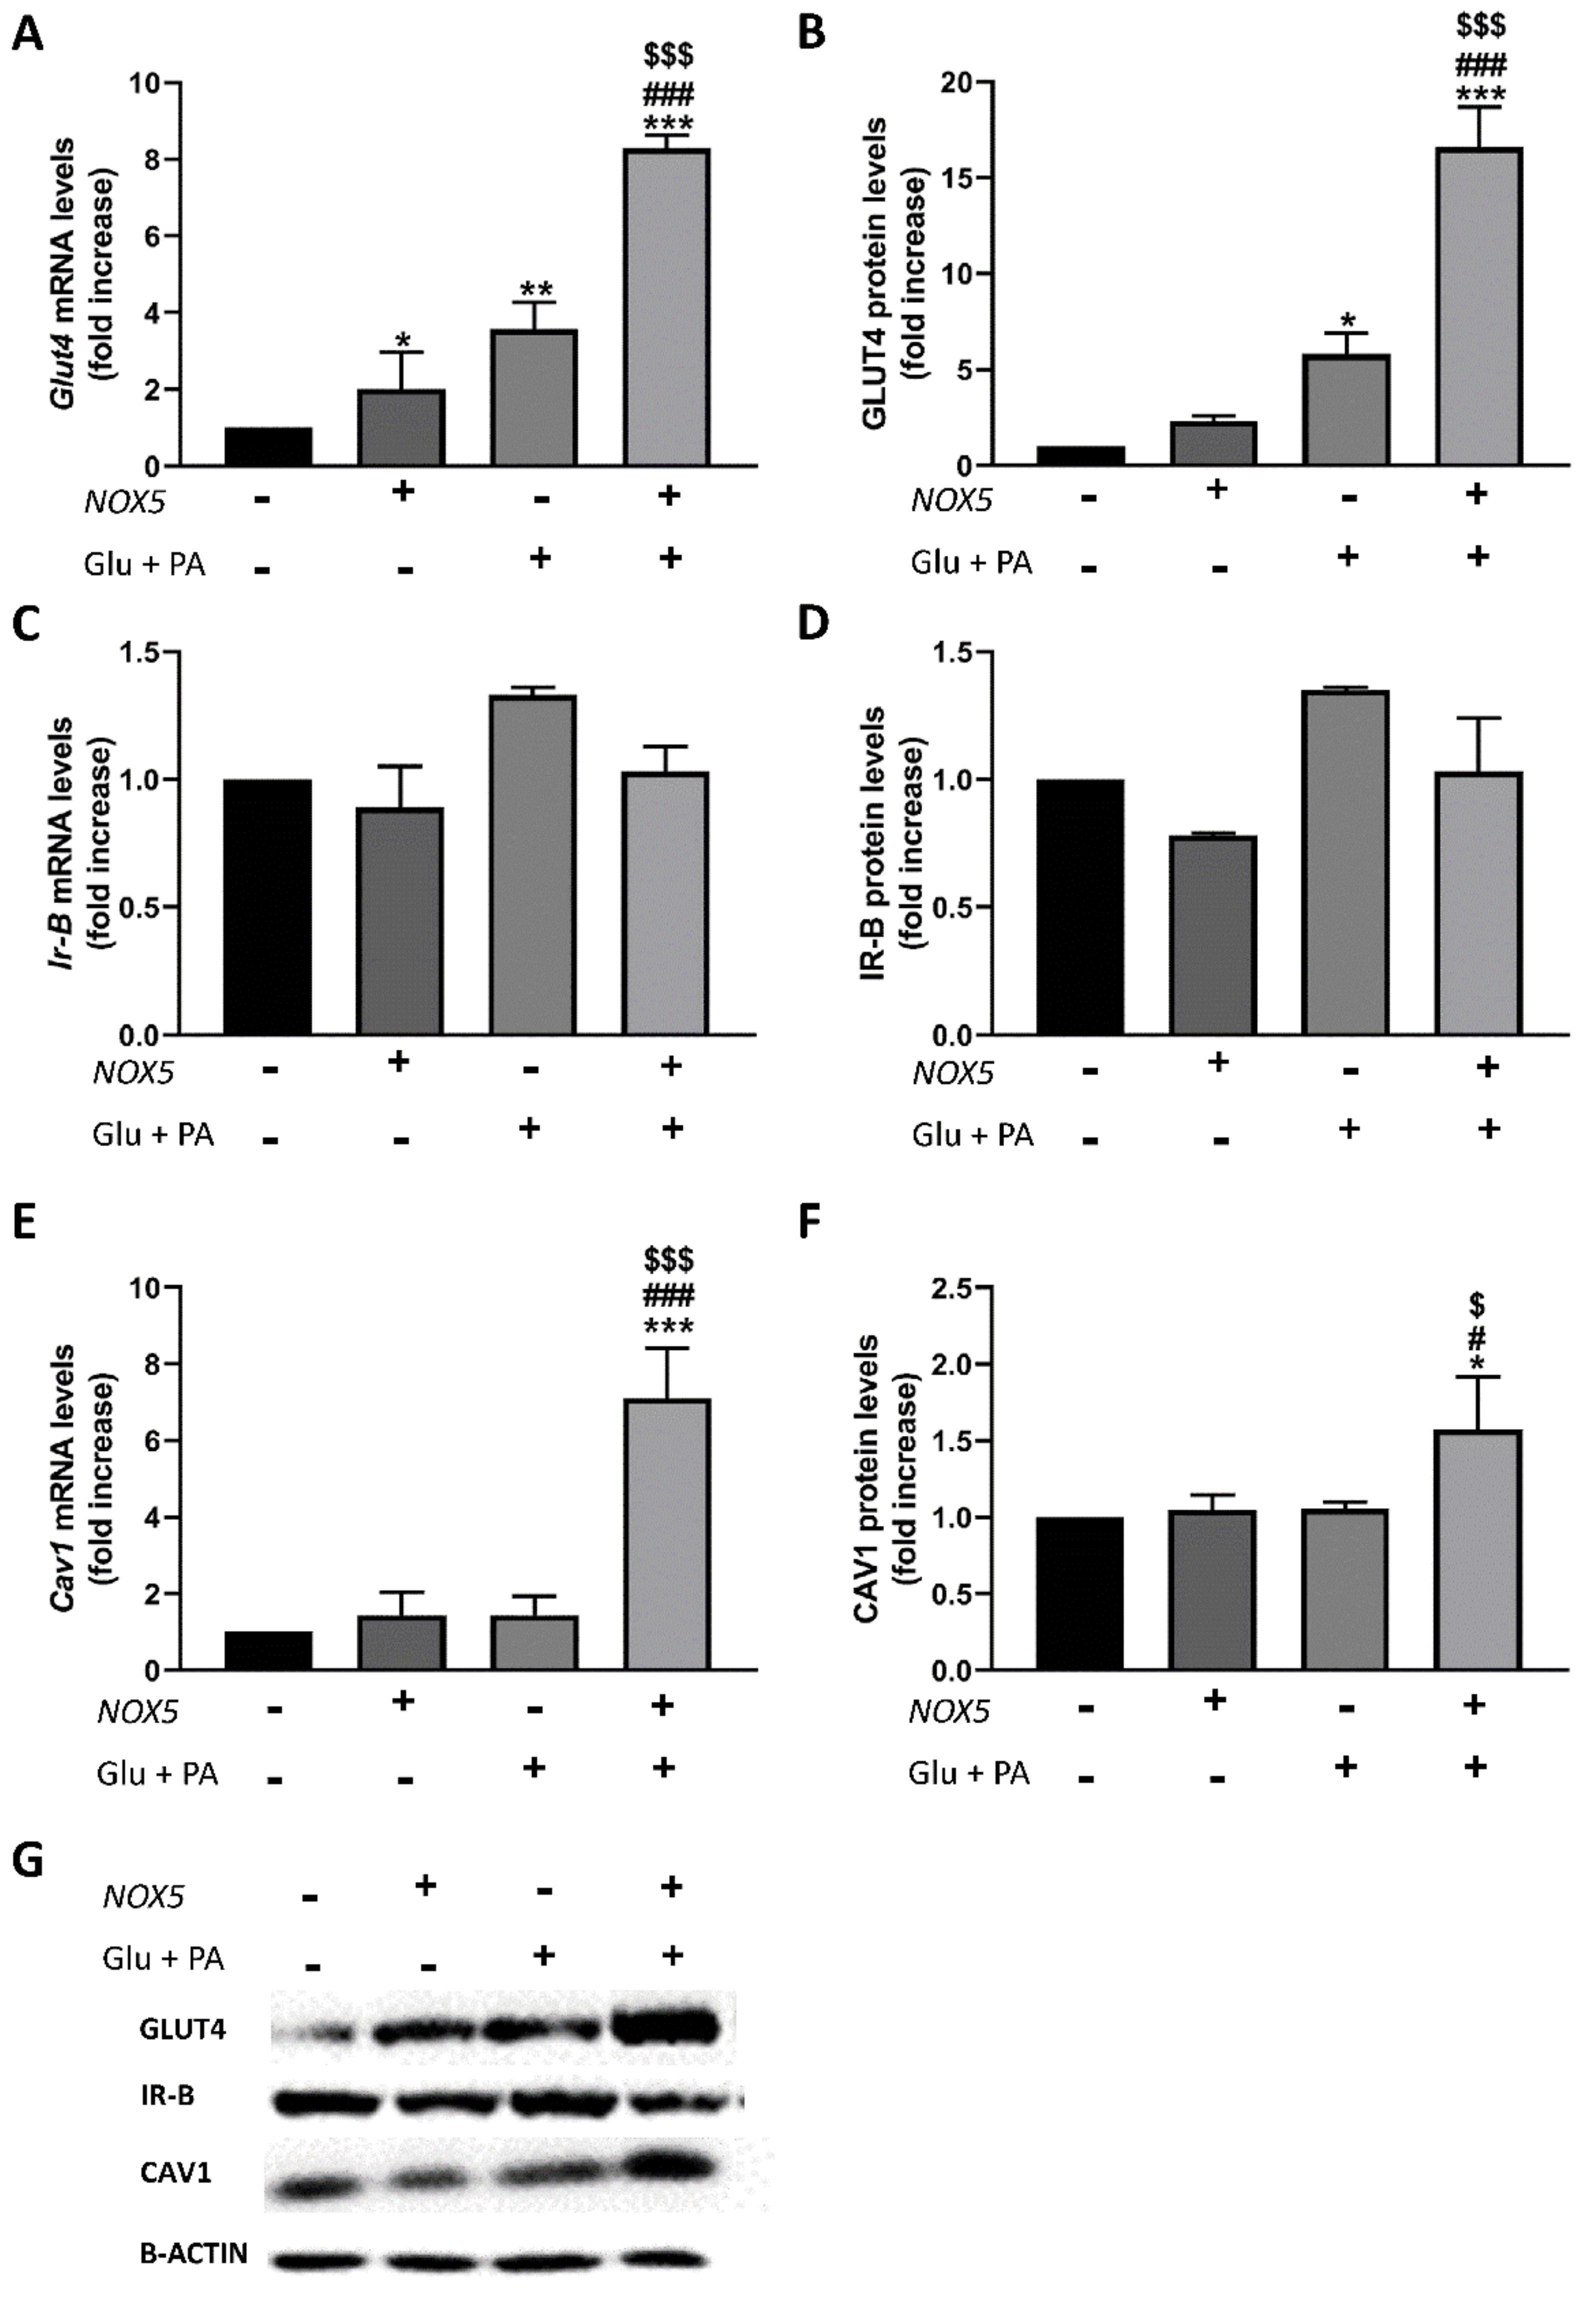
2.4. T3 Adipocytes Cultured with Conditioned Media from Endothelial NOX5-Expressing Cells Showed Reduced Lipid Accumulation and Increased Glucose Uptake Together with Enhanced Expression of Genes Related to Glucose Uptake Pathway
3. Discussion
4. Materials and Methods
4.1. Animals
4.2. Intraperitoneal Glucose Tolerance Test (IPGTT)
4.3. Plasma Biochemistry Parameters
4.4. Materials
4.5. Cell Culture
4.6. Transient Transfection
4.7. Glucose Uptake Test
4.8. Quantitative Real-Time PCR
4.9. Western Blot
4.10. Statistical Analysis
Supplementary Materials
Author Contributions
Funding
Institutional Review Board Statement
Informed Consent Statement
Data Availability Statement
Acknowledgments
Conflicts of Interest
References
- Heyn, G.S.; Correa, L.H.; Magalhaes, K.G. The impact of adipose tissue-derived miRNAs in metabolic syndrome, obesity, and cancer. Front. Endocrinol. 2020, 11, 563816. [Google Scholar] [CrossRef]
- Jung, U.J.; Choi, M.S. Obesity and its metabolic complications: The role of adipokines and the relationship between obesity, inflammation, insulin resistance, dyslipidemia and nonalcoholic fatty liver disease. Int. J. Mol. Sci. 2014, 15, 6184–6223. [Google Scholar] [CrossRef] [PubMed]
- Boucher, J.; Kleinridders, A.; Kahn, C.R. Insulin receptor signaling in normal and insulin-resistant states. Cold Spring Harb. Perspect. Biol. 2014, 6. [Google Scholar] [CrossRef] [PubMed]
- Nystrom, F.H.; Chen, H.; Cong, L.N.; Li, Y.; Quon, M.J. Caveolin-1 interacts with the insulin receptor and can differentially modulate insulin signaling in transfected Cos-7 cells and rat adipose cells. Mol. Endocrinol. 1999, 13, 2013–2024. [Google Scholar] [CrossRef]
- Sowa, G. Caveolae, caveolins, cavins, and endothelial cell function: New insights. Front. Physiol. 2012, 2, 120. [Google Scholar] [CrossRef]
- Gonzalez-Munoz, E.; Lopez-Iglesias, C.; Calvo, M.; Palacin, M.; Zorzano, A.; Camps, M. Caveolin-1 loss of function accelerates glucose transporter 4 and insulin receptor degradation in 3T3-L1 adipocytes. Endocrinology 2009, 150, 3493–3502. [Google Scholar] [CrossRef] [PubMed]
- Fernandez-Real, J.M.; Catalan, V.; Moreno-Navarrete, J.M.; Gomez-Ambrosi, J.; Ortega, F.J.; Rodriguez-Hermosa, J.I.; Ricart, W.; Fruhbeck, G. Study of caveolin-1 gene expression in whole adipose tissue and its subfractions and during differentiation of human adipocytes. Nutr. Metab. 2010, 7, 20. [Google Scholar] [CrossRef][Green Version]
- Xue, W.; Wang, J.; Jiang, W.; Shi, C.; Wang, X.; Huang, Y.; Hu, C. Caveolin-1 alleviates lipid accumulation in NAFLD associated with promoting autophagy by inhibiting the Akt/mTOR pathway. Eur. J. Pharm. 2020, 871, 172910. [Google Scholar] [CrossRef] [PubMed]
- Furukawa, S.; Fujita, T.; Shimabukuro, M.; Iwaki, M.; Yamada, Y.; Nakajima, Y.; Nakayama, O.; Makishima, M.; Matsuda, M.; Shimomura, I. Increased oxidative stress in obesity and its impact on metabolic syndrome. J. Clin. Investig. 2004, 114, 1752–1761. [Google Scholar] [CrossRef]
- Sakai, K.; Matsumoto, K.; Nishikawa, T.; Suefuji, M.; Nakamaru, K.; Hirashima, Y.; Kawashima, J.; Shirotani, T.; Ichinose, K.; Brownlee, M.; et al. Mitochondrial reactive oxygen species reduce insulin secretion by pancreatic beta-cells. Biochem. Biophys. Res. Commun. 2003, 300, 216–222. [Google Scholar] [CrossRef]
- Droge, W. Free radicals in the physiological control of cell function. Physiol. Rev. 2002, 82, 47–95. [Google Scholar] [CrossRef] [PubMed]
- Bedard, K.; Krause, K.H. The NOX family of ROS-generating NADPH oxidases: Physiology and pathophysiology. Physiol. Rev. 2007, 87, 245–313. [Google Scholar] [CrossRef] [PubMed]
- Frey, R.S.; Ushio-Fukai, M.; Malik, A.B. NADPH oxidase-dependent signaling in endothelial cells: Role in physiology and pathophysiology. Antioxid. Redox Signal. 2009, 11, 791–810. [Google Scholar] [CrossRef] [PubMed]
- Banfi, B.; Molnar, G.; Maturana, A.; Steger, K.; Hegedus, B.; Demaurex, N.; Krause, K.H.A. Ca(2+)-activated NADPH oxidase in testis, spleen, and lymph nodes. J. Biol. Chem. 2001, 276, 37594–37601. [Google Scholar] [CrossRef]
- Cheng, G.; Cao, Z.; Xu, X.; van Meir, E.G.; Lambeth, J.D. Homologs of gp91phox: Cloning and tissue expression of Nox3, Nox4, and Nox5. Gene 2001, 269, 131–140. [Google Scholar] [CrossRef]
- Fulton, D.J. Nox5 and the regulation of cellular function. Antioxid. Redox Signal. 2009, 11, 2443–2452. [Google Scholar] [CrossRef]
- Garcia-Redondo, A.B.; Aguado, A.; Briones, A.M.; Salaices, M. NADPH oxidases and vascular remodeling in cardiovascular diseases. Pharm. Res. 2016, 114, 110–120. [Google Scholar] [CrossRef]
- DeVallance, E.; Li, Y.; Jurczak, M.J.; Cifuentes-Pagano, E.; Pagano, P.J. The role of NADPH oxidases in the etiology of obesity and metabolic syndrome: Contribution of individual isoforms and cell biology. Antioxid. Redox Signal. 2019, 31, 687–709. [Google Scholar] [CrossRef] [PubMed]
- Han, C.Y.; Umemoto, T.; Omer, M.; Den Hartigh, L.J.; Chiba, T.; LeBoeuf, R.; Buller, C.L.; Sweet, I.R.; Pennathur, S.; Abel, E.D.; et al. NADPH oxidase-derived reactive oxygen species increases expression of monocyte chemotactic factor genes in cultured adipocytes. J. Biol. Chem. 2012, 287, 10379–10393. [Google Scholar] [CrossRef]
- Houstis, N.; Rosen, E.D.; Lander, E.S. Reactive oxygen species have a causal role in multiple forms of insulin resistance. Nature 2006, 440, 944–948. [Google Scholar] [CrossRef]
- Schroder, K.; Wandzioch, K.; Helmcke, I.; Brandes, R.P. Nox4 acts as a switch between differentiation and proliferation in preadipocytes. Arter. Thromb. Vasc. Biol. 2009, 29, 239–245. [Google Scholar] [CrossRef]
- Mahadev, K.; Motoshima, H.; Wu, X.; Ruddy, J.M.; Arnold, R.S.; Cheng, G.; Lambeth, J.D.; Goldstein, B.J. The NAD(P)H oxidase homolog Nox4 modulates insulin-stimulated generation of H2O2 and plays an integral role in insulin signal transduction. Mol. Cell. Biol. 2004, 24, 1844–1854. [Google Scholar] [CrossRef]
- Anagnostopoulou, A.; Camargo, L.L.; Rodrigues, D.; Montezano, A.C.; Touyz, R.M. Importance of cholesterol-rich microdomains in the regulation of Nox isoforms and redox signaling in human vascular smooth muscle cells. Sci. Rep. 2020, 10, 17818. [Google Scholar] [CrossRef] [PubMed]
- Chen, F.; Barman, S.; Yu, Y.; Haigh, S.; Wang, Y.; Black, S.M.; Rafikov, R.; Dou, H.; Bagi, Z.; Han, W.; et al. Caveolin-1 is a negative regulator of NADPH oxidase-derived reactive oxygen species. Free Radic. Biol. Med. 2014, 73, 201–213. [Google Scholar] [CrossRef] [PubMed]
- Hasan, S.S.; Fischer, A. The endothelium: An active regulator of lipid and glucose homeostasis. Trends Cell. Biol. 2021, 31, 37–49. [Google Scholar] [CrossRef] [PubMed]
- Marques, J.; Cortes, A.; Pejenaute, A.; Ansorena, E.; Abizanda, G.; Prosper, F.; Martinez-Irujo, J.J.; Miguel, C.; Zalba, G. Induction of cyclooxygenase-2 by overexpression of the human NADPH oxidase 5 (NOX5) gene in aortic endothelial cells. Cells 2020, 9, 637. [Google Scholar] [CrossRef] [PubMed]
- Youn, J.Y.; Siu, K.L.; Lob, H.E.; Itani, H.; Harrison, D.G.; Cai, H. Role of vascular oxidative stress in obesity and metabolic syndrome. Diabetes 2014, 63, 2344–2355. [Google Scholar] [CrossRef]
- Sukumar, P.; Viswambharan, H.; Imrie, H.; Cubbon, R.M.; Yuldasheva, N.; Gage, M.; Galloway, S.; Skromna, A.; Kandavelu, P.; Santos, C.X.; et al. Nox2 NADPH oxidase has a critical role in insulin resistance-related endothelial cell dysfunction. Diabetes 2013, 62, 2130–2134. [Google Scholar] [CrossRef]
- Den Hartigh, L.J.; Omer, M.; Goodspeed, L.; Wang, S.; Wietecha, T.; O’Brien, K.D.; Han, C.Y. Adipocyte-specific deficiency of NADPH oxidase 4 delays the onset of insulin resistance and attenuates adipose tissue inflammation in obesity. Arterioscler. Thromb. Vasc. Biol. 2017, 37, 466–475. [Google Scholar] [CrossRef] [PubMed]
- Bouzakri, K.; Veyrat-Durebex, C.; Holterman, C.; Arous, C.; Barbieux, C.; Bosco, D.; Altirriba, J.; Alibashe, M.; Tournier, B.B.; Gunton, J.E.; et al. Beta-cell-specific expression of nicotinamide adenine dinucleotide phosphate oxidase 5 aggravates high-fat diet-induced impairment of islet insulin secretion in mice. Antioxid. Redox Signal. 2020, 32, 618–635. [Google Scholar] [CrossRef]
- Hahn, N.E.; Meischl, C.; Kawahara, T.; Musters, R.J.; Verhoef, V.M.; van der Velden, J.; Vonk, A.B.; Paulus, W.J.; van Rossum, A.C.; Niessen, H.W.; et al. NOX5 expression is increased in intramyocardial blood vessels and cardiomyocytes after acute myocardial infarction in humans. Am. J. Pathol. 2012, 180, 2222–2229. [Google Scholar] [CrossRef] [PubMed]
- Jha, J.C.; Banal, C.; Okabe, J.; Gray, S.P.; Hettige, T.; Chow, B.S.M.; Thallas-Bonke, V.; De Vos, L.; Holterman, C.E.; Coughlan, M.T.; et al. NADPH oxidase Nox5 accelerates renal injury in diabetic nephropathy. Diabetes 2017, 66, 2691–2703. [Google Scholar] [CrossRef] [PubMed]
- Marzaioli, V.; Hurtado-Nedelec, M.; Pintard, C.; Tlili, A.; Marie, J.C.; Monteiro, R.C.; Gougerot-Pocidalo, M.A.; Dang, P.M.; El-Benna, J. NOX5 and p22phox are 2 novel regulators of human monocytic differentiation into dendritic cells. Blood 2017, 130, 1734–1745. [Google Scholar] [CrossRef] [PubMed]
- Violi, F.; Carnevale, R.; Loffredo, L.; Pignatelli, P.; Gallin, J.I. NADPH oxidase-2 and atherothrombosis: Insight from chronic granulomatous disease. Arter. Thromb. Vasc. Biol. 2017, 37, 218–225. [Google Scholar] [CrossRef] [PubMed]
- Li, Y.; Mouche, S.; Sajic, T.; Veyrat-Durebex, C.; Supale, R.; Pierroz, D.; Ferrari, S.; Negro, F.; Hasler, U.; Feraille, E.; et al. Deficiency in the NADPH oxidase 4 predisposes towards diet-induced obesity. Int. J. Obes. 2012, 36, 1503–1513. [Google Scholar] [CrossRef] [PubMed]
- Benani, A.; Troy, S.; Carmona, M.C.; Fioramonti, X.; Lorsignol, A.; Leloup, C.; Casteilla, L.; Penicaud, L. Role for mitochondrial reactive oxygen species in brain lipid sensing: Redox regulation of food intake. Diabetes 2007, 56, 152–160. [Google Scholar] [CrossRef]
- Shadel, G.S.; Horvath, T.L. Mitochondrial ROS signaling in organismal homeostasis. Cell 2015, 163, 560–569. [Google Scholar] [CrossRef]
- Wang, Y.; Dellatore, P.; Douard, V.; Qin, L.; Watford, M.; Ferraris, R.P.; Lin, T.; Shapses, S.A. High fat diet enriched with saturated, but not monounsaturated fatty acids adversely affects femur, and both diets increase calcium absorption in older female mice. Nutr. Res. 2016, 36, 742–750. [Google Scholar] [CrossRef] [PubMed]
- Kahn, S.E.; Hull, R.L.; Utzschneider, K.M. Mechanisms linking obesity to insulin resistance and type 2 diabetes. Nature 2006, 444, 840–846. [Google Scholar] [CrossRef]
- Leloup, C.; Tourrel-Cuzin, C.; Magnan, C.; Karaca, M.; Castel, J.; Carneiro, L.; Colombani, A.L.; Ktorza, A.; Casteilla, L.; Penicaud, L. Mitochondrial reactive oxygen species are obligatory signals for glucose-induced insulin secretion. Diabetes 2009, 58, 673–681. [Google Scholar] [CrossRef] [PubMed]
- Loh, K.; Deng, H.; Fukushima, A.; Cai, X.; Boivin, B.; Galic, S.; Bruce, C.; Shields, B.J.; Skiba, B.; Ooms, L.M.; et al. Reactive oxygen species enhance insulin sensitivity. Cell Metab. 2009, 10, 260–272. [Google Scholar] [CrossRef]
- Barquissau, V.; Capel, F.; Dardevet, D.; Feillet-Coudray, C.; Gallinier, A.; Chauvin, M.A.; Rieusset, J.; Morio, B. Reactive oxygen species enhance mitochondrial function, insulin sensitivity and glucose uptake in skeletal muscle of senescence accelerated prone mice SAMP8. Free Radic. Biol. Med. 2017, 113, 267–279. [Google Scholar] [CrossRef][Green Version]
- Gomez-Ruiz, A.; Milagro, F.I.; Campion, J.; Martinez, J.A.; de Miguel, C. Caveolin expression and activation in retroperitoneal and subcutaneous adipocytes: Influence of a high-fat diet. J. Cell. Physiol. 2010, 225, 206–213. [Google Scholar] [CrossRef]
- Vargas, E.; Podder, V.; Sepulveda, M.A.C. Physiology, Glucose Transporter Type 4; Stat Pearls Publishing: Treasure Island, FL, USA, 2020. Available online: https://www.ncbi.nlm.nih.gov/books/NBK537322 (accessed on 5 March 2021).
- Shvets, E.; Ludwig, A.; Nichols, B.J. News from the caves: Update on the structure and function of caveolae. Curr. Opin. Cell Biol. 2014, 29, 99–106. [Google Scholar] [CrossRef] [PubMed]
- Haddad, D.; Al Madhoun, A.; Nizam, R.; Al-Mulla, F. Role of caveolin-1 in diabetes and its complications. Oxid. Med. Cell. Longev. 2020, 2020, 9761539. [Google Scholar] [CrossRef] [PubMed]
- Cohen, A.W.; Razani, B.; Wang, X.B.; Combs, T.P.; Williams, T.M.; Scherer, P.E.; Lisanti, M.P. Caveolin-1-deficient mice show insulin resistance and defective insulin receptor protein expression in adipose tissue. Am. J. Physiol. Cell Physiol. 2003, 285, C222–C235. [Google Scholar] [CrossRef]
- Cohen, A.W.; Hnasko, R.; Schubert, W.; Lisanti, M.P. Role of caveolae and caveolins in health and disease. Physiol. Rev. 2004, 84, 1341–1379. [Google Scholar] [CrossRef] [PubMed]
- Cao, H.; Alston, L.; Ruschman, J.; Hegele, R.A. Heterozygous CAV1 frameshift mutations (MIM 601047) in patients with atypical partial lipodystrophy and hypertriglyceridemia. Lipids Health Dis. 2008, 7, 3. [Google Scholar] [CrossRef]
- Dasari, A.; Bartholomew, J.N.; Volonte, D.; Galbiati, F. Oxidative stress induces premature senescence by stimulating caveolin-1 gene transcription through p38 mitogen-activated protein kinase/Sp1-mediated activation of two GC-rich promoter elements. Cancer Res. 2006, 66, 10805–10814. [Google Scholar] [CrossRef]
- Varela-Guruceaga, M.; Milagro, F.I.; Martinez, J.A.; de Miguel, C. Effect of hypoxia on caveolae-related protein expression and insulin signaling in adipocytes. Mol. Cell. Endocrinol. 2018, 473, 257–267. [Google Scholar] [CrossRef]
- Patkova, J.; Andel, M.; Trnka, J. Palmitate-induced cell death and mitochondrial respiratory dysfunction in myoblasts are not prevented by mitochondria-targeted antioxidants. Cell. Physiol. Biochem. 2014, 33, 1439–1451. [Google Scholar] [CrossRef] [PubMed]
- Andueza, A.; Garde, N.; Garcia-Garzon, A.; Ansorena, E.; Lopez-Zabalza, M.J.; Iraburu, M.J.; Zalba, G.; Martinez-Irujo, J.J. NADPH oxidase 5 promotes proliferation and fibrosis in human hepatic stellate cells. Free Radic. Biol. Med. 2018, 126, 15–26. [Google Scholar] [CrossRef]
- Livak, K.J.; Schmittgen, T.D. Analysis of relative gene expression data using real-time quantitative PCR and the 2(-Delta Delta C(T)) Method. Methods 2001, 25, 402–408. [Google Scholar] [CrossRef] [PubMed]


Publisher’s Note: MDPI stays neutral with regard to jurisdictional claims in published maps and institutional affiliations. |
© 2021 by the authors. Licensee MDPI, Basel, Switzerland. This article is an open access article distributed under the terms and conditions of the Creative Commons Attribution (CC BY) license (http://creativecommons.org/licenses/by/4.0/).
Share and Cite
García, J.G.; Ansorena, E.; Milagro, F.I.; Zalba, G.; de Miguel, C. Endothelial Nox5 Expression Modulates Glucose Uptake and Lipid Accumulation in Mice Fed a High-Fat Diet and 3T3-L1 Adipocytes Treated with Glucose and Palmitic Acid. Int. J. Mol. Sci. 2021, 22, 2729. https://doi.org/10.3390/ijms22052729
García JG, Ansorena E, Milagro FI, Zalba G, de Miguel C. Endothelial Nox5 Expression Modulates Glucose Uptake and Lipid Accumulation in Mice Fed a High-Fat Diet and 3T3-L1 Adipocytes Treated with Glucose and Palmitic Acid. International Journal of Molecular Sciences. 2021; 22(5):2729. https://doi.org/10.3390/ijms22052729
Chicago/Turabian StyleGarcía, Jorge G., Eduardo Ansorena, Fermín I. Milagro, Guillermo Zalba, and Carlos de Miguel. 2021. "Endothelial Nox5 Expression Modulates Glucose Uptake and Lipid Accumulation in Mice Fed a High-Fat Diet and 3T3-L1 Adipocytes Treated with Glucose and Palmitic Acid" International Journal of Molecular Sciences 22, no. 5: 2729. https://doi.org/10.3390/ijms22052729
APA StyleGarcía, J. G., Ansorena, E., Milagro, F. I., Zalba, G., & de Miguel, C. (2021). Endothelial Nox5 Expression Modulates Glucose Uptake and Lipid Accumulation in Mice Fed a High-Fat Diet and 3T3-L1 Adipocytes Treated with Glucose and Palmitic Acid. International Journal of Molecular Sciences, 22(5), 2729. https://doi.org/10.3390/ijms22052729