
Analysis of mir-9 Expression Pattern in Rat Retina during Postnatal Development

Abstract
1. Introduction
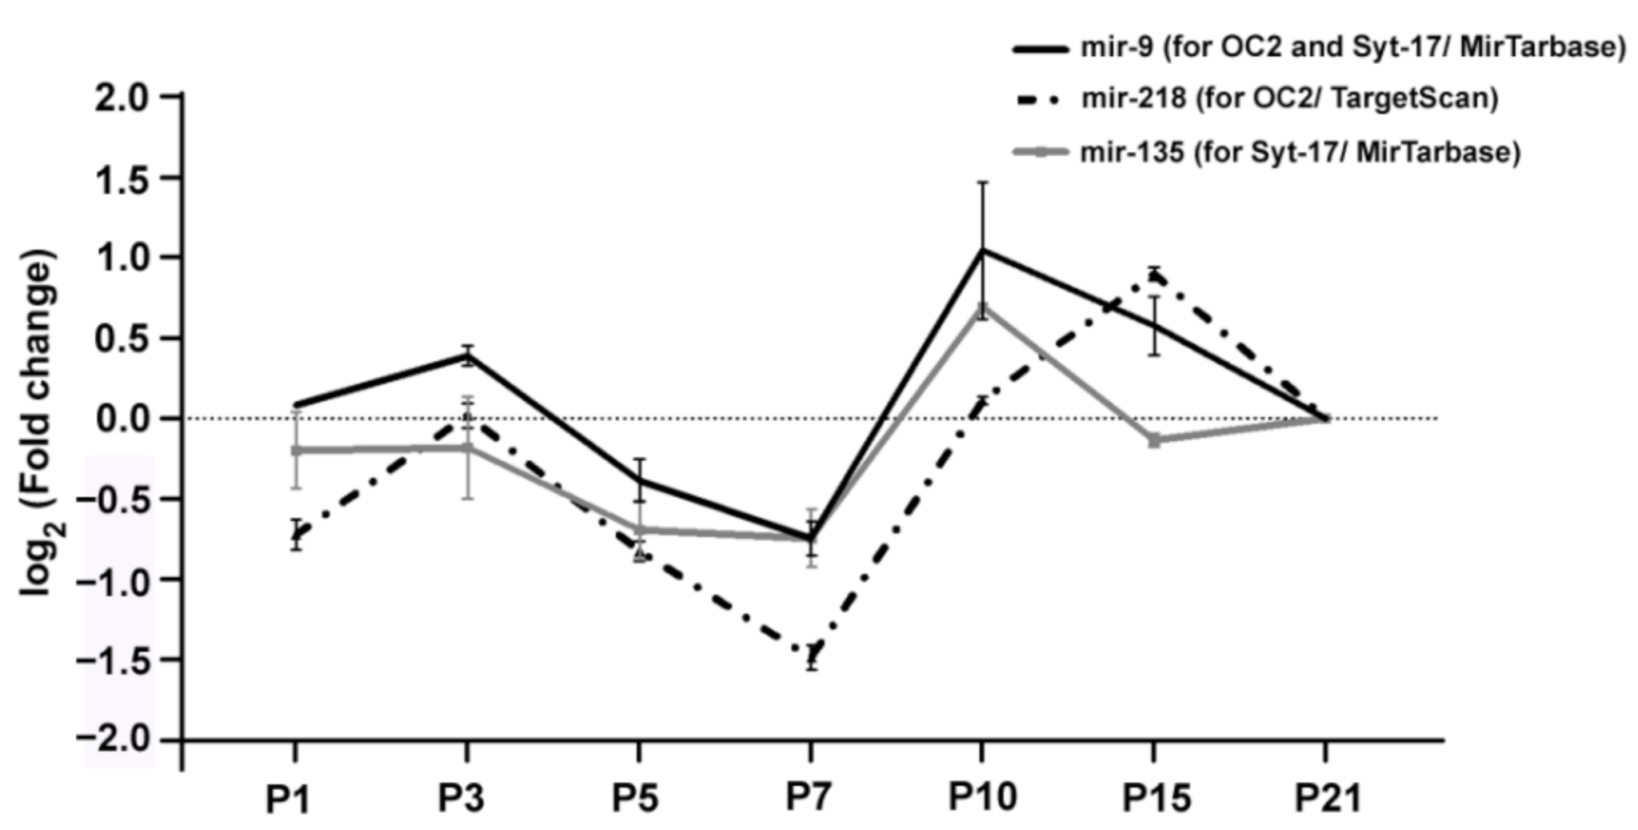
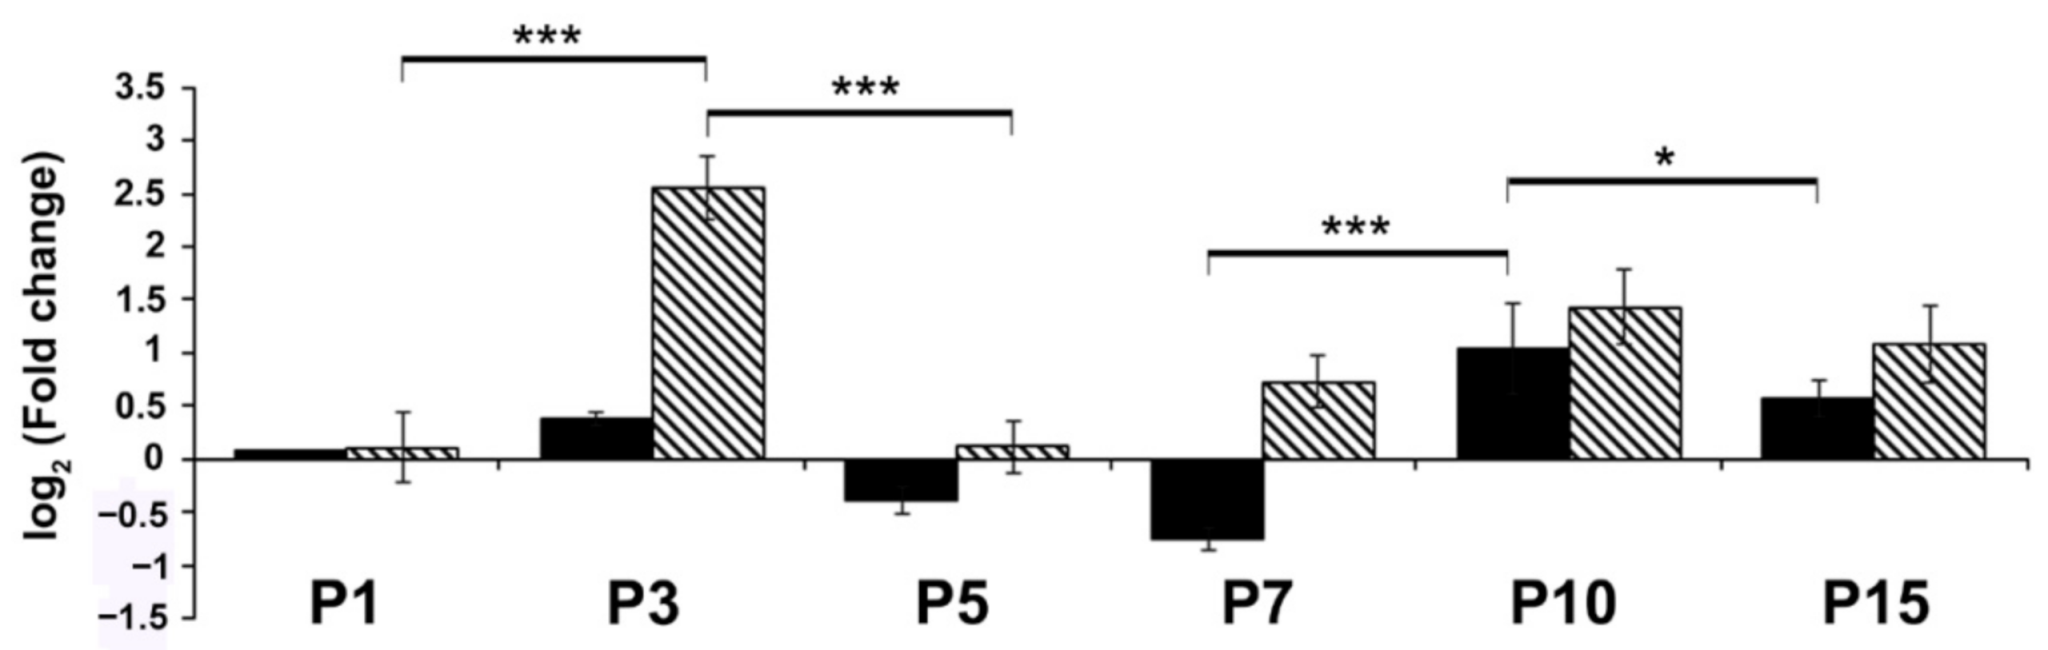
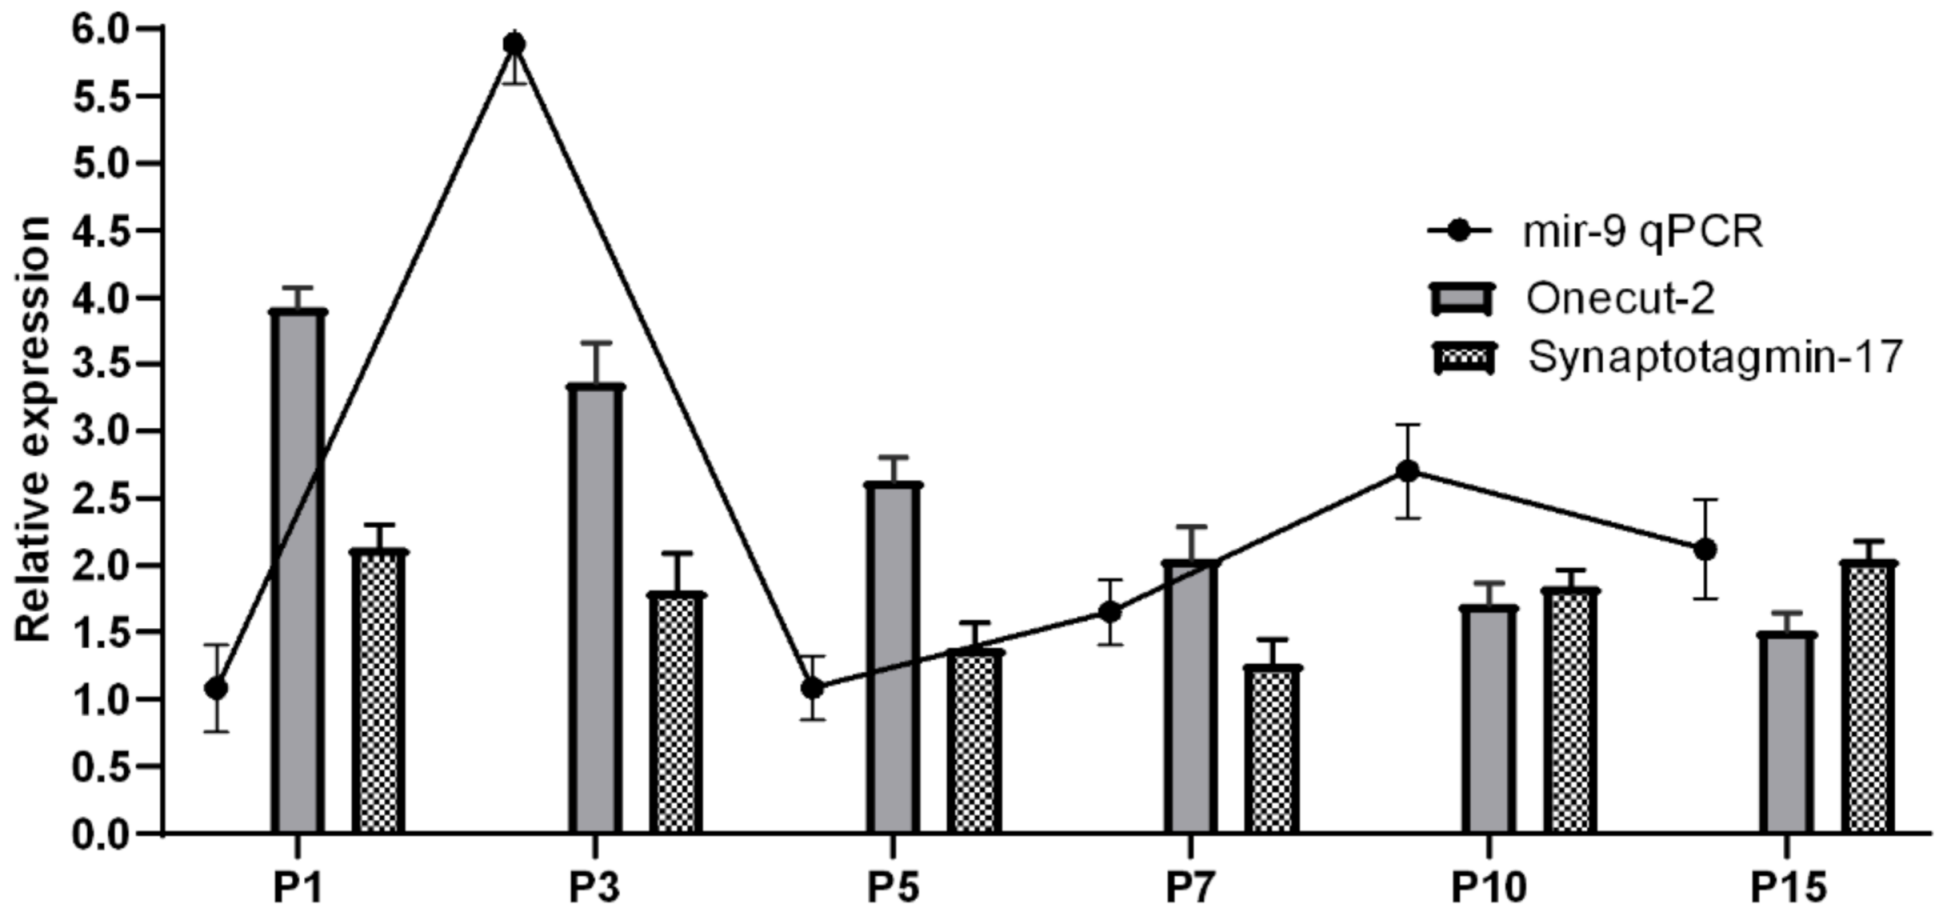
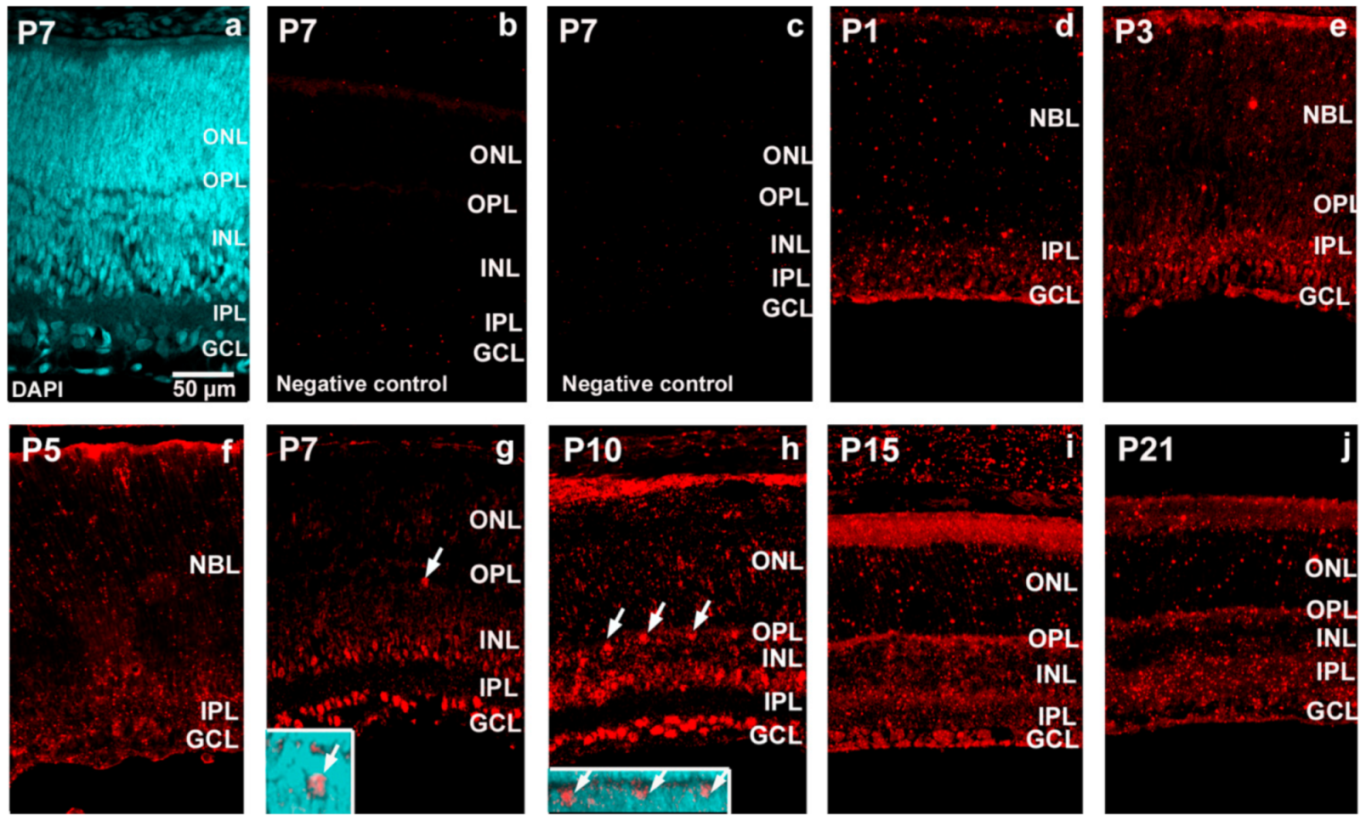
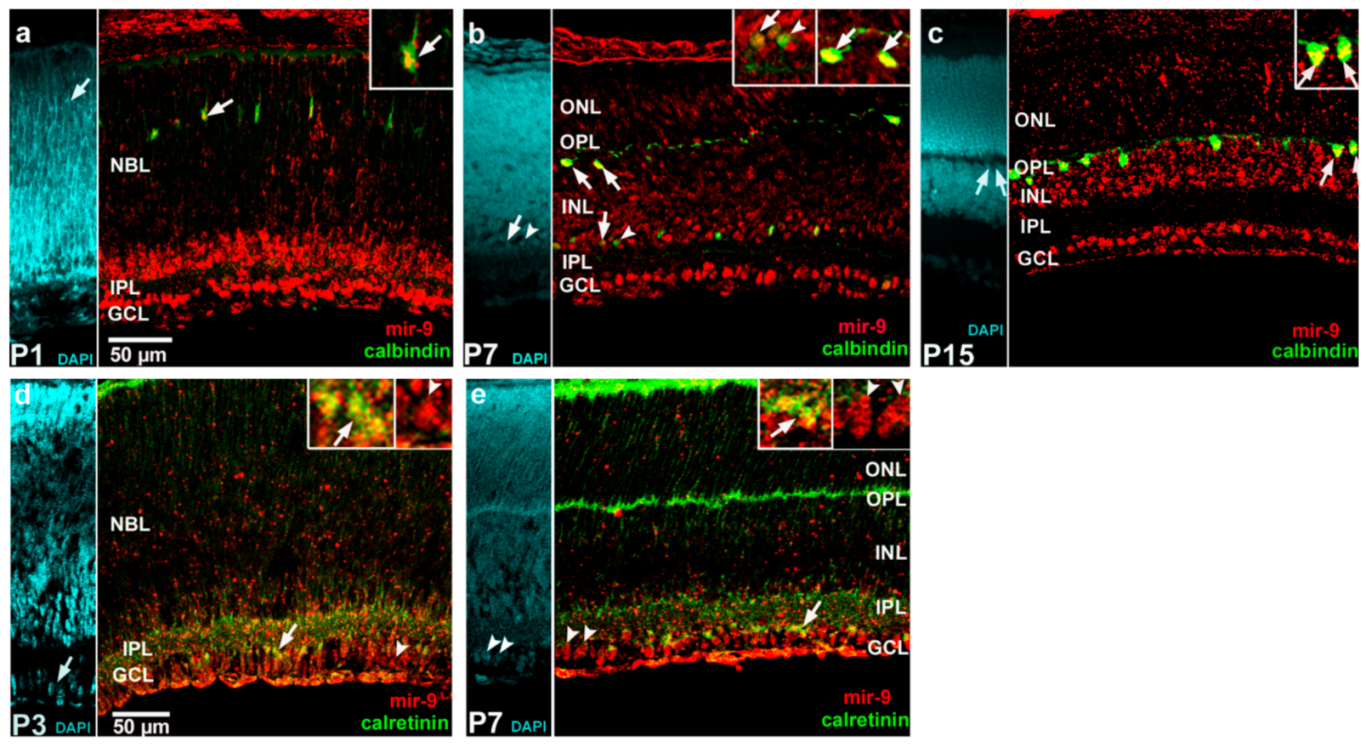
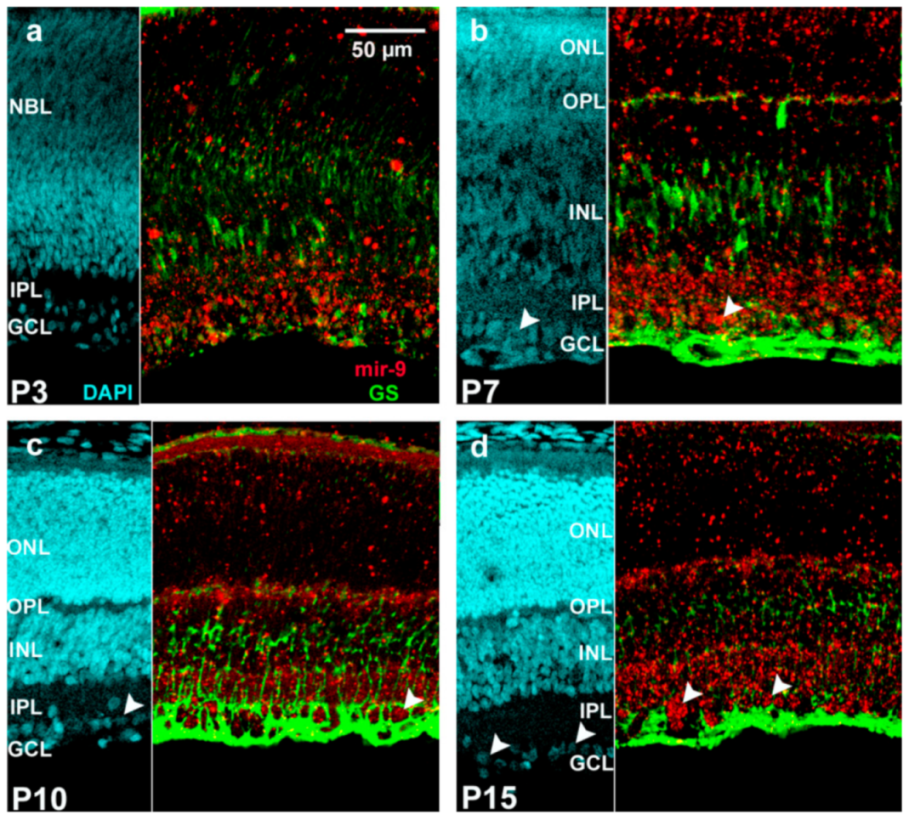
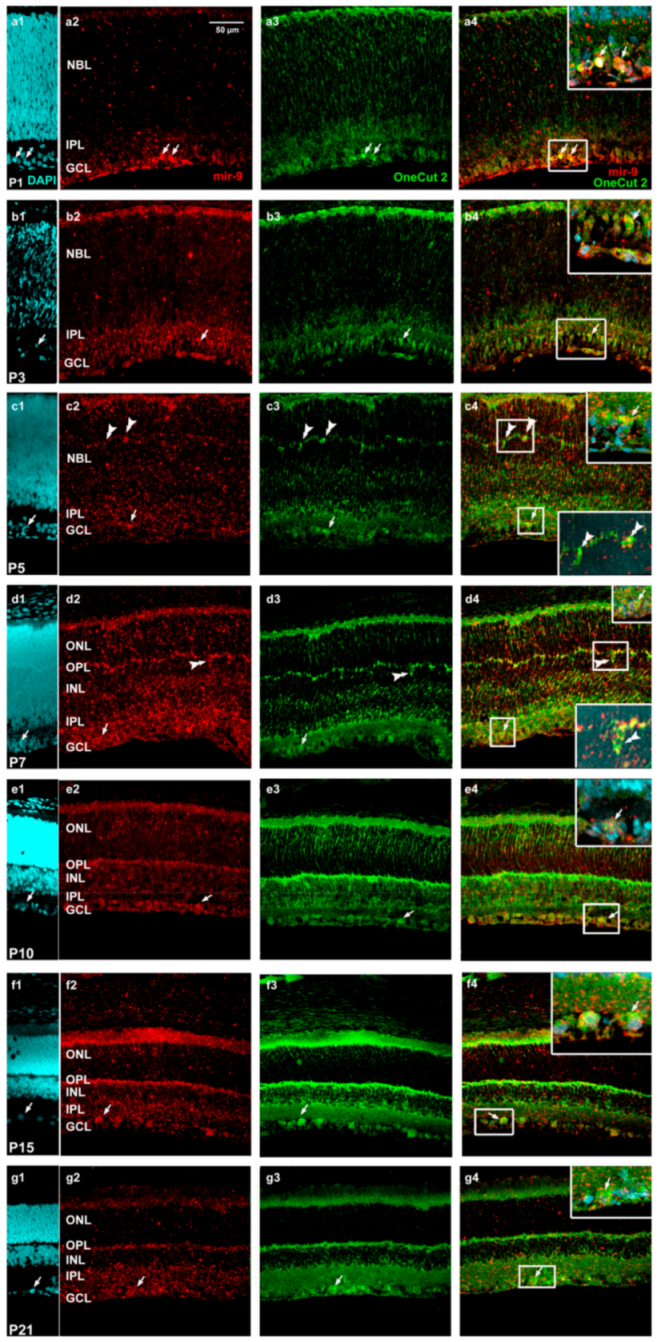
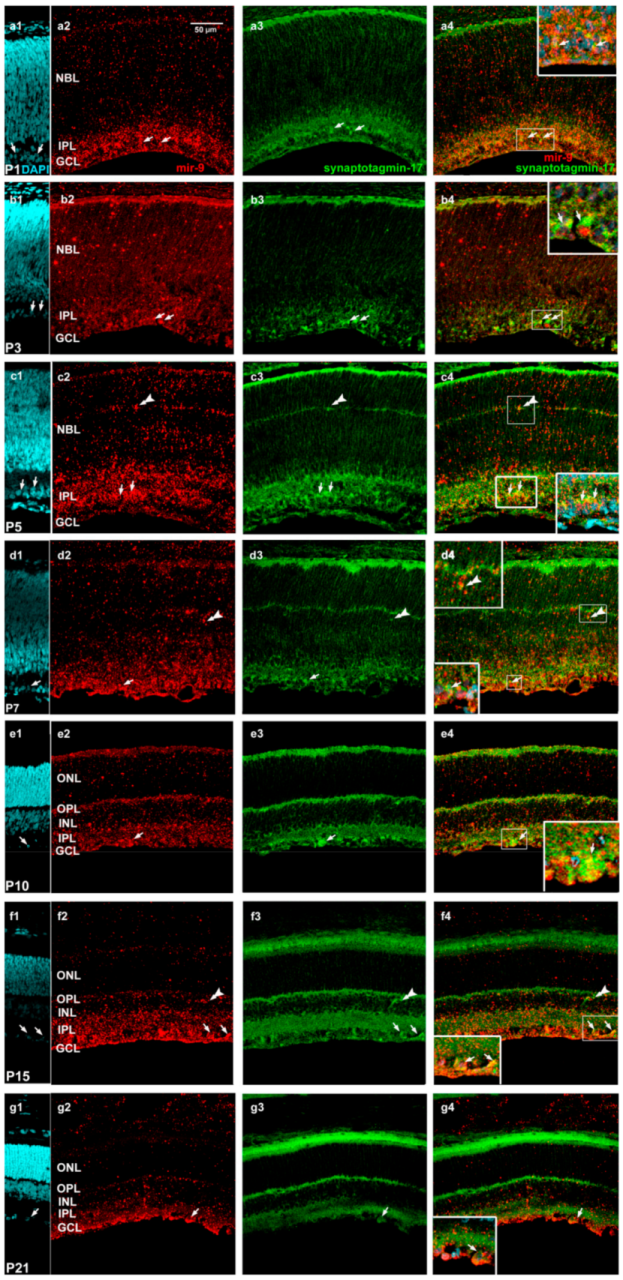
2. Results
3. Discussion
4. Materials and Methods
4.1. Animal Procedures
4.2. RNA Isolation
4.3. Small RNA Sequencing and Computational Analyses
4.4. Reverse Transcription and Real-Time PCR Quantitation
4.5. Combined MicroRNA In Situ Hybridization and Immunocytochemistry
Supplementary Materials
Author Contributions
Funding
Institutional Review Board Statement
Informed Consent Statement
Data Availability Statement
Acknowledgments
Conflicts of Interest
Abbreviations
| CNS | central nervous system |
| RPC | retinal progenitor cells |
| Tbx | T-box transcription factor |
| Irx | Iroquois homeobox |
| INL | inner nuclear layer |
| GCL | ganglion cell layer |
| IPL | inner plexiform layer |
| OPL | outer plexiform layer |
| ONL | outer nuclear layer |
| NBL | neuroblast layer |
| RT-qPCR | quantitative reverse transcription PCR |
| TSA | tyramide-signal amplification |
| ISH | in situ hybridization |
| PBS | phosphate-buffered saline |
| anti-DIG- horseradish peroxidase | anti-digoxigenin-horseradish peroxidase |
| PFA | paraformaldehyde |
| TNT | Tris–NaCl–Tween |
| SSC | saline-sodium citrate |
| GS | glutamine synthetase |
| TNB | Tris–NaCl blocking |
| DAPI | 4′,6-diamidino-2-phenylindole |
| PGM | Ion Personal Genomics Machine |
References
- Lagos-Quintana, M.; Rauhut, R.; Yalcin, A.; Meyer, J.; Lendeckel, W.; Tuschl, T. Identification of tissue-specific microRNAs from mouse. Curr. Biol. 2002, 12, 735–739. [Google Scholar] [CrossRef]
- Bartel, D.P. MicroRNAs: Genomics, biogenesis, mechanism, and function. Cell 2004, 116, 281–297. [Google Scholar] [CrossRef]
- Loscher, C.J.; Hokamp, K.; Kenna, P.F.; Ivens, A.C.; Humphries, P.; Palfi, A.; Farrar, G.J. Altered retinal microRNA expression profile in a mouse model of retinitis pigmentosa. Genome Biol. 2007, 8, R248. [Google Scholar] [CrossRef] [PubMed]
- Kapsimali, M.; Kloosterman, W.P.; de Bruijn, E.; Rosa, F.; Plasterk, R.H.; Wilson, S.W. MicroRNAs show a wide diversity of expression profiles in the developing and mature central nervous system. Genome Biol. 2007, 8, R173. [Google Scholar] [CrossRef] [PubMed]
- Bak, M.; Silahtaroglu, A.; Moller, M.; Christensen, M.; Rath, M.F.; Skryabin, B.; Tommerup, N.; Kauppinen, S. MicroRNA expression in the adult mouse central nervous system. RNA 2008, 14, 432–444. [Google Scholar] [CrossRef] [PubMed]
- Maiorano, N.A.; Hindges, R. Non-coding RNAs in retinal development. Int. J. Mol. Sci. 2012, 13, 558–578. [Google Scholar] [CrossRef]
- Mohr, A.M.; Mott, J.L. Overview of microRNA biology. Semin. Liver Dis. 2015, 35, 3–11. [Google Scholar] [CrossRef] [PubMed]
- Xiang, M. Intrinsic control of mammalian retinogenesis. Cell. Mol. Life Sci. 2013, 70, 2519–2532. [Google Scholar] [CrossRef]
- Arora, A.; Guduric-Fuchs, J.; Harwood, L.; Dellett, M.; Cogliati, T.; Simpson, D.A. Prediction of microRNAs affecting mRNA expression during retinal development. BMC Dev. Biol. 2010, 10, 1. [Google Scholar] [CrossRef]
- Georgi, S.A.; Reh, T.A. Dicer is required for the transition from early to late progenitor state in the developing mouse retina. J. Neurosci. 2010, 30, 4048–4061. [Google Scholar] [CrossRef]
- Hackler, L., Jr.; Wan, J.; Swaroop, A.; Qian, J.; Zack, D.J. MicroRNA profile of the developing mouse retina. Investig. Ophthalmol. Vis. Sci. 2010, 51, 1823–1831. [Google Scholar] [CrossRef]
- Sundermeier, T.R.; Palczewski, K. The physiological impact of microRNA gene regulation in the retina. Cell. Mol. Life Sci. 2012, 69, 2739–2750. [Google Scholar] [CrossRef] [PubMed]
- La Torre, A.; Georgi, S.; Reh, T.A. Conserved microRNA pathway regulates developmental timing of retinal neurogenesis. Proc. Natl. Acad. Sci. USA 2013, 110, E2362–E2370. [Google Scholar] [CrossRef] [PubMed]
- Andreeva, K.; Cooper, N.G. MicroRNAs in the Neural Retina. Int. J. Genom. 2014, 2014, 165897. [Google Scholar] [CrossRef] [PubMed]
- Miller, F.D.; Gauthier, A.S. Timing is everything: Making neurons versus glia in the developing cortex. Neuron 2007, 54, 357–369. [Google Scholar] [CrossRef] [PubMed]
- Bayer, S.A.; Altman, J. Neocortical Development; Raven Press: New York, NY, USA, 1991; pp. 11–222. [Google Scholar]
- Sidman, R.L. Histogenesis of Mouse Retina Studied with Thymidine-H3. In The Structure of the Eye; Smelser, G.K., Ed.; Academic Press: New York, NY, USA, 1961; pp. 487–506. [Google Scholar]
- Cepko, C.L.; Austin, C.P.; Yang, X.; Alexiades, M.; Ezzeddine, D. Cell fate determination in the vertebrate retina. Proc. Natl. Acad. Sci. USA 1996, 93, 589–595. [Google Scholar] [CrossRef]
- Rapaport, D.H.; Wong, L.L.; Wood, E.D.; Yasumura, D.; LaVail, M.M. Timing and topography of cell genesis in the rat retina. J. Comp. Neurol. 2004, 474, 304–324. [Google Scholar] [CrossRef] [PubMed]
- Bassett, E.A.; Wallace, V.A. Cell fate determination in the vertebrate retina. Trends Neurosci. 2012, 35, 565–573. [Google Scholar] [CrossRef]
- Hoon, M.; Okawa, H.; Della Santina, L.; Wong, R.O. Functional architecture of the retina: Development and disease. Prog. Retin. Eye Res. 2014, 42, 44–84. [Google Scholar] [CrossRef]
- Reese, B.E. Development of the retina and optic pathway. Vision Res. 2011, 51, 613–632. [Google Scholar] [CrossRef]
- Livesey, F.J.; Cepko, C.L. Vertebrate neural cell-fate determination: Lessons from the retina. Nat. Rev. Neurosci. 2001, 2, 109–118. [Google Scholar] [CrossRef] [PubMed]
- Agathocleous, M.; Harris, W.A. From progenitors to differentiated cells in the vertebrate retina. Annu. Rev. Cell Dev. Biol. 2009, 25, 45–69. [Google Scholar] [CrossRef]
- Leucht, C.; Stigloher, C.; Wizenmann, A.; Klafke, R.; Folchert, A.; Bally-Cuif, L. MicroRNA-9 directs late organizer activity of the midbrain-hindbrain boundary. Nat. Neurosci. 2008, 11, 641–648. [Google Scholar] [CrossRef] [PubMed]
- Gao, F.B. Context-dependent functions of specific microRNAs in neuronal development. Neural Dev. 2010, 5, 25. [Google Scholar] [CrossRef] [PubMed]
- Coolen, M.; Katz, S.; Bally-Cuif, L. miR-9: A versatile regulator of neurogenesis. Front. Cell. Neurosci. 2013, 7, 220. [Google Scholar] [CrossRef]
- Madelaine, R.; Sloan, S.A.; Huber, N.; Notwell, J.H.; Leung, L.C.; Skariah, G.; Halluin, C.; Pasca, S.P.; Bejerano, G.; Krasnow, M.A.; et al. MicroRNA-9 Couples Brain Neurogenesis and Angiogenesis. Cell Rep. 2017, 20, 1533–1542. [Google Scholar] [CrossRef]
- Xu, S.; Witmer, P.D.; Lumayag, S.; Kovacs, B.; Valle, D. MicroRNA (miRNA) transcriptome of mouse retina and identification of a sensory organ-specific miRNA cluster. J. Biol. Chem. 2007, 282, 25053–25066. [Google Scholar] [CrossRef]
- Hu, Y.; Luo, M.; Ni, N.; Den, Y.; Xia, J.; Chen, J.; Ji, J.; Zhou, X.; Fan, X.; Gu, P. Reciprocal actions of microRNA-9 and TLX in the proliferation and differentiation of retinal progenitor cells. Stem Cells Dev. 2014, 23, 2771–2781. [Google Scholar] [CrossRef]
- Qi, X. The role of miR-9 during neuron differentiation of mouse retinal stem cells. Artif. Cells Nanomed. Biotechnol. 2016, 44, 1883–1890. [Google Scholar] [CrossRef] [PubMed]
- Zhao, C.; Sun, G.; Li, S.; Shi, Y. A feedback regulatory loop involving microRNA-9 and nuclear receptor TLX in neural stem cell fate determination. Nat. Struct. Mol. Biol. 2009, 16, 365–371. [Google Scholar] [CrossRef]
- Karali, M.; Peluso, I.; Marigo, V.; Banfi, S. Identification and characterization of microRNAs expressed in the mouse eye. Investig. Ophthalmol. Vis. Sci. 2007, 48, 509–515. [Google Scholar] [CrossRef] [PubMed]
- Wohl, S.G.; Reh, T.A. The microRNA expression profile of mouse Muller glia in vivo and in vitro. Sci. Rep. 2016, 6, 35423. [Google Scholar] [CrossRef]
- Suzuki, F.; Okuno, M.; Tanaka, T.; Sanuki, R. Overexpression of neural miRNAs miR-9/9* and miR-124 suppresses differentiation to Muller glia and promotes differentiation to neurons in mouse retina in vivo. Genes Cells 2020, 25, 741–752. [Google Scholar] [CrossRef] [PubMed]
- Wu, F.; Sapkota, D.; Li, R.; Mu, X. OneCut 1 and OneCut 2 are potential regulators of mouse retinal development. J. Comp. Neurol. 2012, 520, 952–969. [Google Scholar] [CrossRef]
- Lee, M.Y.; Choi, S.H.; Shin, S.L.; Chin, H.; Kwon, O.J. Distribution of B/K protein in rat brain. Cell Tissue Res. 2001, 303, 47–56. [Google Scholar] [CrossRef] [PubMed]
- Bernard, R.; Kerman, I.A.; Meng, F.; Evans, S.J.; Amrein, I.; Jones, E.G.; Bunney, W.E.; Akil, H.; Watson, S.J.; Thompson, R.C. Gene expression profiling of neurochemically defined regions of the human brain by in situ hybridization-guided laser capture microdissection. J. Neurosci. Methods 2009, 178, 46–54. [Google Scholar] [CrossRef]
- Dean, C.; Dunning, F.M.; Liu, H.; Bomba-Warczak, E.; Martens, H.; Bharat, V.; Ahmed, S.; Chapman, E.R. Axonal and dendritic synaptotagmin isoforms revealed by a pHluorin-syt functional screen. Mol. Biol. Cell 2012, 23, 1715–1727. [Google Scholar] [CrossRef] [PubMed]
- Wu, M.V.; Sahay, A.; Duman, R.S.; Hen, R. Functional differentiation of adult-born neurons along the septotemporal axis of the dentate gyrus. Cold Spring Harb. Perspect. Biol. 2015, 7, a018978. [Google Scholar] [CrossRef] [PubMed]
- Ruhl, D.A.; Bomba-Warczak, E.; Watson, E.T.; Bradberry, M.M.; Peterson, T.A.; Basu, T.; Frelka, A.; Evans, C.S.; Briguglio, J.S.; Basta, T.; et al. Synaptotagmin 17 controls neurite outgrowth and synaptic physiology via distinct cellular pathways. Nat. Commun. 2019, 10, 3532. [Google Scholar] [CrossRef] [PubMed]
- Craxton, M. A manual collection of Syt, Esyt, Rph3a, Rph3al, Doc2, and Dblc2 genes from 46 metazoan genomes--an open access resource for neuroscience and evolutionary biology. BMC Genom. 2010, 11, 37. [Google Scholar] [CrossRef]
- Kwon, O.J.; Ju, W.K.; Choi, S.H.; Lee, M.Y.; Oh, S.J.; Chun, M.H. The expression and cellular localization of brain/kidney protein in the rat retina. Brain Res. 2000, 860, 178–180. [Google Scholar] [CrossRef]
- Ju, W.K.; Choi, S.H.; Kwon, J.S.; Kwon, O.J.; Lee, M.Y.; Oh, S.J.; Moon, J.L.; Chun, M.H. Expression of brain/kidney protein in Muller cells of rat retina following transient ischemia. Neurosci. Lett. 2000, 293, 53–56. [Google Scholar] [CrossRef]
- Plaisance, V.; Abderrahmani, A.; Perret-Menoud, V.; Jacquemin, P.; Lemaigre, F.; Regazzi, R. MicroRNA-9 controls the expression of Granuphilin/Slp4 and the secretory response of insulin-producing cells. J. Biol. Chem. 2006, 281, 26932–26942. [Google Scholar] [CrossRef] [PubMed]
- Pietrzykowski, A.Z.; Friesen, R.M.; Martin, G.E.; Puig, S.I.; Nowak, C.L.; Wynne, P.M.; Siegelmann, H.T.; Treistman, S.N. Posttranscriptional regulation of BK channel splice variant stability by miR-9 underlies neuroadaptation to alcohol. Neuron 2008, 59, 274–287. [Google Scholar] [CrossRef]
- Chou, C.H.; Shrestha, S.; Yang, C.D.; Chang, N.W.; Lin, Y.L.; Liao, K.W.; Huang, W.C.; Sun, T.H.; Tu, S.J.; Lee, W.H.; et al. miRTarBase update 2018: A resource for experimentally validated microRNA-target interactions. Nucleic Acids Res. 2018, 46, D296–D302. [Google Scholar] [CrossRef]
- Arora, A.; McKay, G.J.; Simpson, D.A. Prediction and verification of miRNA expression in human and rat retinas. Investig. Ophthalmol. Vis. Sci. 2007, 48, 3962–3967. [Google Scholar] [CrossRef] [PubMed]
- Kutty, R.K.; Samuel, W.; Jaworski, C.; Duncan, T.; Nagineni, C.N.; Raghavachari, N.; Wiggert, B.; Redmond, T.M. MicroRNA expression in human retinal pigment epithelial (ARPE-19) cells: Increased expression of microRNA-9 by N-(4-hydroxyphenyl)retinamide. Mol. Vis. 2010, 16, 1475–1486. [Google Scholar]
- Fan, W.J.; Li, X.; Yao, H.L.; Deng, J.X.; Liu, H.L.; Cui, Z.J.; Wang, Q.; Wu, P.; Deng, J.B. Neural differentiation and synaptogenesis in retinal development. Neural Regen. Res. 2016, 11, 312–318. [Google Scholar] [CrossRef]
- Kovacs-Valasek, A.; Szalontai, B.; Setalo, G., Jr.; Gabriel, R. Sensitive fluorescent hybridization protocol development for simultaneous detection of microRNA and cellular marker proteins (in the retina). Histochem. Cell Biol. 2018, 150, 557–566. [Google Scholar] [CrossRef] [PubMed]
- Sapkota, D.; Chintala, H.; Wu, F.; Fliesler, S.J.; Hu, Z.; Mu, X. OneCut1 and OneCut2 redundantly regulate early retinal cell fates during development. Proc. Natl. Acad. Sci. USA 2014, 111, E4086–E4095. [Google Scholar] [CrossRef]
- Sempere, L.F.; Freemantle, S.; Pitha-Rowe, I.; Moss, E.; Dmitrovsky, E.; Ambros, V. Expression profiling of mammalian microRNAs uncovers a subset of brain-expressed microRNAs with possible roles in murine and human neuronal differentiation. Genome Biol. 2004, 5, R13. [Google Scholar] [CrossRef]
- Simion, A.; Laudadio, I.; Prevot, P.P.; Raynaud, P.; Lemaigre, F.P.; Jacquemin, P. MiR-495 and miR-218 regulate the expression of the OneCut transcription factors HNF-6 and OC-2. Biochem. Biophys. Res. Commun. 2010, 391, 293–298. [Google Scholar] [CrossRef] [PubMed]
- Lemaigre, F.P.; Durviaux, S.M.; Truong, O.; Lannoy, V.J.; Hsuan, J.J.; Rousseau, G.G. Hepatocyte nuclear factor 6, a transcription factor that contains a novel type of homeodomain and a single cut domain. Proc. Natl. Acad. Sci. USA 1996, 93, 9460–9464. [Google Scholar] [CrossRef]
- Margagliotti, S.; Clotman, F.; Pierreux, C.E.; Beaudry, J.B.; Jacquemin, P.; Rousseau, G.G.; Lemaigre, F.P. The OneCut transcription factors HNF-6/OC-1 and OC-2 regulate early liver expansion by controlling hepatoblast migration. Dev. Biol. 2007, 311, 579–589. [Google Scholar] [CrossRef] [PubMed]
- Espana, A.; Clotman, F. OneCut transcription factors are required for the second phase of development of the A13 dopaminergic nucleus in the mouse. J. Comp. Neurol. 2012, 520, 1424–1441. [Google Scholar] [CrossRef]
- Espana, A.; Clotman, F. OneCut factors control development of the Locus Coeruleus and of the mesencephalic trigeminal nucleus. Mol. Cell. Neurosci. 2012, 50, 93–102. [Google Scholar] [CrossRef]
- Roy, A.; Francius, C.; Rousso, D.L.; Seuntjens, E.; Debruyn, J.; Luxenhofer, G.; Huber, A.B.; Huylebroeck, D.; Novitch, B.G.; Clotman, F. OneCut transcription factors act upstream of Isl1 to regulate spinal motoneuron diversification. Development 2012, 139, 3109–3119. [Google Scholar] [CrossRef]
- Goetz, J.J.; Martin, G.M.; Chowdhury, R.; Trimarchi, J.M. OneCut1 and OneCut2 play critical roles in the development of the mouse retina. PLoS ONE 2014, 9, e110194. [Google Scholar] [CrossRef]
- Goetz, J.J.; Trimarchi, J.M. Transcriptomic analyses of OneCut1 and OneCut2 deficient retinas. Genom. Data 2015, 4, 88–89. [Google Scholar] [CrossRef][Green Version]
- van Battum, E.Y.; Verhagen, M.G.; Vangoor, V.R.; Fujita, Y.; Derijck, A.; O’Duibhir, E.; Giuliani, G.; de Gunst, T.; Adolfs, Y.; Lelieveld, D.; et al. An Image-Based miRNA Screen Identifies miRNA-135s As Regulators of CNS Axon Growth and Regeneration by Targeting Kruppel-like Factor 4. J. Neurosci. 2018, 38, 613–630. [Google Scholar] [CrossRef]
- Ziats, M.N.; Rennert, O.M. Identification of differentially expressed microRNAs across the developing human brain. Mol. Psychiatry 2014, 19, 848–852. [Google Scholar] [CrossRef] [PubMed]
- Caronia-Brown, G.; Anderegg, A.; Awatramani, R. Expression and functional analysis of the Wnt/beta-catenin induced mir-135a-2 locus in embryonic forebrain development. Neural Dev. 2016, 11, 9. [Google Scholar] [CrossRef]
- Bringmann, A.; Faude, F.; Reichenbach, A. Mammalian retinal glial (Muller) cells express large-conductance Ca(2+)-activated K+ channels that are modulated by Mg2+ and pH and activated by protein kinase A. Glia 1997, 19, 311–323. [Google Scholar] [CrossRef]
- Schopf, S.; Bringmann, A.; Reichenbach, A. Protein kinases A and C are opponents in modulating glial Ca2+ -activated K+ channels. Neuroreport 1999, 10, 1323–1327. [Google Scholar] [CrossRef]
- O’Brien, J.; Hayder, H.; Zayed, Y.; Peng, C. Overview of MicroRNA Biogenesis, Mechanisms of Actions, and Circulation. Front. Endocrinol. (Lausanne) 2018, 9, 402. [Google Scholar] [CrossRef]
- Herranz, H.; Cohen, S.M. MicroRNAs and gene regulatory networks: Managing the impact of noise in biological systems. Genes Dev. 2010, 24, 1339–1344. [Google Scholar] [CrossRef]
- Afgan, E.; Baker, D.; Batut, B.; van den Beek, M.; Bouvier, D.; Cech, M.; Chilton, J.; Clements, D.; Coraor, N.; Gruning, B.A.; et al. The Galaxy platform for accessible, reproducible and collaborative biomedical analyses: 2018 update. Nucleic Acids Res. 2018, 46, W537–W544. [Google Scholar] [CrossRef]
- Trapnell, C.; Williams, B.A.; Pertea, G.; Mortazavi, A.; Kwan, G.; van Baren, M.J.; Salzberg, S.L.; Wold, B.J.; Pachter, L. Transcript assembly and quantification by RNA-Seq reveals unannotated transcripts and isoform switching during cell differentiation. Nat. Biotechnol. 2010, 28, 511–515. [Google Scholar] [CrossRef] [PubMed]
- Edgar, R.; Domrachev, M.; Lash, A.E. Gene Expression Omnibus: NCBI gene expression and hybridization array data repository. Nucleic Acids Res. 2002, 30, 207–210. [Google Scholar] [CrossRef] [PubMed]
- RStudio, RStudio Team. Integrated Development for R. (Computer Software v0.98.1074); RStudio, Inc.: Boston, MA, USA, 2015. [Google Scholar]
- Livak, K.J.; Schmittgen, T.D. Analysis of relative gene expression data using real-time quantitative PCR and the 2(-Delta Delta C(T)) Method. Methods 2001, 25, 402–408. [Google Scholar] [CrossRef] [PubMed]


Publisher’s Note: MDPI stays neutral with regard to jurisdictional claims in published maps and institutional affiliations. |
© 2021 by the authors. Licensee MDPI, Basel, Switzerland. This article is an open access article distributed under the terms and conditions of the Creative Commons Attribution (CC BY) license (http://creativecommons.org/licenses/by/4.0/).
Share and Cite
Pöstyéni, E.; Kovács-Valasek, A.; Urbán, P.; Czuni, L.; Sétáló, G., Jr.; Fekete, C.; Gabriel, R. Analysis of mir-9 Expression Pattern in Rat Retina during Postnatal Development. Int. J. Mol. Sci. 2021, 22, 2577. https://doi.org/10.3390/ijms22052577
Pöstyéni E, Kovács-Valasek A, Urbán P, Czuni L, Sétáló G Jr., Fekete C, Gabriel R. Analysis of mir-9 Expression Pattern in Rat Retina during Postnatal Development. International Journal of Molecular Sciences. 2021; 22(5):2577. https://doi.org/10.3390/ijms22052577
Chicago/Turabian StylePöstyéni, Etelka, Andrea Kovács-Valasek, Péter Urbán, Lilla Czuni, György Sétáló, Jr., Csaba Fekete, and Robert Gabriel. 2021. "Analysis of mir-9 Expression Pattern in Rat Retina during Postnatal Development" International Journal of Molecular Sciences 22, no. 5: 2577. https://doi.org/10.3390/ijms22052577
APA StylePöstyéni, E., Kovács-Valasek, A., Urbán, P., Czuni, L., Sétáló, G., Jr., Fekete, C., & Gabriel, R. (2021). Analysis of mir-9 Expression Pattern in Rat Retina during Postnatal Development. International Journal of Molecular Sciences, 22(5), 2577. https://doi.org/10.3390/ijms22052577