Article

ANT1 Activation and Inhibition Patterns Support the Fatty Acid Cycling Mechanism for Proton Transport

1
Institute of Physiology, Pathophysiology and Biophysics, Department of Biomedical Sciences, University of Veterinary Medicine, 1210 Vienna, Austria
2
Institute of Pharmacology and Toxicology, Rostock University Medical Center, 18057 Rostock, Germany
3
Division of Organic Chemistry and Biochemistry, Rudjer Bošković Institute,10000 Zagreb, Croatia
4
Institute of Biophysics, Johannes Kepler University, 4020 Linz, Austria
5
Institute of Organic Chemistry and Biochemistry, Czech Academy of Sciences, 16610 Prague 6, Czech Republic
*
Author to whom correspondence should be addressed.
Int. J. Mol. Sci. 2021, 22(5), 2490; https://doi.org/10.3390/ijms22052490
Submission received: 8 January 2021 / Revised: 22 February 2021 / Accepted: 24 February 2021 / Published: 2 March 2021
(This article belongs to the Special Issue Membrane Proteins: Structure, Function and Motion)

Abstract

:
Adenine nucleotide translocase (ANT) is a well-known mitochondrial exchanger of ATP against ADP. In contrast, few studies have shown that ANT also mediates proton transport across the inner mitochondrial membrane. The results of these studies are controversial and lead to different hypotheses about molecular transport mechanisms. We hypothesized that the H+-transport mediated by ANT and uncoupling proteins (UCP) has a similar regulation pattern and can be explained by the fatty acid cycling concept. The reconstitution of purified recombinant ANT1 in the planar lipid bilayers allowed us to measure the membrane current after the direct application of transmembrane potential ΔΨ, which would correspond to the mitochondrial states III and IV. Experimental results reveal that ANT1 does not contribute to a basal proton leak. Instead, it mediates H+ transport only in the presence of long-chain fatty acids (FA), as already known for UCPs. It depends on FA chain length and saturation, implying that FA’s transport is confined to the lipid-protein interface. Purine nucleotides with the preference for ATP and ADP inhibited H+ transport. Specific inhibitors of ATP/ADP transport, carboxyatractyloside or bongkrekic acid, also decreased proton transport. The H+ turnover number was calculated based on ANT1 concentration determined by fluorescence correlation spectroscopy and is equal to 14.6 ± 2.5 s−1. Molecular dynamic simulations revealed a large positively charged area at the protein/lipid interface that might facilitate FA anion’s transport across the membrane. ANT’s dual function—ADP/ATP and H+ transport in the presence of FA—may be important for the regulation of mitochondrial membrane potential and thus for potential-dependent processes in mitochondria. Moreover, the expansion of proton-transport modulating drug targets to ANT1 may improve the therapy of obesity, cancer, steatosis, cardiovascular and neurodegenerative diseases.

1. Introduction

In mitochondria, oxidative phosphorylation accounts for ATP production by phosphorylating ADP using proton (H+) gradient generated by the respiratory chain proteins (coupling). H+ can return to the matrix by alternative pathways (uncoupling): (i) inhibitor-non sensitive basal H+ leak (JB) and (ii) protein-mediated inhibitor-sensitive proton transport (JH) [1,2,3]. JB is sensitive to the membrane potential, mitochondrial inner membrane surface area, the composition of phospholipids and free fatty acids (FA) and was observed in mitochondria of all tissues [1]. Uncoupling proteins (UCP) are implicated in the mediation of JH [4,5,6,7,8,9]. As several tissues such as liver, kidney, skin, and others lack any UCPs under physiological conditions (for review, see [10]), mitochondrial adenine nucleotide translocase (ANT, also cited in the literature as AAC or ADP/ATP carrier) was proposed to provide an alternative pathway for proton transport alongside its well-known function to exchange ADP for ATP [11,12,13,14,15].
The H+ transporting function of ANT in the presence of palmitate has been first observed in experiments with isolated mitochondria [16,17]. The addition of free FA to the proteoliposomes reconstituted with purified ANT caused the transmembrane potential (ΔΦ) decrease, which was restored by carboxyatractyloside (CATR) and bongkrekic acid (BA) [18]. In brown-fat mitochondria from mice knockout for UCP1, fatty-acid-induced uncoupling could also be inhibited by CATR [19]. The H+ conductance of muscle mitochondria from mice knockout for ANT1 was reported to be half that of wild-type controls [20]. Recently, ANT-mediated H+ transport was observed in patched mitoplasts [21]. Although the H+ transporting function of ANT1 seems to be accepted, discrepancies in results obtained in various experimental systems led to different views on the proton transport mechanism. In the 1980–1990s, several groups recognized that the proton transport could occur by the flip-flop of the protonated form of long-chain fatty acid (FA) without membrane proteins’ participation [22,23]. However, a fatty acid anion (FA) transport is a rate-limiting step in FA circulation and has to be accelerated by proteins. In 1991, Skulachev proposed the “fatty acid circuit hypothesis”, claiming that proteins such as ANT1 and UCP1 mediate the return of the FA- to the cytosolic side of the membrane, resulting in net proton transport catalyzed by the protein [24]. Our previous results obtained for UCP1-UCP3 can be well described based on the FA cycling model and are consistent with the translocation of FA at the protein/lipid interface.
In contrast, Bertholet et al. proposed FA to be co-factors in H+ transport by ANT based on patch-clamp experiments [21]. In this model, FA is not translocated but stays in one place as a part of the protein translocating pathway, where it is (de-)protonated. This mechanism differed from the mechanism suggested by the same group for UCP1, in which UCP1 was regarded as a FA/H+ symporter [25]. Moreover, this model does not necessarily assume direct binding of H+ to the FA anion and allows the proton transport in both directions.
Here, we hypothesized that the H+-transport mediated by ANT has a regulation pattern similar to UCPs and can be explained by the FA cycling concept. The goals of this study were (i) to investigate the dependence of ANT-mediated H+ transport on FA structure, (ii) to estimate ANT-specific H+ turnover number, and (iii) to examine whether the specific ANT substrates inhibit H+ transport.

2. Results

2.1. ANT1-Mediated Substrate Transport

To evaluate whether recombinant murine ANT1 was correctly refolded in proteoliposomes, we performed ADP/ATP transport measurements using proteoliposomes initially filled with radioactively labeled 3H-ATP [26]. After adding ADP to the bulk solution, we measured the release of 3H-ATP with time (Supplementary Figure S2). The determined ADP/ATP exchange rate depends on ANT1 content (kANT = 5.53 ± 0.74 mmol/min/g) and corresponds well to the reported results for ANT reconstituted into liposomes (Supplementary Table S1) [26,27,28,29].

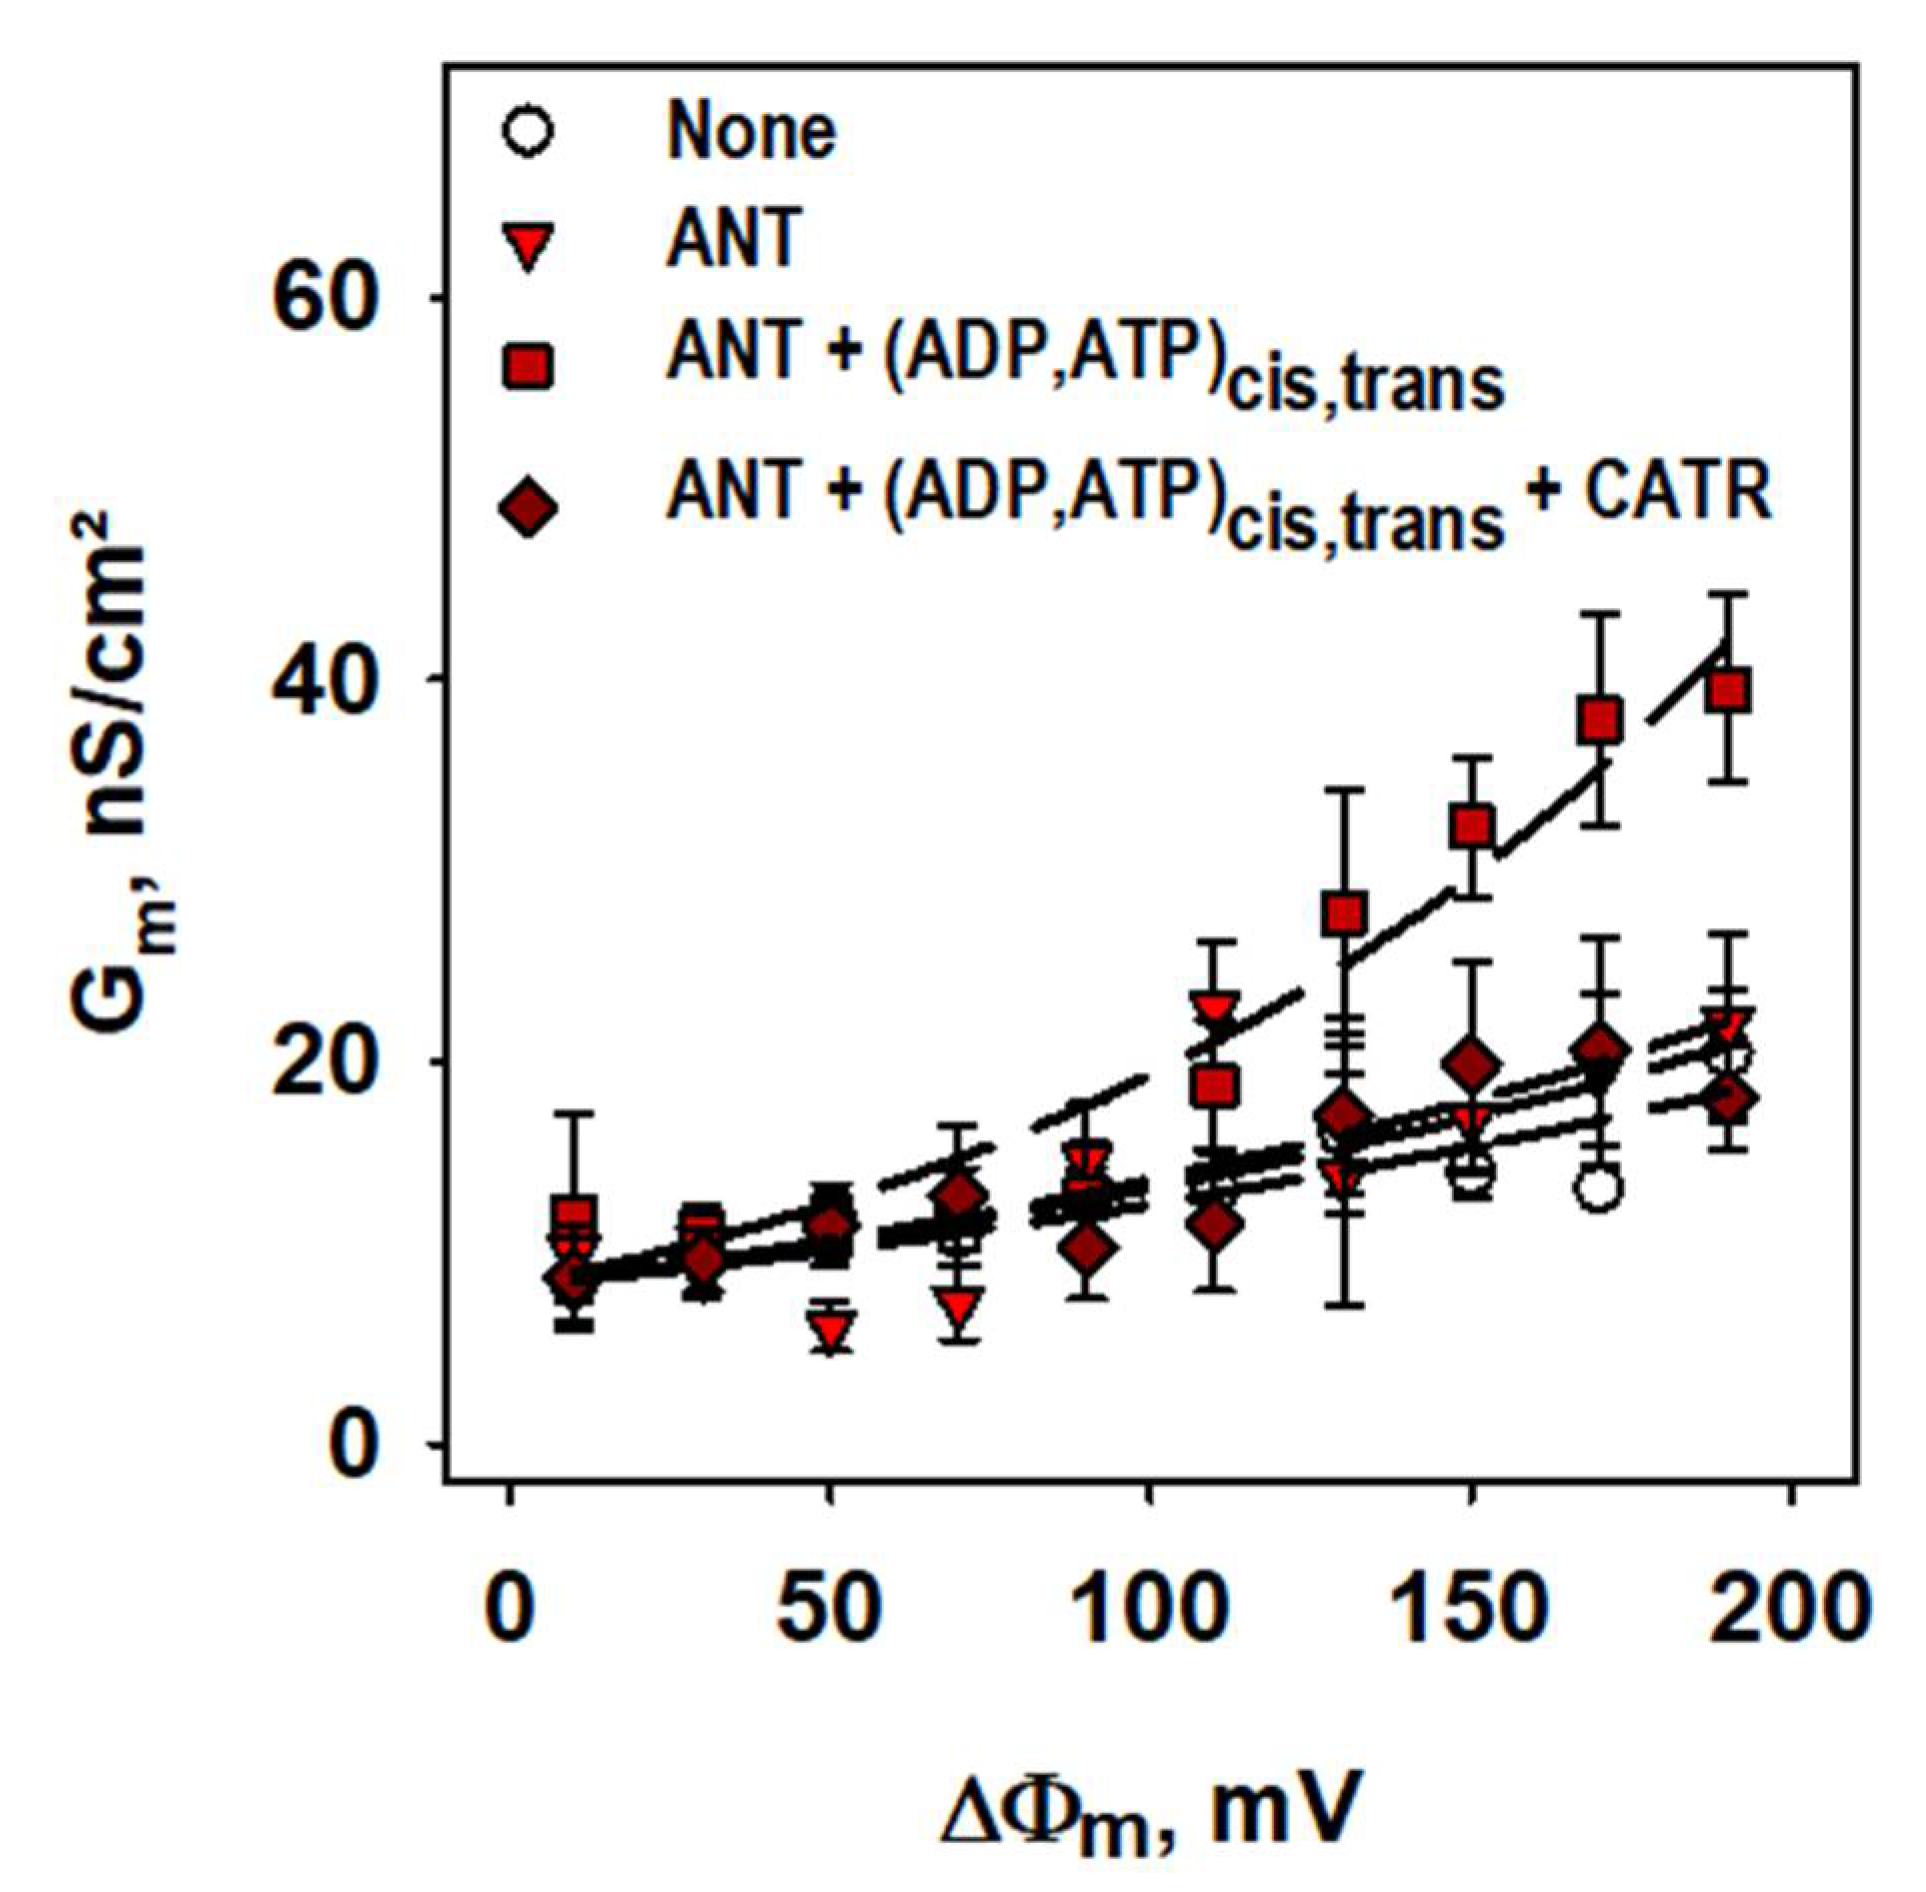
2.2. Basal Proton Leak

We further investigated the controversially discussed ANT1 involvement in the basal leak [20,21]. For this, we formed planar bilayer lipid membranes from proteoliposomes reconstituted with recombinant ANT1 [26]. Figure 1 demonstrates that the total specific conductances, Gm and G0, of bilayer membranes made from DOPC, DOPE, and cardiolipin were similar in the presence and absence of ANT1 (Gm =10.0 ± 2.0 nS/cm2 and G0 =8.4 ± 2.3 nS/cm2) if no purine nucleotides (PN) were added. The addition of ATP and ADP on both sides of the membrane led to a substantial Gm increase, which was directly proportional to the applied membrane potentials, reaching Gm = 39.5 ± 4.9 nS/cm2 at 190 mV (Figure 1, Supplementary Figure S3 and Supplementary Table S2. This increase vanished after adding the specific inhibitor of ADP/ATP transport—CATR (Figure 1) and can be explained by the electrogenic shift due to ATP/ADP exchange by ANT1. This experiment showed that ANT1 has no measurable impact on the proton leak without FAs.

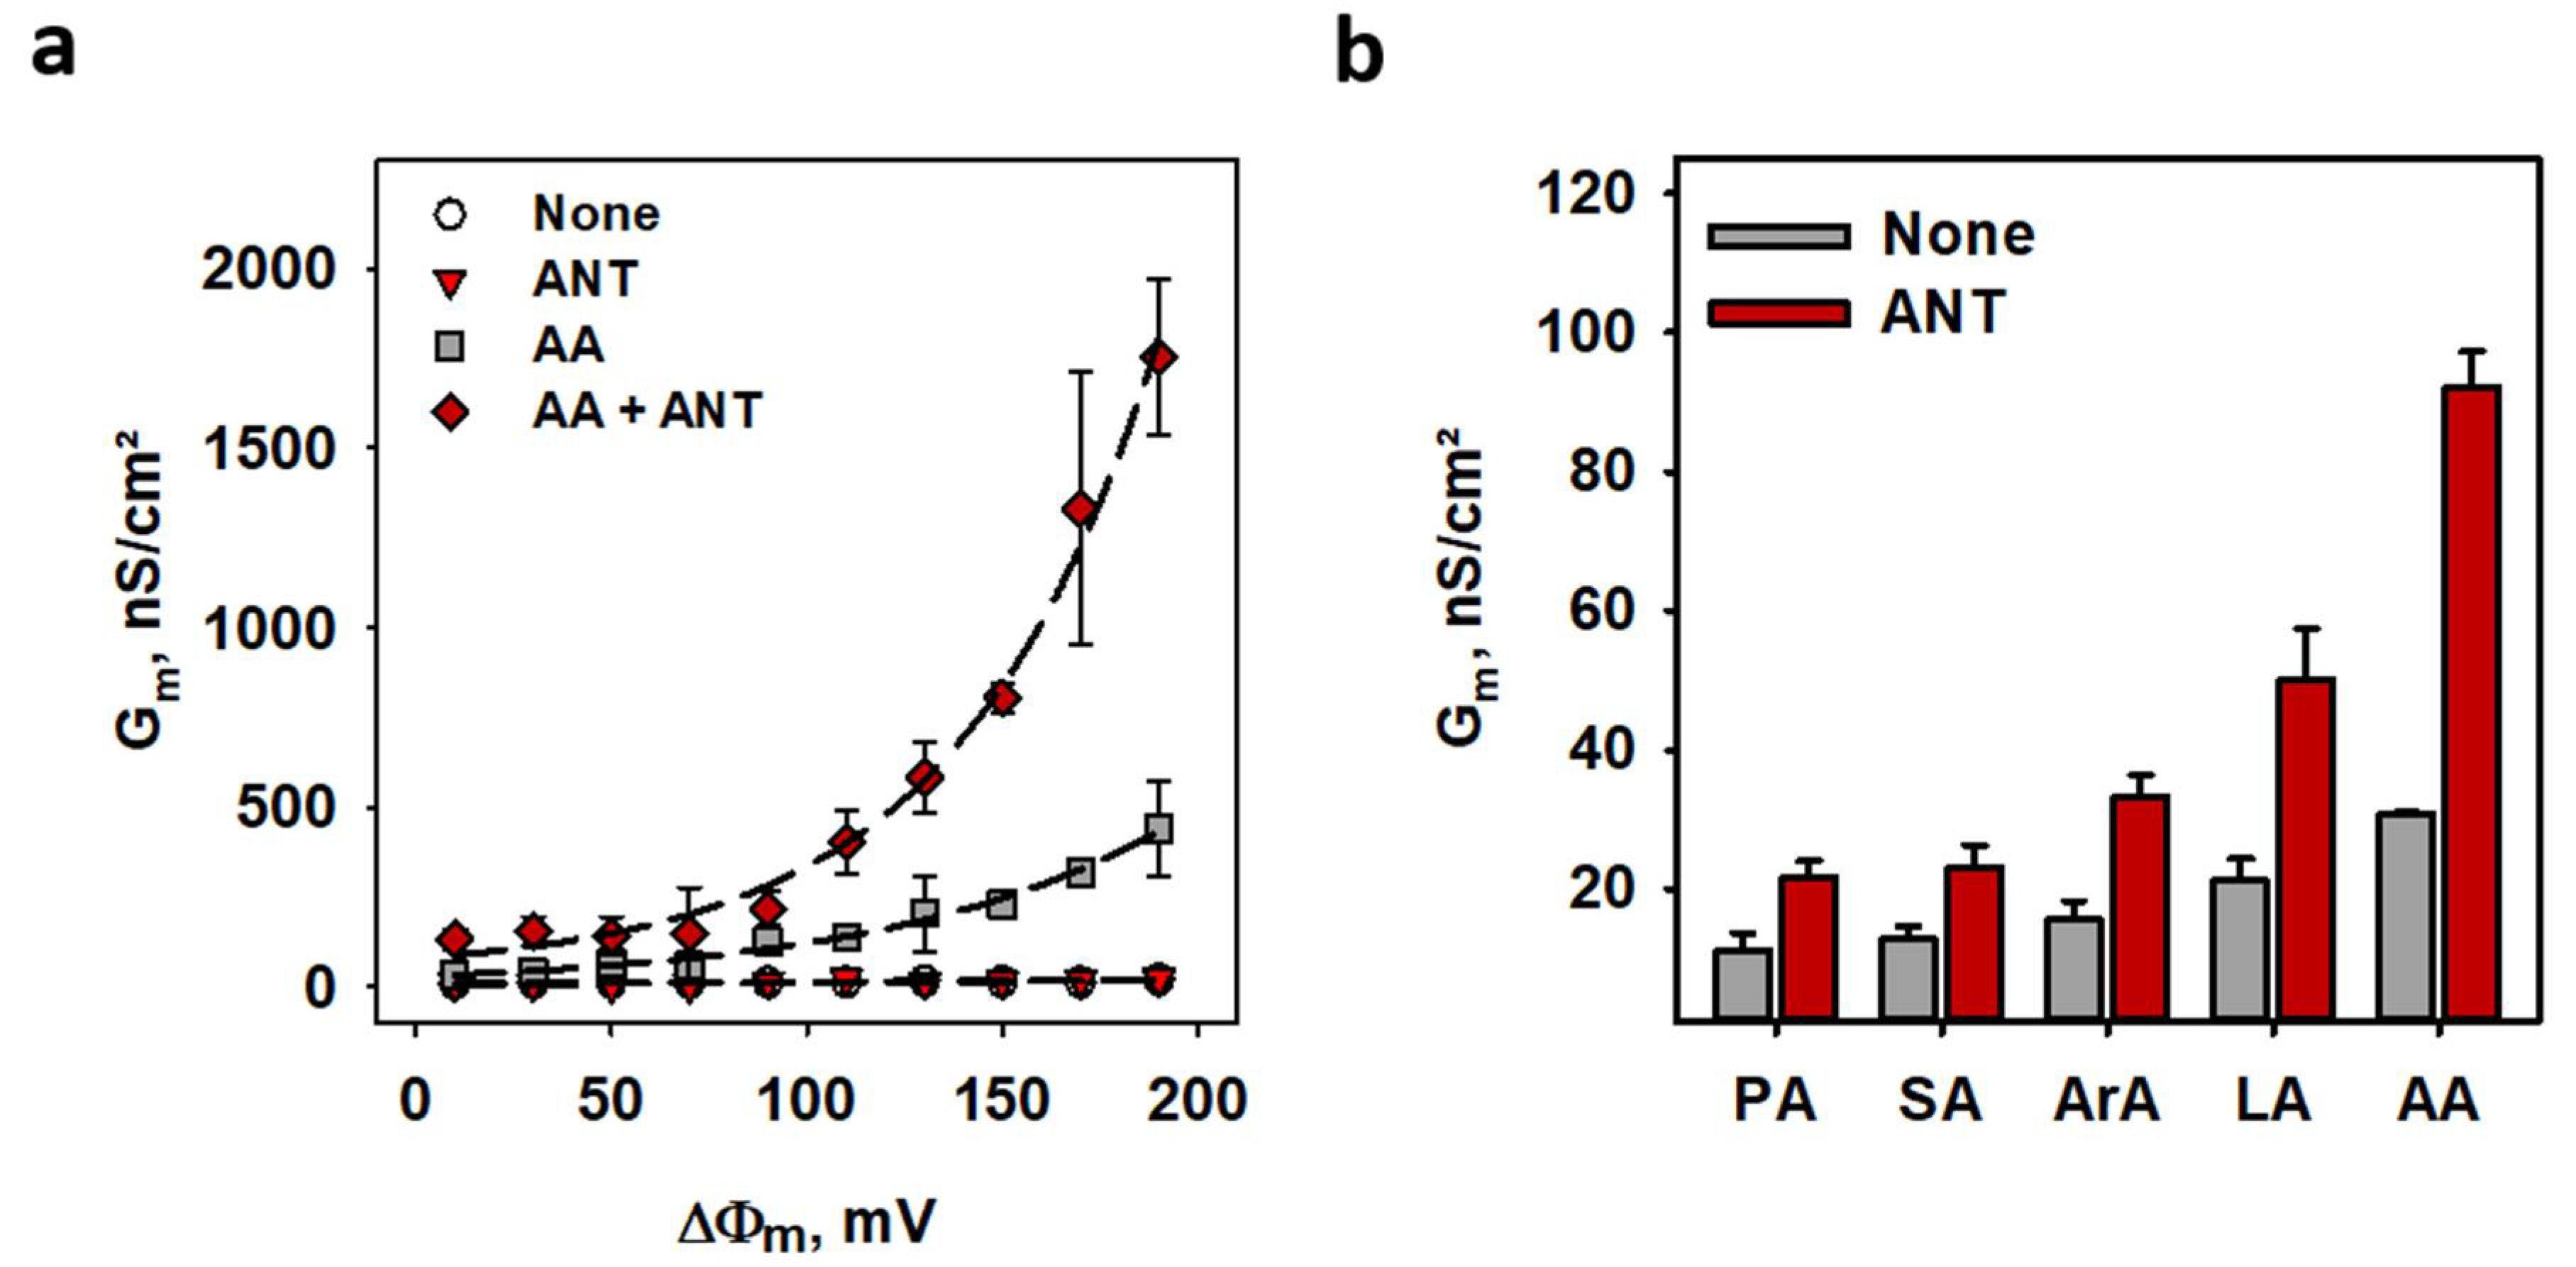
2.3. ANT1-Mediated Proton Transport in the Presence of FA

The addition of polyunsaturated arachidonic acid (AA) to the membrane in the absence of ANT1 led to a potential-dependent increase in Gm. It confirms FA’s importance as weak uncouplers, especially at high potentials (Gm was one order of magnitude higher at 190 mV) relevant for mitochondrial membranes [30]. The reconstitution of ANT1 in the membrane increased Gm in the presence of AA 4-fold (GmANT, AA/GmAA) (Figure 2a). At 190 mV GmANT, AA, GmAA and G0 were equal to 1750 ± 220 nS/cm2, 440 ± 135 nS/cm2 and 20.4 ± 3.4 nS/cm2, respectively (Supplementary Figure S4 and Supplementary Table S2). Notably, ANT1-mediated Gm depended on the structure of FAs. It increased with the elongation of FA chain length in order palmitic (PA, 16:0) → arachidic (ArA, 20:0) acid and was the highest by unsaturated AA (20:4) (Figure 2b).

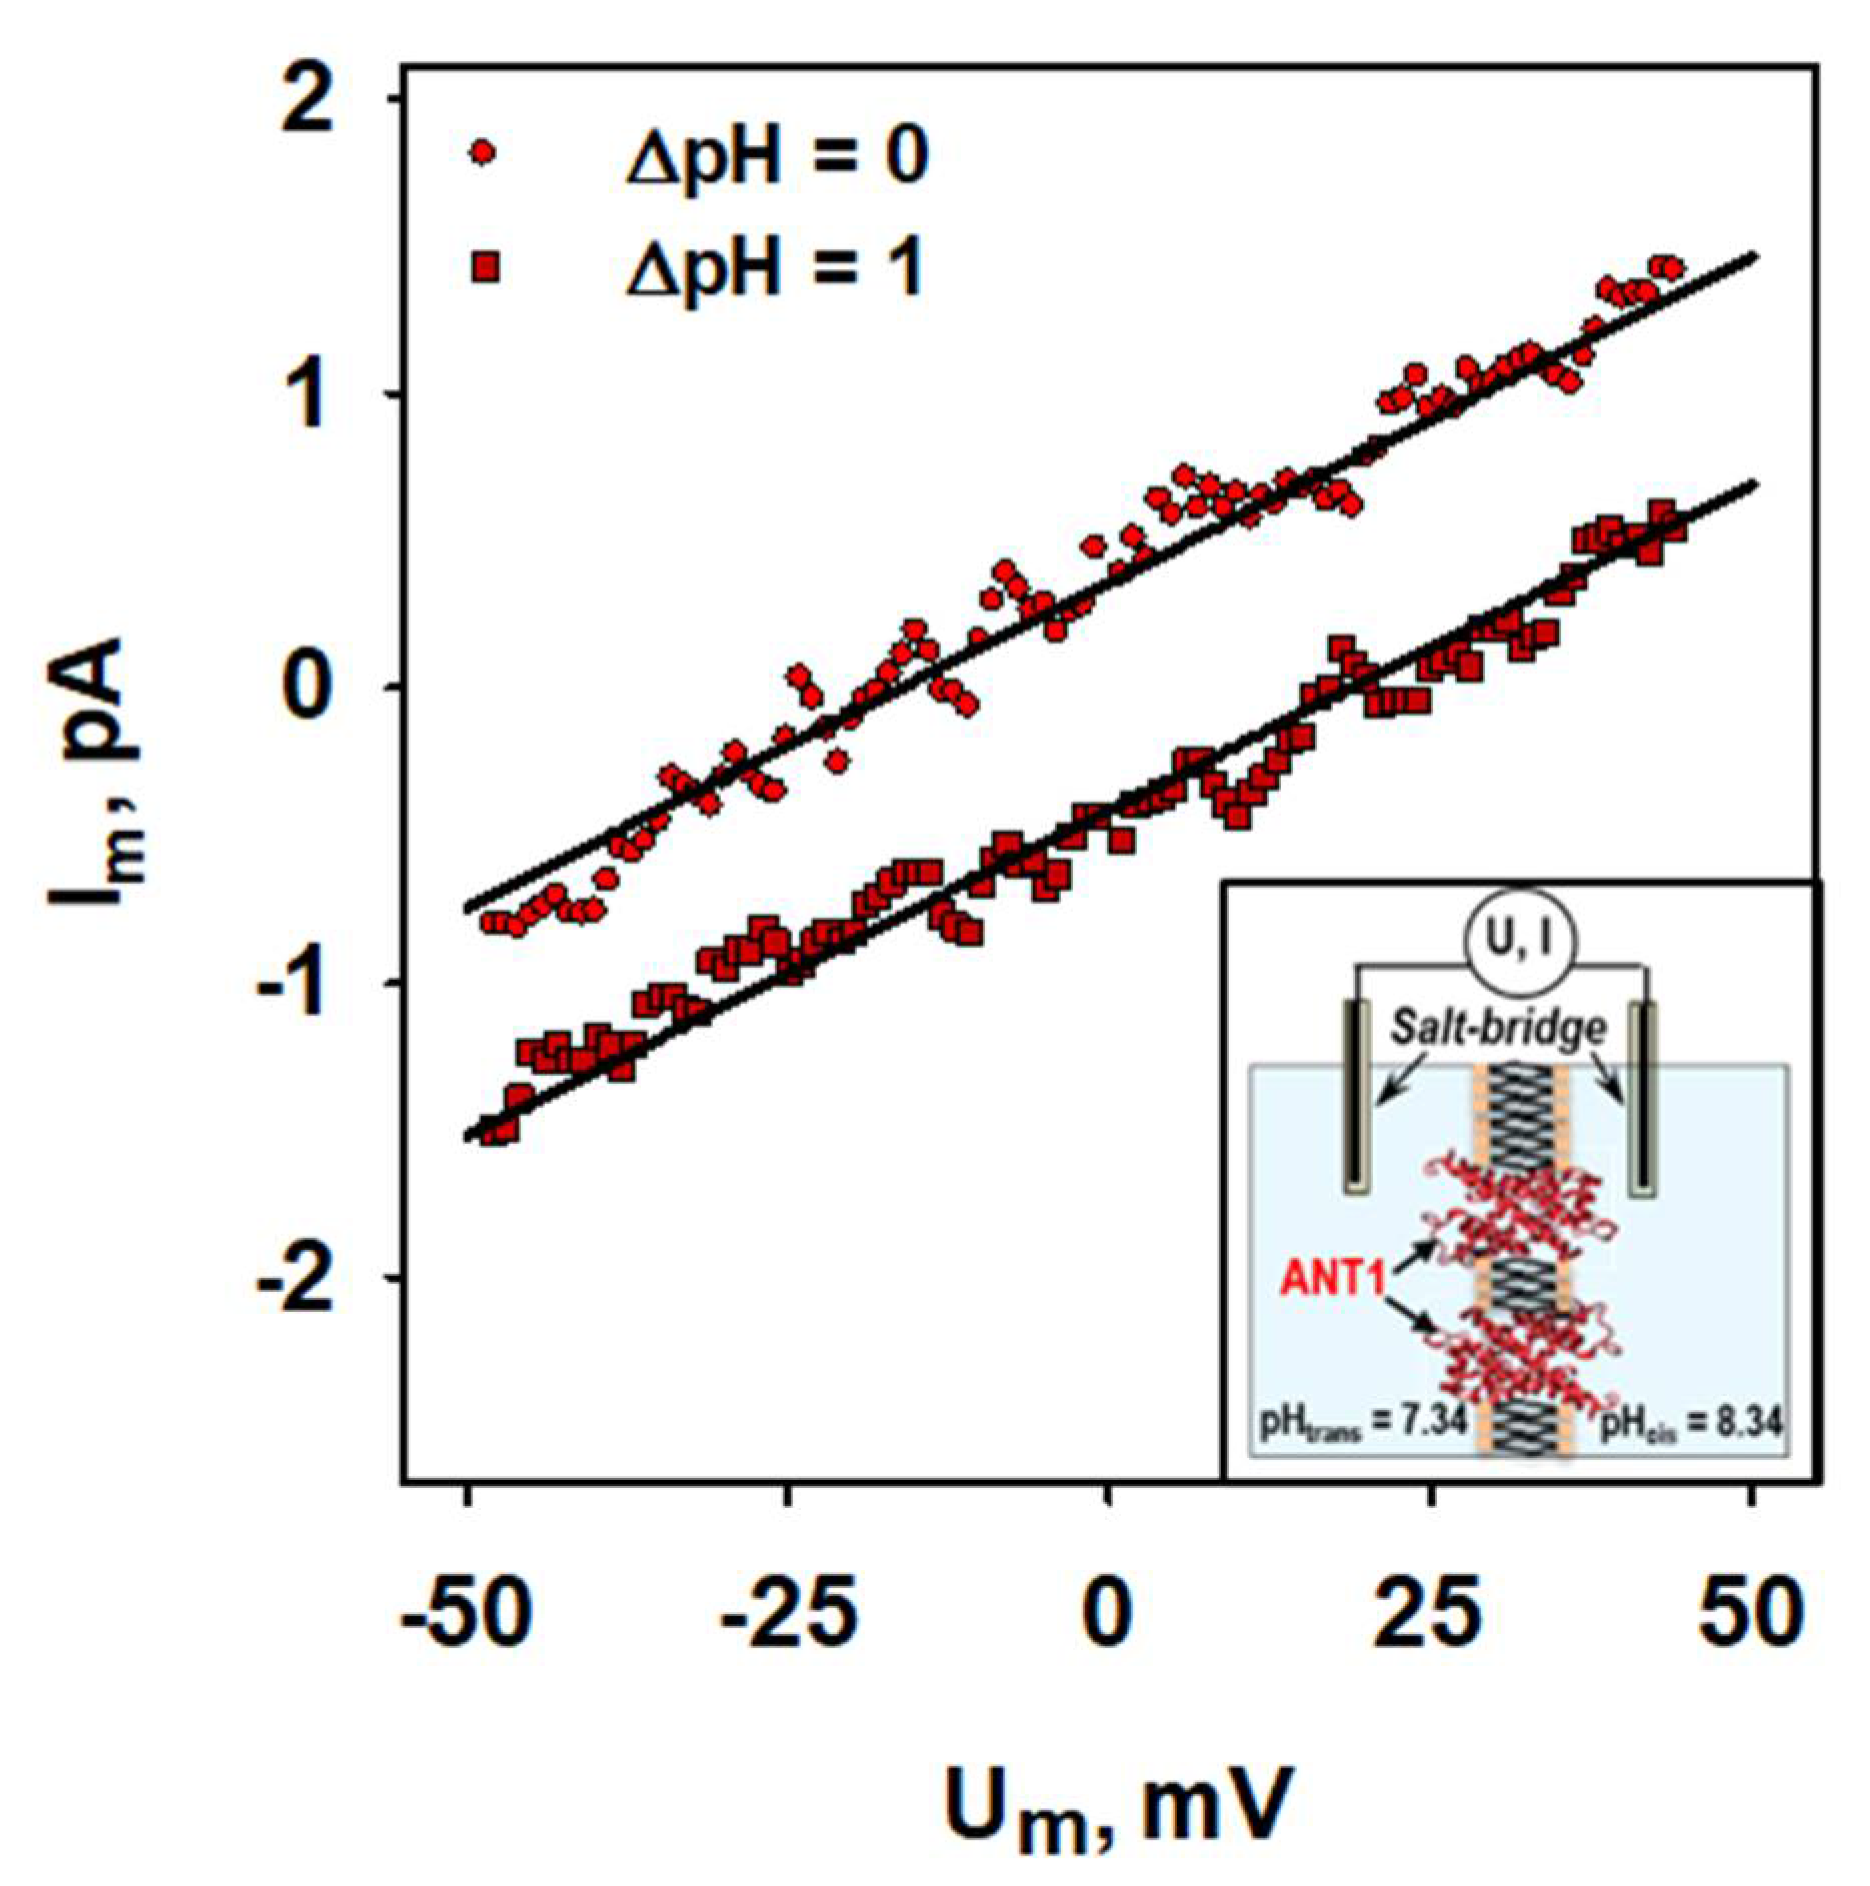
2.4. Proton Turnover Number of ANT1

To determine the H+ turnover number of ANT, we recorded current-voltage characteristics in the presence and absence of a transmembrane pH gradient (Figure 3, insert) [31].
To estimate a protein to lipid ratio, we measured the number of fluorescently-labeled ANT per liposome using fluorescence correlation spectroscopy (FCS) [32] (s. Methods and Supplementary Figure S5). By comparing the number of the fluorescent particles in proteoliposomes before (NANT, none = 1.60 ± 0.01) and after (NANT, SDS = 13.83 ± 0.04) the addition of 2 % (v/v) SDS, and assuming one ANT protein per detergent micelle after micellization, we calculated 8.67 ± 0.74 ANT molecules per liposome. The protein to lipid ratio estimated according to Equation (4) was 1:12,000.
From the potential shift and proton/lipid ratio, we then estimated that ANT has a turnover rate of 14.6 ± 2.5 H+/s (Figure 3), being similar to those of uncoupling proteins (Supplementary Table S3) [6,7,9,33,34,35].

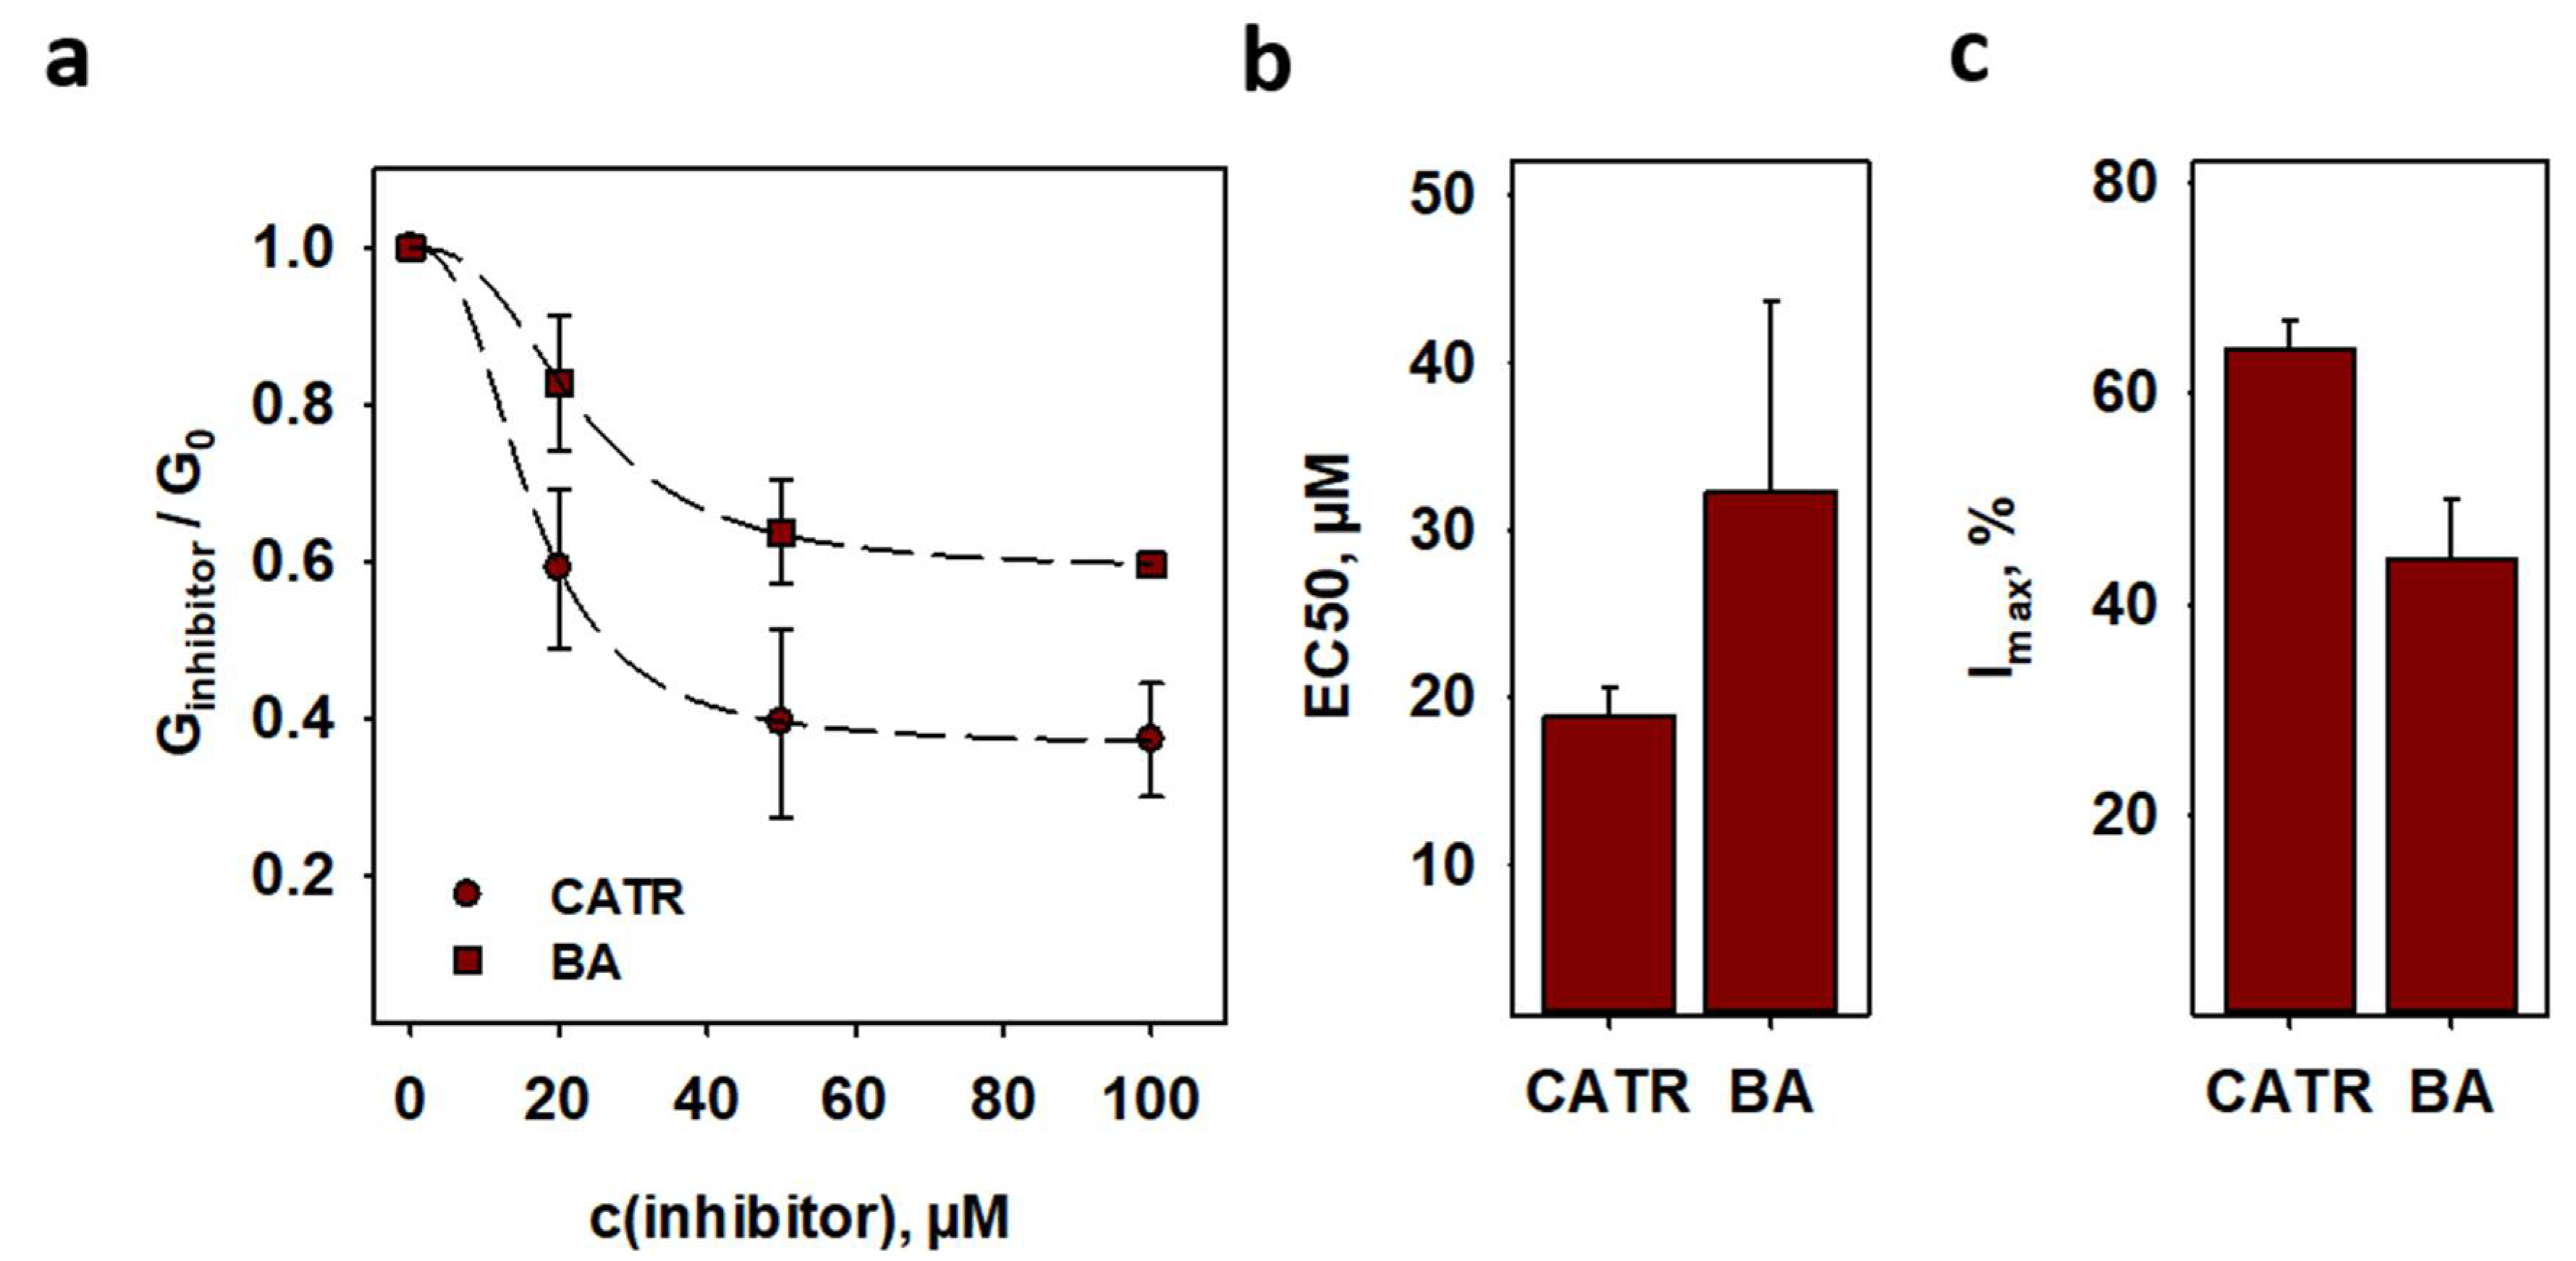
2.5. Inhibition of ANT1-Mediated Proton Transport

Specific inhibitors of nucleotide transport lock ANT either in its cytosolic-opened c-side (CATR) or in its matrix-opened m-side (BA) [15] and inhibit both ADP/ATP exchange and FA-mediated proton leak. The comparison of CATR and BA effect on Gm (Figure 4a) showed that inhibition by CATR was more effective than by BA. It is displayed by the EC50 values of 18.9 ± 1.8 µM for CATR and 32.3 ± 11.4 µM for BA, respectively (Figure 4b and Supplementary Table S4). Maximum inhibition values (Imax = 64.2 ± 2.8% and Imax = 44.3 ± 5.7% in the presence of CATR or BA) indicate that ANT conformation in the bilayer is approximately 60% in the c-state and 40% in the m-state in our system (Figure 4c and Supplementary Table S4).
To investigate the interdependence of proton transport, activated by FA, and ADP/ATP transport, we measured Gm of ANT1-containing lipid bilayers reconstituted with AA in the presence and absence of purine nucleotides (PN). Adenine nucleotides inhibited H+ transport much more effectively than guanosine nucleotides (Figure 5a). The EC50 values correlated well with the known narrow substrate specificity of ANT (Figure 5b and Supplementary Table S4) [36]. ATP and ADP fully inhibited Gm, whereas all other PN decreased Gm by 50% (Figure 5c and Supplementary Table S4).

2.6. Analysis of the ANT´s Surface Electrostatic Potential using Molecular Dynamic Simulations

The high similarity of the ANT activation pattern to those of UCP1, UCP2 and UCP3 [6,7,35] leads to the hypothesis that the H+ transport can be explained by the FA cycling mechanism. We analyzed the ANT’s surface electrostatic potential in the DOPC bilayers to test whether a possible FA translocation pathway may be localized at the lipid-protein interface. The calculation revealed a large positively charged patch (Figure 6a) that might facilitate FA anion’s sliding alongside the protein. The ATP binding significantly decreased the positive electrostatic potential (Figure 6b) due to its strong screening at the bottom of the cavity [37]. The existence of such a patch would explain the inhibition of H+ transport by ATP observed in electrophysiological experiments. GTP has less effect on the positive electrostatic potential (Figure 6c) because of its different orientation in the cavity (Figure 6d) and its “weaker interaction with the hydrophobic pocket that binds the adenine moiety” [36].

3. Discussion

We investigated the regulation of H+ transport using planar bilayer membranes reconstituted with the recombinant mouse ANT1. This model allowed us (i) to measure membrane conductance at precisely defined lipid and buffer composition, (ii) to apply mitochondria-relevant potentials directly, and (iii) to separate the ANT1-originated effects from the simultaneous effects of other proteins. The latter is a main disadvantage by the interpretation of experiments on (isolated) mitochondria or mitoplasts representing swollen mitochondria lacking an intact outer membrane.
We confirmed that ANT1 has a dual function performing H+ transport additionally to the substrate transport. Proton transport occurs only in the presence of the long-chain FAs and reveals high sensitivity to the FA chain length and saturation (Figure 7). The data on ANT1 activation showed remarkable similarity to the activation pattern of uncoupling proteins (UCP1-UCP3) [6,7,35]. The dependence of proton transport rate on the FA structure can be explained by the FA cycling model, assuming that the transport of FA anions, which is the rate-limiting step, occurs at the lipid-protein interface as proposed for UCP2 [6].
Although the FA hydrophobicity increases with both chain length and unsaturation, the FA anions occupy similar positions at the lipid-water interface [38]. FA anions should also not further penetrate the ANT1 structure unless a hydrophobic pocket would pull the FA into the ANT1 interior. However, such a membrane-spanning pocket is not found in the ANT structure [39].
Whereas the FA activation pattern of the proton transport seems to be similar in ANT and UCPs, the inhibition pattern is not (Figure 7). We explain it by the fact that these proteins transport different substrates. However, all ANT-specific substrates bind at the substrate-binding site in the ANT cavity [39]. As shown by molecular dynamics simulation, after the ATP binding, the electrostatic potential is diminished, and FAs are potentially less attracted to the ANT surface (Figure 6a,b). Since all substrates (ATP4−, ADP3−, CATR4− and BA3−) are similarly charged and bind to the same region, the electrostatic potential of ANT will be significantly altered upon their binding [36,39,40]. GTP has a different orientation when bound to ANT, which has less impact on ANT’s electrostatic potential (Figure 6c,d and Figure 7). The surface electric charge directly correlated with the inhibition potency of PN. This observation strongly supports the data on the binding site competition between PNs and FAs.
Our model is in strong contrast to the model, which proposed that FAs bind within the ANT cavity and act as a co-factor of H+ transport [21]. The authors based their model on the experiments showing that non-protonable sulfonated FA failed to induce any transmembrane current in isolated mitoplasts. The use of sulfonated FA is very controversial, as chemical and geometrical properties of the crucial head group are altered compared to the carboxylic head group of native FA. However, the absence of any transient current by non-protonable FA acids is well described by the FA cycling model, in which the net charge transport of H+ is impaired by the inability of the sulfonated FA to transport a proton across the membrane [41,42]. Upon FA addition to the mitoplast matrix, Bertholet et al. [21] observed no current in contrast to the FA addition to the cytosolic side, showing that the H+ transport is independent of ANT conformation. The authors claimed that FA reaches its putative binding site inside ANT only from the cytosolic side. However, it is questionable how FAs should activate H+ transport inside ANT, as protons have to cross at least one salt-bridge network [29], independent of ANT conformation. The FA binding to ANT and subsequently H+ binding to the FA in the protein cavity will most probably not provide the energy of roughly 10 kcal/mol to break the strong salt-bridge network [42,43,44,45,46].
The inhibition of H+ transport in the FA co-factor model can be clearly described as a competition between FA and purine nucleotides for the binding site that we also observed for UCP1 and UCP3 [7]. However, the FA binding site is not further characterized, and it is not clear if there is a common binding target for the FA anion and the adenine nucleotides and/or specific transport inhibitors. Nevertheless, the dependency on FA chain length and unsaturation would imply a loose binding of FAs inside the protein to account for the different structures, which contrasts the high energy required to break the salt-bridge network. Thus, the model proposed by Bertholet et al. [21] seems to fail in describing our experimental results.
We determined the ANT-specific H+ turnover number of 14.6 ± 2.5 H+/s, which is similar to turnover numbers determined earlier for UCPs. Besides ANT and UCPs, FA-activated H+ leak was also shown for other mitochondrial carriers, including the aspartate/glutamate carrier, dicarboxylate carrier, 2-oxoglutarate carrier, and the phosphate carrier [47,48,49,50]. Thus, it is reasonable to conclude a dual transport function for the before mentioned proteins: (i) the substrate transport to maintain mitochondrial respiration and (ii) the proton transport, which may affect the inner mitochondrial membrane potential. We speculate that these carriers have a similar mechanism of FA-mediated activation of H+ transport due to their high homology. Simultaneous activation of several proton transporters could ensure an essential drop in potential. The latter is crucial for regulating potential-dependent processes in mitochondria, such as reactive oxygen species production, cell death, autophagy, protein secretion, metabolic adaptations, and cell signaling [51]. The controlling of the mitochondrial uncoupling can be used to treat several human diseases, such as obesity, cardiovascular diseases, or neurological disorders.

4. Methods

4.1. Chemicals

Agarose (#3810), KCl (#6781), Na2SO4 (#8560), 2-(N-morpholino)ethanesulfonic acid (MES, #4256), sodium dodecyl sulfate (SDS, #0183), tris(hydroxymethyl)-aminomethane (Tris, #AE15), chloroform (#AE54) and ethylene glycol-bis(β-aminoethyl ether)-N,N,N′,N′-tetraacetic acid (EGTA, #3054) were purchased from Carl Roth GmbH & Co. KG (Karlsruhe, Germany). Hexane (#296090), hexadecane (#296317), palmitic acid (#P0500), stearic acid (#S4751), arachidic acid (#A3631), linoleic acid (#L1376) and arachidonic acid (#A3611), dimethyl sulfoxide (DMSO, #472301), the purine nucleotides adenine and guanine tri-, di-, and mono-phosphate (ATP, #A2383; ADP, #A2754; AMP, #01930; GTP #G8877; GDP, #G7127; and GMP, #G8377), carboxyatractyloside (CATR, #C4992) and bongkrekic acid (BA, #B6179) were purchased from Sigma-Aldrich (Vienna, Austria). 1,2-dioleoyl-sn-glycero-3-phosphocholine (DOPC, #850375P), 1,2-dioleoyl-sn-glycero-3-phosphoethanolamine (DOPE, #850725P) and cardiolipin (CL, #710335P) came from Avanti Polar Lipids Inc. (Alabaster, AL, USA).

4.2. Cloning, Purification and Reconstitution of Murine ANT1

Cloning, purification and reconstitution of murine ANT1 followed a previously established protocol [26]. The protein concentration in proteoliposomes was measured with the Micro BCATM Protein Assay Kit (Thermo Fisher Scientific, Prod. #23235, Waltham, MA, USA). Protein purity was verified by SDS-PAGE and silver staining (Supplementary Figure S1).

4.3. Exchange Rate Measurements of mANT1

ANT-mediated exchange of ADP/ATP was measured radioactively using 3H-ATP (Prod. #NET420250UC, Perkin Elmer, Waltham, MA, USA) following the protocol as described elsewhere [26] (Supplementary Figure S2).

4.4. Electrophysiological Measurements of mANT1

Planar lipid bilayers were formed from proteoliposomes as described previously [31,52]. FAs were added to the lipid phase before membrane formation. Proper membrane formation was verified by measuring membrane capacitance (C = 0.72 ± 0.05 µF/cm2), which is independent of the presence of protein, FA and inhibitor. Current-voltage (I-U) measurements were performed with a patch-clamp amplifier (EPC 10USB, Werner Instruments, Holliston, MA, USA). The specific total membrane conductance (Gm) at 0 mV was obtained as the slope of a linear fit of the experimental data at applied voltages from −50 mV to + 50 mV and normalized to the membrane area in cm2. Purine nucleotides (solved in distilled water, pH = 7.34) and ANT-specific inhibitors BA and CATR (solved in DMSO) were added to the buffer solution before forming bilayer membranes. The concentrations of each substrate are indicated in the figure legends. Membrane conductance expressed in relative units was calculated according to [7].
Measurement and calculation of H+ turnover rate of ANT followed the established protocol [31]. The addition of Tris increased the pH value of the buffer solution on the cis side of the membrane to a value of pH = 8.34.

4.5. Fluorescence Correlation Spectroscopy (FCS)

The average number of ANT1 per liposome was measured using FCS [32,53]. In brief, proteoliposomes obtained after reconstitution of the ANT1 were extruded using a Mini-Extruder system (Avanti Polar Lipids Inc., Alabaster, AL, USA) with a membrane nanopore filter with a pore diameter of 100 nm (Avestin Europe GmbH, Mannheim, Germany, LFM-100). ANT1 was labeled with ATTO 488-maleimide [54] (Sigma-Aldrich, Vienna, Austria; 28562-1MG-F). We used size exclusion chromatography (Sephadex® G-50 Superfine, Merck, Vienna, Austria; GE17-0041-01) to remove the unbound dye. The average residence time, τD, and ANT1- containing proteoliposomes number in the focal volume were derived from the autocorrelation function (G(τ)) of the temporal fluorescence signal (Supplementary Figure S5). To measure the signal, a commercial laser scanning microscope (LSM 510 META/ConfoCor 3, Carl Zeiss, Jena, Germany) equipped with avalanche diodes and a 40× water immersion objective was used. The standard model for two-component free 3D diffusion was applied [55]:
G(τ) = 1 + 1/(n (1+ τ/τD))
where the number of fluorescent particles, n, in the detection volume, Veff, was determined as n = Veff C, where C is the particle concentration. The diffusion coefficient (D) was determined as D = ω2/D, where ω = 0.16 µm is the diameter of the confocal volume cross-section as determined from the calibration experiments.
Dissolving the liposomes with 2% (v/v) SDS was expected to increase the particle number if liposomes contained more than one ANT1. The average number of ANT1 per liposome, <NANT1>, was obtained from the ratio of the particle number per confocal volume after and before the addition of SDS.
The protein per lipid ratio (ρ) was estimated by:
ρ = N ANT 1 N Lipids = < N ANT 1 > < N Lipids > | Liposomes
The average number of lipids per liposomes (<NLipids>) is calculated by the ratio of the surface area of the liposome with radius r and the average area per lipid (AL ≈ 0.6 nm2) of a membrane containing DOPC, DOPE and CL [56,57]:
< N Lipids > = 2 4 π r 2 A L
Thus, Equation (2) gives:
ρ = < N ANT 1 > 1 2 A L 4 π r 2

4.6. Molecular Dynamics Simulations

We performed all-atom molecular dynamics (MD) simulations of ANT1 protein in a 1,2-dioleoyl-sn-glycero-3-phosphocholine (DOPC) bilayer. Residues (residue 1 and residues 294–297) missing from the crystal structure of ANT1 (PDB code: 1okc) [40] without CATR were added using Modeller 9 [58] and implemented into the DOPC bilayer using CHARMM-GUI (http://www.charmm-gui.org/ (accessed on 7 January 2021)) [59,60,61]. Three system setups were prepared—the wild-type ANT1, the wild-type ANT1 with ATP4− bound in the cytosolic-open state (c-state) [43], as well as GTP4− bound in the same position. All simulation boxes contained ANT1 protein (with a total charge of +19), 73 DOPC molecules per leaflet (146 per system), ~ 11,500 water molecules, and the necessary number of Cl- anions to neutralize the net charge, depending on whether ATP4− or GTP4− are added to the system. All systems were first minimized and equilibrated in six steps using the CHARMM-GUI protocol [62] and then simulated for a further 100 ns without any restraints with a 2 fs time step in a periodic rectangular box of 7.9 nm × 7.9 nm × 9.4 nm using the isobaric-isothermal ensemble (NPT) and periodic boundary conditions in all directions at T = 310 K, maintained via Nosé–Hoover thermostat [63] independently for the DOPC, water/ions and protein subsystems with a coupling constant of 1.0 ps−1. The pressure was set to 1.013 bar and controlled with a semi-isotropic Parrinello-Rahman barostat [64] with a time constant for pressure coupling of 5 ps−1. Long-range electrostatics were calculated using the particle-mesh Ewald (PME) method [65] with real space Coulomb interactions cut off at 1.2 nm using a Fourier spacing of 0.12 nm and a Verlet cut-off scheme. All simulated systems were described by the CHARMM36m force field [66]. The electrostatic potential maps of all systems were calculated using VMD’s PMEPOT plugin [67]. All simulations were run with the GROMACS 5.1.4 software package [68] and visualized with the VMD molecular graphics program [69].

4.7. Statistics

Data analysis and fitting of electrophysiological measurements were performed using Sigma Plot 12.5 (Systat Software GmbH, Erkrath, Germany) and displayed as mean ± SD of at least three independent measurements.

Supplementary Materials

The following are available online at https://www.mdpi.com/1422-0067/22/5/2490/s1.

Author Contributions

Conceptualization, E.E.P., A.R., J.K. and M.V.; funding acquisition, E.E.P. and M.V.; investigation, J.K., D.G.K., K.Ž., S.Š., Z.B., S.B. and M.V.; project administration, E.E.P.; resources, E.E.P. and M.V.; supervision, E.E.P. and M.V.; writing—original draft, J.K., M.V. and E.E.P.; writing—review and editing, J.K., A.R., S.Š., Z.B., D.G.K., K.Ž., S.B., E.E.P. and M.V. All authors have read and agreed to the published version of the manuscript.

Funding

We acknowledge support from the Austrian Research Fund (FWF, P31559 to E.E.P.) and Croatian Science Foundation (Project No. IP-2019-04-3804 to M.V.). We thank the computer cluster Isabella based in SRCE—University of Zagreb, University Computing Centre for computational resources. M. V. thanks UOCHB Sabbatical visit program for support.

Institutional Review Board Statement

Not applicable.

Informed Consent Statement

Not applicable.

Data Availability Statement

The datasets generated and/or analyzed during this study are available from the corresponding authors on reasonable request.

Acknowledgments

We thank Y.N. Antonenko (Belozersky Institute of Physico-Chemical Biology, Lomonosov Moscow State University, Moscow, Russia) for the valuable comments on the manuscript.

Conflicts of Interest

The authors declare no conflict of interest.

References

  1. Brand, M.D. The proton leak across the mitochondrial inner membrane. Biochim. Biophys. Acta 1990, 1018, 128–133. [Google Scholar] [CrossRef]
  2. Rolfe, D.F.; Brand, M.D. Contribution of mitochondrial proton leak to skeletal muscle respiration and to standard metabolic rate. Am. J. Physiol. 1996, 271 Pt 1, C1380–C1389. [Google Scholar] [CrossRef]
  3. Rolfe, D.F.; Brand, M.D. The physiological significance of mitochondrial proton leak in animal cells and tissues. Biosci. Rep. 1997, 17, 9–16. [Google Scholar] [CrossRef] [PubMed]
  4. Krauss, S.; Zhang, C.Y.; Lowell, B.B. The mitochondrial uncoupling-protein homologues. Nat. Rev. Mol. Cell Biol. 2005, 6, 248–261. [Google Scholar] [CrossRef] [PubMed]
  5. Skulachev, V.P. Uncoupling: New approaches to an old problem of bioenergetics. Biochim. Biophys. Acta 1998, 1363, 100–124. [Google Scholar] [CrossRef] [Green Version]
  6. Beck, V.; Jaburek, M.; Demina, T.; Rupprecht, A.; Porter, R.K.; Jezek, P.; Pohl, E.E. Polyunsaturated fatty acids activate human uncoupling proteins 1 and 2 in planar lipid bilayers. FASEB J. 2007, 21, 1137–1144. [Google Scholar] [CrossRef] [Green Version]
  7. Macher, G.; Koehler, M.; Rupprecht, A.; Kreiter, J.; Hinterdorfer, P.; Pohl, E.E. Inhibition of mitochondrial UCP1 and UCP3 by purine nucleotides and phosphate. Biochim. Biophys. Acta Biomembr. 2018, 1860, 664–672. [Google Scholar] [CrossRef] [PubMed]
  8. Zackova, M.; Jezek, P. Reconstitution of novel mitochondrial uncoupling proteins UCP2 and UCP3. Biosci. Rep. 2002, 22, 33–46. [Google Scholar] [CrossRef]
  9. Hoang, T.; Smith, M.D.; Jelokhani-Niaraki, M. Toward understanding the mechanism of ion transport activity of neuronal uncoupling proteins UCP2, UCP4, and UCP5. Biochemistry 2012, 51, 4004–4014. [Google Scholar] [CrossRef]
  10. Pohl, E.E.; Rupprecht, A.; Macher, G.; Hilse, K.E. Important Trends in UCP3 Investigation. Front. Physiol. 2019, 10, 470. [Google Scholar] [CrossRef] [PubMed]
  11. Heldt, H.W.; Jacobs, H.; Klingenberg, M. Endogenous Adp of Mitochondria, an Early Phosphate Acceptor of Oxidative Phosphorylation as Disclosed by Kinetic Studies with C14 Labelled Adp and Atp and with Atractyloside. Biochem. Biophys. Res. Commun. 1965, 18, 174–179. [Google Scholar] [CrossRef]
  12. Pfaff, E.; Klingenberg, M.; Heldt, H.W. Unspecific permeation and specific exchange of adenine nucleotides in liver mitochondria. Biochim. Biophys. Acta 1965, 104, 312–315. [Google Scholar] [CrossRef]
  13. Vignais, P.V. The mitochondrial adenine nucleotide translocator. J. Bioenerg. 1976, 8, 9–17. [Google Scholar] [CrossRef] [PubMed]
  14. Kunji, E.R.; Aleksandrova, A.; King, M.S.; Majd, H.; Ashton, V.L.; Cerson, E.; Springett, R.; Kibalchenko, M.; Tavoulari, S.; Crichton, P.G.; et al. The transport mechanism of the mitochondrial ADP/ATP carrier. Biochim. Biophys. Acta 2016, 1863, 2379–2393. [Google Scholar] [CrossRef] [Green Version]
  15. Klingenberg, M. The ADP and ATP transport in mitochondria and its carrier. Biochim. Biophys. Acta 2008, 1778, 1978–2021. [Google Scholar] [CrossRef] [PubMed] [Green Version]
  16. Andreyev, A.Y.; Bondareva, T.O.; Dedukhova, V.I.; Mokhova, E.N.; Skulachev, V.P.; Volkov, N.I. Carboxyatractylate inhibits the uncoupling effect of free fatty acids. FEBS Lett. 1988, 226, 265–269. [Google Scholar] [CrossRef] [Green Version]
  17. Andreyev, A.Y.; Bondareva, T.O.; Dedukhova, V.I.; Mokhova, E.N.; Skulachev, V.P.; Tsofina, L.M.; Volkov, N.I.; Vygodina, T.V. The ATP/ADP-antiporter is involved in the uncoupling effect of fatty acids on mitochondria. Eur. J. Biochem. 1989, 182, 585–592. [Google Scholar] [CrossRef]
  18. Brustovetsky, N.; Klingenberg, M. The reconstituted ADP/ATP carrier can mediate H+ transport by free fatty acids, which is further stimulated by mersalyl. J. Biol. Chem. 1994, 269, 27329–27336. [Google Scholar] [CrossRef]
  19. Shabalina, I.G.; Kramarova, T.V.; Nedergaard, J.; Cannon, B. Carboxyatractyloside effects on brown-fat mitochondria imply that the adenine nucleotide translocator isoforms Ant1 and Ant2 may be responsible for basal and fatty acid-induced uncoupling, respectively. Biochem. J. 2006, 399, 405–414. [Google Scholar] [CrossRef] [Green Version]
  20. Brand, M.D.; Pakay, J.L.; Ocloo, A.; Kokoszka, J.; Wallace, D.C.; Brookes, P.S.; Cornwall, E.J. The basal proton conductance of mitochondria depends on adenine nucleotide translocase content. Biochem. J. 2005, 392 Pt 2, 353–362. [Google Scholar] [CrossRef] [Green Version]
  21. Bertholet, A.M.; Chouchani, E.T.; Kazak, L.; Angelin, A.; Fedorenko, A.; Long, J.Z.; Vidoni, S.; Garrity, R.; Cho, J.; Terada, N.; et al. H(+) transport is an integral function of the mitochondrial ADP/ATP carrier. Nature 2019, 571, 515–520. [Google Scholar] [CrossRef] [PubMed]
  22. Kamp, F.; Hamilton, J.A. pH gradients across phospholipid membranes caused by fast flip-flop of un-ionized fatty acids. Proc. Natl. Acad. Sci. USA 1992, 89, 11367–11370. [Google Scholar] [CrossRef] [PubMed] [Green Version]
  23. Pohl, E.E.; Peterson, U.; Sun, J.; Pohl, P. Changes of intrinsic membrane potentials induced by flip-flop of long-chain fatty acids. Biochemistry 2000, 39, 1834–1839. [Google Scholar] [CrossRef] [PubMed]
  24. Skulachev, V.P. Fatty acid circuit as a physiological mechanism of uncoupling of oxidative phosphorylation. FEBS Lett. 1991, 294, 158–162. [Google Scholar] [CrossRef] [Green Version]
  25. Fedorenko, A.; Lishko, P.V.; Kirichok, Y. Mechanism of fatty-acid-dependent UCP1 uncoupling in brown fat mitochondria. Cell 2012, 151, 400–413. [Google Scholar] [CrossRef] [PubMed] [Green Version]
  26. Kreiter, J.; Beitz, E.; Pohl, E.E. A Fluorescence-Based Method to Measure ADP/ATP Exchange of Recombinant Adenine Nucleotide Translocase in Liposomes. Biomolecules 2020, 10, 685. [Google Scholar] [CrossRef] [PubMed]
  27. Kramer, R.; Klingenberg, M. Electrophoretic control of reconstituted adenine nucleotide translocation. Biochemistry 1982, 21, 1082–1089. [Google Scholar] [CrossRef] [PubMed]
  28. Heidkamper, D.; Muller, V.; Nelson, D.R.; Klingenberg, M. Probing the role of positive residues in the ADP/ATP carrier from yeast. The effect of six arginine mutations on transport and the four ATP versus ADP exchange modes. Biochemistry 1996, 35, 16144–16152. [Google Scholar] [CrossRef] [PubMed]
  29. King, M.S.; Kerr, M.; Crichton, P.G.; Springett, R.; Kunji, E.R.S. Formation of a cytoplasmic salt bridge network in the matrix state is a fundamental step in the transport mechanism of the mitochondrial ADP/ATP carrier. Biochim. Biophys. Acta 2016, 1857, 14–22. [Google Scholar] [CrossRef] [PubMed] [Green Version]
  30. Rupprecht, A.; Sokolenko, E.A.; Beck, V.; Ninnemann, O.; Jaburek, M.; Trimbuch, T.; Klishin, S.S.; Jezek, P.; Skulachev, V.P.; Pohl, E.E. Role of the transmembrane potential in the membrane proton leak. Biophys. J 2010, 98, 1503–1511. [Google Scholar] [CrossRef] [PubMed] [Green Version]
  31. Kreiter, J.; Pohl, E.E. A Micro-agar Salt Bridge Electrode for Analyzing the Proton Turnover Rate of Recombinant Membrane Proteins. J. Vis. Exp. 2019, 143, e58552. [Google Scholar] [CrossRef]
  32. Erokhova, L.; Horner, A.; Kugler, P.; Pohl, P. Monitoring single-channel water permeability in polarized cells. J. Biol. Chem. 2011, 286, 39926–39932. [Google Scholar] [CrossRef] [Green Version]
  33. Nicholls, D.G. The effective proton conductance of the inner membrane of mitochondria from brown adipose tissue. Dependency on proton electrochemical potential gradient. Eur. J. Biochem. 1977, 77, 349–356. [Google Scholar] [CrossRef] [PubMed]
  34. Klingenberg, M.; Winkler, E. The reconstituted isolated uncoupling protein is a membrane potential driven H+ translocator. EMBO J. 1985, 4, 3087–3092. [Google Scholar] [CrossRef]
  35. Urbankova, E.; Voltchenko, A.; Pohl, P.; Jezek, P.; Pohl, E.E. Transport kinetics of uncoupling proteins. Analysis of UCP1 reconstituted in planar lipid bilayers. J. Biol. Chem. 2003, 278, 32497–32500. [Google Scholar] [CrossRef] [PubMed] [Green Version]
  36. Mifsud, J.; Ravaud, S.; Krammer, E.M.; Chipot, C.; Kunji, E.R.; Pebay-Peyroula, E.; Dehez, F. The substrate specificity of the human ADP/ATP carrier AAC1. Mol. Membr. Biol. 2013, 30, 160–168. [Google Scholar] [CrossRef] [PubMed]
  37. Krammer, E.M.; Ravaud, S.; Dehez, F.; Frelet-Barrand, A.; Pebay-Peyroula, E.; Chipot, C. High-chloride concentrations abolish the binding of adenine nucleotides in the mitochondrial ADP/ATP carrier family. Biophys. J. 2009, 97, L25–L27. [Google Scholar] [CrossRef] [Green Version]
  38. Pashkovskaya, A.A.; Vazdar, M.; Zimmermann, L.; Jovanovic, O.; Pohl, P.; Pohl, E.E. Mechanism of Long-Chain Free Fatty Acid Protonation at the Membrane-Water Interface. Biophys. J. 2018, 114, 2142–2151. [Google Scholar] [CrossRef] [PubMed] [Green Version]
  39. Ruprecht, J.J.; Kunji, E.R. Structural changes in the transport cycle of the mitochondrial ADP/ATP carrier. Curr. Opin. Struct. Biol. 2019, 57, 135–144. [Google Scholar] [CrossRef] [PubMed]
  40. Pebay-Peyroula, E.; Dahout-Gonzalez, C.; Kahn, R.; Trezeguet, V.; Lauquin, G.J.; Brandolin, G. Structure of mitochondrial ADP/ATP carrier in complex with carboxyatractyloside. Nature 2003, 426, 39–44. [Google Scholar] [CrossRef] [PubMed]
  41. Jaburek, M.; Varecha, M.; Jezek, P.; Garlid, K.D. Alkylsulfonates as probes of uncoupling protein transport mechanism. Ion pair transport demonstrates that direct H(+) translocation by UCP1 is not necessary for uncoupling. J. Biol. Chem. 2001, 276, 31897–31905. [Google Scholar]
  42. Jezek, P.; Holendova, B.; Garlid, K.D.; Jaburek, M. Mitochondrial Uncoupling Proteins: Subtle Regulators of Cellular Redox Signaling. Antioxid. Redox Signal. 2018, 29, 667–714. [Google Scholar] [PubMed] [Green Version]
  43. Wang, Y.; Tajkhorshid, E. Electrostatic funneling of substrate in mitochondrial inner membrane carriers. Proc. Natl. Acad. Sci. USA 2008, 105, 9598–9603. [Google Scholar] [CrossRef] [PubMed] [Green Version]
  44. Dehez, F.; Pebay-Peyroula, E.; Chipot, C. Binding of ADP in the mitochondrial ADP/ATP carrier is driven by an electrostatic funnel. J. Am. Chem. Soc. 2008, 130, 12725–12733. [Google Scholar] [CrossRef]
  45. Pietropaolo, A.; Pierri, C.L.; Palmieri, F.; Klingenberg, M. The switching mechanism of the mitochondrial ADP/ATP carrier explored by free-energy landscapes. Biochim. Biophys. Acta 2016, 1857, 772–781. [Google Scholar] [CrossRef]
  46. Škulj, S.; Brkljača, Z.; Vazdar, M. Molecular Dynamics Simulations of the Elusive Matrix-Open State of Mitochondrial ADP/ATP Carrier. Isr. J. Chem. 2020, 60, 735–743. [Google Scholar] [CrossRef]
  47. Samartsev, V.N.; Smirnov, A.V.; Zeldi, I.P.; Markova, O.V.; Mokhova, E.N.; Skulachev, V.P. Involvement of aspartate/glutamate antiporter in fatty acid-induced uncoupling of liver mitochondria. Biochim. Biophys. Acta 1997, 1319, 251–257. [Google Scholar] [CrossRef] [Green Version]
  48. Wieckowski, M.R.; Wojtczak, L. Involvement of the dicarboxylate carrier in the protonophoric action of long-chain fatty acids in mitochondria. Biochem. Biophys. Res. Commun. 1997, 232, 414–417. [Google Scholar] [PubMed]
  49. Engstova, H.; Zackova, M.; Ruzicka, M.; Meinhardt, A.; Hanus, J.; Kramer, R.; Jezek, P. Natural and azido fatty acids inhibit phosphate transport and activate fatty acid anion uniport mediated by the mitochondrial phosphate carrier. J. Biol. Chem. 2001, 276, 4683–4691. [Google Scholar] [CrossRef] [Green Version]
  50. Yu, X.X.; Lewin, D.A.; Zhong, A.; Brush, J.; Schow, P.W.; Sherwood, S.W.; Pan, G.; Adams, S.H. Overexpression of the human 2-oxoglutarate carrier lowers mitochondrial membrane potential in HEK-293 cells: Contrast with the unique cold-induced mitochondrial carrier CGI-69. Biochem. J. 2001, 353 Pt 2, 369–375. [Google Scholar] [CrossRef] [Green Version]
  51. Demine, S.; Renard, P.; Arnould, T. Mitochondrial Uncoupling: A Key Controller of Biological Processes in Physiology and Diseases. Cells 2019, 8, 795. [Google Scholar] [CrossRef] [Green Version]
  52. Beck, V.; Jaburek, M.; Breen, E.P.; Porter, R.K.; Jezek, P.; Pohl, E.E. A new automated technique for the reconstitution of hydrophobic proteins into planar bilayer membranes. Studies of human recombinant uncoupling protein 1. Biochim. Biophys. Acta 2006, 1757, 474–479. [Google Scholar] [CrossRef] [PubMed] [Green Version]
  53. Knyazev, D.G.; Lents, A.; Krause, E.; Ollinger, N.; Siligan, C.; Papinski, D.; Winter, L.; Horner, A.; Pohl, P. The bacterial translocon SecYEG opens upon ribosome binding. J. Biol. Chem. 2013, 288, 17941–17946. [Google Scholar] [CrossRef] [PubMed] [Green Version]
  54. Majima, H.J.; Oberley, T.D.; Furukawa, K.; Mattson, M.P.; Yen, H.C.; Szweda, L.I.; St Clair, D.K. Prevention of mitochondrial injury by manganese superoxide dismutase reveals a primary mechanism for alkaline-induced cell death. J. Biol. Chem. 1998, 273, 8217–8224. [Google Scholar] [CrossRef] [PubMed] [Green Version]
  55. Magde, D.; Elson, E.L.; Webb, W.W. Fluorescence correlation spectroscopy. II. An experimental realization. Biopolymers 1974, 13, 29–61. [Google Scholar] [CrossRef]
  56. Boscia, A.L.; Treece, B.W.; Mohammadyani, D.; Klein-Seetharaman, J.; Braun, A.R.; Wassenaar, T.A.; Klosgen, B.; Tristram-Nagle, S. X-ray structure, thermodynamics, elastic properties and MD simulations of cardiolipin/dimyristoylphosphatidylcholine mixed membranes. Chem. Phys. Lipids 2014, 178, 1–10. [Google Scholar] [CrossRef] [PubMed] [Green Version]
  57. De Vries, A.H.; Mark, A.E.; Marrink, S.J. The Binary Mixing Behavior of Phospholipids in a Bilayer: A Molecular Dynamics Study. J. Phys. Chem. B 2004, 108, 2454–2463. [Google Scholar] [CrossRef]
  58. Webb, B.; Sali, A. Comparative Protein Structure Modeling Using MODELLER. Curr. Protoc. Bioinform. 2014, 47, 5.6.1–5.6.37. [Google Scholar] [CrossRef] [Green Version]
  59. Jo, S.; Lim, J.B.; Klauda, J.B.; Im, W. CHARMM-GUI Membrane Builder for mixed bilayers and its application to yeast membranes. Biophys. J. 2009, 97, 50–58. [Google Scholar] [CrossRef] [Green Version]
  60. Wu, E.L.; Cheng, X.; Jo, S.; Rui, H.; Song, K.C.; Davila-Contreras, E.M.; Qi, Y.; Lee, J.; Monje-Galvan, V.; Venable, R.M.; et al. CHARMM-GUI Membrane Builder toward realistic biological membrane simulations. J. Comput. Chem. 2014, 35, 1997–2004. [Google Scholar] [CrossRef] [PubMed] [Green Version]
  61. Lee, J.; Cheng, X.; Swails, J.M.; Yeom, M.S.; Eastman, P.K.; Lemkul, J.A.; Wei, S.; Buckner, J.; Jeong, J.C.; Qi, Y.; et al. CHARMM-GUI Input Generator for NAMD, GROMACS, AMBER, OpenMM, and CHARMM/OpenMM Simulations Using the CHARMM36 Additive Force Field. J. Chem. Theory Comput. 2016, 12, 405–413. [Google Scholar] [CrossRef] [PubMed]
  62. Jo, S.; Kim, T.; Im, W. Automated Builder and Database of Protein/Membrane Complexes for Molecular Dynamics Simulations. PLoS ONE 2007, 2, e880. [Google Scholar] [CrossRef] [Green Version]
  63. Nosé, S. A molecular dynamics method for simulations in the canonical ensemble. Mol. Phys. 1984, 52, 255–268. [Google Scholar] [CrossRef]
  64. Parrinello, M.; Rahman, A. Polymorphic transitions in single crystals: A new molecular dynamics method. J. Appl. Phys. 1981, 52, 7182–7190. [Google Scholar] [CrossRef]
  65. Essmann, U.; Perera, L.; Berkowitz, M.L.; Darden, T.; Lee, H.; Pedersen, L.G. A smooth particle mesh Ewald method. J. Chem. Phys. 1995, 103, 8577–8593. [Google Scholar] [CrossRef] [Green Version]
  66. Huang, J.; Rauscher, S.; Nawrocki, G.; Ran, T.; Feig, M.; de Groot, B.L.; Grubmuller, H.; MacKerell, A.D., Jr. CHARMM36m: An improved force field for folded and intrinsically disordered proteins. Nat. Methods 2017, 14, 71–73. [Google Scholar] [CrossRef] [Green Version]
  67. Aksimentiev, A.; Schulten, K. Imaging alpha-hemolysin with molecular dynamics: Ionic conductance, osmotic permeability, and the electrostatic potential map. Biophys. J. 2005, 88, 3745–3761. [Google Scholar] [CrossRef] [Green Version]
  68. Abraham, M.J.; Murtola, T.; Schulz, R.; Páll, S.; Smith, J.C.; Hess, B.; Lindahl, E. GROMACS: High performance molecular simulations through multi-level parallelism from laptops to supercomputers. SoftwareX 2015, 1–2, 19–25. [Google Scholar] [CrossRef] [Green Version]
  69. Humphrey, W.; Dalke, A.; Schulten, K. VMD: Visual molecular dynamics. J. Mol. Graph. 1996, 14, 33–38. [Google Scholar] [CrossRef]
Figure 1. ANT1 does not contribute to the basal proton leak. Total membrane conductance (Gm) was measured at different membrane potentials (ΔΦ) and membrane compositions (s. legend). Planar bilayer membranes were made of 45:45:10 mol % PC:PE:CL. Lipid concentration was 1.5 mg/(mL of buffer solution). Protein concentration measured by BCA assay was 4 µg/(mg of lipid). Buffer contained 50 mM Na2SO4, 10 mM Tris, 10 mM MES and 0.6 mM EGTA at pH = 7.34 and T = 306 K. ADP, ATP and CATR were added at concentrations 2 mM, 2 mM and 100 µM. Lines represent the least square regression fit of an exponential function to the data. Data are the mean ± SD of at least three independent experiments.
Ijms 22 02490 g001
Figure 2. Fatty acids are required to activate ANT1-mediated proton transport. (a) Total membrane conductance (Gm) of lipid bilayers in the presence of AA (gray squares), ANT1 (red triangles), ANT1 and AA (dark red diamonds) and in the absence of AA and ANT1 (white circles) at different membrane potentials (ΔΦm). Lines represent the least square regression fit of an exponential function to the data. (b) Dependence of total membrane conductance (Gm) on fatty acid chain length and unsaturation in the presence (red) and absence (gray) of ANT1. PA, SA, ArA, LA, and AA indicate palmitic, stearic, arachidic, linoleic, and arachidonic acids. In all measurements, planar bilayer membranes were made of 45:45:10 mol % PC:PE:CL reconstituted with 15 mol % FA, except indicated otherwise. Lipid concentration was 1.5 mg/(mL of buffer solution). Protein concentration measured by BCA assay was 4 µg/(mg of lipid). The buffer solution contained 50 mM Na2SO4, 10 mM Tris, 10 mM MES and 0.6 mM EGTA at pH = 7.34 and T = 306 K. Data are the mean ± SD of at least three independent experiments.
Ijms 22 02490 g002
Figure 3. The proton turnover number of ANT is similar to UCPs. Representative current-voltage recordings of lipid bilayer membranes reconstituted with ANT1 in the presence (squares) and absence (circles) of ΔpH = 1.0 across the membrane. Lines represent a linear fit to the data. Planar bilayer membranes were made of 45:45:10 mol % PC:PE:CL reconstituted with 15 mol % AA. Buffer contained 50 mM Na2SO4, 10 mM Tris, 10 mM MES and 0.6 mM EGTA at pH = 7.34 and T = 306 K. Lipid concentration was 1.5 mg/(mL of buffer solution). Protein concentration measured by BCA assay was 4 µg/(mg of lipid). Insert: Experimental setup of the measurements to establish a transmembrane pH gradient.
Ijms 22 02490 g003
Figure 4. The ADP/ATP exchange inhibitors inhibit ANT-mediated proton leak. (a) Dose-dependent inhibition of ANT-mediated proton leak by the inhibitors CATR (circles) and bongkrekic acid (BA, triangles) on proton leak (dark red). Lines are a least square regression fit of a sigmoidal function to the data. (b) EC50 and (c) maximum inhibition Imax as fit parameters of (a). Planar bilayer membranes were made of 45:45:10 mol % PC:PE:CL reconstituted with 15 mol % AA. Buffer contained 50 mM Na2SO4, 10 mM Tris, 10 mM MES and 0.6 mM EGTA at pH = 7.34 and T = 306 K. Lipid concentration was 1.5 mg/(mL of buffer solution). Protein concentration measured by BCA assay was 4 µg/(mg of lipid). Data are the mean ± SD of at least three independent experiments.
Ijms 22 02490 g004
Figure 5. FA activated proton leak is preferably inhibited by ADP and ATP and maintains the substrate specificity of ANT. (a) Membrane conductance of lipid bilayers reconstituted with AA and ANT1 in the presence of different purine nucleotides. Lines are a least square regression fit of a sigmoidal function to the data. (b) EC50 and (c) maximum inhibition values as fit function parameters in (a). Values for GMP were dropped due to the low effect. For experimental conditions, see Figure 4. Data are the mean ± SD of at least three independent experiments.
Ijms 22 02490 g005
Figure 6. The purine nucleotides ATP and GTP differently modulate the electrostatic surface potential of ANT upon binding. (ac) Electrostatic potential (Δ of ANT1 in the absence (a) and presence of bound ATP (b) and GTP (c) calculated by molecular dynamics simulations. The isosurface of the potential of 0.9 V is shown with the wireframe. (d) Different average binding location of ATP (blue wireframe) and GTP (red wireframe) in ANT1.
Ijms 22 02490 g006
Figure 7. ANT1 transport features point to the fatty acid cycling mechanism. The proton transport rate of ANT1 (Table S3) in the presence of fatty acids (FA) is similar to that proposed for UCPs and depends on the FA structure (Circle 1, blue). ANT1 facilitates the FA anion’s transport at the protein-lipid interface, which is supported by the membrane conductance dependence on the FA structure (Circle 2, green). The FA anions slide alongside the electrostatic surface potential of ANT1; its modulation by binding ADP/ATP specific substrates inhibits the FA anion transport (Circle 3, red). The inhibition of ANT1-mediated proton leak is the strongest for the ANT1 substrates—ADP and ATP. It is in contrast to UCPs, in which the triphosphate nucleotides ATP and GTP are the most potent inhibitors (Circle 4, yellow).
Ijms 22 02490 g007
Publisher’s Note: MDPI stays neutral with regard to jurisdictional claims in published maps and institutional affiliations.

