Article

Development of a Genome-Scale Metabolic Model and Phenome Analysis of the Probiotic Escherichia coli Strain Nissle 1917

Department of Bioscience and Biotechnology, Konkuk University, Seoul 05029, Korea
*
Author to whom correspondence should be addressed.
These authors contributed equally to this work.
Int. J. Mol. Sci. 2021, 22(4), 2122; https://doi.org/10.3390/ijms22042122
Submission received: 7 December 2020 / Revised: 16 February 2021 / Accepted: 18 February 2021 / Published: 20 February 2021
(This article belongs to the Special Issue Microbial Systems and Synthetic Biology)

Abstract

:
Escherichia coli Nissle 1917 (EcN) is an intestinal probiotic that is effective for the treatment of intestinal disorders, such as inflammatory bowel disease and ulcerative colitis. EcN is a representative Gram-negative probiotic in biomedical research and is an intensively studied probiotic. However, to date, its genome-wide metabolic network model has not been developed. Here, we developed a comprehensive and highly curated EcN metabolic model, referred to as iDK1463, based on genome comparison and phenome analysis. The model was improved and validated by comparing the simulation results with experimental results from phenotype microarray tests. iDK1463 comprises 1463 genes, 1313 unique metabolites, and 2984 metabolic reactions. Phenome data of EcN were compared with those of Escherichia coli intestinal commensal K-12 MG1655. iDK1463 was simulated to identify the genetic determinants responsible for the observed phenotypic differences between EcN and K-12. Further, the model was simulated for gene essentiality analysis and utilization of nutrient sources under anaerobic growth conditions. These analyses provided insights into the metabolic mechanisms by which EcN colonizes and persists in the gut. iDK1463 will contribute to the system-level understanding of the functional capacity of gut microbes and their interactions with microbiota and human hosts, as well as the development of live microbial therapeutics.

1. Introduction

The nonpathogenic Escherichia coli strain Nissle 1917 (EcN) is among the most studied probiotic bacteria [1,2]. Over 100 years, EcN has been actively used as a pharmaceutical product (trade name: Mutaflor) for the treatment of intestinal disorders, such as inflammatory bowel disease, ulcerative colitis, and diarrhea [2]. EcN is a successful colonizer of the human gut, possessing strong antagonistic activity against entero-pathogens and immunomodulatory properties. The persistent colonization of EcN confers an advantage over Gram-positive probiotic strains, such as lactic acid bacteria, which transiently colonize the gut mucosa [1].
EcN has been genetically engineered to diagnose, prevent, and treat diseases owing to its facile genetics and biosafety profile [3]. Recombinant EcN was constructed to secrete human epidermal growth factors to heal wounds in human intestinal epithelial cells [4]. It was engineered to sense and kill Pseudomonas aeruginosa in Caenorhabditis elegans and mouse infection models [5]. EcN can selectively colonize and replicate in solid tumors, and its tumor-targeting ability has been exploited to bind to cancer cells and produce cytotoxic compounds in tumor-bearing mice [6,7,8]. EcN was developed as a live microbial therapeutic to treat metabolic disorders, such as phenylketonuria [9] and hyperammonemia [10]. With advances in synthetic and systems biology, EcN is expected to be engineered to develop safer, cheaper, and more effective therapeutics for a wide range of diseases [3].
A genome-scale metabolic network model is a computational framework that allows the prediction of metabolic flux values for a whole set of metabolic reactions using optimization techniques, such as flux balance analysis (FBA) [11,12]. Metabolic models of diverse organisms are used for various purposes, including the prediction of possible functions and phenotypes, understanding genotype–phenotype relationships, and development of metabolically engineered microbes [6]. Moreover, metabolic models of gut microbes can provide insights into the interactions of microbes with each other as well as their host [13]. Strain-specific metabolic models have been reconstructed for nonpathogenic and pathogenic E. coli strains [14]. In particular, highly curated and fine-tuned metabolic network models have been developed for the laboratory strains of K-12 MG1655 [15] and BL21(DE3) [16]. Although genome-scale metabolic models were reconstructed for 773 strains of the human gut microbiota [17], the probiotic EcN model has not been developed. Considering the clinical and pharmaceutical importance of EcN, an accurate and comprehensive metabolic model needs to be developed for the systems and synthetic biology of EcN.
In this study, we reconstructed a comprehensive and highly curated metabolic network model of EcN based on comparative genome and phenome analyses. A phenotype microarray (PM) test was performed to validate and update the metabolic model, and the reconstruction was extensively manually curated. Combined with results from the phenome analysis, metabolic simulation using the model identified genetic determinants of EcN-specific phenotypes. Further, genetic and metabolic factors responsible for intestinal colonization of EcN were identified.

2. Results

2.1. Reconstruction of the Draft Metabolic Model

The EcN genome (RefSeq accession number NZ_CP007799) [18] is poorly annotated; therefore, a draft EcN metabolic model was reconstructed based on homology and the three previously reconstructed E. coli metabolic models that are the most highly curated K-12 MG1655 (model id: iML1515) [15] and two of EcN’s closest related E. coli strains, uropathogenic CFT073 (ic_1306) [14] and asymptomatic ABU83972 (iECABU_c1320) [14]. Genome annotation [19] and iML1515 [15] of E. coli K-12 intestinal commensal strain MG1655 were used as the gold standard for the reconstruction of the EcN metabolic model.
The reconstruction was initiated from the homology searches of the genomes of K-12 MG1655 (NC_000913) [19], CFT073 (NC_004431) [20], and ABU83972 (NC_017631) [21] against the EcN genome (NZ_CP007799) [18]. In total, 1340 metabolic genes were shared by the EcN and K-12 genomes, and 2252 metabolic reactions associated with them were identified in the K-12 metabolic model. A total of 147 metabolic genes and 204 metabolic reactions were shared by EcN and CFT073 but not K-12. There were no metabolic reactions that were shared only in EcN and ABU83972 but not K-12 and CFT073. We added 397 exchange reactions for external metabolites that were not associated with genes.
There were many missing reactions owing to incorrect, missing, or low-quality reactions listed in CFT073 and ABU83972 reconstructions, which were generated through the automatic pipeline [14]. Thus, the MetaCyc database [22] was further explored to identify 13 metabolic reactions that were not included in the metabolic models of K-12, CFT073, and ABU83972 (Supplementary Table S1). Among them, two metabolic reactions existed only in the EcN genome along with their associated genes and metabolites. Three metabolic reactions (DXPRIi, PANTS, and TDSK) were added to the model during manual gap filling. The draft model was further revised based on the PM results (see below).

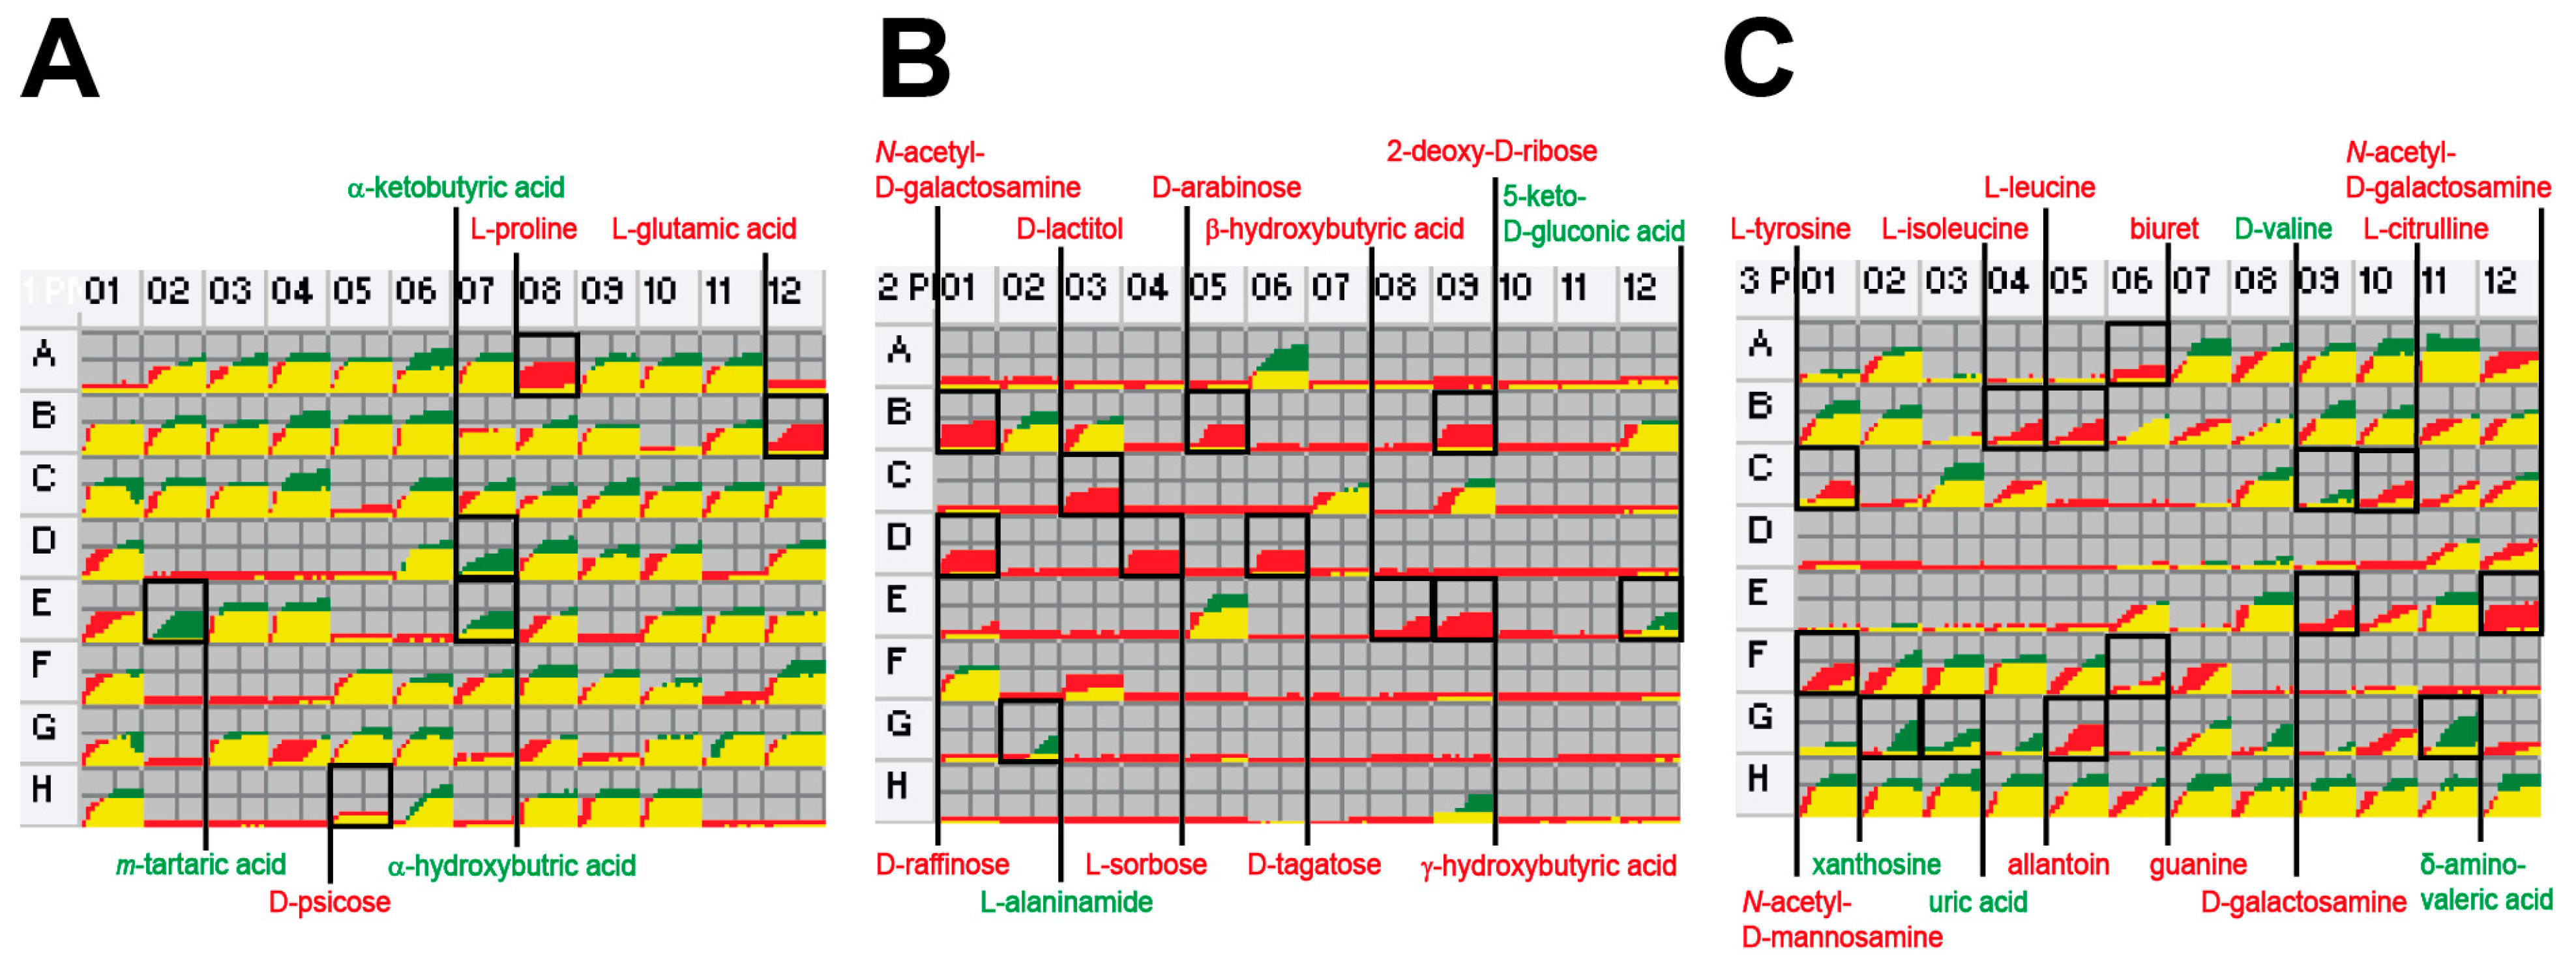
2.2. Phenome Analysis

We used PM to identify a wide range of digestible and inhibitory substrates through growth behavior [23]. To identify strain-specific characteristics, PM data of EcN were compared to that of K-12, which was previously published by our group [24] (Figure 1, Supplementary Figure S1, and Supplementary Table S2). Among the 190 different carbon sources (PM1 and PM2) and 95 nitrogen sources (PM3), EcN grew aerobically on 87 carbon and 57 nitrogen sources, and K-12 grew on 80 carbon and 53 nitrogen sources. Compared to K-12, only EcN grew on 12 carbon sources (N-acetyl-d-galactosamine, D-arabinose, 2-deoxy-d-ribose, L-glutamic acid, β-hydroxy-butyric acid, γ-hydroxy-butyric acid, D-lactitol, L-proline, D-psicose, D-raffinose, L-sorbose, and D-tagatose) and nine nitrogen sources (N-acetyl-d-galactosamine, allantoin, biuret, L-citrulline, D-galactosamine, guanine, L-isoleucine, L-leucine, and L-tyrosine), whereas it did not grow on five carbon sources (L-alaninamide, α-hydroxy-butyric acid, α-keto-butyric acid, 5-keto-d-gluconic acid, and m-tartaric acid) and five nitrogen sources (δ-amino-N-valeric acid, alloxan, uric acid, D-valine, and xanthosine) (Figure 2).
EcN and K-12 grew similarly on phosphorus and sulfur sources (PM4), with the exception of K-12 growth on three phosphorus sources (guanosine-3′,5′-cyclic monophosphate, 2-deoxy-d-glucose-6-phosphate, and cytidine-3′-monophosphate). Both grew on all the cells of PM5 (nutrient supplements), including that of the negative control. EcN grew on the majority of peptide nitrogen sources (PM6–PM8); however, K-12 could not utilize various valine-containing dipeptides owing to the frameshift mutation of ilvG, which encodes the subunit of acetohydroxy acid synthase II responsible for valine resistance [24,25]. K-12 was more tolerant to high osmolarity (PM9). Overall, EcN and K-12 showed better cell growth under alkaline (pH 9.5) and acidic conditions (pH 4.5), respectively (PM10).
EcN was more tolerant than K-12 to inhibitory compounds, such as antibiotics, antimetabolites, and other inhibitors (PM11–PM20). Of the 240 different inhibitory compounds tested, EcN and K-12 grew in the presence of 237 and 225 compounds with at least one of four concentrations, respectively. Compared to K-12, only EcN grew in wells containing at least one concentration of 15 compounds (cefotaxime, 5-chloro-7-iodo-8-hydroxyquinoline, erythromycin, 2,2′-dipyridyl, 5-fluorouracil, neomycin, paromomycin, pipemidic acid, potassium tellurite, semicarbazide hydrochloride, sisomicin, sodium selenite, streptomycin, sulfisoxazole, and tobramycin). EcN did not grow in the wells containing three antibiotics (sodium m-arsenite, sodium metavanadate, and sodium orthovanadate) at any concentration (Supplementary Table S2).

2.3. Gene Clusters Responsible for the Phenotypic Differences

Many of the phenotypic differences between EcN and K-12 could be correlated with the genotypic differences. Genome comparison of EcN, K-12, and CFT073 identified the genomic regions of EcN that differed from those of K-12, possibly responsible for the phenotypic differences (Figure 3). The related gene clusters of EcN exhibited high levels of structural similarities with those of CFT073; however, they were absent or represented differently in the K-12 genome. The agaVWEFA operon for N-acetylgalactosamine metabolism [26] is intact in the EcN genome, whereas it is truncated in the K-12 genome (Figure 3A). EcN harbors deoQKPX for 2-deoxy-d-ribose utilization [27] (Figure 3B) and sorEMABFDC for L-sorbose metabolism [28] (Figure 3C), whereas the K-12 genome does not. Interestingly, EcN does not have idnK-idnDOTR for a subsidiary pathway for D-gluconate catabolism (GntII), whereas both K-12 and CFT073 do (Figure 3D). However, the PM test showed that EcN effectively grew on D-gluconic acid and 5-keto-d-gluconic acid as the sole carbon source. This agrees with a previous report showing that gluconate catabolism is primarily mediated by the GntI system (encoded by gntT, gntU, and gntK), and that the GntII system is primarily involved in the catabolism of L-idonic acid in which D-gluconate is an intermediate [29].
The comparison of gene clusters for O-antigen biosynthesis revealed that EcN has a nonfunctional wzy gene encoding the O-antigen polymerase gene (Figure 3E), which results in the semi-rough O6 lipopolysaccharide (LPS) phenotype and serum sensitivity of EcN [30]. CFT073, which shows smooth LPS expression and serum resistance, has an intact gene cluster for O6 antigen biosynthesis [31]. Rough and serum-sensitive K-12 cannot synthesize the O16 antigen owing to the disruption of the rhamnosyl transferase gene (wbbL) by insertion element [32]. Thus, it can be speculated that the difference between EcN and K-12 in O-antigen biosynthetic gene clusters is responsible for the higher resistance of EcN to antibiotics than that of K-12. Gene clusters unrelated to the observed phenotypic differences were also inspected. In contrast to K-12, EcN has gene clusters associated with the anaerobic utilization of α-ketoglutarate (AKG) and L-lactate (Figure 3F) and a part of the methionine salvage pathway (MSP) [33] (Figure 3G).

2.4. Revision and Validation of the Metabolic Model

The draft reconstruction was updated by comparing the simulated growths from the FBA and experimental growths from the PM test under aerobic growth conditions. For 190 types of carbon sources (PM1 and PM2) and 95 nitrogen sources (PM3), differences in the simulated and experimental growths were identified in the utilization of 25 carbon and 19 nitrogen sources (Supplementary Table S3), which corresponded to 70.9% of the model accuracy.
The incongruences in the simulated and experimental growths were reflected in the modification of the model (Table 1). False negatives (growth from the PM test and non-growth from simulation) were observed for N-acetyl-d-glucosamine, N-acetyl-β-d-mannosamine, fructose, sorbitol, mannitol, mannose, and glucosamine, and these are carbohydrates transported by the sugar phosphotransferase system (PTS). Among the genes associated with PTS, we found that ptsI encoding PTS enzyme I was frameshifted in the EcN genome (NZ_CP007799). As PtsI activity is essential for E. coli growth on these PTS sugars [34], we sequenced the ptsI gene, and its DNA sequence was found to be intact and the same as that of E. coli ABU83972. Thus, we added transport reactions for these PTS sugars. We added one transport reaction and two intracellular reactions associated with the sorEMABFDC operon genes associated with L-sorbose metabolism. We added 13 dipeptidase reactions (catalyzed by PepD aminopeptidase) to break down 13 dipeptides and one dipeptidase reaction (catalyzed by PepQ prolidase) specifically hydrolyzing dipeptides containing a proline residue at the carboxy-terminal end [35] (Supplementary Table S1). We further added one exchange reaction and three transport reactions for the utilization of each of the 14 dipeptides as carbon or nitrogen sources. For example, glycyl-L-glutamic acid was utilized by adding EX_gly_glu__L_e, GLYLGLUtex, GLYLGLUtpp, GLYLGLUabcpp, and AMPEP8.
False positives (growth from simulation and non-growth from the PM test) were observed for the utilization of 12 substrates (acetoacetic acid, γ-amino-N-butyric acid, butyric acid, D-cellobiose, ethanolamine, inosine, L-ornithine, 1,2-propanediol, D-tartaric acid, L-tartaric acid, uric acid, and xanthine) as the sole carbon or nitrogen source. To match the predictions and experimental results, six reactions were removed from the draft model, as no relevant genes were retrieved in the MetaCyc [22] and/or KEGG [36] databases.
Eight reactions were reported to be active only under anaerobic (DTARTD, LCARS [37], SUCTARTtpp [38], TARTD, TARTRt7pp [39]) and stressful conditions (ARGAGMt7pp [40] and CELLBpts [41]); they were deactivated by constraining their flux to zero in the FBA simulation under aerobic conditions (Table 1). PTRCORNt7pp (for putrescine/ornithine antiporter) was deactivated because its associated gene (potE) was reported to show weak gene expression levels under normal culture conditions [42].
EcN has fully functional pathways for central carbon metabolism. It is also fully functional in the de novo syntheses of all essential nucleotides, amino acids, fatty acids, and LPS. The growth kinetics of EcN using diverse carbon sources was comparable to that of K-12 (Supplementary Figure S1), demonstrating full activity in aerobic respiration. During the model validation, the aceF gene, which was annotated to be frameshifted in the EcN genome (NZ_CP007799), was sequenced to be identical to that in the CFT073 genome. The aceF encodes the subunit of pyruvate dehydrogenase (PDH), catalyzing a preparatory step to the tricarboxylic acid (TCA) cycle by converting pyruvate from glycolysis into acetyl-CoA during aerobic respiration, and thus, it should be intact to explain the observed rapid growth of EcN under aerobic conditions.
All the entities of the metabolic model, such as metabolic reactions, genes, metabolites, and gene–protein–reaction rules, were manually curated. The final EcN metabolic model, referred to as iDK1463, comprised 1463 genes, 1313 unique metabolites, and 2984 metabolic reactions (Table 2). The simulated growth qualitatively agreed with the PM results for 240 of 190 carbon and 95 nitrogen sources, and the predictive accuracy of our model can be considered to be 84.2%. The quality and scope of iDK1463 were further evaluated using a metabolic model-testing suit MEMOTE [43], achieving an overall score of 89.4%, which is close to that of the K-12 model iML1515 (90.6%) (Supplementary Figure S2). The model can be downloaded in Excel (Supplementary Table S4) and SBML formats (Supplementary File), which are input to FBA software [44,45].

2.5. Gene Essentiality Analysis

FBA was performed to predict the reactions essential for cell growth of EcN and K-12 strains under aerobic conditions using glucose as the sole carbon source. A total of 195 genes were predicted to be essential for each EcN and K-12, of which 191 genes were shared. The predictions were compared with 249 essential genes determined by experimental genome-wide gene-knockout screens performed for K-12 under glucose growth conditions [15]. The predictions using EcN iDK1463 were consistent with the experimental results for 176 genes (accuracy of 70.7%), which is close to that of the K-12 model iML1515 (71.5%). EcN harbored four essential genes (argI, can, leuB, and purN) that were not predicted to be essential in K-12, and two of them (can and leuB) were experimentally validated. Ornithine carbamoyltransferase is involved in the L-arginine biosynthetic pathway, which is encoded by two genes in K-12 (argF and argI) and one gene in EcN (argI) [46]. Carbonic anhydrase is encoded by two genes in K-12 (can and cynT) and one gene in EcN (can) [47]. 3-isopropylmalate dehydrogenase is involved in the L-leucine biosynthetic pathway, which is encoded by two genes in K-12 (leuB and dmlA) and one gene in EcN (leuB) [48]. Phosphoribosylglycinamide formyltransferase, involved in de novo purine biosynthesis, is encoded by two genes in K-12 (purN and purT) and one gene in EcN (purN). A single deletion of purN in K-12 did not lead to purine auxotrophy [49]; however, only mutants defective in both purN and purT resulted in purine auxotrophy [50].
Of the 69 metabolic genes involved in the central catabolic pathways (glycolysis, TCA cycle, and pentose phosphate cycle), nine were reported to be essential for K-12 aerobically growing on glucose [15]. Of the nine essential genes, two genes involved in the TCA cycle (gltA encoding citrate synthase and icd encoding isocitrate dehydrogenase) were predicted to be essential from FBA using iML1515 of K-12 [15], and this was the same result obtained when iDK1463 was used. The remaining seven genes (lpd, gapA, eno, fbaA, pgk, pfkA, and tpiA) represent false positives (i.e., predicted growth while experimental non-growth). False growth prediction can be used to refine the model when more biochemical information is available [12].

2.6. Simulation of Utilization of Carbon Sources under Anaerobic Intestinal Environments

iDK1463 was simulated for the anaerobic utilization of the six major sugars in gastrointestinal mucus (N-acetylgalactosamine, N-acetylglucosamine, N-acetylneuraminic acid, L-fucose, D-galactose, and D-gluconate) [51,52,53], four substrates associated with the EcN-specific presence of metabolic gene clusters compared to K-12 (2-deoxy-d-ribose, L-lactic acid, L-sorbose, and AKG), and D-glucose (Figure 3). Glycerol was also tested because it was reported to be a major carbon source of energy supply for intracellularly replicating Listeria monocytogenes [54]. From the study on the sugar utilization of EcN in the mouse intestine [55], five of the 12 simulated carbon sources (N-acetylneuraminic acid, N-acetylgalactosamine, D-galactose, D-gluconate, and L-fucose) supported EcN colonization, while N-acetylglucosamine and D-ribose were unnecessary for the intestinal colonization. For FBA under anaerobic conditions, the upper limits of oxygen and each of the carbon sources were set to zero and 20 mmol gDCW−1 h−1, respectively. Fluxes of six reactions that were deactivated for aerobic FBAs (DTARTD, LCARS, SUCTARTtpp, TARTD, TARTRt7pp, and ARGAGMT7pp) (Table 1) were unconstrained. We further unconstrained the flux mediated by the formate–hydrogen lyase complex, which is oxygen sensitive and is responsible for H2 production via formate oxidation under fermentative conditions [56].
The simulated flux distribution patterns were depicted for the 12 carbon sources that were fed into the fermentative pathway (Figure 4A). Entry points into the Embden–Meyerhof–Parnas (EMP) pathway were glucose 6-phosphate (from the degradation of D-galactose and D-glucose), fructose 6-phosphate (from N-acetylglucosamine, N-acetylneuraminic acid, and L-sorbose), and D-glyceraldehyde 3-phosphate (from L-fucose, N-acetylgalactosamine, 2-deoxy-d-ribose, and glycerol). D-gluconate was metabolized to D-glyceraldehyde 3-phosphate and pyruvate almost exclusively via the Entner–Doudoroff (ED) pathway. L-lactic acid and AKG were subsequently converted to pyruvate. The predicted growth yield, ATP production, and NAD+ regeneration according to the carbon sources are summarized in Figure 4B. The simulated growth rate was highest (0.749 h−1) when N-acetylneuraminic acid was used as the sole carbon source, followed by N-acetylglucosamine (0.554) > D-glucose (0.504) ≈ N-acetylgalactosamine (0.5) > D-galactose (0.455) > D-gluconate (0.407) = L-sorbose (0.407) > 2-deoxy-d-ribose (0.258) ≈ L-fucose (0.251) > glycerol (0.210) > AKG (0.14) > L-lactic acid (0.014) (Figure 4). The utilization of one N-acetylneuraminic acid molecule led to the formation of two pyruvates from glycolysis and one additional pyruvate catalyzed by N-acetylneuraminate lyase (Figure 4A), and thus, the highest amount of ATP was produced via the glycolytic and fermentative pathways.
The catabolism of AKG and L-lactic acid did not include glycolysis, thereby yielding the lowest growth rate. Intracellular AKG was converted to citrate by running the TCA cycle in reverse, then to oxaloacetate and acetate by citrate lyase of an anaerobic enzyme [57]. Oxaloacetate was reduced to malate, allowing NAD+ regeneration by malate dehydrogenase (MDH). Malate was converted to pyruvate as a part of gluconeogenesis. Pyruvate was converted to acetyl-CoA with concomitant generation of NADH by PDH, whereas the catabolism of the other eight carbon sources employed anaerobically induced pyruvate formate lyase (PFL), which catalyzes the non-oxidative cleavage of pyruvate to acetyl-CoA and formate [58]. Intracellular L-lactic acid was directly converted to pyruvate with NADH generation by L-lactate dehydrogenase (L-LDH). The prepared pyruvate entered the fermentative pathway by which only acetate was produced for the catabolism of AKG, whereas acetate and ethanol were produced for the L-lactic acid catabolism. The inefficient NAD+ regeneration resulted in the lowest ATP production for FBA using L-lactate as the sole carbon source.

3. Discussion

Differences in E. coli strains of Nissle and K-12 in the utilization of diverse nutrient substrates were identified (Figure 2) and could, in many cases, be correlated with genotypic differences (Figure 3). In general, genome sequence data alone do not allow the identification of the genetic determinants of a given phenotypic variation, and the number of genetic differences even between closely related strains is often too large to be evaluated by gene deletion and complementation tests [59]. The metabolic simulations for nutrient utilization described in this study outline a general strategy for identifying the genetic basis of phenotypic divergence based on clues from comparative genome and phenome analyses. Experimental evidence for the phenotypic differences between the two organisms was provided by the PM tests, and the genetic bases responsible for the phenotypic differences were corroborated by metabolic simulation. Previously, we used this approach to reveal the genotype–phenotype associations between closely related E. coli strains B and K-12 [16,24]. Our approach forms a general strategy to understand the genetic basis of phenotypic functions of naturally occurring strains and laboratory-evolved strains.
The spectrum of nutrient utilization and antibiotic resistance is the first step toward a comprehensive understanding of the mechanisms by which commensals and pathogens colonize and persist in the gut in both normal and inflammatory conditions. This is in line with the previous finding that the human commensal E. coli K-12 MG1655 and enterohemorrhagic E. coli EDL933 grew primarily as single cells dispersed in the mouse cecal mucus layer [60]. In this regard, PM data in this study serve as a compendium of nearly 2000 monoculture phenotypes of EcN over a wide range of digestible substrates and inhibitory substrates.
The phenotypic profiles in this study provide insights into the colonizing capabilities of EcN. Nutrient sources supporting cell growth are important for E. coli to colonize the intestine [53]. EcN can use more diverse carbon (87 vs. 80) and nitrogen (57 vs. 53) sources than K-12 (Figure 1). EcN can aerobically grow on 13 sugars (fructose, fucose, galacturonate, gluconate, glucose, glucuronate, lactose, maltose, mannose, N-acetyl-d-glucosamine, N-acetylneuraminate, ribose, and xylose) and two carboxylic acids (acetate and malate), which were reported to be present in the gastrointestinal tract [52,53]. Commensal E. coli strains grow predominantly in the mucus layer [61]. They cannot degrade mucus polysaccharides and rely on other anaerobes for the release of metabolizable sugars. Thus, metabolic interactions with anaerobes and utilization of mucus-derived sugars is important for intestinal colonization by EcN [61,62]. Of the 15 nutrients, K-12 could not grow on the mucus-derived amino sugar of N-acetyl-d-galactosamine. Furthermore, it could not grow on 2-deoxy-d-ribose, which promotes pathogenic E. coli strains during host colonization because deoxyribose is derived from DNA degradation and is abundant in the intestine [63].
While EcN and K-12 showed high similarity in aerobic respiration, they were different in the anaerobic fermentative pathway. Remarkably, EcN has a large gene cluster for L-lactate biosynthesis, anaerobic utilization of AKG, and their two-component regulatory system (Figure 3F). To date, the genomic island is known to be specifically present in uropathogenic E. coli and absent from commensal E. coli and intestinal pathogenic E. coli [64]. As AKG is abundant in renal proximal tubule cells [65] and activity of AKG dehydrogenase shared by all E. coli strains is repressed under anaerobic conditions [66], the anaerobic utilization of AKG by AKG dehydrogenase encoded on the genomic island might be important for the colonization of the urinary tract by uropathogenic E. coli [64]. The intestine is supposed to be a major consumer of glutamine, which is the most abundant amino acid in the body and diet [67], and AKG is believed to be the most preferable glutamine derivative [68]. In addition to the quinone-dependent L-LDH (LldD, EC 1.1.2.3) shared by EcN and K-12, EcN has an additional NADH-dependent L-LDH (encoded by ECOLIN_RS23455, EC 1.1.1.27) on the genomic island. L-LDH catalyzes the oxidation of L-lactate to pyruvate, which has been reported to be important for the intracellular growth of Mycobacterium tuberculosis in human macrophages [69]. Furthermore, L-lactate is supposed to be a universal carbon source for intracellularly growing bacteria [69], and LldD expression is repressed under anaerobic conditions [70]. Our metabolic simulation demonstrates the anaerobic utilization of AKG and L-lactate without glycolysis (Figure 4). Taken together, the presence of the genomic island seems to be distinctly advantageous to EcN for intestinal colonization through the anaerobic utilization of AKG and L-lactate.
The ED pathway is important for E. coli to colonize the mouse intestine as it is the primary route for the catabolism of gluconate and other sugar acids which are available in the mucus layer [71]. Especially, gluconate was found to be a major carbon source for E. coli MG1655 to colonize in the mouse intestine [53]. In metabolic simulations of the anaerobic utilization of gluconate (Figure 4), gluconate was predicted to be metabolized via the ED pathway by 97.4% and 77.5%, respectively, in EcN and K-12. This contrasts with the simulated aerobic utilization of gluconate, which was metabolized exclusively via the pentose phosphate pathway to enter the upper part (fructose 6-phosphate and D-glyceraldehyde 3-phosphate) of the EMP pathway in both EcN and K-12. The high contribution of the ED pathway to gluconate metabolism in anaerobic conditions may imply that the ED pathway serves as an important energy-generating pathway for EcN growth in intestinal habitats [71].
Owing to the incomplete MSP, E. coli strains cannot synthesize methionine from 5-methylthioribose, which is exported into the culture media as waste [40]. Interestingly, EcN has an operon for the conversion from methylthioribose (MTR) to methylthioribulose-1-phosphate (MTRu-1-P) to 2,3-diketo-5-methylthiopentyl-1-phosphate as in extra-intestinal pathogenic E. coli S88 (O45:K1:H7) [33] (Figure 3G). However, no genes encoding downstream enzymes of MSP were found in EcN [72]. MTRu-1-P is highly reactive; therefore, interrupting MSP at the point where MTRu-1-P is produced appears to be metabolically impractical, and thus, the presence of an unknown alternative pathway for metabolizing MTRu-1-P has been suggested [33,72].
The growth of intracellular pathogens relies on host metabolites and depends on the efficient usage of the nutrients at various spatial locations and stages of intracellular growth [61]. The bipartite metabolism, a network topology with separate nutrient usage subnetworks for specific catabolic and anabolic purposes, is often found in many intracellular pathogens, such as Coxiella burnetii, Chlamydia trachomatis, Legionella pneumophila, and Listeria monocytogenes [73]. Little is known about the features of the complex metabolic and regulatory interactions between intracellular pathogens. Although nutrient-specific control over central metabolism by a carbon storage regulator (Csr) has been reported for EcN [74], studies on the bipartite metabolism of EcN are yet to be conducted. Once knowledge of the specific regulatory events and nutrient composition of intestinal habitats for EcN growth is accumulated, EcN iDK1463 can be utilized to elucidate potential bipartite metabolism by tracking carbon fluxes derived from various substrates, as exemplified in Figure 4.
In general, the most common probiotics are Gram-positive strains, such as Lactobacillus and Bifidobacterium species [75]. EcN is a representative Gram-negative probiotic and a model microorganism in biomedical research [76]. EcN has also been extensively engineered for therapeutic applications [3]. In the very early stages of systems and synthetic biology of EcN, iDK1463 can act as a framework for system modeling and integration of various omics data. This would facilitate the rational design of efficient probiotic interventions. Furthermore, iDK1463 can be applied to understand bacteria–bacteria as well as bacteria–host interactions occurring in the intestinal ecosystem.

4. Materials and Methods

4.1. Identification of Metabolic Genes and Reactions

The complete genome sequence of EcN (RefSeq accession number: NZ_CP007799) [18] was used for the functional annotation of genes based on homology searches. For each of the genomes of E. coli strains of K-12 MG1655 (NC_000913) [19], CFT073 (NC_004431) [20], and ABU83972 (NC_017631) [21], the protein sequences were BLASTP-searched against whole protein sequences of the EcN genome, using BLOSUM62 as a scoring matrix. If the percentage of conserved substitutions (percent positives) was over 90% and the aligned region was both over 90% of the lengths of the query and the hit, the pair of sequences was considered a homolog. The EDGAR server (version 2.3) [77] was further employed to find homologs in the EcN genome, with default settings.
Genes with potential metabolic roles were identified from the list of genes contained in the metabolic models of K-12 MG1655 (model id: iML1515), CFT073 (ic_1306), and ABU83972 (iECABU_c1320), which were retrieved from the BiGG models database [78], and their associated enzymes and biochemical reactions were also retrieved. Metabolic genes with no homologs in K-12, CFT073, and ABU83972 were queried to MetaCyc [22] to find metabolic reactions, using the MATLAB toolbox RAVEN version 2.0 [79]. The resulting gene–protein–reaction rules were manually revised.

4.2. PM Test

E. coli strain Nissle 1917 (Mutaflor, DSM 6601, serotype O6:K5:H1) was provided by Ardeypharm GmbH, (Herdecke, Germany). PM tests were performed as previously described [16]. The PM plates (Biolog Inc., Hayward, CA, USA) comprised 20 96-well plates containing different sources of carbon (PM1 and PM2), nitrogen (PM3), phosphorus, and sulfur (PM4); auxotrophic supplements (PM5); peptide nitrogen sources (PM6–PM8); and osmolytes (PM9). The PM10 plate was used to monitor cell growth on the pH stress, and PM11 to PM20 plates contained inhibitory compounds, such as antibiotics and antimetabolites. PM data of E. coli K-12 MG1655, which were purchased from American Type Culture Collection (ATCC), were retrieved from our previous study [24].
Cells were grown overnight at 37 °C on a Biolog universal growth (BUG) + B agar plate. Colonies were picked from the agar surface and suspended in inoculating fluid (IF) containing the indicator dye tetrazolium violet. IF-0 media were used for plates PM1 to PM8 and IF-10 for plates PM9 to PM20. Sodium succinate was added with ferric citrate to the inoculation solution of plates PM3 to PM8. All PM plates were inoculated with cell suspensions at 100 μL/well and incubated in an OmniLog incubator (Biolog Inc., Hayward, CA, USA) at 37 °C for 48 h. Four independent PM tests were performed using sodium succinate as the sole carbon source for the plates PM3 to PM8. The PM data were analyzed using the R package opm [80].

4.3. FBA

FBA was performed using the COBRApy software [45]. The maximum growth rate derived from the core biomass equation of K-12 iML1515 was set as the default objective function. Previously reported values of 59.8 and 8.4 mmol gDCW−1 h−1 of EcN were used as growth-associated maintenance energy (GAM) and non-growth-associated maintenance energy (NGAM), respectively [74]. The upper limits of glucose and oxygen were set to 10 and 18.5 mmol gDCW−1 h−1, respectively, unless otherwise mentioned.
For simulation of cell growth on PM plates for testing utilization of carbon (PM1 and PM2) and nitrogen (PM3) sources, the composition of defined media used in the PM plates was retrieved from BioCyc [22], and the same medium composition was used as the maximum uptake rate of the corresponding component. For simulations on PM1 and PM2, the maximum uptake rate of each carbon source was set to 10 mmol gDCW−1 h−1. For PM3 simulations, the maximum uptake rates of succinate and a nitrogen source were set to 10 and 5 mmol gDCW−1 h−1, respectively. A substrate was considered to be not utilized if the growth rate was <5% of the growth objective value calculated for the wild-type strain.
To identify the reactions that are essential for cell growth, the maximum growth rate was simulated when each reaction was removed from the reconstructed metabolic model using COBRApy [45]. An unrestrained supply of all the substrates was assumed. A reaction was considered essential if its removal from the model reduced the growth rate below the default threshold of 5% of the growth objective value calculated for the wild-type strain.

4.4. DNA Sequencing

For DNA sequencing of the ptsI and aceF genes, three sets of primers were prepared for each gene divided into three parts (Supplementary Table S5). Considering that the quality score of sequencing result was low in the front and back of the sequences, approximately 200 bp was left as a margin at the front and rear of the gene sequence, and each part was overlapped by approximately 300 bp. The gene was amplified using a PCR T100 thermal cycler (BioRad, Hercules, CA, USA) with genomic DNA of EcN as a template. The PCR product was purified using Expin PCR SV (GeneAll Biotechnology, Seoul, Korea). Sanger sequencing was performed using the BigDye Terminator v3.1 Cycle Sequencing Kit (Applied Biosystems, Thermo Fisher Scientific Inc., Waltham, MA, USA). The sequencing reaction was run using a DNA Engine Tetrad 2 Peltier Thermal Cycler (BioRad, Hercules, CA, USA), and each of the three parts was sequenced using three different forward primers. After removal of unincorporated dNTPs and other ingredients, the final products were loaded onto an ABI 3730xl DNA Analyzer (Applied Biosystems, Thermo Fisher Scientific Inc., Waltham, MA, USA) to obtain the sequencing results.

4.5. Availability of Data and Materials (Nucleotide Sequence Accession Numbers)

The sequences of ptsI and aceF of E. coli Nissle 1917 were deposited in GenBank under accession numbers MW239125 and MW239126, respectively.

Supplementary Materials

The following are available online at https://www.mdpi.com/1422-0067/22/4/2122/s1.

Author Contributions

Conceptualization, S.H.Y. and D.K.; methodology, D.K. and Y.K.; validation, D.K.; formal analysis, D.K. and Y.K.; investigation, D.K. and Y.K.; data curation, D.K.; writing—original draft preparation, D.K., Y.K. and S.H.Y.; writing—review and editing, S.H.Y.; supervision, S.H.Y.; funding acquisition, S.H.Y. All authors have read and agreed to the published version of the manuscript.

Funding

This research was funded by the National Research Foundation (NRF) of the Republic of Korea through the Technology Development Program to Solve Climate Changes on Systems Metabolic Engineering for Biorefineries [2012M1A2A2026559]; the Bio and Medical Technology Development Program [2018M3A9F3021968]; the Basic Science Research Program [2018R1D1A1B07044848]; and by the Ministry of Agriculture, Food, and Rural Affairs through the Strategic Initiative for Microbiomes in Agriculture and Food [918012-4].

Institutional Review Board Statement

Not applicable.

Informed Consent Statement

Not applicable.

Data Availability Statement

The data presented in this study are available in supplementary materials.

Conflicts of Interest

The authors declare no conflict of interest.

Abbreviations

AKGα-ketoglutarate
EcNEscherichia coli Nissle 1917
EDEntner–Doudoroff
EMPEmbden–Meyerhof–Parnas
FBAFlux balance analysis
L-LDHL-lactate dehydrogenase
LPSLipopolysaccharide
MSPMethionine salvage pathway
PMPhenotype microarray
PTSPhosphotransferase system

References

  1. Wassenaar, T.M. Insights from 100 years of research with probiotic E. coli. Eur. J. Microbiol. Immunol. 2016, 6, 147–161. [Google Scholar] [CrossRef] [Green Version]
  2. Sonnenborn, U. Escherichia coli strain Nissle 1917–from bench to bedside and back: History of a special Escherichia coli strain with probiotic properties. FEMS Microbiol. Lett. 2016, 363, fnw212. [Google Scholar] [CrossRef] [Green Version]
  3. Aggarwal, N.; Breedon, A.M.E.; Davis, C.M.; Hwang, I.Y.; Chang, M.W. Engineering probiotics for therapeutic applications: Recent examples and translational outlook. Curr. Opin. Biotechnol. 2020, 65, 171–179. [Google Scholar] [CrossRef]
  4. Choi, H.J.; Ahn, J.H.; Park, S.H.; Do, K.H.; Kim, J.; Moon, Y. Enhanced wound healing by recombinant Escherichia coli Nissle 1917 via human epidermal growth factor receptor in human intestinal epithelial cells: Therapeutic implication using recombinant probiotics. Infect. Immun. 2012, 80, 1079–1087. [Google Scholar] [CrossRef] [Green Version]
  5. Hwang, I.Y.; Koh, E.; Wong, A.; March, J.C.; Bentley, W.E.; Lee, Y.S.; Chang, M.W. Engineered probiotic Escherichia coli can eliminate and prevent Pseudomonas aeruginosa gut infection in animal models. Nat. Commun. 2017, 8, 15028. [Google Scholar] [CrossRef] [Green Version]
  6. Gu, C.; Kim, G.B.; Kim, W.J.; Kim, H.U.; Lee, S.Y. Current status and applications of genome-scale metabolic models. Genome Biol. 2019, 20, 121. [Google Scholar] [CrossRef] [Green Version]
  7. Li, R.; Helbig, L.; Fu, J.; Bian, X.; Herrmann, J.; Baumann, M.; Stewart, A.F.; Müller, R.; Li, A.; Zips, D.; et al. Expressing cytotoxic compounds in Escherichia coli Nissle 1917 for tumor-targeting therapy. Res. Microbiol. 2019, 170, 74–79. [Google Scholar] [CrossRef]
  8. Ho, C.L.; Tan, H.Q.; Chua, K.J.; Kang, A.; Lim, K.H.; Ling, K.L.; Yew, W.S.; Lee, Y.S.; Thiery, J.P.; Chang, M.W. Engineered commensal microbes for diet-mediated colorectal-cancer chemoprevention. Nat. Biomed. Eng. 2018, 2, 27–37. [Google Scholar] [CrossRef] [PubMed]
  9. Isabella, V.M.; Ha, B.N.; Castillo, M.J.; Lubkowicz, D.J.; Rowe, S.E.; Millet, Y.A.; Anderson, C.L.; Li, N.; Fisher, A.B.; West, K.A.; et al. Development of a synthetic live bacterial therapeutic for the human metabolic disease phenylketonuria. Nat. Biotechnol. 2018, 36, 857–864. [Google Scholar] [CrossRef]
  10. Kurtz, C.B.; Millet, Y.A.; Puurunen, M.K.; Perreault, M.; Charbonneau, M.R.; Isabella, V.M.; Kotula, J.W.; Antipov, E.; Dagon, Y.; Denney, W.S.; et al. An engineered E. coli Nissle improves hyperammonemia and survival in mice and shows dose-dependent exposure in healthy humans. Sci. Transl. Med. 2019, 11, eaau7975. [Google Scholar] [CrossRef]
  11. Orth, J.D.; Thiele, I.; Palsson, B.O. What is flux balance analysis? Nat. Biotechnol. 2010, 28, 245–248. [Google Scholar] [CrossRef] [PubMed]
  12. O’Brien, E.J.; Monk, J.M.; Palsson, B.O. Using genome-scale models to predict biological capabilities. Cell 2015, 161, 971–987. [Google Scholar] [CrossRef] [Green Version]
  13. van der Ark, K.C.H.; van Heck, R.G.A.; Martins Dos Santos, V.A.P.; Belzer, C.; de Vos, W.M. More than just a gut feeling: Constraint-based genome-scale metabolic models for predicting functions of human intestinal microbes. Microbiome 2017, 5, 78. [Google Scholar] [CrossRef]
  14. Monk, J.M.; Charusanti, P.; Aziz, R.K.; Lerman, J.A.; Premyodhin, N.; Orth, J.D.; Feist, A.M.; Palsson, B.O. Genome-scale metabolic reconstructions of multiple Escherichia coli strains highlight strain-specific adaptations to nutritional environments. Proc. Natl. Acad. Sci. USA 2013, 110, 20338–20343. [Google Scholar] [CrossRef] [PubMed] [Green Version]
  15. Monk, J.M.; Lloyd, C.J.; Brunk, E.; Mih, N.; Sastry, A.; King, Z.; Takeuchi, R.; Nomura, W.; Zhang, Z.; Mori, H.; et al. iML1515, a knowledgebase that computes Escherichia coli traits. Nat. Biotechnol. 2017, 35, 904–908. [Google Scholar] [CrossRef]
  16. Kim, H.; Kim, S.; Yoon, S.H. Metabolic network reconstruction and phenome analysis of the industrial microbe, Escherichia coli BL21(DE3). PLoS ONE 2018, 13, e0204375. [Google Scholar] [CrossRef] [PubMed]
  17. Magnúsdóttir, S.; Heinken, A.; Kutt, L.; Ravcheev, D.A.; Bauer, E.; Noronha, A.; Greenhalgh, K.; Jäger, C.; Baginska, J.; Wilmes, P.; et al. Generation of genome-scale metabolic reconstructions for 773 members of the human gut microbiota. Nat. Biotechnol. 2017, 35, 81–89. [Google Scholar] [CrossRef]
  18. Reister, M.; Hoffmeier, K.; Krezdorn, N.; Rotter, B.; Liang, C.; Rund, S.; Dandekar, T.; Sonnenborn, U.; Oelschlaeger, T.A. Complete genome sequence of the Gram-negative probiotic Escherichia coli strain Nissle 1917. J. Biotechnol. 2014, 187, 106–107. [Google Scholar] [CrossRef]
  19. Hayashi, K.; Morooka, N.; Yamamoto, Y.; Fujita, K.; Isono, K.; Choi, S.; Ohtsubo, E.; Baba, T.; Wanner, B.L.; Mori, H.; et al. Highly accurate genome sequences of Escherichia coli K-12 strains MG1655 and W3110. Mol. Syst. Biol. 2006, 2, 2006.0007. [Google Scholar] [CrossRef] [Green Version]
  20. Welch, R.A.; Burland, V.; Plunkett, G., III; Redford, P.; Roesch, P.; Rasko, D.; Buckles, E.L.; Liou, S.R.; Boutin, A.; Hackett, J.; et al. Extensive mosaic structure revealed by the complete genome sequence of uropathogenic Escherichia coli. Proc. Natl. Acad. Sci. USA 2002, 99, 17020–17024. [Google Scholar] [CrossRef] [Green Version]
  21. Zdziarski, J.; Brzuszkiewicz, E.; Wullt, B.; Liesegang, H.; Biran, D.; Voigt, B.; Grönberg-Hernandez, J.; Ragnarsdottir, B.; Hecker, M.; Ron, E.Z.; et al. Host imprints on bacterial genomes–rapid, divergent evolution in individual patients. PLoS Pathog. 2010, 6, e1001078. [Google Scholar] [CrossRef] [PubMed] [Green Version]
  22. Caspi, R.; Billington, R.; Ferrer, L.; Foerster, H.; Fulcher, C.A.; Keseler, I.M.; Kothari, A.; Krummenacker, M.; Latendresse, M.; Mueller, L.A.; et al. The MetaCyc database of metabolic pathways and enzymes and the BioCyc collection of pathway/genome databases. Nucleic Acids Res. 2016, 44, D471–D480. [Google Scholar] [CrossRef] [PubMed]
  23. Bochner, B.R.; Gadzinski, P.; Panomitros, E. Phenotype microarrays for high-throughput phenotypic testing and assay of gene function. Genome Res. 2001, 11, 1246–1255. [Google Scholar] [CrossRef] [Green Version]
  24. Yoon, S.H.; Han, M.J.; Jeong, H.; Lee, C.H.; Xia, X.X.; Lee, D.H.; Shim, J.H.; Lee, S.Y.; Oh, T.K.; Kim, J.F. Comparative multi-omics systems analysis of Escherichia coli strains B and K-12. Genome Biol. 2012, 13, R37. [Google Scholar] [CrossRef] [PubMed] [Green Version]
  25. Lawther, R.P.; Calhoun, D.H.; Adams, C.W.; Hauser, C.A.; Gray, J.; Hatfield, G.W. Molecular basis of valine resistance in Escherichia coli K-12. Proc. Natl. Acad. Sci. USA 1981, 78, 922–925. [Google Scholar] [CrossRef] [Green Version]
  26. Brinkkötter, A.; Klöss, H.; Alpert, C.; Lengeler, J.W. Pathways for the utilization of N-acetyl-galactosamine and galactosamine in Escherichia coli. Mol. Microbiol. 2000, 37, 125–135. [Google Scholar] [CrossRef]
  27. Christensen, M.; Borza, T.; Dandanell, G.; Gilles, A.-M.; Barzu, O.; Kelln, R.A.; Neuhard, J. Regulation of expression of the 2-deoxy-d-ribose utilization regulon, deoQKPX, from Salmonella enterica serovar typhimurium. J. Bacteriol. 2003, 185, 6042–6050. [Google Scholar] [CrossRef] [Green Version]
  28. Bryant, W.A.; Krabben, P.; Baganz, F.; Zhou, Y.; Ward, J.M. The analysis of multiple genome comparisons in genus Escherichia and its application to the discovery of uncharacterised metabolic genes in uropathogenic Escherichia coli CFT073. Comp. Funct. Genom. 2009, 2009, 782924. [Google Scholar] [CrossRef] [PubMed] [Green Version]
  29. Bausch, C.; Ramsey, M.; Conway, T. Transcriptional organization and regulation of the L-idonic acid pathway (GntII system) in Escherichia coli. J. Bacteriol. 2004, 186, 1388–1397. [Google Scholar] [CrossRef] [PubMed] [Green Version]
  30. Grozdanov, L.; Zähringer, U.; Blum-Oehler, G.; Brade, L.; Henne, A.; Knirel, Y.A.; Schombel, U.; Schulze, J.; Sonnenborn, U.; Gottschalk, G.; et al. A single nucleotide exchange in the wzy gene is responsible for the semirough O6 lipopolysaccharide phenotype and serum sensitivity of Escherichia coli strain Nissle 1917. J. Bacteriol. 2002, 184, 5912–5925. [Google Scholar] [CrossRef] [Green Version]
  31. Brzuszkiewicz, E.; Brüggemann, H.; Liesegang, H.; Emmerth, M.; Olschläger, T.; Nagy, G.; Albermann, K.; Wagner, C.; Buchrieser, C.; Emody, L.; et al. How to become a uropathogen: Comparative genomic analysis of extraintestinal pathogenic Escherichia coli strains. Proc. Natl. Acad. Sci. USA 2006, 103, 12879–12884. [Google Scholar] [CrossRef] [Green Version]
  32. Liu, D.; Reeves, P.R. Escherichia coli K12 regains its O antigen. Microbiology 1994, 140, 49–57. [Google Scholar] [CrossRef] [Green Version]
  33. Sekowska, A.; Ashida, H.; Danchin, A. Revisiting the methionine salvage pathway and its paralogues. Microb. Biotechnol. 2019, 12, 77–97. [Google Scholar] [CrossRef] [PubMed]
  34. Simoni, R.D.; Roseman, S.; Saier, M.H., Jr. Sugar transport. Properties of mutant bacteria defective in proteins of the phosphoenolpyruvate: Sugar phosphotransferase system. J. Biol. Chem. 1976, 251, 6584–6597. [Google Scholar] [CrossRef]
  35. Park, M.S.; Hill, C.M.; Li, Y.; Hardy, R.K.; Khanna, H.; Khang, Y.H.; Raushel, F.M. Catalytic properties of the PepQ prolidase from Escherichia coli. Arch. Biochem. Biophys. 2004, 429, 224–230. [Google Scholar] [CrossRef] [PubMed]
  36. Kanehisa, M.; Furumichi, M.; Sato, Y.; Ishiguro-Watanabe, M.; Tanabe, M. KEGG: Integrating viruses and cellular organisms. Nucleic Acids Res. 2021, 49, D545–D551. [Google Scholar] [CrossRef]
  37. Chen, Y.M.; Lin, E.C.; Ros, J.; Aguilar, J. Use of operon fusions to examine the regulation of the L-1,2-propanediol oxidoreductase gene of the fucose system in Escherichia coli K12. J. Gen. Microbiol. 1983, 129, 3355–3362. [Google Scholar] [CrossRef] [Green Version]
  38. Kim, O.B.; Lux, S.; Unden, G. Anaerobic growth of Escherichia coli on D-tartrate depends on the fumarate carrier DcuB and fumarase, rather than the L-tartrate carrier TtdT and L-tartrate dehydratase. Arch. Microbiol. 2007, 188, 583–589. [Google Scholar] [CrossRef]
  39. Kim, O.B.; Reimann, J.; Lukas, H.; Schumacher, U.; Grimpo, J.; Dünnwald, P.; Unden, G. Regulation of tartrate metabolism by TtdR and relation to the DcuS-DcuR-regulated C4-dicarboxylate metabolism of Escherichia coli. Microbiology 2009, 155, 3632–3640. [Google Scholar] [CrossRef] [Green Version]
  40. Fang, Y.; Kolmakova-Partensky, L.; Miller, C. A bacterial arginine-agmatine exchange transporter involved in extreme acid resistance. J. Biol. Chem. 2007, 282, 176–182. [Google Scholar] [CrossRef] [Green Version]
  41. Vinuselvi, P.; Lee, S.K. Engineering Escherichia coli for efficient cellobiose utilization. Appl. Microbiol. Biotechnol. 2011, 92, 125–132. [Google Scholar] [CrossRef]
  42. Kashiwagi, K.; Shibuya, S.; Tomitori, H.; Kuraishi, A.; Igarashi, K. Excretion and uptake of putrescine by the PotE protein in Escherichia coli. J. Biol. Chem. 1997, 272, 6318–6323. [Google Scholar] [CrossRef] [Green Version]
  43. Lieven, C.; Beber, M.E.; Olivier, B.G.; Bergmann, F.T.; Ataman, M.; Babaei, P.; Bartell, J.A.; Blank, L.M.; Chauhan, S.; Correia, K.; et al. MEMOTE for standardized genome-scale metabolic model testing. Nat. Biotechnol. 2020, 38, 272–276. [Google Scholar] [CrossRef] [PubMed] [Green Version]
  44. Schellenberger, J.; Que, R.; Fleming, R.M.; Thiele, I.; Orth, J.D.; Feist, A.M.; Zielinski, D.C.; Bordbar, A.; Lewis, N.E.; Rahmanian, S.; et al. Quantitative prediction of cellular metabolism with constraint-based models: The COBRA Toolbox v2.0. Nat. Protoc. 2011, 6, 1290–1307. [Google Scholar] [CrossRef] [PubMed] [Green Version]
  45. Ebrahim, A.; Lerman, J.A.; Palsson, B.O.; Hyduke, D.R. COBRApy: COnstraints-Based Reconstruction and Analysis for Python. BMC Syst. Biol. 2013, 7, 74. [Google Scholar] [CrossRef] [PubMed] [Green Version]
  46. Legrain, C.; Halleux, P.; Stalon, V.; Glansdorff, N. The dual genetic control of ornithine carbamolytransferase in Escherichia coli. A case of bacterial hybrid enzymes. Eur. J. Biochem. 1972, 27, 93–102. [Google Scholar] [CrossRef]
  47. Merlin, C.; Masters, M.; McAteer, S.; Coulson, A. Why is carbonic anhydrase essential to Escherichia coli? J. Bacteriol. 2003, 185, 6415–6424. [Google Scholar] [CrossRef] [PubMed] [Green Version]
  48. Vorobieva, A.A.; Khan, M.S.; Soumillion, P. Escherichia coli D-malate dehydrogenase, a generalist enzyme active in the leucine biosynthesis pathway. J. Biol. Chem. 2014, 289, 29086–29096. [Google Scholar] [CrossRef] [Green Version]
  49. Smith, J.M.; Daum, H.A., III. Identification and nucleotide sequence of a gene encoding 5′-phosphoribosylglycinamide transformylase in Escherichia coli K12. J. Biol. Chem. 1987, 262, 10565–10569. [Google Scholar] [CrossRef]
  50. Nygaard, P.; Smith, J.M. Evidence for a novel glycinamide ribonucleotide transformylase in Escherichia coli. J. Bacteriol. 1993, 175, 3591–3597. [Google Scholar] [CrossRef] [PubMed] [Green Version]
  51. Allen, A.; Cunliffe, W.J.; Pearson, J.P.; Sellers, L.A.; Ward, R. Studies on gastrointestinal mucus. Scand. J. Gastroenterol. Suppl. 1984, 93, 101–113. [Google Scholar] [PubMed]
  52. Fabich, A.J.; Jones, S.A.; Chowdhury, F.Z.; Cernosek, A.; Anderson, A.; Smalley, D.; McHargue, J.W.; Hightower, G.A.; Smith, J.T.; Autieri, S.M.; et al. Comparison of carbon nutrition for pathogenic and commensal Escherichia coli strains in the mouse intestine. Infect. Immun. 2008, 76, 1143–1152. [Google Scholar] [CrossRef] [Green Version]
  53. Chang, D.E.; Smalley, D.J.; Tucker, D.L.; Leatham, M.P.; Norris, W.E.; Stevenson, S.J.; Anderson, A.B.; Grissom, J.E.; Laux, D.C.; Cohen, P.S.; et al. Carbon nutrition of Escherichia coli in the mouse intestine. Proc. Natl. Acad. Sci. USA 2004, 101, 7427–7432. [Google Scholar] [CrossRef] [PubMed] [Green Version]
  54. Grubmüller, S.; Schauer, K.; Goebel, W.; Fuchs, T.M.; Eisenreich, W. Analysis of carbon substrates used by Listeria monocytogenes during growth in J774A.1 macrophages suggests a bipartite intracellular metabolism. Front. Cell. Infect. Microbiol. 2014, 4, 156. [Google Scholar] [PubMed]
  55. Maltby, R.; Leatham-Jensen, M.P.; Gibson, T.; Cohen, P.S.; Conway, T. Nutritional basis for colonization resistance by human commensal Escherichia coli strains HS and Nissle 1917 against E. coli O157:H7 in the mouse intestine. PLoS ONE 2013, 8, e53957. [Google Scholar] [CrossRef] [PubMed] [Green Version]
  56. McDowall, J.S.; Hjersing, M.C.; Palmer, T.; Sargent, F. Dissection and engineering of the Escherichia coli formate hydrogenlyase complex. FEBS Lett. 2015, 589, 3141–3147. [Google Scholar] [CrossRef]
  57. Quentmeier, A.; Holzenburg, A.; Mayer, F.; Antranikian, G. Reevaluation of citrate lyase from Escherichia coli. Biochim. Biophys. Acta 1987, 913, 60–65. [Google Scholar] [CrossRef]
  58. Knappe, J.; Sawers, G. A radical-chemical route to acetyl-CoA: The anaerobically induced pyruvate formate-lyase system of Escherichia coli. FEMS Microbiol. Rev. 1990, 6, 383–398. [Google Scholar]
  59. Freddolino, P.L.; Goodarzi, H.; Tavazoie, S. Revealing the genetic basis of natural bacterial phenotypic divergence. J. Bacteriol. 2014, 196, 825–839. [Google Scholar] [CrossRef] [PubMed] [Green Version]
  60. Miranda, R.L.; Conway, T.; Leatham, M.P.; Chang, D.E.; Norris, W.E.; Allen, J.H.; Stevenson, S.J.; Laux, D.C.; Cohen, P.S. Glycolytic and gluconeogenic growth of Escherichia coli O157:H7 (EDL933) and E. coli K-12 (MG1655) in the mouse intestine. Infect. Immun. 2004, 72, 1666–1676. [Google Scholar] [CrossRef] [Green Version]
  61. Conway, T.; Cohen, P.S. Commensal and pathogenic Escherichia coli metabolism in the gut. Microbiol. Spectr. 2015, 3. [Google Scholar] [CrossRef] [Green Version]
  62. Hoskins, L.C.; Agustines, M.; McKee, W.B.; Boulding, E.T.; Kriaris, M.; Niedermeyer, G. Mucin degradation in human colon ecosystems. Isolation and properties of fecal strains that degrade ABH blood group antigens and oligosaccharides from mucin glycoproteins. J. Clin. Investig. 1985, 75, 944–953. [Google Scholar] [CrossRef]
  63. Martinez-Jéhanne, V.; du Merle, L.; Bernier-Fébreau, C.; Usein, C.; Gassama-Sow, A.; Wane, A.A.; Gouali, M.; Damian, M.; Aïdara-Kane, A.; Germani, Y.; et al. Role of deoxyribose catabolism in colonization of the murine intestine by pathogenic Escherichia coli strains. Infect. Immun. 2009, 77, 1442–1450. [Google Scholar] [CrossRef] [PubMed] [Green Version]
  64. Cai, W.; Wannemuehler, Y.; Dell’anna, G.; Nicholson, B.; Barbieri, N.L.; Kariyawasam, S.; Feng, Y.; Logue, C.M.; Nolan, L.K.; Li, G. A novel two-component signaling system facilitates uropathogenic Escherichia coli’s ability to exploit abundant host metabolites. PLoS Pathog. 2013, 9, e1003428. [Google Scholar] [CrossRef] [Green Version]
  65. Martin, M.; Ferrier, B.; Baverel, G. Transport and utilization of a-ketoglutarate by the rat kidney in vivo. Pflugers Arch. 1989, 413, 217–224. [Google Scholar] [CrossRef]
  66. Iuchi, S.; Lin, E.C. arcA (dye), a global regulatory gene in Escherichia coli mediating repression of enzymes in aerobic pathways. Proc. Natl. Acad. Sci. USA 1988, 85, 1888–1892. [Google Scholar] [CrossRef] [Green Version]
  67. Neu, J.; Shenoy, V.; Chakrabarti, R. Glutamine nutrition and metabolism: Where do we go from here? FASEB J. 1996, 10, 829–837. [Google Scholar] [CrossRef]
  68. Filip, R.; Pierzynowski, S. The role of glutamine and α-ketoglutarate in gut metabolism and the potential application in medicine and nutrition. J. Pre-Clin. Clin. Res. 2007, 1, 9–15. [Google Scholar]
  69. Billig, S.; Schneefeld, M.; Huber, C.; Grassl, G.A.; Eisenreich, W.; Bange, F.C. Lactate oxidation facilitates growth of Mycobacterium tuberculosis in human macrophages. Sci. Rep. 2017, 7, 6484. [Google Scholar] [CrossRef] [PubMed]
  70. Iuchi, S.; Aristarkhov, A.; Dong, J.M.; Taylor, J.S.; Lin, E.C. Effects of nitrate respiration on expression of the Arc-controlled operons encoding succinate dehydrogenase and flavin-linked L-lactate dehydrogenase. J. Bacteriol. 1994, 176, 1695–1701. [Google Scholar] [CrossRef] [Green Version]
  71. Peekhaus, N.; Conway, T. What’s for dinner?: Entner-Doudoroff metabolism in Escherichia coli. J. Bacteriol. 1998, 180, 3495–3502. [Google Scholar] [CrossRef] [PubMed] [Green Version]
  72. Sun, J.; Gunzer, F.; Westendorf, A.M.; Buer, J.; Scharfe, M.; Jarek, M.; Gössling, F.; Blöcker, H.; Zeng, A.P. Genomic peculiarity of coding sequences and metabolic potential of probiotic Escherichia coli strain Nissle 1917 inferred from raw genome data. J. Biotechnol. 2005, 117, 147–161. [Google Scholar] [CrossRef] [PubMed]
  73. Best, A.; Abu Kwaik, Y. Nutrition and bipartite metabolism of intracellular pathogens. Trends Microbiol. 2019, 27, 550–561. [Google Scholar] [CrossRef] [PubMed]
  74. Revelles, O.; Millard, P.; Nougayrède, J.P.; Dobrindt, U.; Oswald, E.; Létisse, F.; Portais, J.C. The carbon storage regulator (Csr) system exerts a nutrient-specific control over central metabolism in Escherichia coli strain Nissle 1917. PLoS ONE 2013, 8, e66386. [Google Scholar] [CrossRef] [PubMed]
  75. Behnsen, J.; Deriu, E.; Sassone-Corsi, M.; Raffatellu, M. Probiotics: Properties, examples, and specific applications. Cold Spring Harb. Perspect. Med. 2013, 3, a010074. [Google Scholar] [CrossRef] [PubMed] [Green Version]
  76. Sonnenborn, U.; Schulze, J. The non-pathogenic Escherichia coli strain Nissle 1917—Features of a versatile probiotic. Microb. Ecol. Health Dis. 2009, 21, 122–158. [Google Scholar]
  77. Blom, J.; Kreis, J.; Spänig, S.; Juhre, T.; Bertelli, C.; Ernst, C.; Goesmann, A. EDGAR 2.0: An enhanced software platform for comparative gene content analyses. Nucleic Acids Res. 2016, 44, W22–W28. [Google Scholar] [CrossRef] [PubMed] [Green Version]
  78. King, Z.A.; Lu, J.; Drager, A.; Miller, P.; Federowicz, S.; Lerman, J.A.; Ebrahim, A.; Palsson, B.O.; Lewis, N.E. BiGG models: A platform for integrating, standardizing and sharing genome-scale models. Nucleic Acids Res. 2016, 44, D515–D522. [Google Scholar] [CrossRef]
  79. Wang, H.; Marcišauskas, S.; Sánchez, B.J.; Domenzain, I.; Hermansson, D.; Agren, R.; Nielsen, J.; Kerkhoven, E.J. RAVEN 2.0: A versatile toolbox for metabolic network reconstruction and a case study on Streptomyces coelicolor. PLoS Comput. Biol. 2018, 14, e1006541. [Google Scholar] [CrossRef] [Green Version]
  80. Vaas, L.A.; Sikorski, J.; Hofner, B.; Fiebig, A.; Buddruhs, N.; Klenk, H.P.; Goker, M. opm: An R package for analysing OmniLog® phenotype microarray data. Bioinformatics 2013, 29, 1823–1824. [Google Scholar] [CrossRef] [PubMed] [Green Version]
Figure 1. Comparison of phenotype microarray (PM) tests of E. coli strains Nissle 1917 and K-12 MG1655. (A) Carbon sources (PM1 and PM2). (B) Nitrogen sources (PM3). (C) Inhibitory compounds, such as antibiotics, antimetabolites, and other inhibitors (PM11 to PM20). The numbers indicate the number of nutrients on which cells grew.
Ijms 22 02122 g001
Figure 2. Comparison of carbon and nitrogen source utilization of E. coli strains Nissle 1917 and K-12 MG1655. Growth curves in all the cells are shown for E. coli Nissle 1917 (red) and K-12 MG1655 (green). (A) Carbon sources (PM1). (B) Carbon sources (PM2). (C) Nitrogen sources (PM3).
Ijms 22 02122 g002
Figure 3. Examples of different metabolic gene clusters in the genomes of E. coli strains Nissle 1917, CFT073, and K-12 MG1655. Gene clusters for N-acetyl-d-galactosamine metabolism (A), 2-deoxy-d-ribose metabolism (B), L-sorbose metabolism (C), 5-keto-d-gluconic acid metabolism (D), O-antigen biosynthesis (E), anaerobic utilization of α-ketoglutarate (AKG) and L-lactate (F), and a part of methionine salvage pathway (G). Gene names in red are for Nissle genes, the reactions of which were included in the Nissle metabolic model.
Ijms 22 02122 g003
Figure 4. Model predictions of growth capability in the nutrient sources under anaerobic conditions. (A) Schematics of the predicted flux distributions. The nine carbon sources simulated are in red. Reactions are in the box. Arrows denote directions of the predicted metabolic fluxes, and dashed arrows indicate the multi-step reaction. Metabolites colored above arrows indicate cofactors (ADP, ATP, NAD, and NADH). Some metabolites (pyruvate and acetate) are duplicated on the map for clearer visualization and are labeled with an asterisk (*). (B) Summary of the simulation for the utilization of nine carbon sources. “Reactions for ATP production” and “Reactions for NAD+ regeneration” are reactions responsible for >95% of total ATP production and total NAD+ regeneration, respectively, in descending order. Abbreviations are given in Supplementary Table S4. For flux balance analysis (FBA) under anaerobic conditions, the upper limits of oxygen and each of the carbon sources were set to zero and 20 mmol gDCW−1 h−1, respectively.
Ijms 22 02122 g004
Table 1. Model refinement based on comparison of the simulated and experimental growths.
SubstratesPM aPrediction b
(Draft/iDK1463)
Associated Reactions cModification
Carbon Sources
acetoacetic acid-+/−ACACtexDeletion
γ-amino-N-butyric acid-+/−ABUTtexDeletion
butyric acid-+/−BUTt2rppDeletion
D-cellobiose-+/−CELLBptsDeactivated
1,2-propanediol-+/−LCARSDeactivated
L-ornithine-+/−PTRCORNt7ppDeactivated
L-sorbose+−/+EX_srb__L_e, SRBtex, SRBptspp, SRB1PRAddition
PTS sugars d+−/+ACGAptspp, ACMANAptspp, FRUptspp, SBTptspp, MNLptspp, MANptspp, GAMptsppAddition
D-tartaric acid-+/−DTARTD, SUCTARTtppDeactivated
L-tartaric acid-+/−TARTD, TARTRt7ppDeactivated
Nitrogen Sources
ethanolamine-+/−ETHAtexDeletion
inosine-+/−URICDeletion
uric acid-+/−URICDeletion
xanthine-+/−XANtexDeletion
The complete list of experimental and simulated cell growth is available in Supplementary Table S3. a Cell growth from PM tests is categorized into non-growth (“−”) or growth (“+”) based on statistical analysis of four growth replicates of each strain (see Supplementary Table S2 for details). b Simulated cell growth on each carbon and nitrogen source by flux balance analysis: non-growth (“−”), growth (“+”). c Detailed information for the reactions is listed in Supplementary Table S4. d Carbohydrates transported by sugar phosphotransferase system (PTS) (N-acetyl-d-glucosamine, N-acetyl-β-d-mannosamine, D-fructose, D-glucosamine, D-mannitol, D-mannose, and D-sorbitol).
Table 2. Components of the metabolic network model of E. coli Nissle 1917.
Metabolic ModeliDK1463
Genes1463
Metabolic reactions2984
 Enzymatic reactions1633
 Transport reactions903
 Exchange reactions441
 Demand reactions7
Gene-reaction association2986
 Gene-associated reactions2368
 Not gene-associated reactions578
 Spontaneous reactions40
Metabolites2112
 Cytoplasmic1160
 Periplasmic509
 Extracellular443
Unique metabolites1313
Publisher’s Note: MDPI stays neutral with regard to jurisdictional claims in published maps and institutional affiliations.

