
Nephrotoxic Effects of Paraoxon in Three Rat Models of Acute Intoxication

 ,
,
Abstract
:1. Introduction
2. Results
2.1. Nephrotoxicity of POX in the M1 and M2 Models
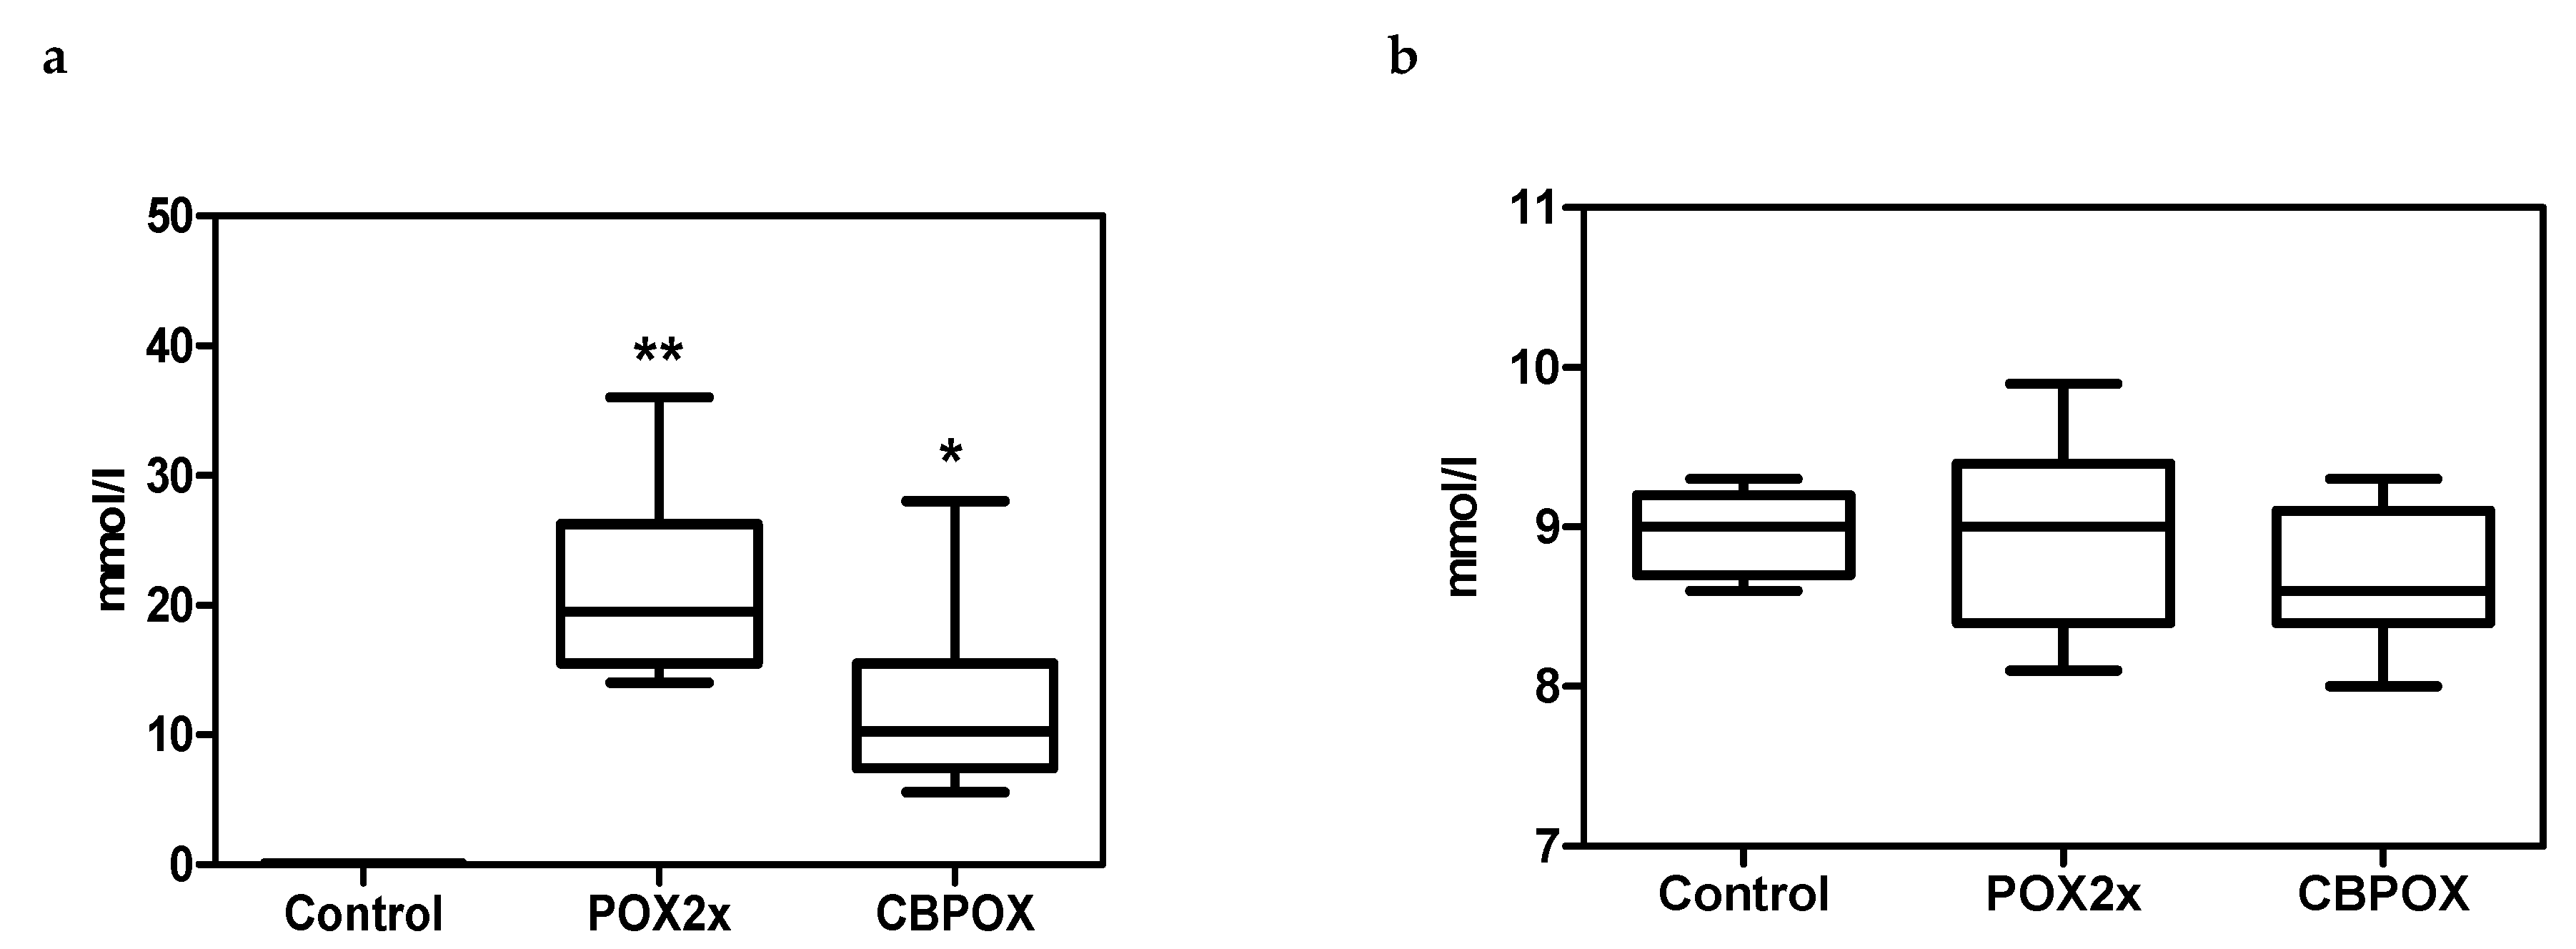
2.1.1. Plasma Biochemistry
2.1.2. Urinalysis
2.1.3. Chondroitin Sulphate (CS) in Rat Urine
2.1.4. Calbindin, KIM-1, TIMP-1 in Rat Urine
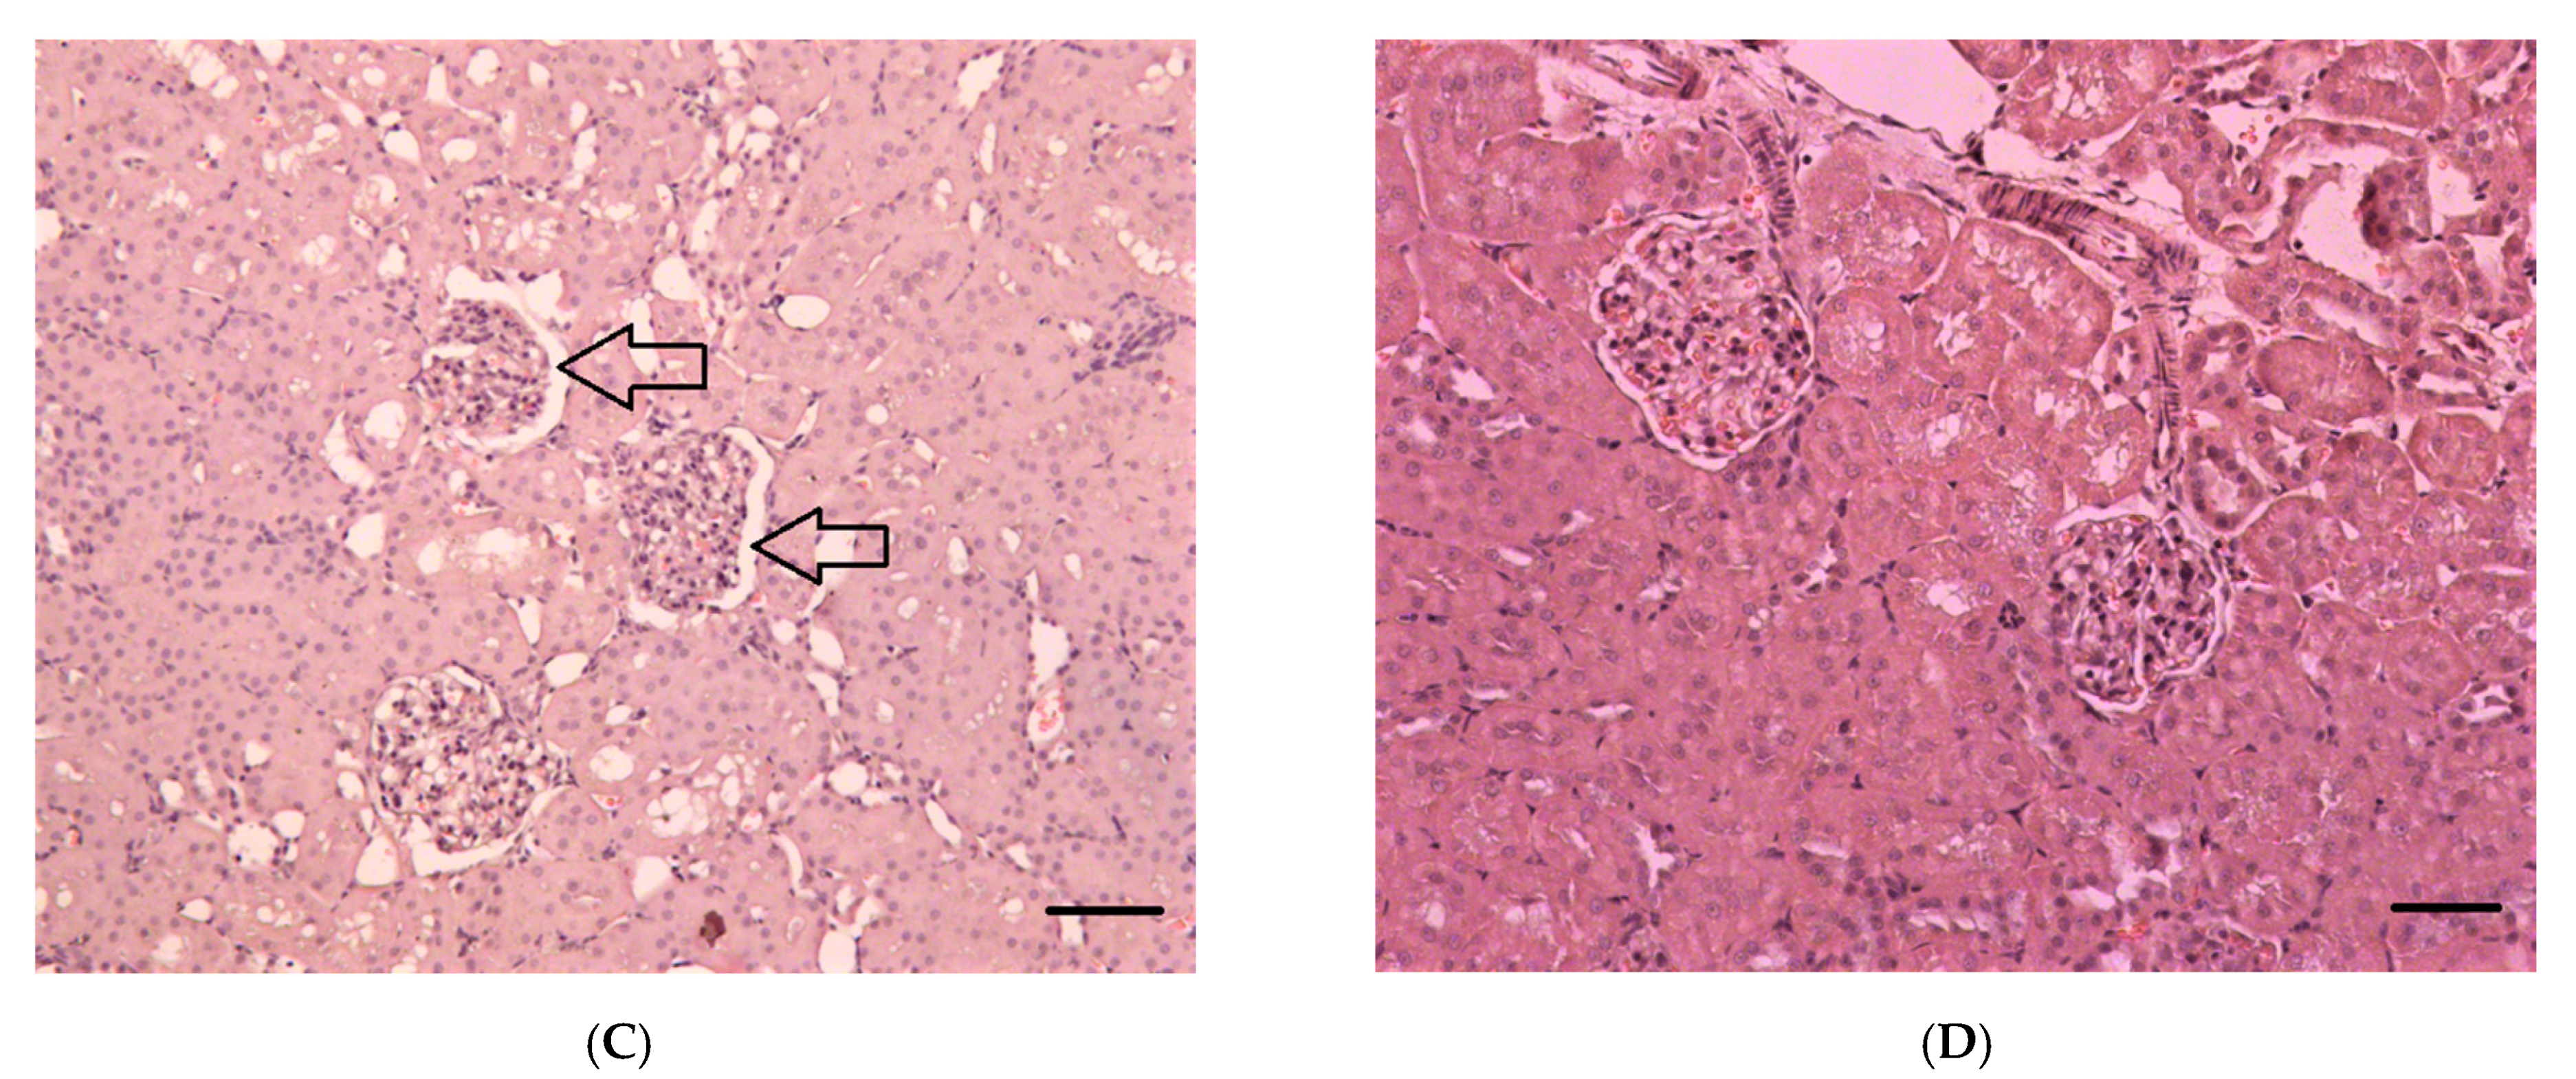
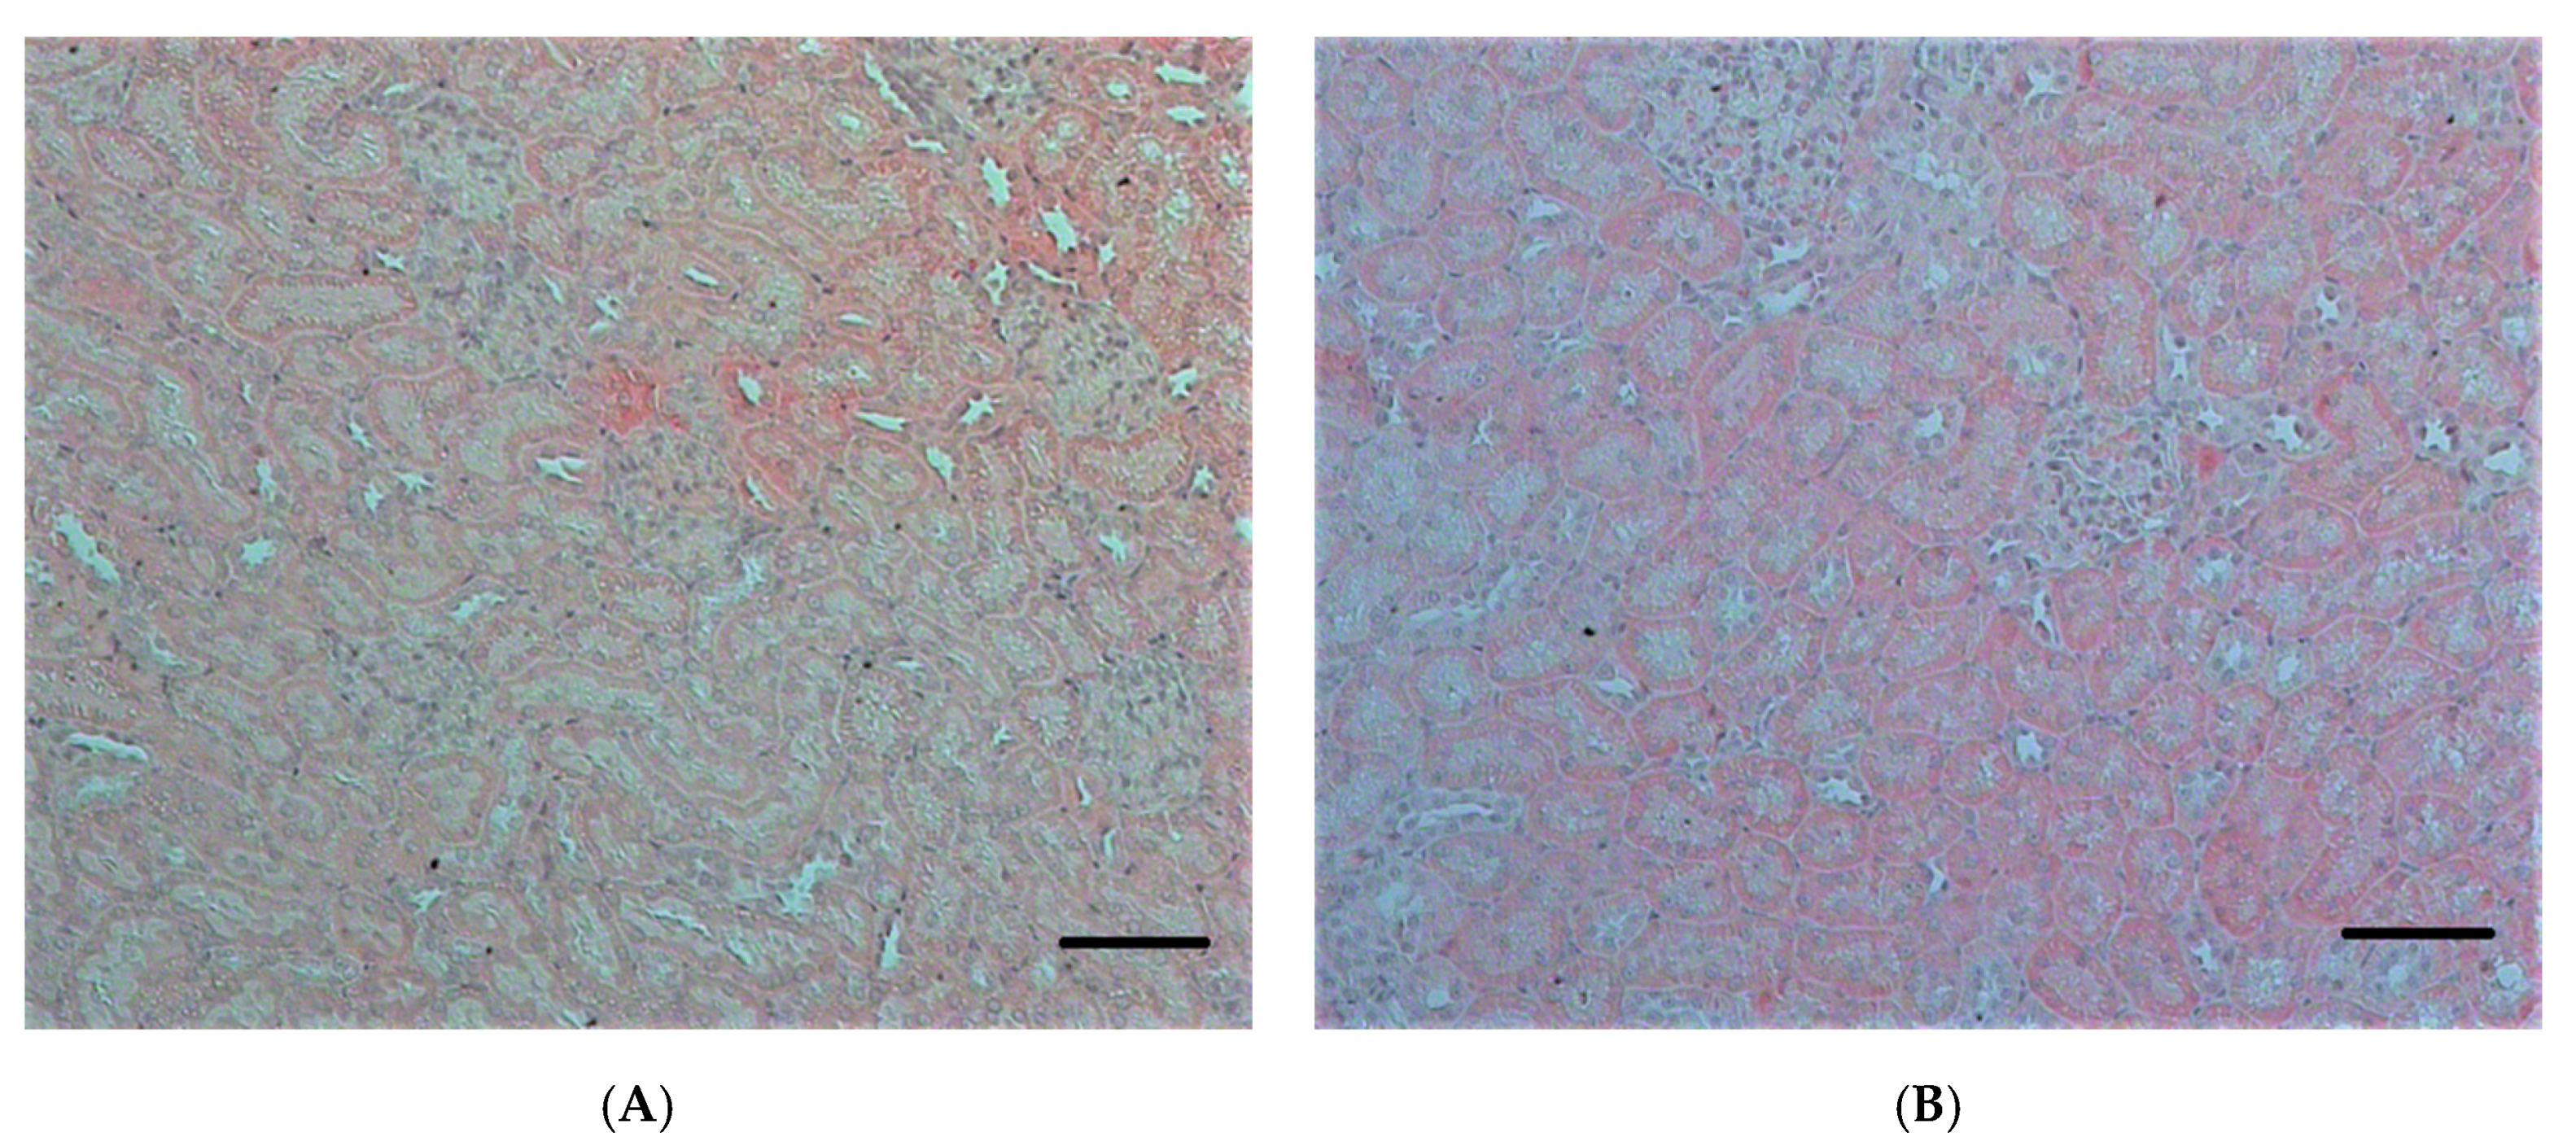
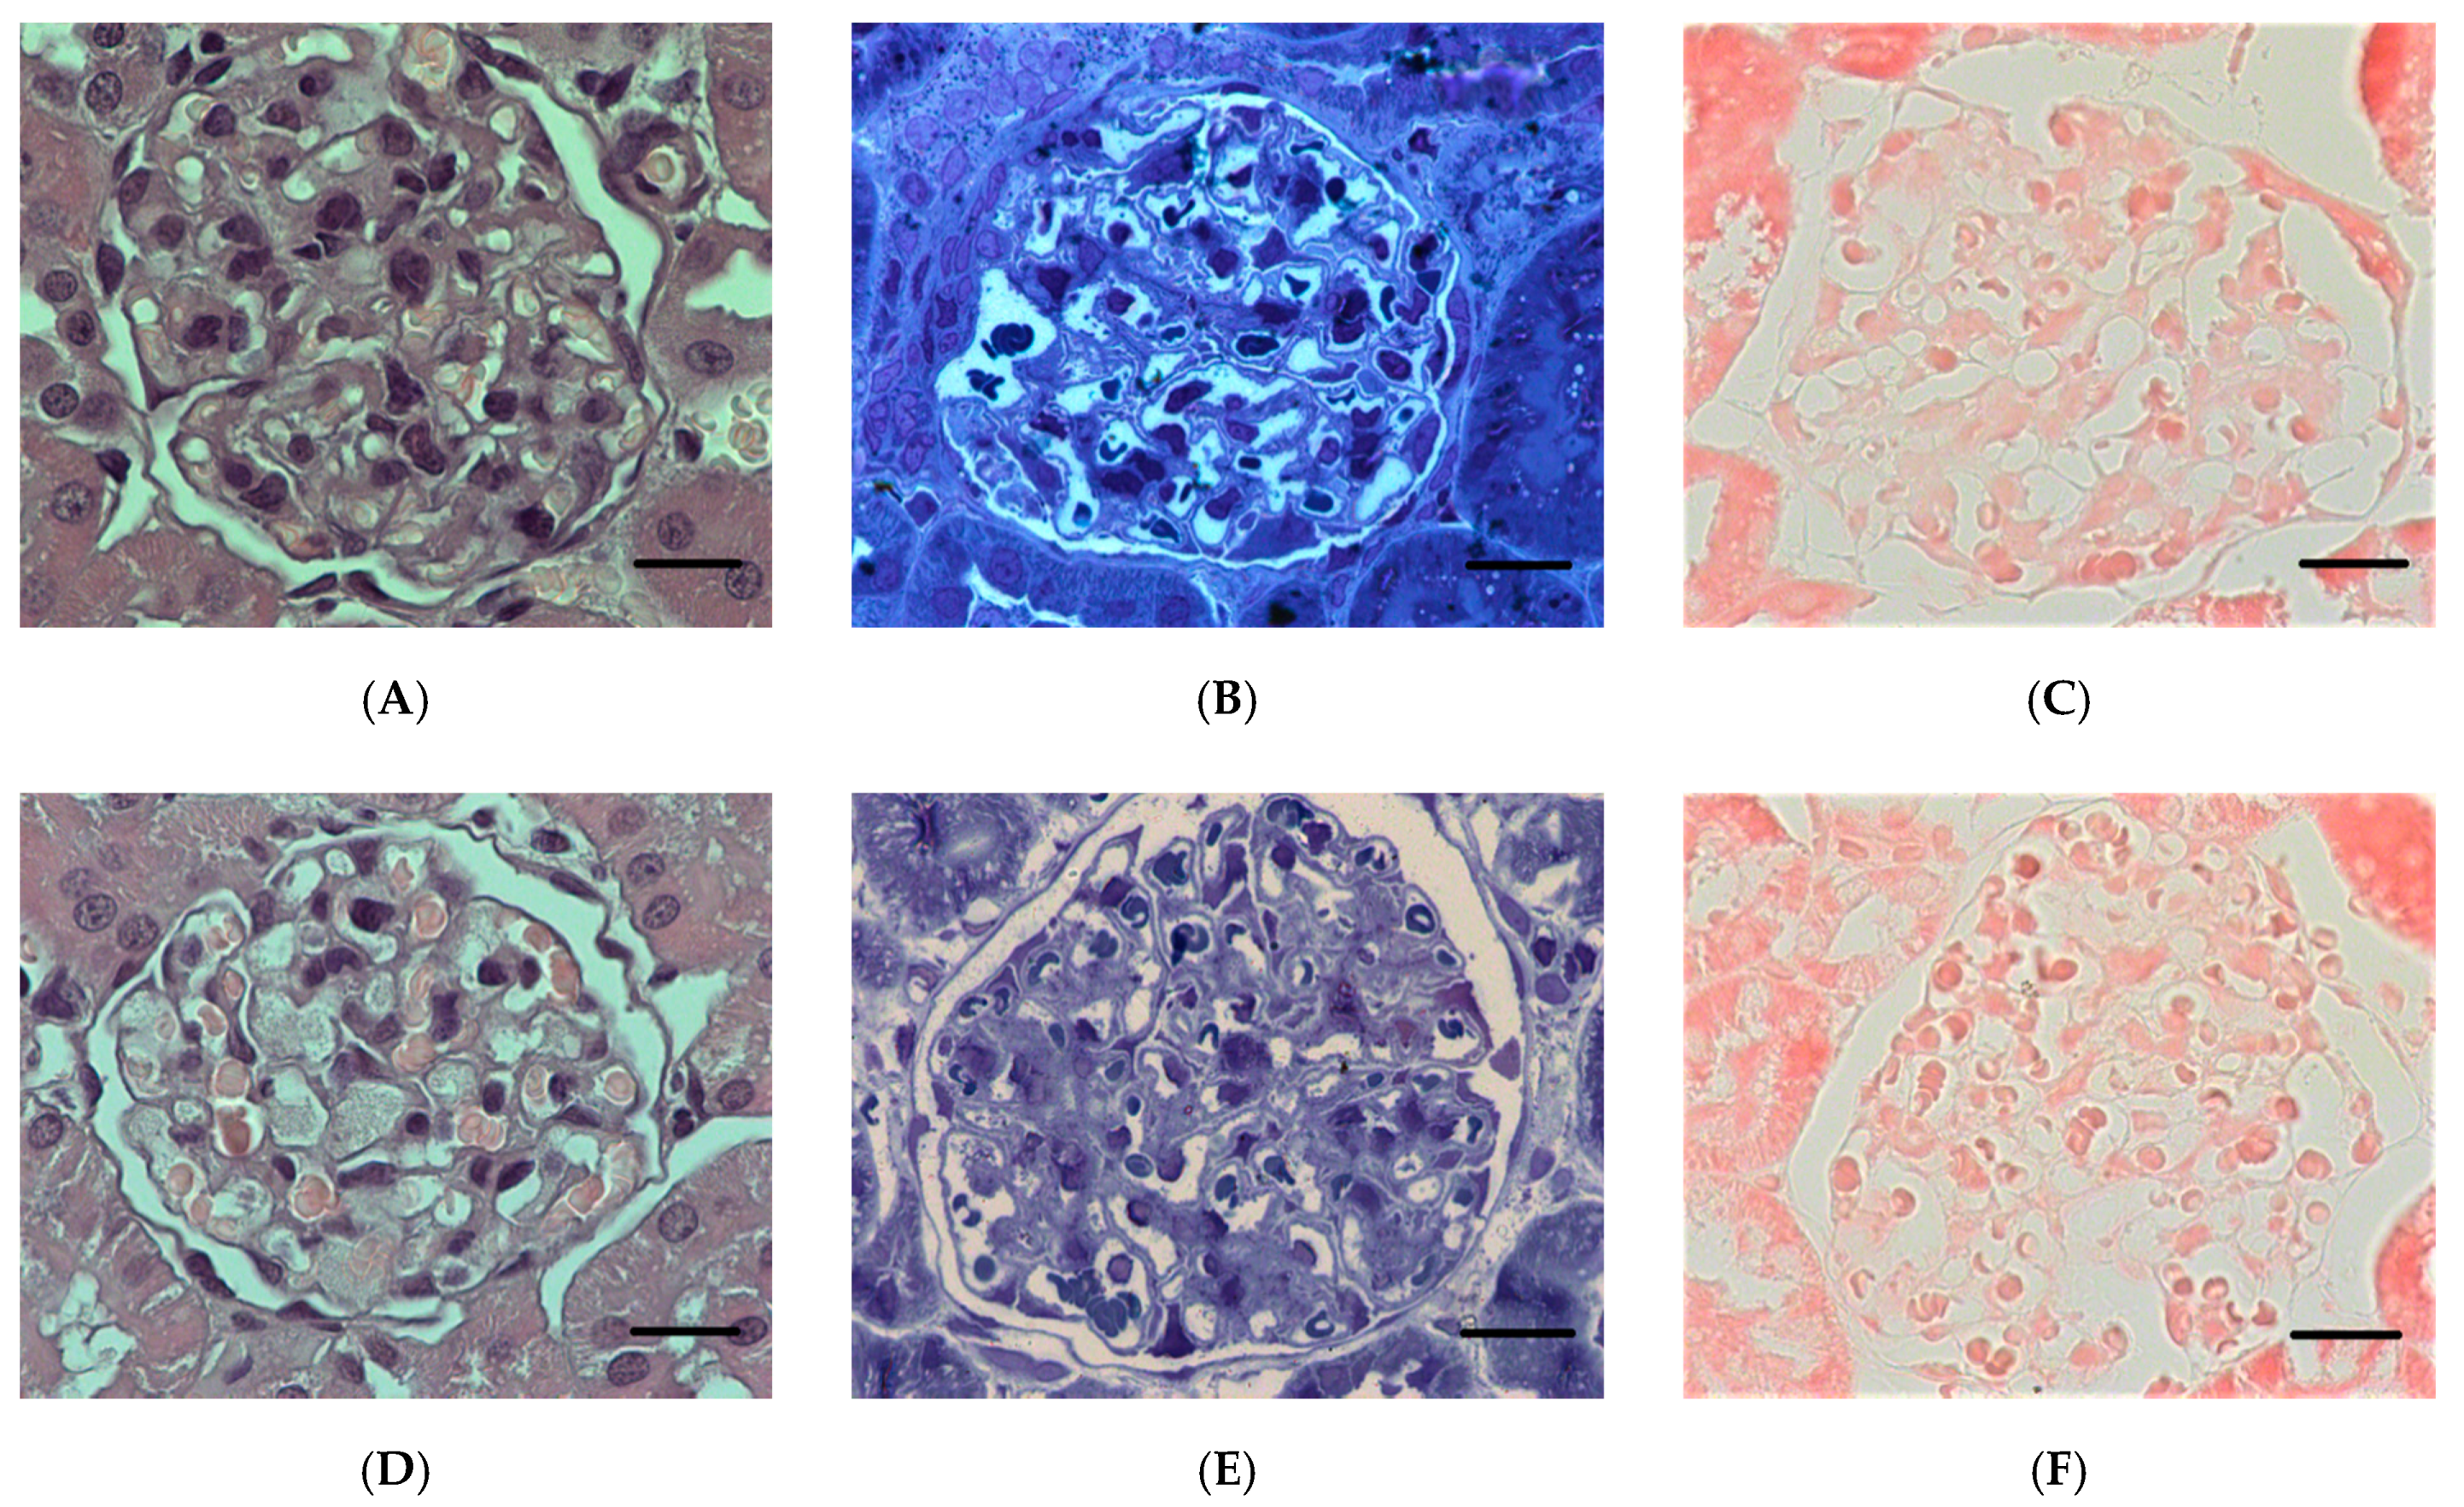
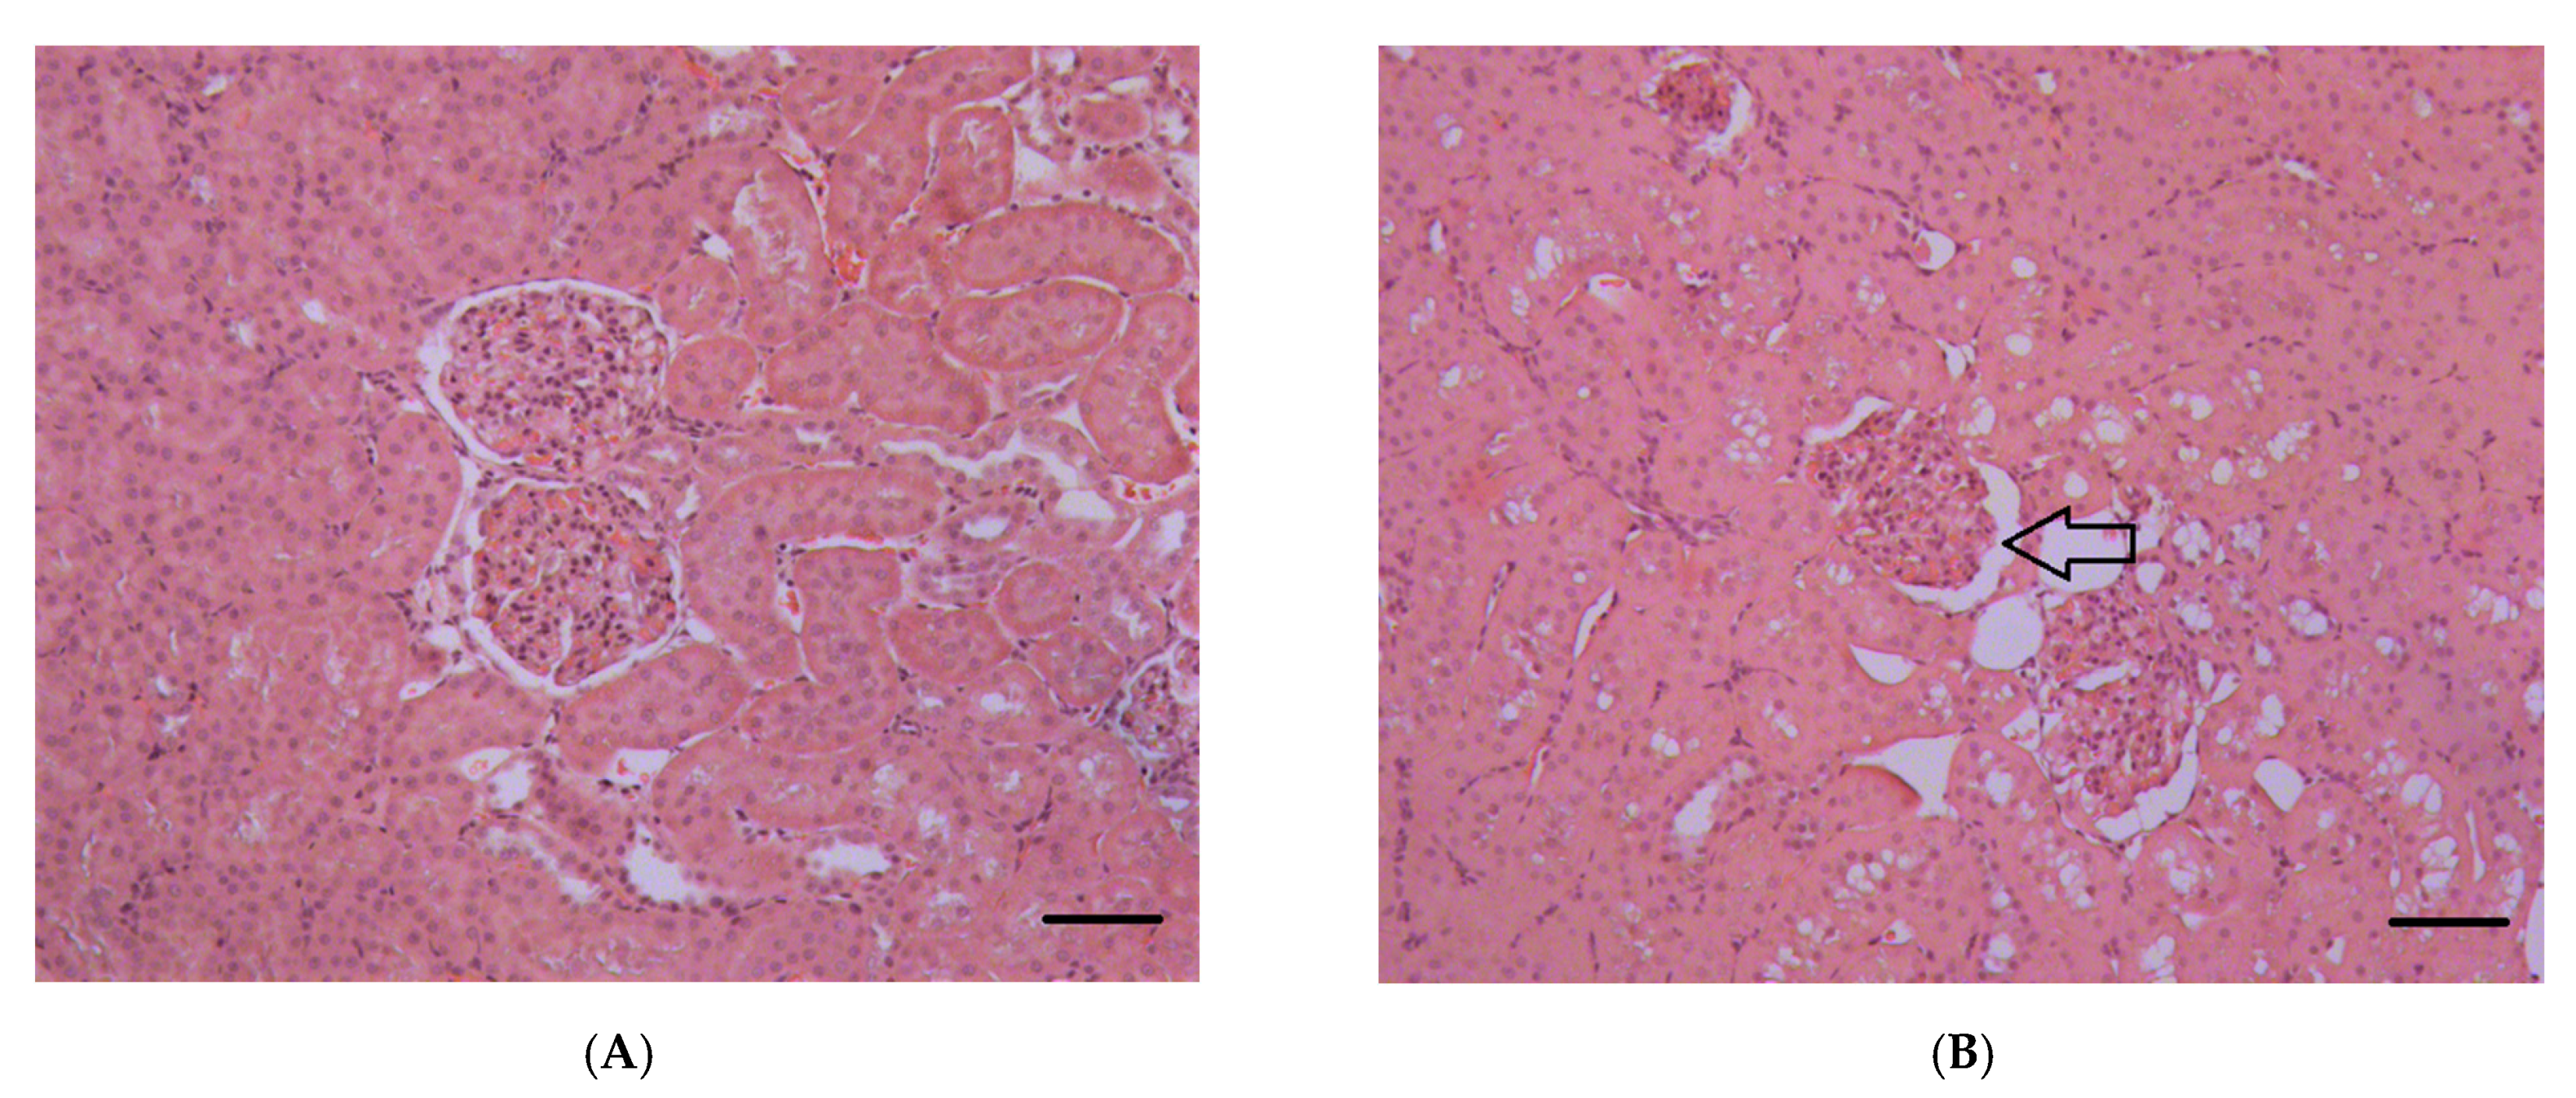
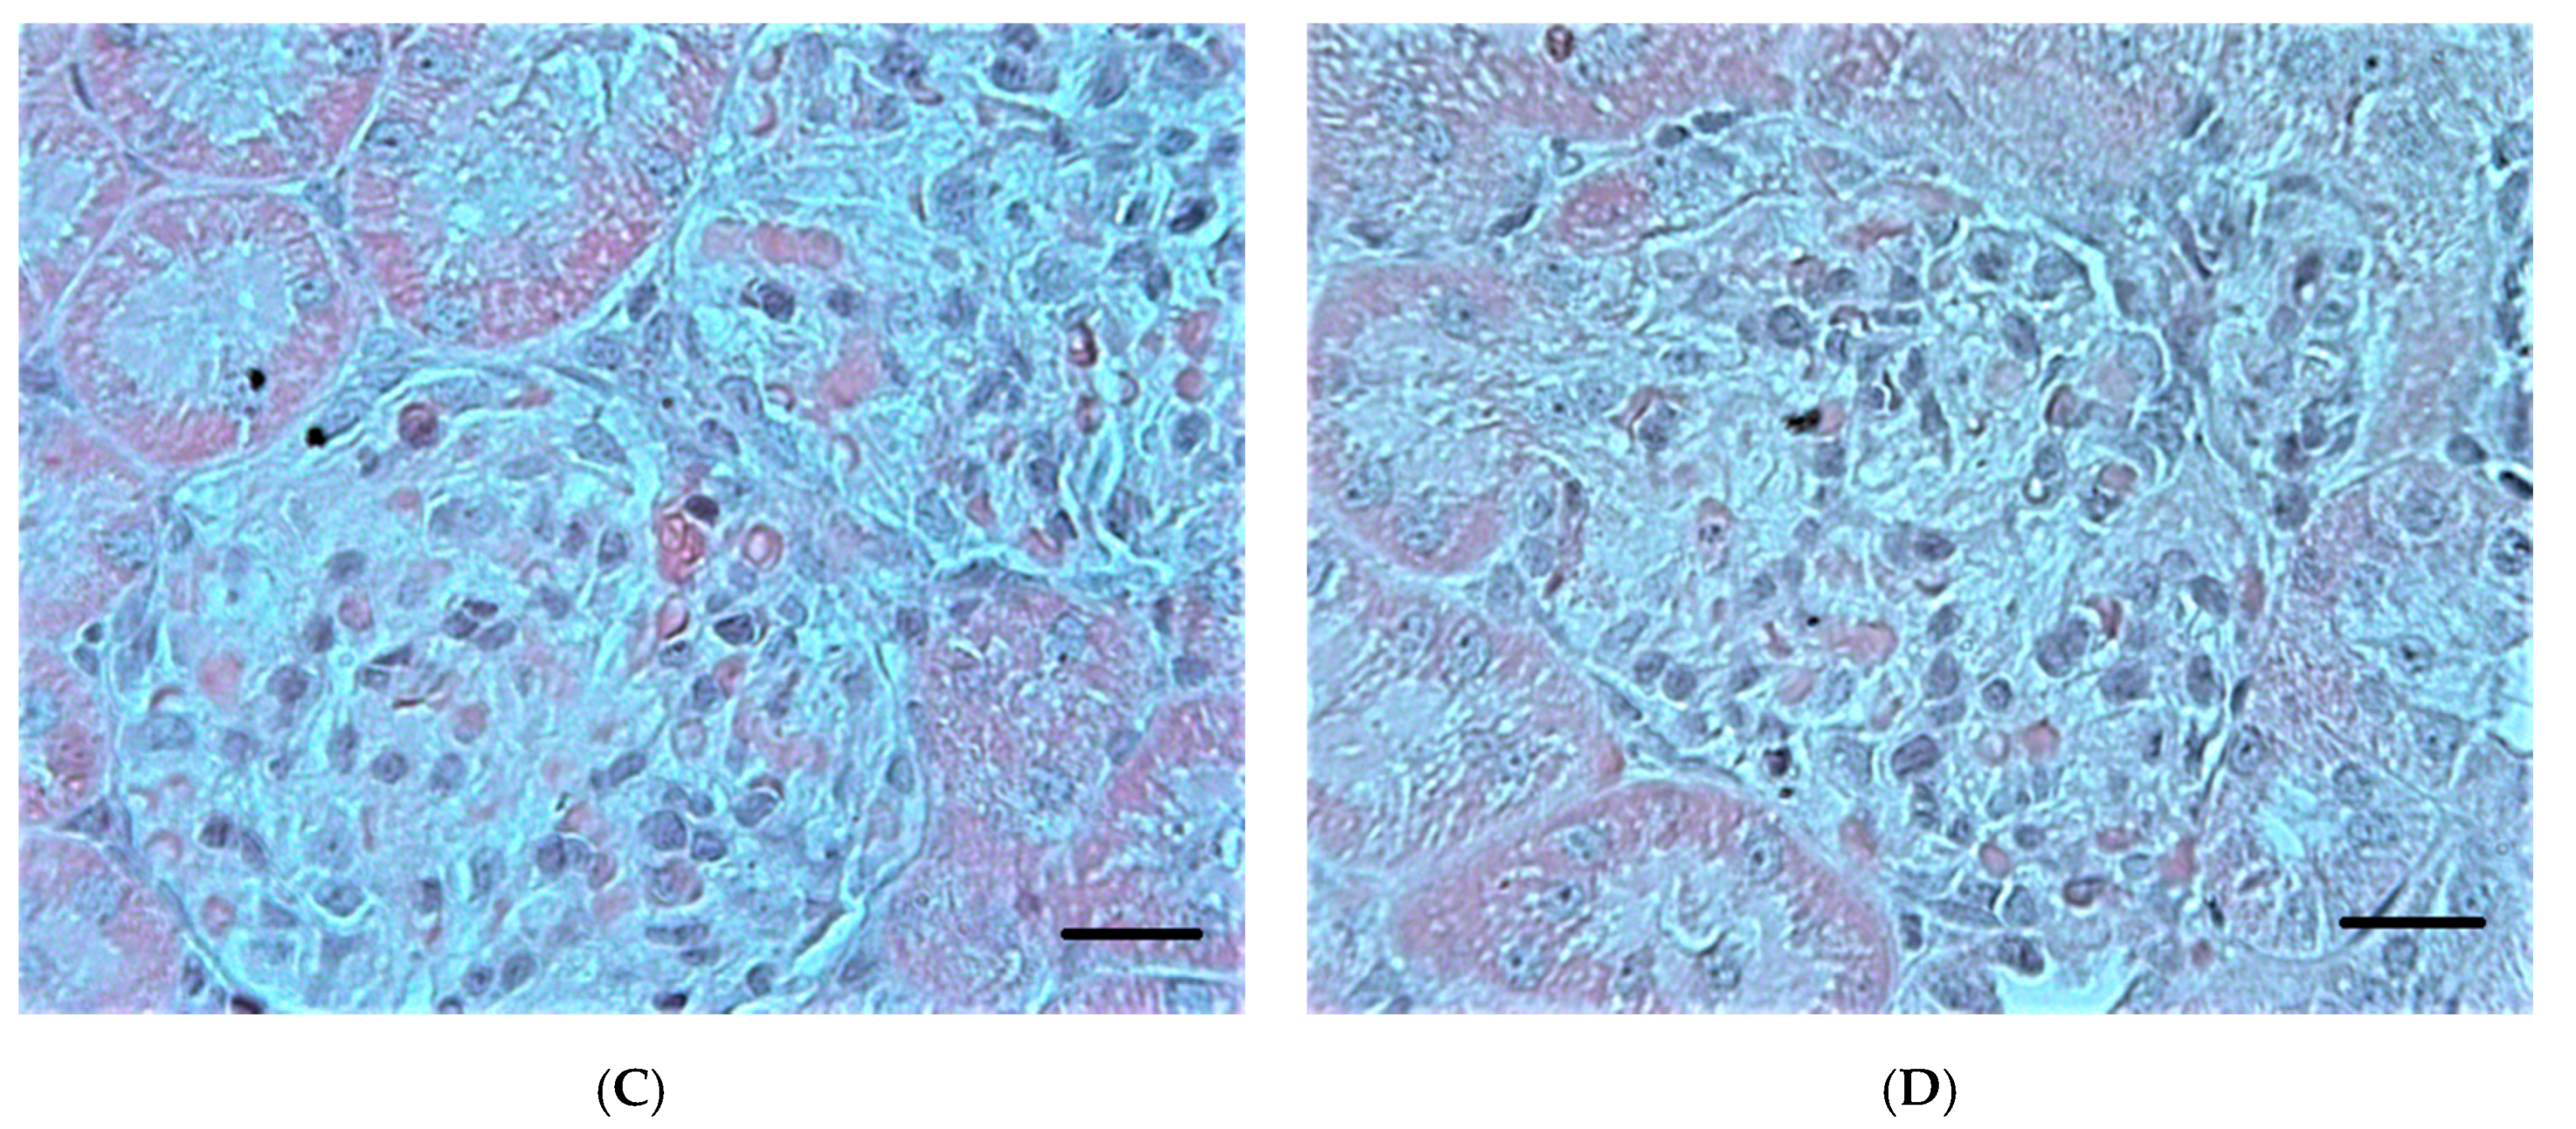
2.1.5. Histopathological Changes in the Kidneys
2.2. Paraoxon Nephrotoxicity in the M3 Model (without Prior Inhibition of Carboxylesterase Activity)
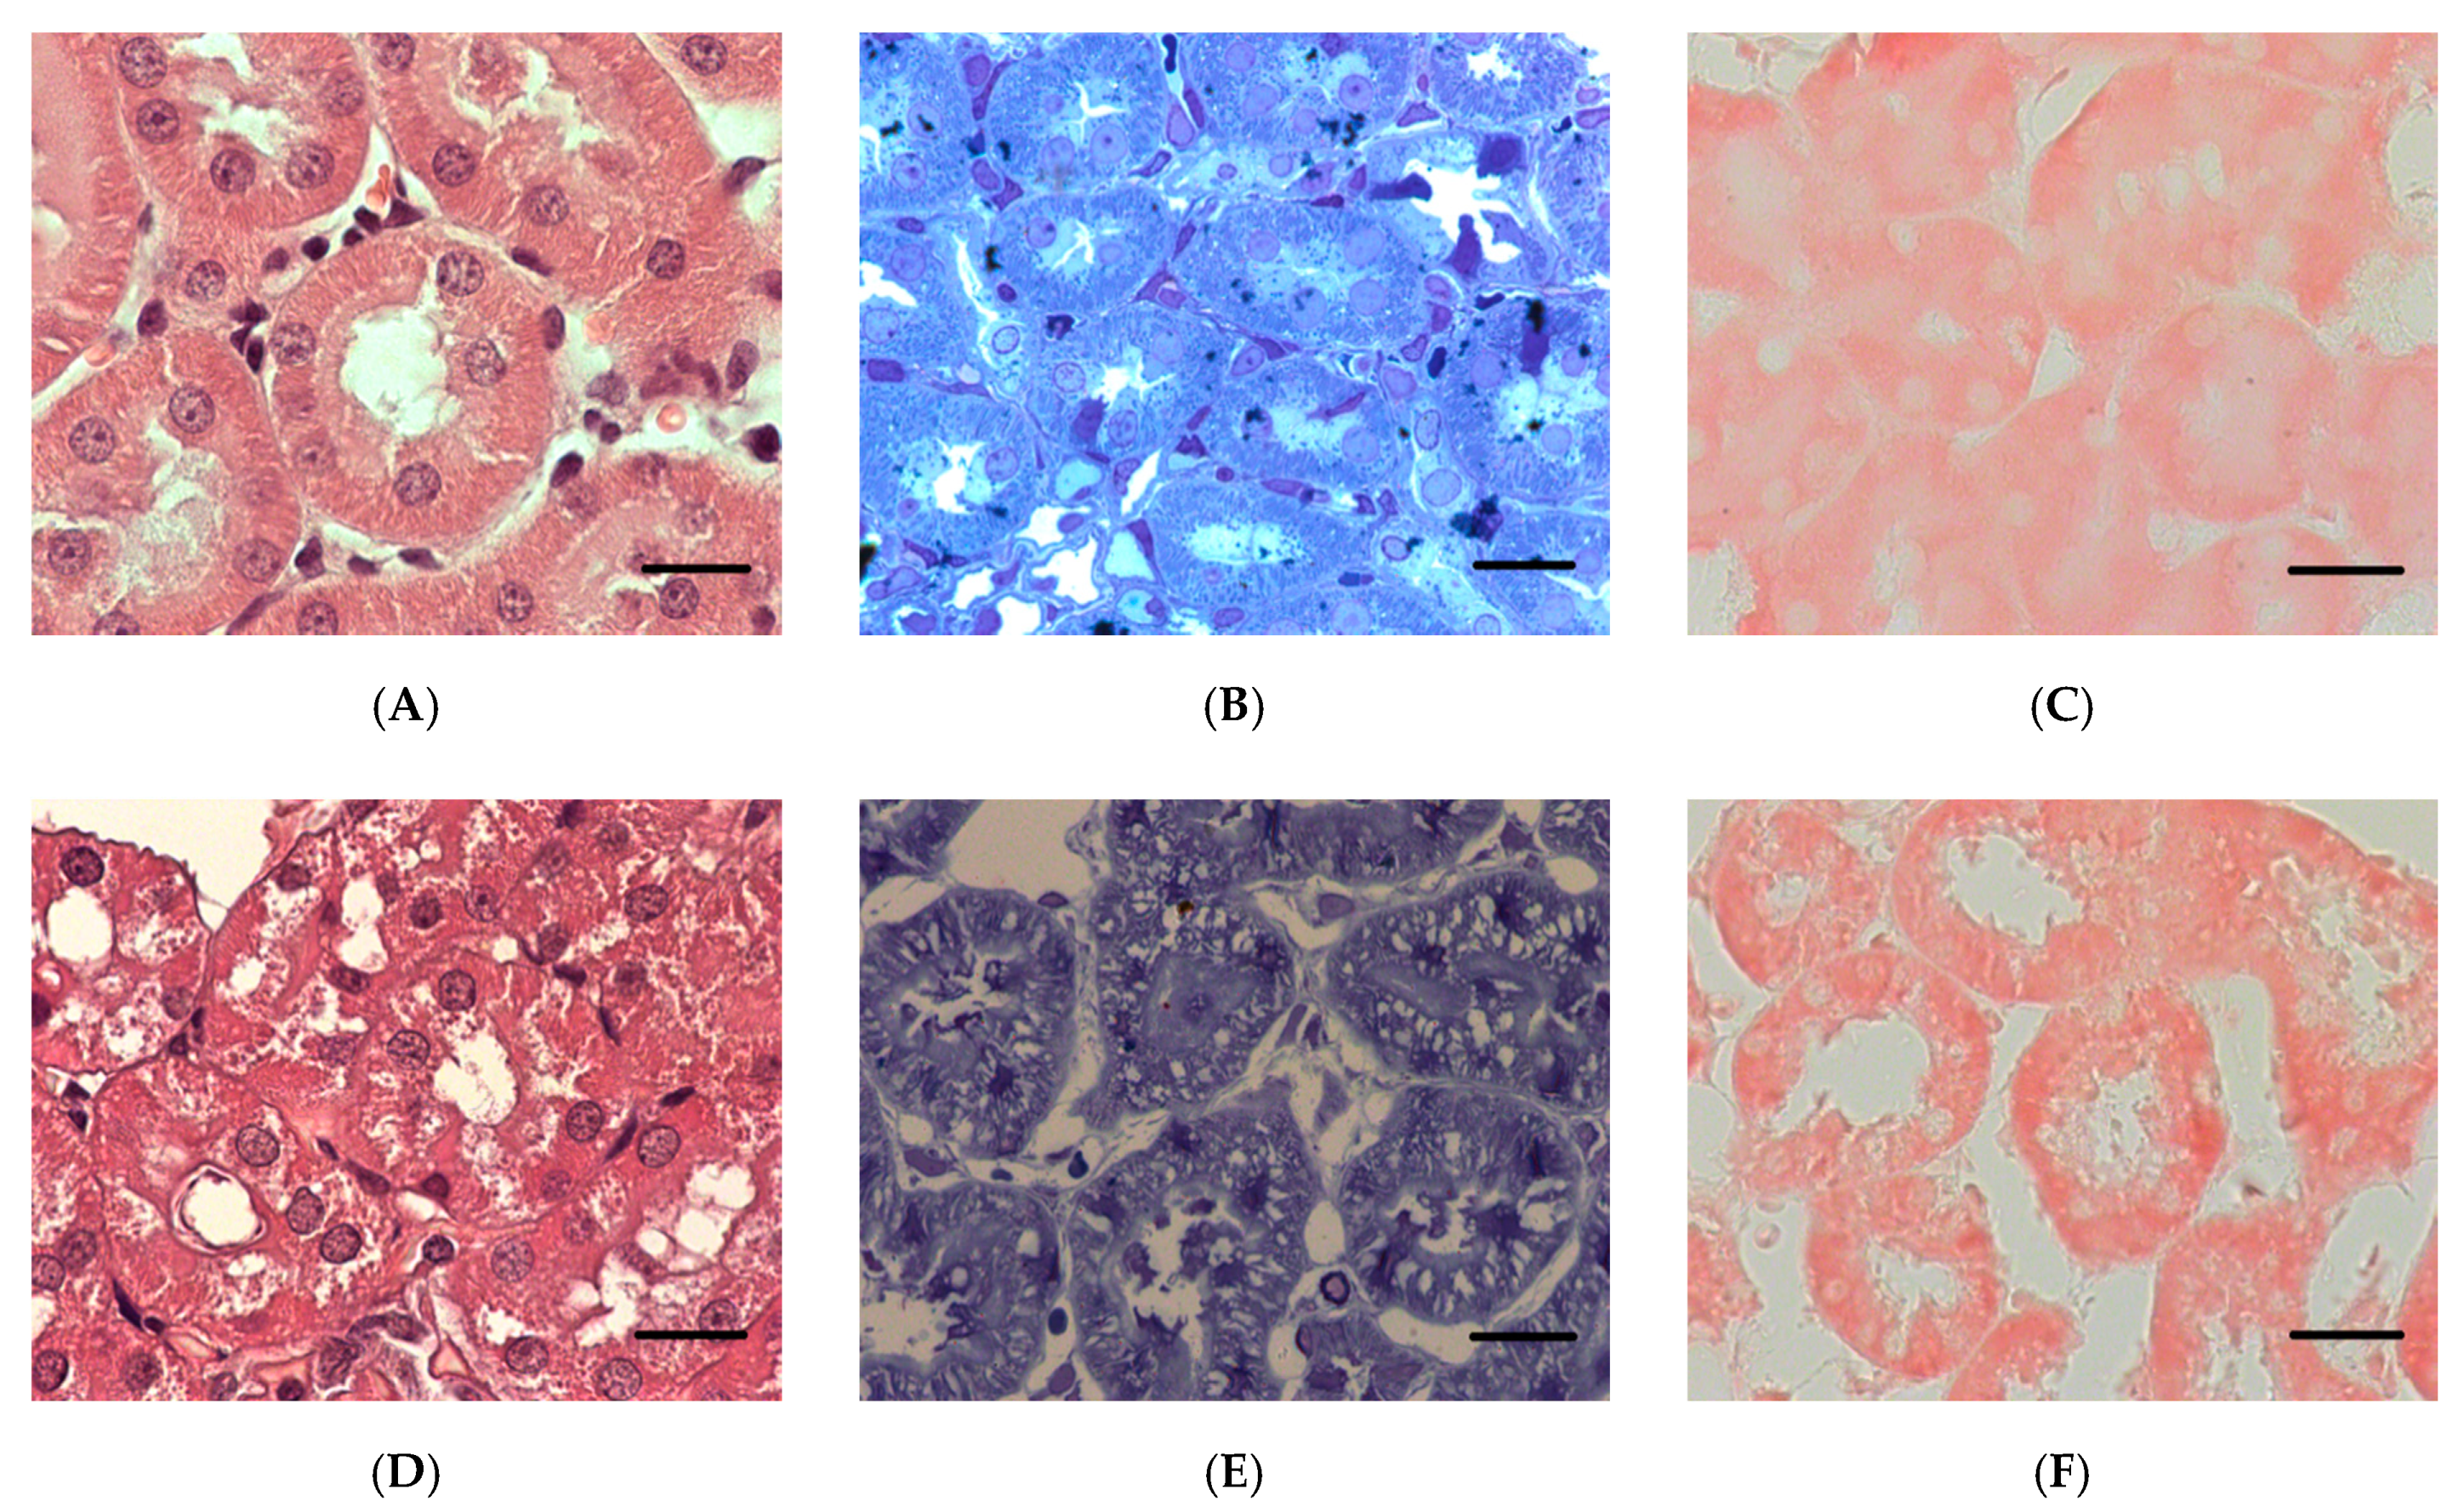
2.2.1. Histopathological Changes in Rat Kidneys after Exposure to POX
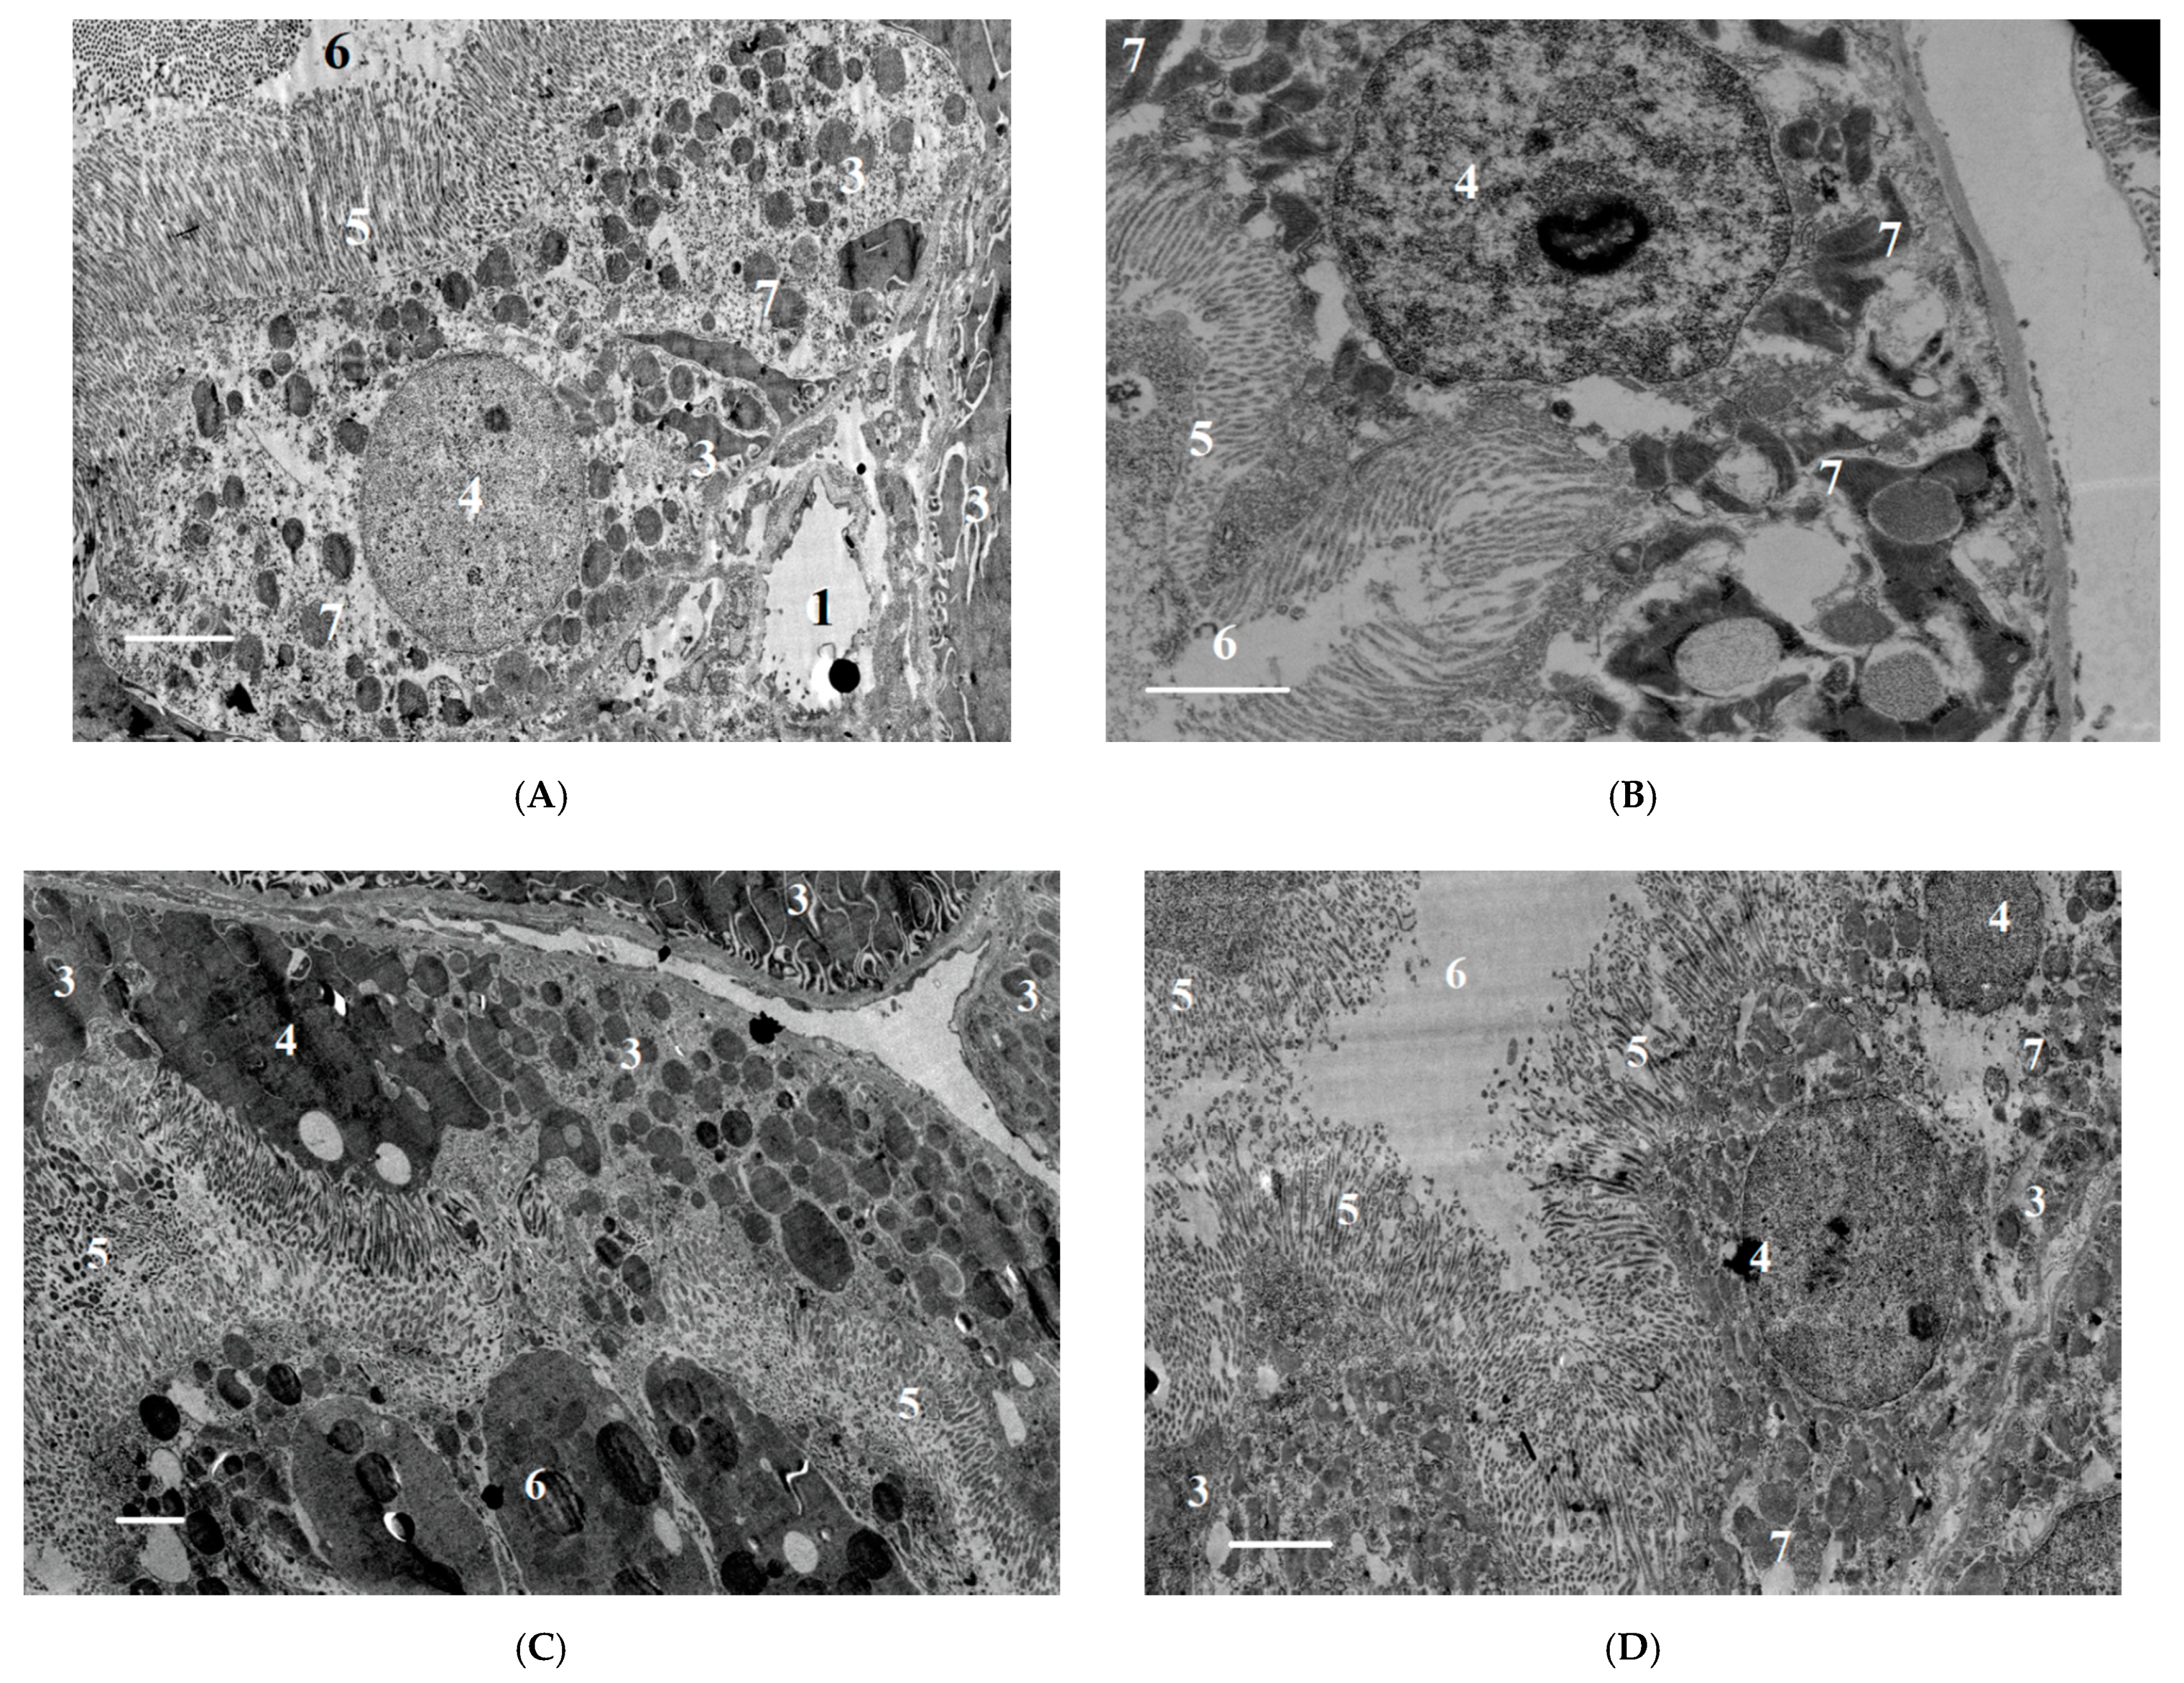
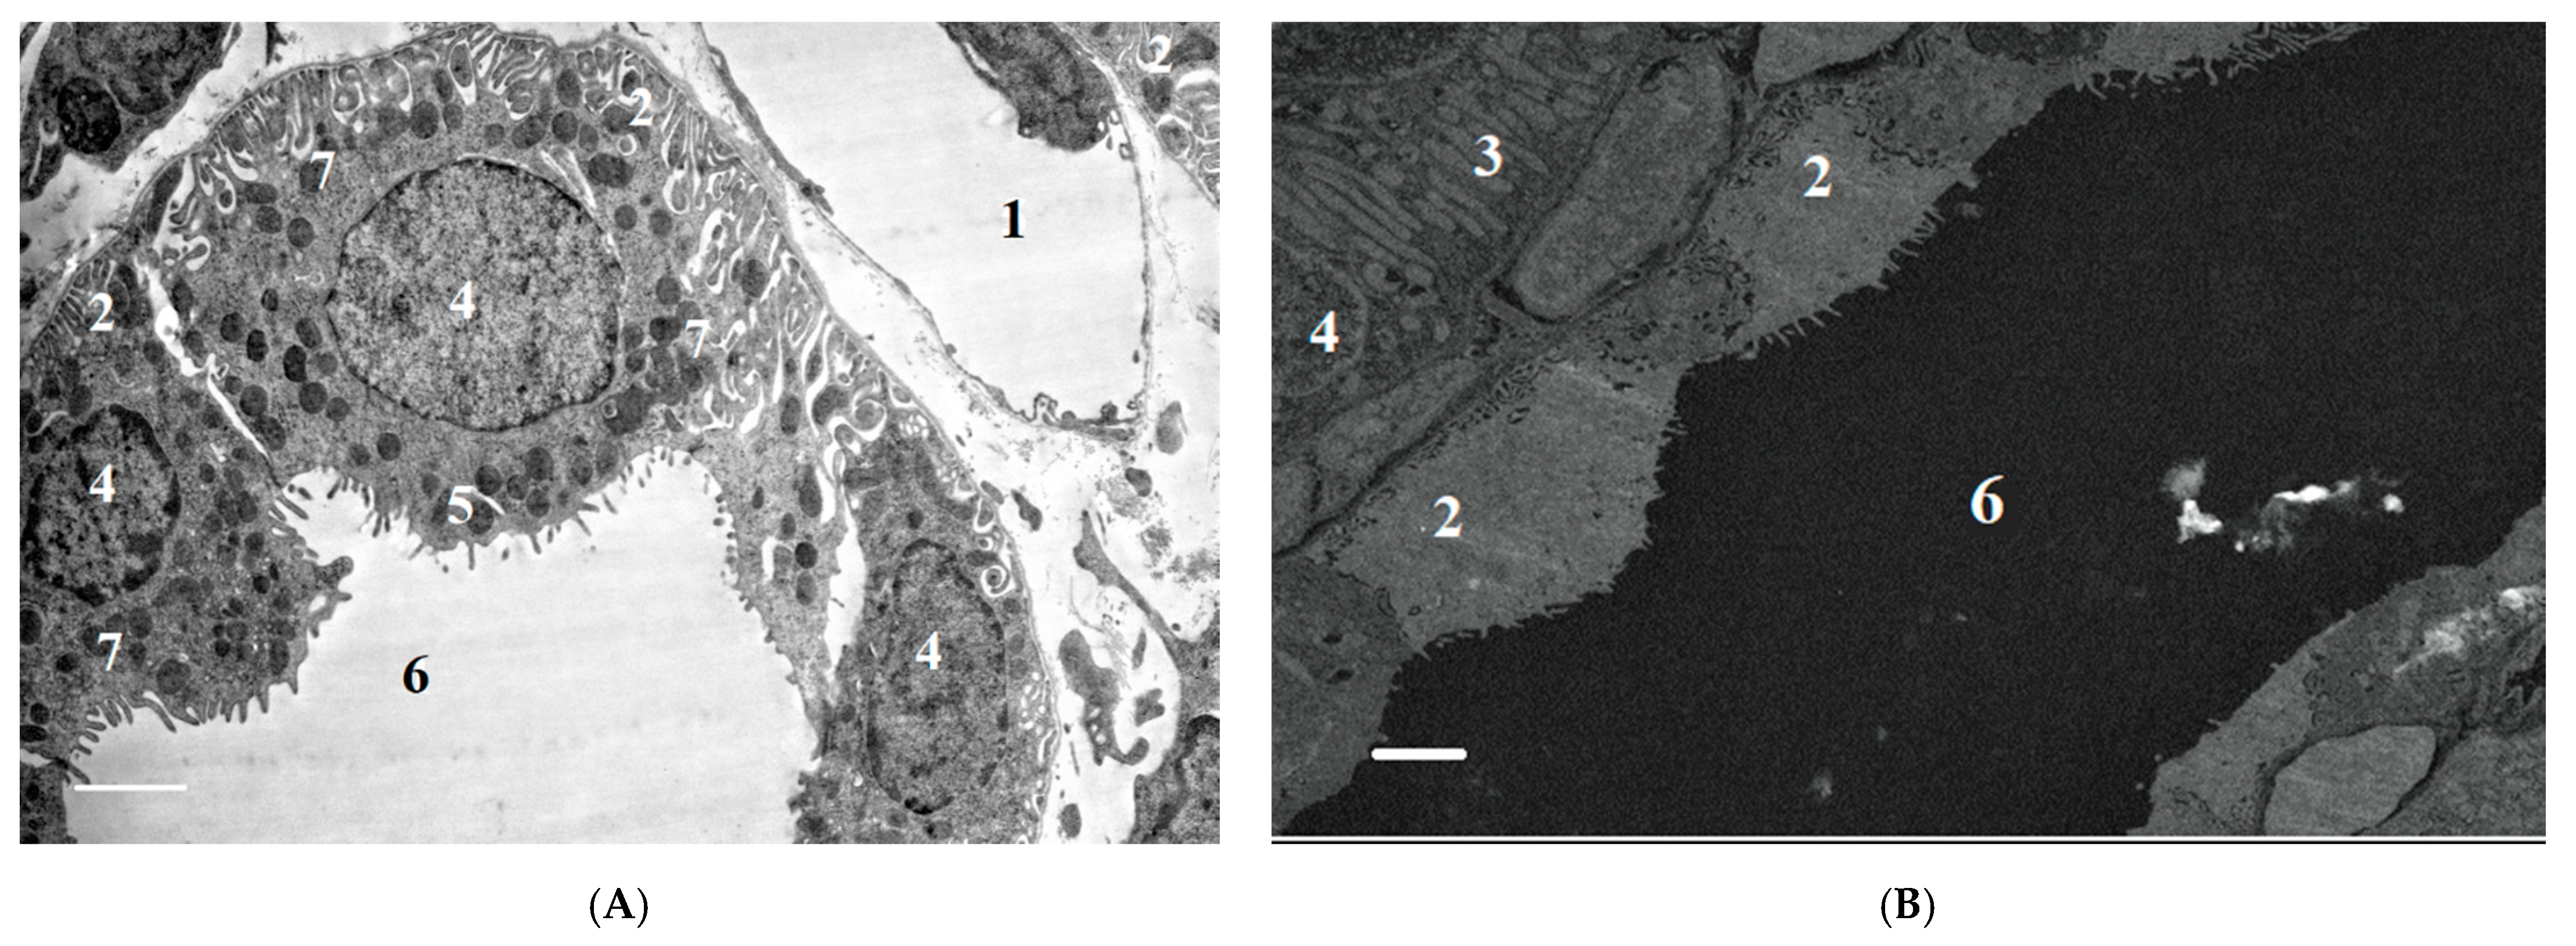
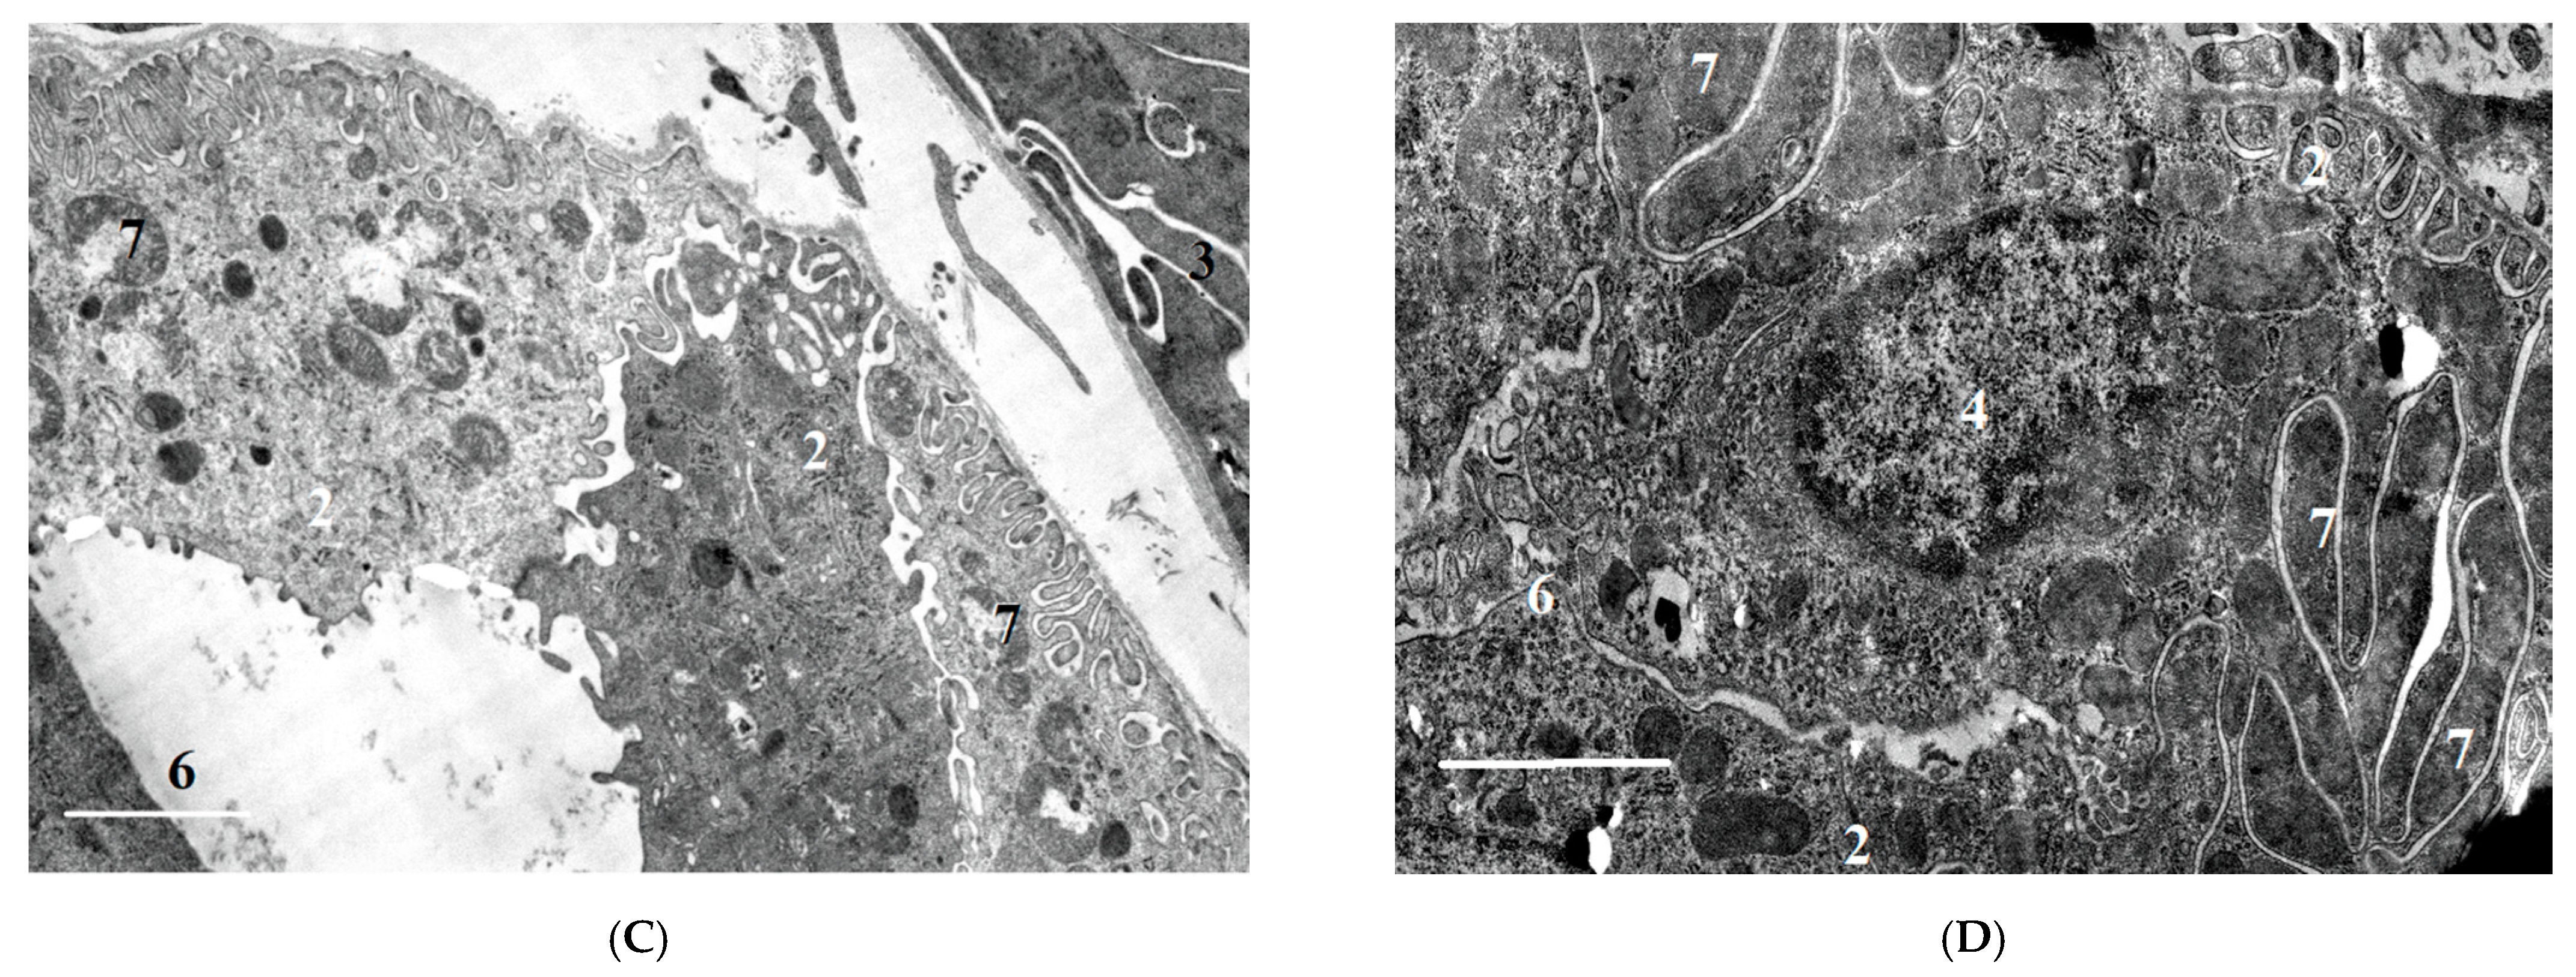
2.2.2. Ultrastructural Changes in Rat Kidneys after the Poisoning
3. Discussion
3.1. Putative Pathophysiological Mechanisms of OPs Nephrotoxicity
3.2. Biochemical Aspects of POX Nephrotoxicity
3.3. Urinalysis after POX Poisoning
3.4. Biomarkers of Kidney Injury
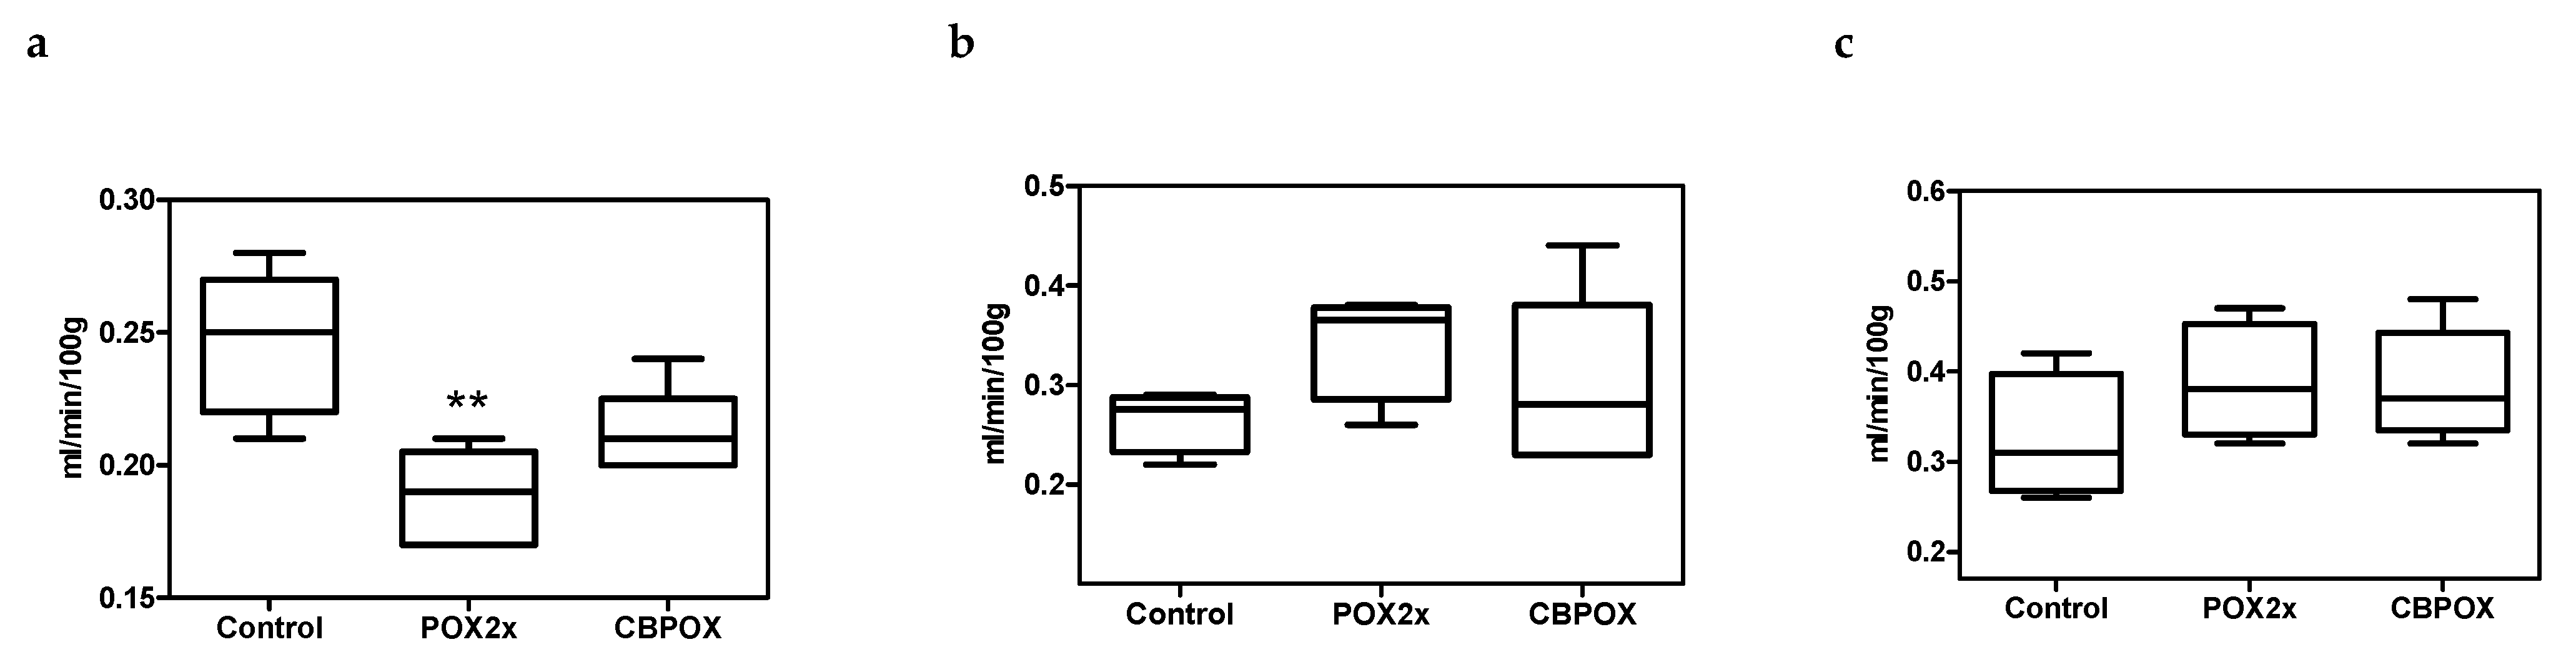
3.5. Creatinine Clearance in Rats after Exposure to POX
3.6. Chondroitin Sulfate (CS) in Rat Urine after Exposure to POX
3.7. Histopathological and Ultrastructural Changes in Rat Kidneys after Exposure to POX
4. Materials and Methods
4.1. Animals
4.2. Chemicals
4.3. Three Models of Acute Intoxication of Rats by Exposure to Paraoxon
4.3.1. Models 1 and 2 (M1/2). Acute Toxicity with Specific and Non-Specific Inhibition of Carboxylesterase Activity
4.3.2. Two Principles Were Used to Inhibit Carboxylesterase Activity (M1 and M2 Models)
4.3.3. Model 3 (M3). Acute Toxicity without Prior Inhibition of Carboxylesterase Activity
4.4. Animal Observations and Sampling
4.5. Biochemical Parameters of Blood Plasma
4.6. Urinalysis, Urine Biochemistry and Biomarkers of Renal Injury
4.7. Endogenous Creatinine Clearance
4.8. Histology, Immunohistochemistry (IHC) and Transmission Electron Microscopy (TEM)
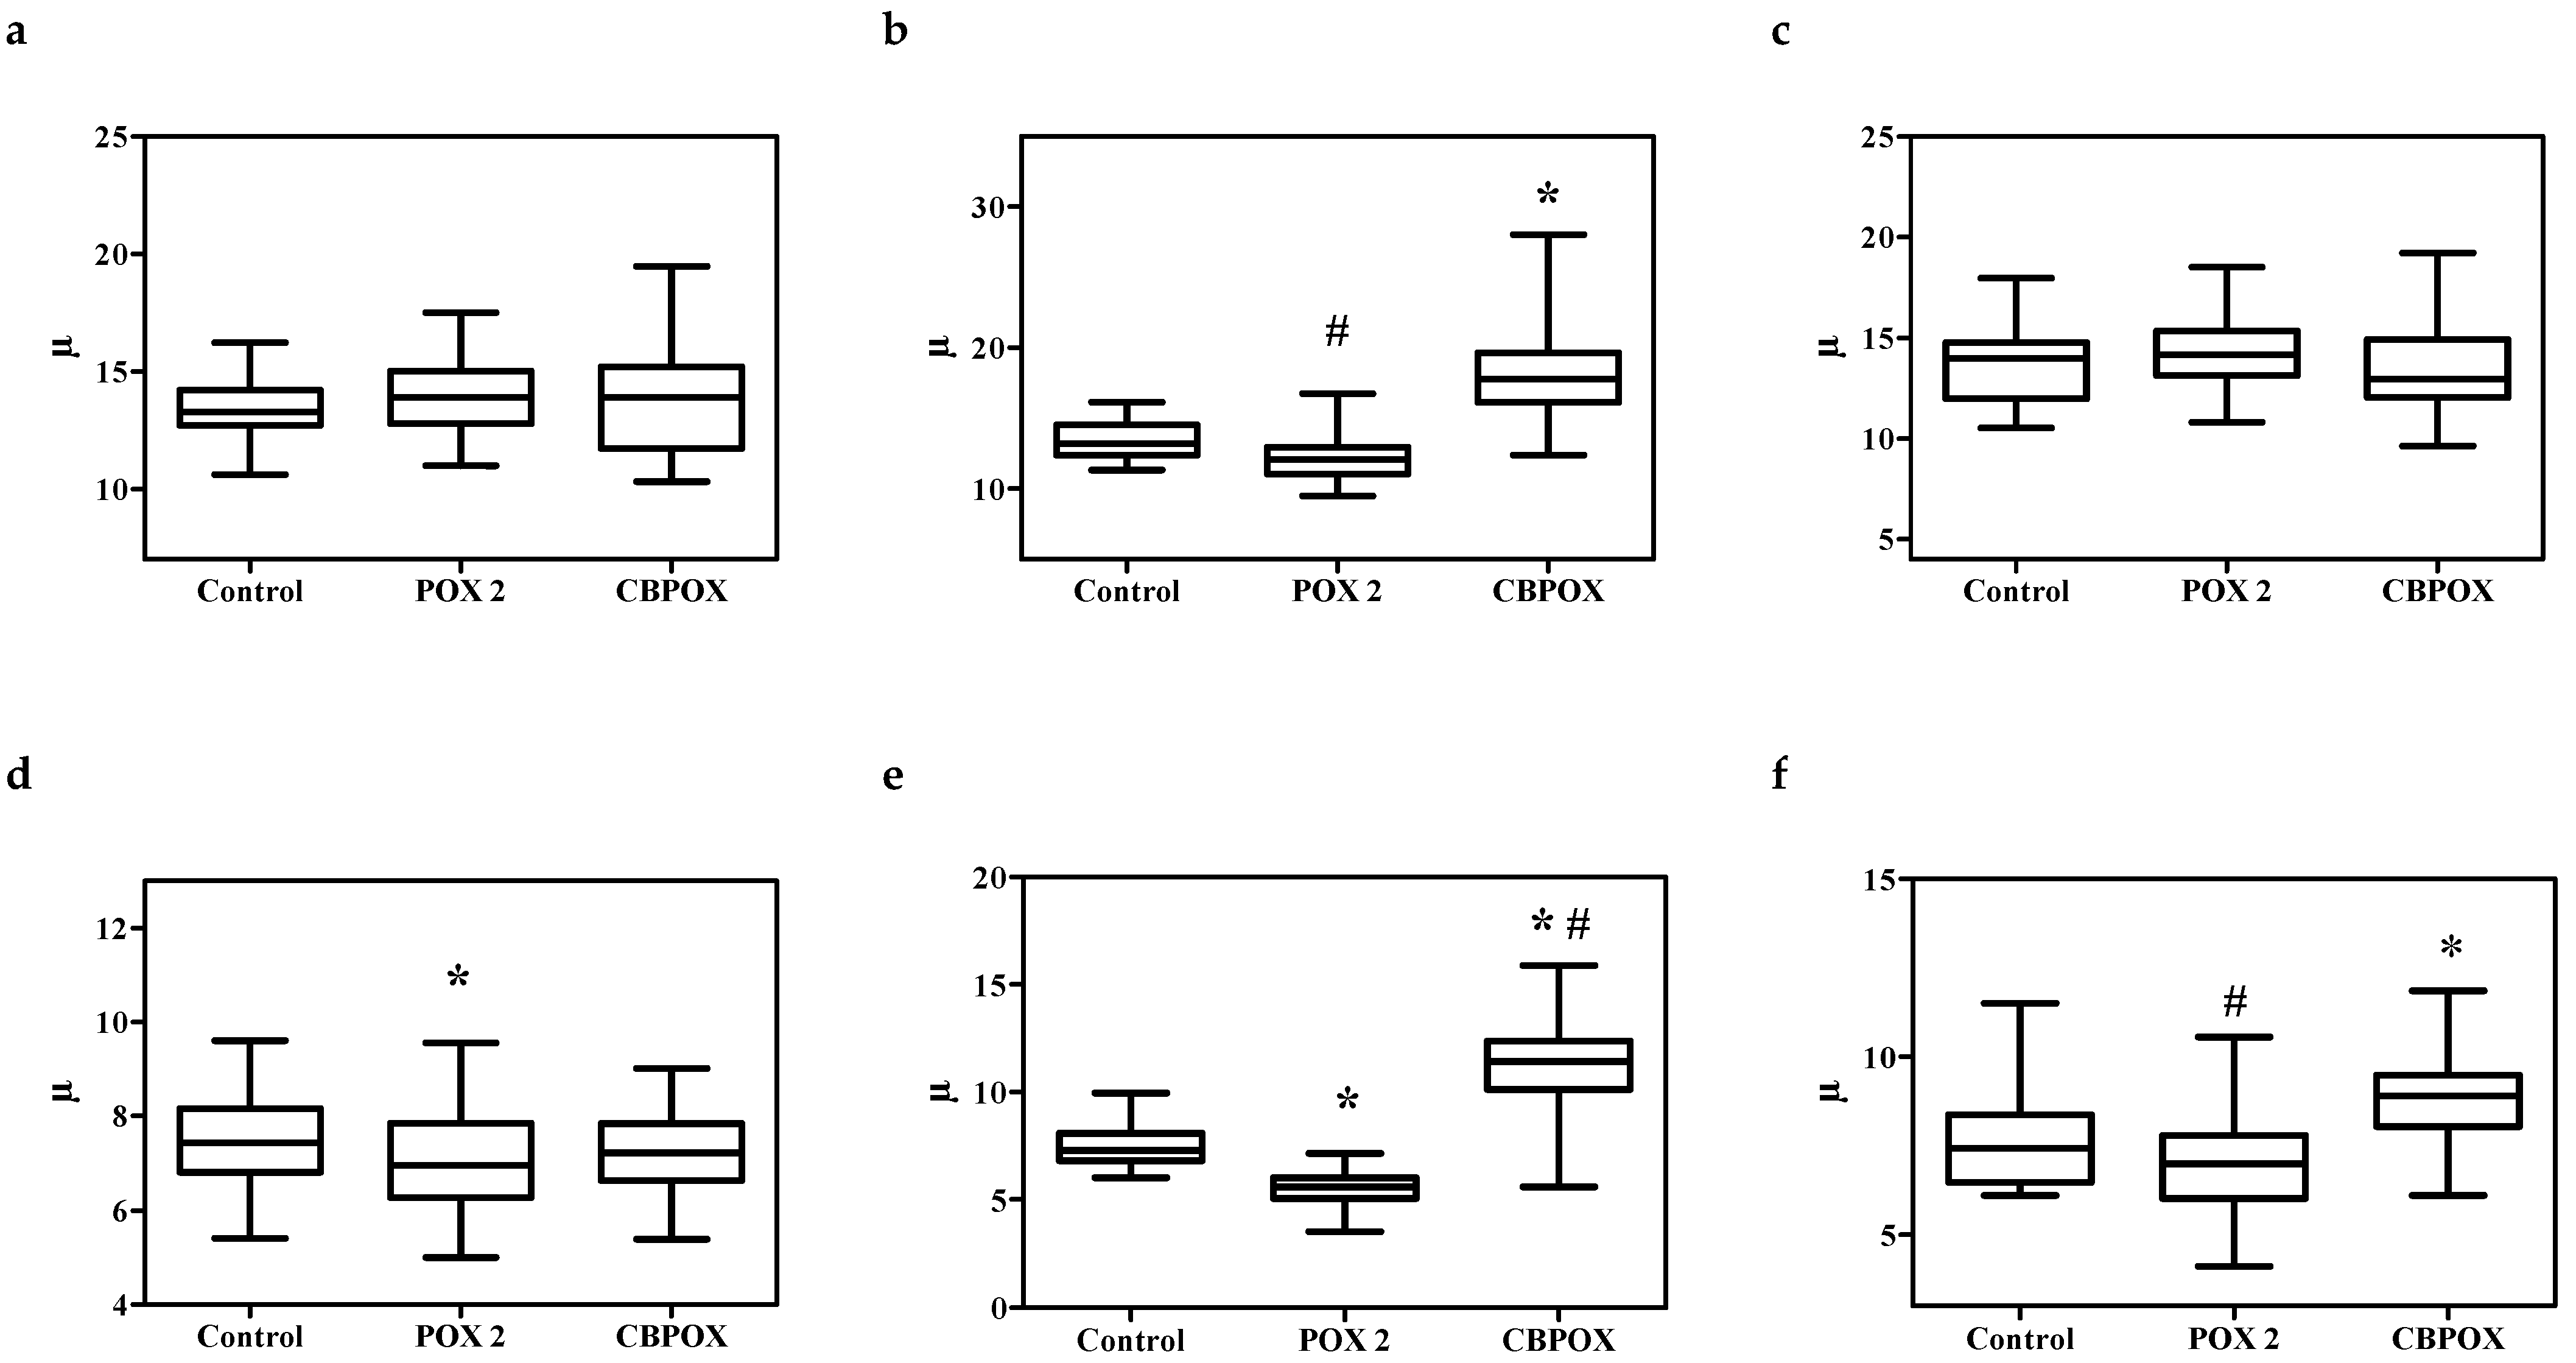
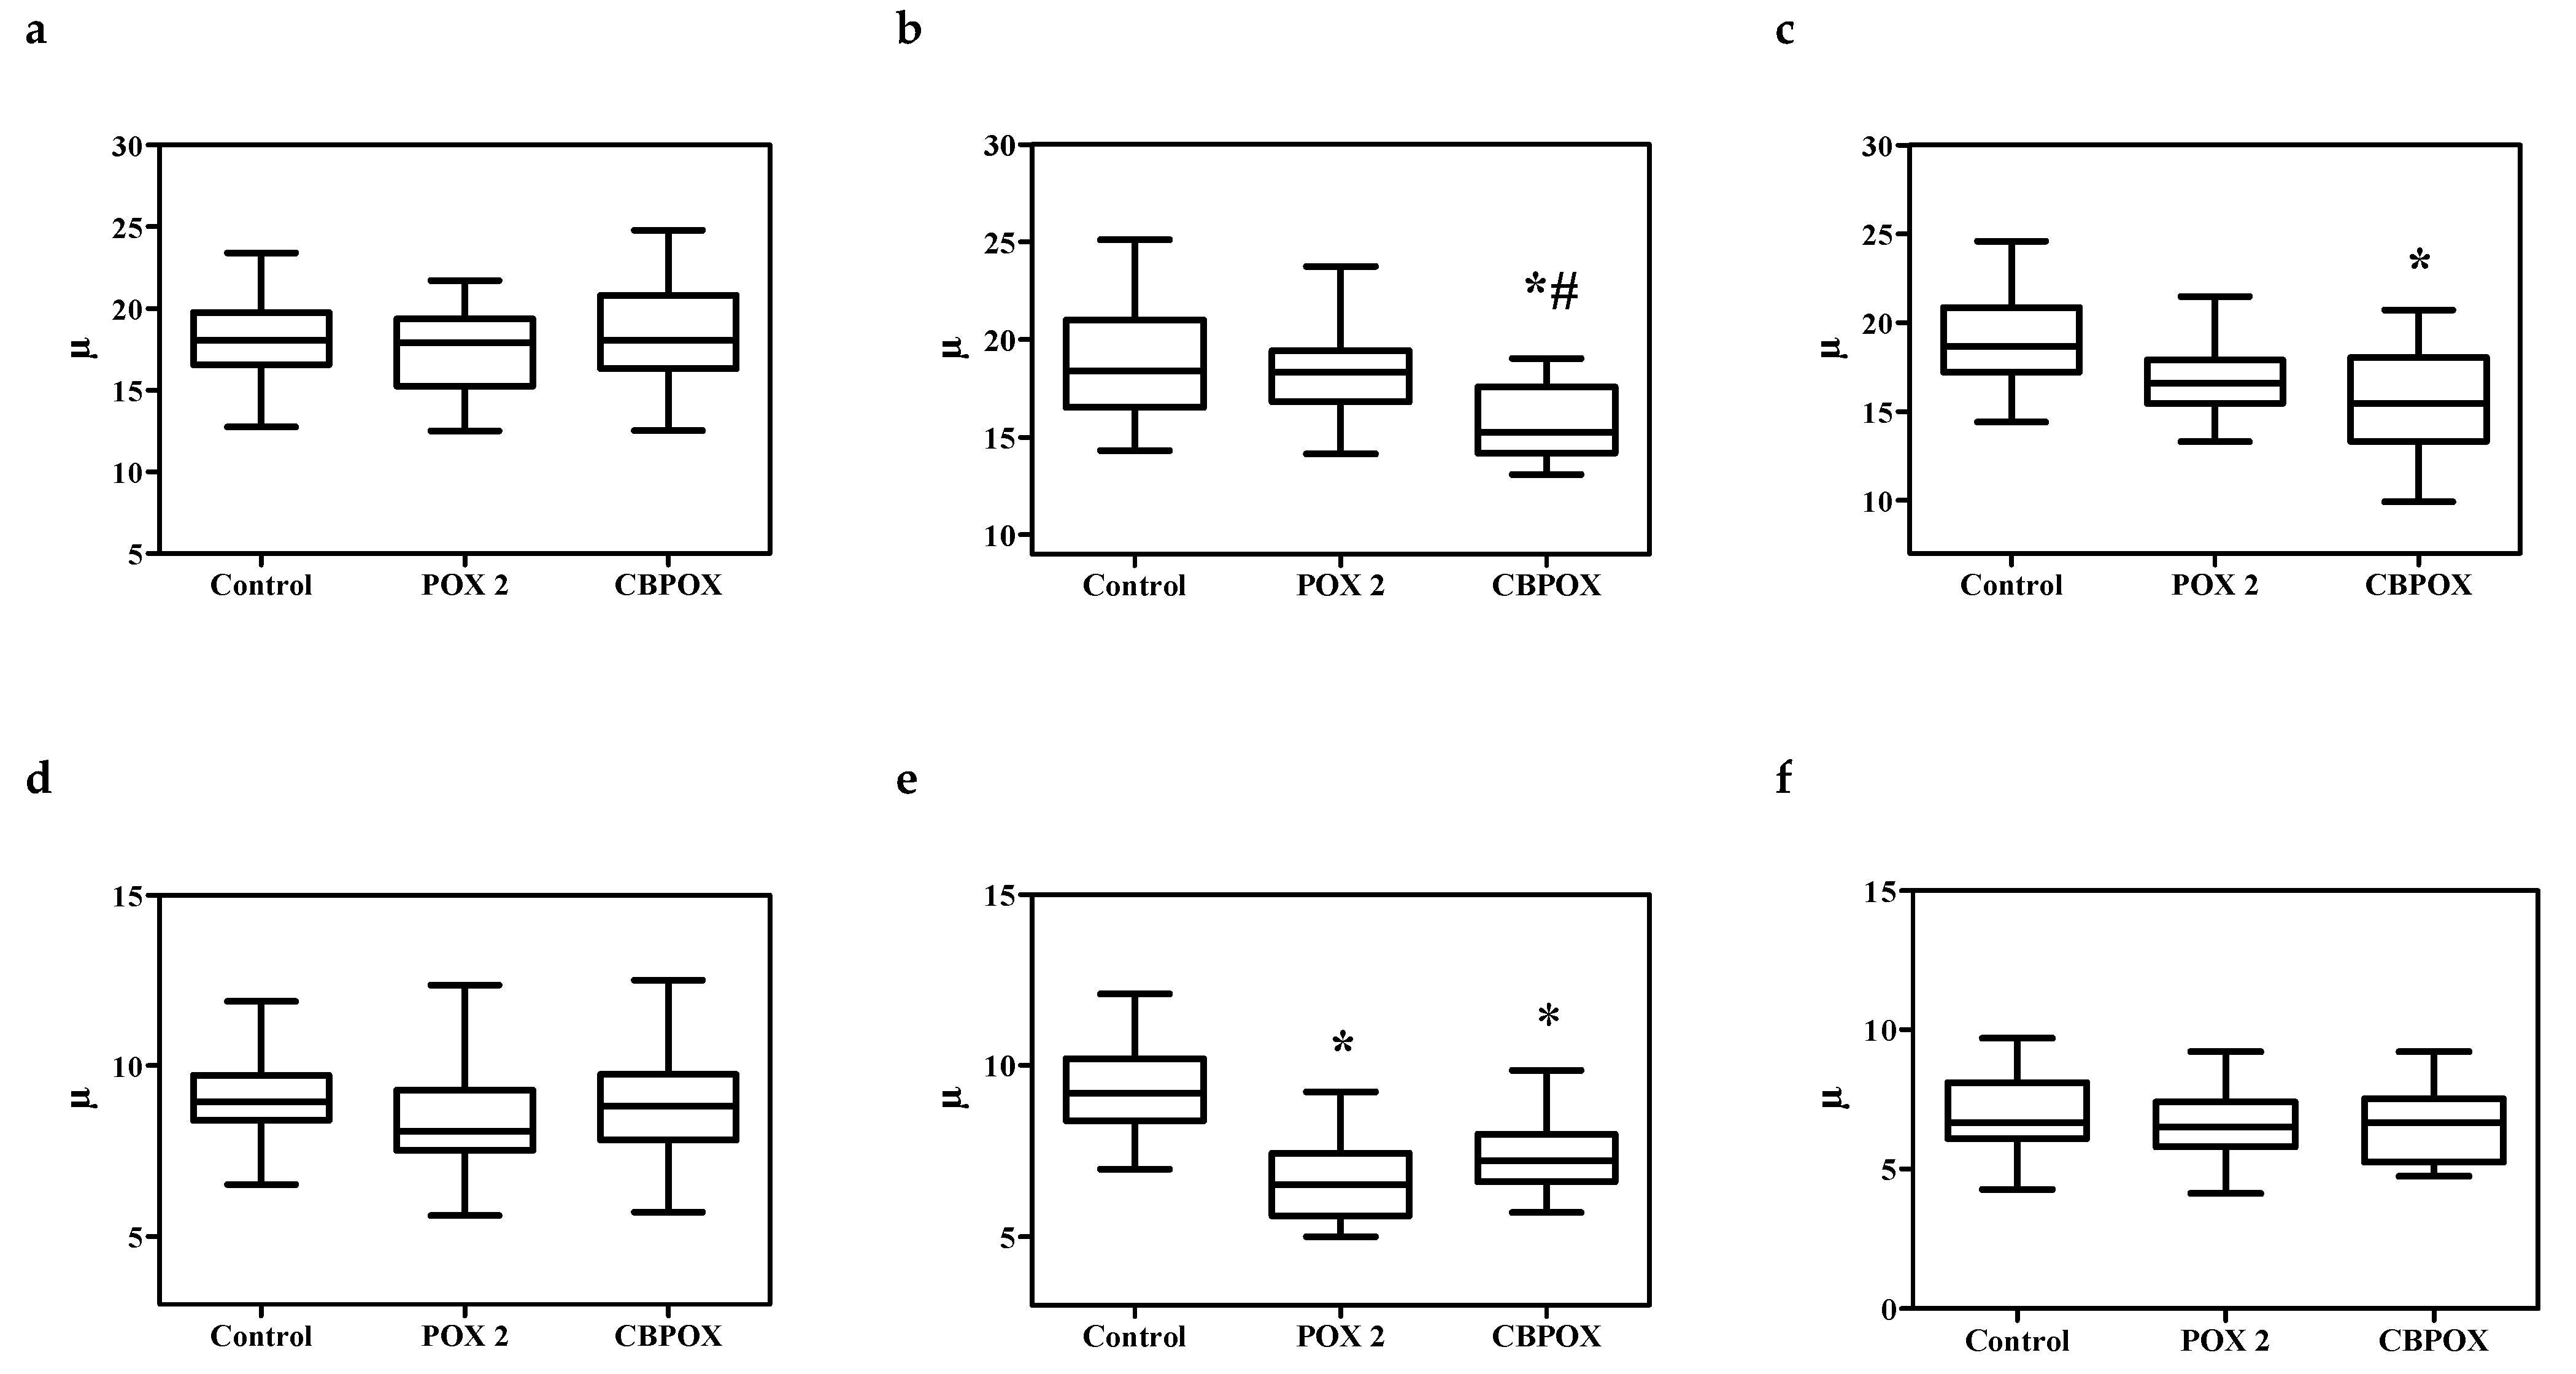
4.9. Visualization of Histological Preparations. Morphometry
4.10. Statistics
5. Conclusions
Author Contributions
Funding
Institutional Review Board Statement
Informed Consent Statement
Data Availability Statement
Conflicts of Interest
Abbreviations
| AKI | Acute kidney injury |
| ALP | Alkaline phosphatase |
| AFOG | Acid Fuchsine Orange G |
| ARF | Acute renal failure |
| BW | Body weight |
| CBDP | 2-(o-cresyl)-4H-1,3,2- benzodioxaphosphorin-2-oxide |
| CE | Carboxylesterase |
| CS | Chondroitin sulfate |
| DCT | Distal convoluted tubule |
| ECC | Endogenous creatinine clearance |
| GAG | Glycosaminoglycan |
| GBM | Glomerular basement membrane |
| GFB | Glomerular filtration barrier |
| GFR | Glomerular filtration rate |
| GSH | Glutathione |
| IHC | Immunohistochemistry |
| MODS | Multiple organ dysfunction syndrome |
| OPs | Organophosphates |
| PCT | Proximal convoluted tubule |
| Pi | Inorganic phosphate |
| POX | Paraoxon |
| PCr | Plasma creatinine concentration |
| RBF | Renal blood flow |
| TEM | Transmission electron microscopy |
| UCr | Urinary creatinine concentration |
| USG | Urine specific gravity |
References
- Wedin, G.P. Nephrotoxicity of anticholinesterases. In Clinical and Experimental Toxicology of Organophosphates and Carbomates; Ballantyne, B., Marrs, T.C., Eds.; Britterworth-Heinemann Ltd.: Oxford, UK, 1992; pp. 195–202. [Google Scholar] [CrossRef]
- Damkjær, M.; Vafaee, M.; Møller, M.L.; Braad, P.E.; Petersen, H.; Høilund-Carlsen, P.F.; Bie, P. Renal cortical and medullary blood flow responses to altered NO availability in humans. Am. J. Physiol. Regul. Integr. Comp. Physiol. 2010, 299, 1449–1455. [Google Scholar] [CrossRef] [PubMed] [Green Version]
- Churchill, S.; Zarlengo, M.D.; Carvalho, J.S.; Gottlieb, M.N.; Oken, D.E. Normal renocortical blood flow in experimental acute renal failure. Kidney Int. 1977, 11, 246–255. [Google Scholar] [CrossRef] [Green Version]
- Kaya, Y.; Bas, O.; Hanci, H.; Cankaya, S.; Nalbant, I.; Odaci, E.; Uydu, H.A.; Aslan, A. Acute renal involvement in organophosphate poisoning: Histological and immunochemical investigations. Ren. Fail. 2018, 40, 410–415. [Google Scholar] [CrossRef]
- Leibson, T.; Lifshitz, M. Organophosphate and carbamate poisoning: Review of the current literature and summary of clinical and laboratory experience in southern Israel. Isr. Med. Assoc. J. 2008, 10, 767–770. [Google Scholar]
- Albright, R.K.; Kram, B.W.; White, R.P. Malathion exposure associated with acute renal failure. JAMA 1983, 250, 2469. [Google Scholar] [CrossRef]
- Kushnir, A.; Finkelstein, Y.; Raikhlin, B.; Taitelman, U. Multihospital study of severe acute organophosphate insecticide poisoning. Vet. Hum. Toxicol. 1988, 30, 366. [Google Scholar]
- Wedin, G.P.; Pennente, C.M.; Sachdev, S.S. Renal involvement in organophosphatc poisoning. JAMA 1984, 252, 1408. [Google Scholar] [CrossRef]
- Kerem, M.; Bedirli, N.; Guerbuez, N.; Ekinci, O.; Bedirli, A.; Akkaya, T.; Sakrak, O.; Pasaoglu, H. Effects of Acute Fenthion Toxicity on Liver and Kidney Function and Histology in Rats. Turk. J. Med. Sci. 2007, 37, 281–288. [Google Scholar]
- Boroushaki, M.T.; Arshadi, D.; Jalili-Rasti, H. Protective effect of pomegranate seed oil against acute toxicity of diazinon in rat kidney. Iran. J. Pharm. Res. 2013, 12, 821–827. [Google Scholar]
- Possamai, F.P.; Fortunato, J.J.; Feier, G.; Agostinho, F.; de Quevedo, J.L.; Filho, D.W.; Pizzol, F.D. Oxidative stress after acute and sub-chronic malathion intoxication in Wistar rats. Environ. Toxicol. Pharmacol. 2007, 23, 198–204. [Google Scholar] [CrossRef]
- Al-Attar, A.M. Physiological and Histopathological Investigations on the Effects of α-Lipoic Acid in Rats Exposed to Malathion. J. Biomed. Biotechnol. 2010, 2010, 203503. [Google Scholar] [CrossRef] [Green Version]
- Ahmed, N.S.; Mohamed, A.S.; Abdel-Wahhab, M.A. Chlorpyrifos-induced oxidative stress and histological changes in retinas and kidney in rats: Protective role of ascorbic acid and alpha tocopherol. Pestic. Biochem. Physiol. 2010, 98, 33–38. [Google Scholar] [CrossRef]
- Hou, Y.; Zeng, Y.; Li, S.; Qi, L.; Xu, W.; Wang, H.; Zhao, X.; Sun, C. Effect of quercetin against dichlorvos induced nephrotoxicity in rats. Exp. Toxicol. Pathol. 2014, 66, 211–218. [Google Scholar] [CrossRef]
- Satar, S.; Satar, D.; Mete, U.O.; Suchard, J.R.; Topal, M.; Kaya, M. Ultrastructural Effects of Acute Organophosphate Poisoning on Rat Kidney. Ren. Fail. 2005, 27, 623–627. [Google Scholar] [CrossRef]
- Eid, R.A. Apoptosis of rat renal cells by organophosphate pesticide, quinalphos: Ultrastructural study. Saudi J. Kidney Dis. Transpl. 2017, 28, 725–736. [Google Scholar] [PubMed]
- Fuentes-Delgado, V.H.; Martínez-Saldaña, M.C.; Rodríguez-Vázquez, M.L.; Reyes-Romero, M.A.; Reyes-Sánchez, J.L.; Jaramillo-Juárez, F. Renal damage induced by the pesticide methyl parathion in male Wistar rats. J. Toxicol. Env. Health Part A 2018, 81, 130–141. [Google Scholar] [CrossRef]
- Lee, F.Y.; Chen, W.K.; Lin, C.L.; Lai, C.Y.; Wu, Y.S.; Lin, I.C.; Kao, C.H. Organophosphate Poisoning and Subsequent Acute Kidney Injury Risk: A Nationwide Population-based Cohort Study. Medicine 2015, 94, 2107. [Google Scholar] [CrossRef] [PubMed]
- Zafar, R.; Munawar, K.; Nasrullah, A.; Haq, S.; Ghazanfar, H.; Sheikh, A.B.; Khan, A.Y. Renal failure due to organophosphate poisoning: A case report. Cureus 2017, 27, 523. [Google Scholar] [CrossRef] [Green Version]
- Cavari, Y.; Landau, D.; Sofer, S.; Leibson, T.; Lazar, I. Organophosphate poisoning-induced acute renal failure. Pediatr. Emerg. Care 2013, 29, 646–647. [Google Scholar] [CrossRef]
- Sokolova, M.O.; Sobolev, V.E.; Reshetkina, D.A.; Nagibovich, O.A. Toxic effect of organophosphate compounds on the kidneys. Bull. Russ. Mil. Med. Acad. 2020, 22, 199–205. (In Russian) [Google Scholar] [CrossRef]
- Mohammadi, M.; Ghani, E.; Ghasemi, A.; Khoshbaten, A.; Asgari, A. Synaptosomal GABA uptake decreases in paraoxon-treated rat brain. Toxicology 2008, 244, 42–48. [Google Scholar] [CrossRef] [PubMed]
- Saleh, A.M.; Vijayasarathy, C.; Masoud, L.; Kumar, L.; Shahin, A.; Kambal, A. Paraoxon induces apoptosis in EL4 cells via activation of mitochondrial pathways. Toxicol. Appl. Pharmacol. 2003, 190, 47–57. [Google Scholar] [CrossRef]
- Abbasnezhad, M.; Jafari, M.; Asgari, A.R.; Hajihoseini, R.; Hajigholamali, M.; Salehi, M.; Salimian, M. The study regarding effect of paraoxon on oxidative stress. J. Maz. Univ. Med. Sci. 2009, 19, 16–26. [Google Scholar]
- Jafari, M.; Salehi, M.; Asgari, A.; Ahmadi, S.; Abbasnezhad, M.; Hajihoosani, R.; Hajigholamali, M. Effects of paraoxon on serum biochemical parameters and oxidative stress induction in various tissues of Wistar and Norway rats. Env. Toxicol. Pharmacol. 2012, 34, 876–887. [Google Scholar] [CrossRef]
- Williams, R.I.; Pearson, J.E. Functional study of the renal effect of the anticholinesterase paraoxon. Arch. Int. Pharmacodyn. 1970, 184, 195–208. [Google Scholar]
- Goncharov, N.V.; Terpilovskij, M.A.; Shmurak, V.I.; Belinskaya, D.A.; Avdonin, P.V. Rat (Rattus norvegicus) as a research object in the model of acute intoxication with organophosphorous compound. 1. Biochemical aspects. J. Evol. Biochem. Physiol. 2019, 55, 112–123. [Google Scholar] [CrossRef]
- Kuznetsov, S.V.; Goncharov, N.V. The Rat (Rattus norvegicus) as a Model Object for Acute Organophosphate Poisoning. 3. Cardiorespiratory Indices. J. Evol. Biochem. Physiol. 2019, 55, 239–243. [Google Scholar] [CrossRef]
- Sobolev, V.E.; Shmurak, V.I.; Goncharov, N.V. Rat (Rattus) norvegicus as a research object in the model of acute intoxication with organophosphorous compound. 4. M1-cholinergic receptors and esterase activity in the brain homogenates. J. Evol. Biochem. Physiol. 2019, 55, 219–222. [Google Scholar] [CrossRef]
- Sobolev, V.E.; Korf, E.A.; Goncharov, N.V. The Rat (Rattus norvegicus) as a Model Object for Acute Organophosphate Poisoning. 5. Morphofunctional Alterations in Kidneys. J. Evol. Biochem. Physiol. 2019, 55, 302–312. [Google Scholar] [CrossRef]
- Georgiadis, G.; Mavridis, C.; Belantis, C.; Zisis, I.E.; Skamagkas, I.; Fragkiadoulaki, I.; Heretis, I.; Tzortzis, V.; Psathakis, K.; Tsatsakis, A.M.; et al. Nephrotoxicity issues of organophosphates. Toxicology 2018, 406–407, 129–136. [Google Scholar] [CrossRef]
- Gottschalk, C.W.; Moss, N.G.; Colindres, R.L. Neural control of renal function in health and disease. In The Kidney: Physiology and Pathology; Scldin., D.W., Giebisch., G., Eds.; Raven Press: New York, NY, USA, 1985; pp. 581–611. [Google Scholar]
- Barnard, E.A.; Budd, C.C.; Ostrowski, K. Autoradiographic methods in enzyme cytochemistry. IV. The cellular and ultrastructural localization of organophosphate-sensitivc esterases in mouse, liver and kidney. Exp. Cell Res. 1970, 60, 405–418. [Google Scholar] [CrossRef]
- Mamoulakis, C.; Tsarouhas, K.; Fragkiadoulaki, I.; Heretis, I.; Wilks, M.F.; Spandidos, D.A.; Tsitsimpikou, C.; Tsatsakis, A. Contrast-induced nephropathy: Basic concepts, pathophysiological implications and prevention strategies. Pharmacol. Ther. 2017, 180, 99–112. [Google Scholar] [CrossRef]
- Agostini, M.; Bianchin, A. Acute renal failure from organophospate poisoning: A case of success with haemofiltration. Hum. Exp. Toxicol. 2003, 22, 165–167. [Google Scholar] [CrossRef] [PubMed]
- Lavender, A.R.; Aho, I.; Pullman, T.N. Renal responses to acetylcholine. Proc. Exp. Biol. Med. 1965, 119, 887–892. [Google Scholar] [CrossRef] [PubMed] [Green Version]
- Pinter, C.C.; O’Morchoe, C.C.C.; Sikand, U.S. Effect of acetylcholine on urinary electrolyte excretion. Am. J. Physiol. 1964, 207, 979–982. [Google Scholar] [CrossRef]
- Vander, A.J. Effects of acetylcholine, atropine, and physostigmine on renal function in the dog. Am. J. Physiol. 1964, 206, 492–498. [Google Scholar] [CrossRef] [Green Version]
- Vanneste, Y.; Lison, D. Biochemical Changes Associated with Muscle Fibre Necrosis after Experimental Organophosphate Poisoning. Hum. Exp. Toxicol. 1993, 12, 365–370. [Google Scholar] [CrossRef]
- Saka, W.A.; Akhigbe, R.E.; Abidoye, A.O.; Dare, O.S.; Adekunle, A.O. Suppression of uric acid generation and blockade of glutathione dysregulation by L-arginine ameliorates dichlorvos-induced oxidative hepatorenal damage in rats. Biomed. Pharmacother. 2021, 138, 111443. [Google Scholar] [CrossRef]
- Sharma, C.D.; Bansal, G. Impact of different doses of Malathion on the selected blood parameter in albino rats (Rattus norvegicus). Environ. Conserv. J. 2021, 22, 1–5. [Google Scholar] [CrossRef]
- Abolaji, A.O.; Awogbindin, I.O.; Adedara, I.A.; Farombi, E.O. Insecticide chlorpyrifos and fungicide carbendazim, common food contaminants mixture, induce hepatic, renal, and splenic oxidative damage in female rats. Hum. Exp. Toxicol. 2017, 36, 483–493. [Google Scholar] [CrossRef]
- Saigal, S.; Bhatnagat, V.K.; Malviya, A.N. Effect of selected pesticides on alkaline and acid phosphatase in the rat. Toxicol. Lett. 1982, 12, 177–180. [Google Scholar] [CrossRef]
- Vishwaner, I.; Mallik, S. The effect of malathion dust on certain tissues of male rats fed varying levels of dietary protein. Indian J. Physiol. Pharmacol. 1984, 28, 35–41. [Google Scholar] [PubMed]
- Boyd, E.M.; Chen, C.P.; Liu, S.J. The acute oral toxicity of parathion in relation to dietary protein. Arch. Toxicol. 1969, 25, 238–253. [Google Scholar] [CrossRef]
- Shobha, T.R.; Prakash, O. Glycosuria in organophosphate and carbamate poisoning. J. Assoc. Physicians India 2000, 48, 1197–1199. [Google Scholar] [PubMed]
- Malekirad, A.A.; Faghih, M.; Mirabdollahi, M.; Kiani, M.; Fathi, A.; Abdollahi, M. Neurocognitive, mental health and glucose disorders in farmers exposed to organophosphorous pesticides. Arh. Hig. Rada Toksikol. 2013, 64, 1–8. [Google Scholar] [CrossRef] [PubMed] [Green Version]
- Bakris, G.L.; Fonseca, V.A.; Sharma, K.; Wright, E.M. Renal sodium–glucose transport: Role in diabetes mellitus and potential clinical implications. Kidney Int. 2009, 75, 1272–1277. [Google Scholar] [CrossRef] [PubMed] [Green Version]
- Lambers, T.T.; Mahieu, F.; Oancea, E.; Hoofd, L.; DeLange, F.; Mensenkamp, A.R.; Voets, T.; Nilius, B.; Clapham, D.E.; Hoenderop, J.G.; et al. Calbindin-D28k dynamically controls TRPV5- mediated Ca2+ transport. EMBO J. 2006, 25, 2978–2988. [Google Scholar] [CrossRef] [PubMed] [Green Version]
- Wasserman, R.H.; Taylor, A.N. Vitamin D-induced calcium-binding protein in chick intestinal mucosa. Science 1966, 52, 791–793. [Google Scholar] [CrossRef]
- Bruns, M.F.H.; Fausto, A.; Avioli, L.V. Placental calcium binding protein in rats: Apparent identity with vitamin D-dependent calcium binding protein from rat intestine. J. Biol. Chem. 1978, 253, 3186–3190. [Google Scholar] [CrossRef]
- Delorme, A.C.; Danan, J.L.; Mathicu, H. Biochemical evidence for the presence of two vitamin D-dependent calcium-binding proteins in mouse kidney. J. Biol. Chem. 1983, 258, 1878–1884. [Google Scholar] [CrossRef]
- Morrissey, R.L.; Rath, D.F. Purification of human renal calcium binding protein from necropsy specimens. Proc. Soc. Exp. Biol. Med. 1974, 145, 699–703. [Google Scholar] [CrossRef]
- Roth, J.; Brown, D.; Norman, A.W.; Orci, L. Localization of the vitamin D-dependent calcium-binding protein in mammalian kidney. Am. J. Physiol. 1982, 243, 243–252. [Google Scholar] [CrossRef] [PubMed]
- Zhu, Y.; Takashi, M.; Miyake, K.; Kato, K. Sensitive enzyme immunoassay for human 28 kDa calbindin-D. Clin. Chim. Acta 1991, 201, 183–192. [Google Scholar] [CrossRef]
- Hasegawa, S.; Kato, K.; Takashi, M.; Zhu, Y.; Obata, K.; Kinukawa, T.; Miyake, K. Increased levels of calbindin-D in serum and urine from patients treated by expracorporcal shock wave lithotrypsy. J. Urol. 1993, 149, 1414–1418. [Google Scholar] [CrossRef]
- Takashi, M.; Hasegawa, S.; Ohmuta, M.; Ohshima, S.; Kato, K. Significant elevation of urinary 28-kDa calbindin-d and N-acetyl-beta-d-glucosaminidase levels in patients undergoing extracorporeal shock wave lithotripsy. Int. Urol. Nephrol. 1998, 30, 407–415. [Google Scholar] [CrossRef]
- Takashi, M.; Zhu, Y.; Miyake, K.; Kato, K. Urinary 28-kDa calbindin-D as a new marker for damage to distal renal tubules caused by cisplatin-based chemotherapy. Urol. Int. 1996, 56, 174–179. [Google Scholar] [CrossRef]
- Hoffmann, D.; Fuchs, T.C.; Henzler, T.; Matheis, K.A.; Herget, T.; Dekant, W.; Mally, A. Evaluation of a urinary kidney biomarker panel in rat models of acute and subchronic nephrotoxicity. Toxicology 2010, 277, 49–58. [Google Scholar] [CrossRef]
- Fuchs, T.C.; Hewitt, P. Biomarkers for Drug-Induced Renal Damage and Nephrotoxicity—An Overview for Applied Toxicology. AAPS J. 2011, 13, 615–631. [Google Scholar] [CrossRef] [PubMed]
- Ichimura, T.; Bonventre, J.V.; Bailly, V.; Wei, H.; Hession, C.A.; Cate, R.L. Kidney injury molecule-1 (KIM-1), a putative epithelial cell adhesion molecule containing a novel immunoglobulin domain, is up-regulated in renal cells after injury. J. Biol. Chem. 1998, 273, 4135–4142. [Google Scholar] [CrossRef] [Green Version]
- Bailly, V.; Zhang, Z.; Meier, W.; Cate, R.; Sanicola, M.; Bonventre, J.V. Shedding of kidney injury molecule-1, a putative adhesion protein involved in renal regeneration. J. Biol. Chem. 2002, 277, 39739–39748. [Google Scholar] [CrossRef] [PubMed] [Green Version]
- Bonventre, J.V. Kidney Injury Molecule-1 (KIM-1): A specific and sensitive biomarker of kidney injury. Scand. J. Clin. Lab. Investig. 2008, 68, 78–83. [Google Scholar] [CrossRef]
- Ichimura, T.; Hung, C.C.; Yang, S.A.; Stevens, J.L.; Bonventre, J.V. Kidney injury molecule-1, a tissue and urinary biomarker for nephrotoxicant-induced renal injury. Am. J. Physiol. Renal. Physiol. 2004, 286, 552–563. [Google Scholar] [CrossRef] [PubMed]
- Zhou, Y.; Vaidya, V.S.; Brown, R.P.; Zhang, J.; Rosenzweig, B.A.; Thompson, K.L. Comparison of kidney injury molecule-1 and other nephrotoxicity biomarkers in urine and kidney following acute exposure to gentamicin, mercury, and chromium. Toxicol. Sci. 2008, 101, 159–170. [Google Scholar] [CrossRef] [Green Version]
- Vaidya, V.S.; Ramirez, V.; Ichimura, T.; Bobadilla, N.A.; Bonventre, J.V. Urinary kidney injury molecule-1: A sensitive quantitative biomarker for early detection of kidney tubular injury. Am. J. Physiol. Renal. Physiol. 2006, 290, 517–529. [Google Scholar] [CrossRef] [PubMed]
- Han, W.K.; Bailly, V.; Abichandani, R.; Thadhani, R.; Bonventre, J.V. Kidney injury molecule-1 (KIM-1): A novel biomarker for human renal proximal tubule injury. Kidney Int. 2002, 62, 237–244. [Google Scholar] [CrossRef] [Green Version]
- Levey, A.S.; Perrone, R.D.; Madias, N.E. Serum creatinine and renal function. Annu. Rev. Med. 1988, 39, 465–490. [Google Scholar] [CrossRef]
- Calloway, D.H.; Margen, S. Variation in endogenous nitrogen excretion and dietary nitrogen utilization as determinants of human protein requirement. J. Nutr. 1971, 101, 205–216. [Google Scholar] [CrossRef] [PubMed] [Green Version]
- Traynor, J.; Mactier, R.; Geddes, C.C.; Fox, J.G. How to measure renal function in clinical practice. BMJ 2006, 333, 733–737. [Google Scholar] [CrossRef]
- Rosano, T.G.; Brown, H.H. Analytical and biological variability of serum creatinine and creatinine clearance: Implications for clinical interpretation. Clin. Chem. 1982, 28, 2330–2331. [Google Scholar] [CrossRef]
- Goldman, R. Endogenous Creatinine Clearance by Rats. Exp. Biol. Med. 1967, 125, 1021–1024. [Google Scholar] [CrossRef]
- Van Liew, J.B.; Zamlauski-Tucker, M.J.; Feld, L.G. Endogenous creatinine clearance in the rat: Strain variation. Life Sci. 1993, 53, 1015–1021. [Google Scholar] [CrossRef]
- Besseling, P.J.; Pieters, T.T.; Nguyen, I.T.N.; de Bree, P.M.; Willekes, N.; Dijk, A.H.; Bovée, D.M.; Hoorn, E.J.; Rookmaaker, M.B.; Gerritsen, K.G.; et al. A plasma creatinine- and urea-based equation to estimate glomerular filtration rate in rats. Am. J. Physiol. Renal. Physiol. 2021, 320, 518–524. [Google Scholar] [CrossRef] [PubMed]
- Abend, Y.; Goland, S.; Evron, E.; Sthoeger, Z.M.; Geltner, D. Acute renal failure complicating organophosphate intoxication. Ren. Fail. 1994, 16, 415–417. [Google Scholar] [CrossRef]
- Bentur, Y.; Nutenko, I.; Tsipiniuk, A.; Raikhlin-Eisenkraft, B.; Taitelman, U. Pharmacokinetics of obidoxime in organophosphate poisoning associated with renal failure. J. Toxicol. Clin. Toxicol. 1993, 31, 315–322. [Google Scholar] [CrossRef]
- Komosinska-Vassev, K.; Blat, D.; Olczyk, P.; Szeremeta, A.; Jura-Półtorak, A.; Winsz-Szczotka, K.; Klimek, K.; Olczyk, K. Urinary glycosaminoglycan (uGAG) excretion in healthy pediatric and adolescent population. Clin. Biochem. 2014, 47, 1341–1343. [Google Scholar] [CrossRef] [PubMed]
- Miner, J.H. Renal basement membrane components. Kidney Int. 1999, 56, 2016–2024. [Google Scholar] [CrossRef] [Green Version]
- McCarthy, K.J.; Wassenhove-McCarthy, D.J. The glomerular basement membrane as a model system to study the bioactivity of heparan sulfate glycosaminoglycans. Microsc. Microanal. 2012, 18, 3–21. [Google Scholar] [CrossRef] [PubMed] [Green Version]
- Pyke, C.; Kristensen, P.; Ostergaard, P.B.; Oturai, P.S.; Romer, J. Proteoglycan expression in the normal rat kidney. Nephron 1997, 77, 461–470. [Google Scholar] [CrossRef]
- Sorensson, J.; Bjornson, A.; Ohlson, M.; Ballermann, B.J.; Haraldsson, B. Synthesis of the sulfated proteoglycans by bovine glomerular endothelial cells in culture. Am. J. Physiol. Ren. Physiol. 2003, 284, 373–380. [Google Scholar] [CrossRef] [Green Version]
- Sobolev, V.E.; Jenkins, R.O.; Goncharov, N.V. Sulfated glycosaminoglycans in bladder tissue and urine of rats after acute exposure to paraoxon and cyclophosphamide. Exp. Toxicol. Pathol. 2017, 69, 339–347. [Google Scholar] [CrossRef]
- Horst, H. Histochemical investigations on liver and kidneys of the rat alter intoxication with organophosphates. Acta Flistochem. 1975, 52, 239–252. [Google Scholar]
- Serrone, D.M.; Stein, A.A.; Coulston, F. Biochemical and electron microscopic changes observed in rats and monkeys medicated orally with carbaryl. Toxicol. Appl. Pharmacol. 1966, 8, 353. [Google Scholar]
- Vargova, M.; Batora, I.; Jakubovskiv, J.; Kobzová, D.; Gajdová, M.; Bátorová, A.; Lipková, V. On the mechanism of acute toxicity of phosmet. Czech. Med. 1986, 9, 130–142. [Google Scholar] [PubMed]
- Linkermann, A.; Chen, G.; Dong, G.; Kunzendorf, U.; Krautwald, S.; Dong, Z. Regulated cell death in AKI. J. Am. Soc. Nephrol. 2014, 25, 2689–2701. [Google Scholar] [CrossRef]
- Barnett, L.M.; Cummings, B.S. Nephrotoxicity and renal pathophysiology: A contemporary perspective. Toxicol. Sci. 2018, 164, 379–390. [Google Scholar] [CrossRef] [Green Version]
- Kandasamy, Y.; Smith, R.; Lumbers, E.R.; Rudd, D. Nephrin—A biomarker of early glomerular injury. Biomarker Res. 2014, 2, 21. [Google Scholar] [CrossRef] [Green Version]


| Control | POX2x | CBPOX | |
|---|---|---|---|
| Calbindin | 4101 ± 334 | 6419 ± 1201 | 7383 ± 990 * |
| KIM-1 | 21.8 ± 5.5 | 28.8 ± 6.0 | 24.1 ± 6.9 |
| TIMP-1 | 32,755 ± 7830 | 13,078 ± 9771 | 19,174 ± 11,596 |
| Time after Poisoning | Blood and Urine Biochemistry | Biomarkers of Kidney Injury | Histopathology | |
|---|---|---|---|---|
| POX2x | 24 h | In plasma: Uric acid Uric acidIn urine: Glucose CSCreatinine clearance:  ECC ECC | No change | No change |
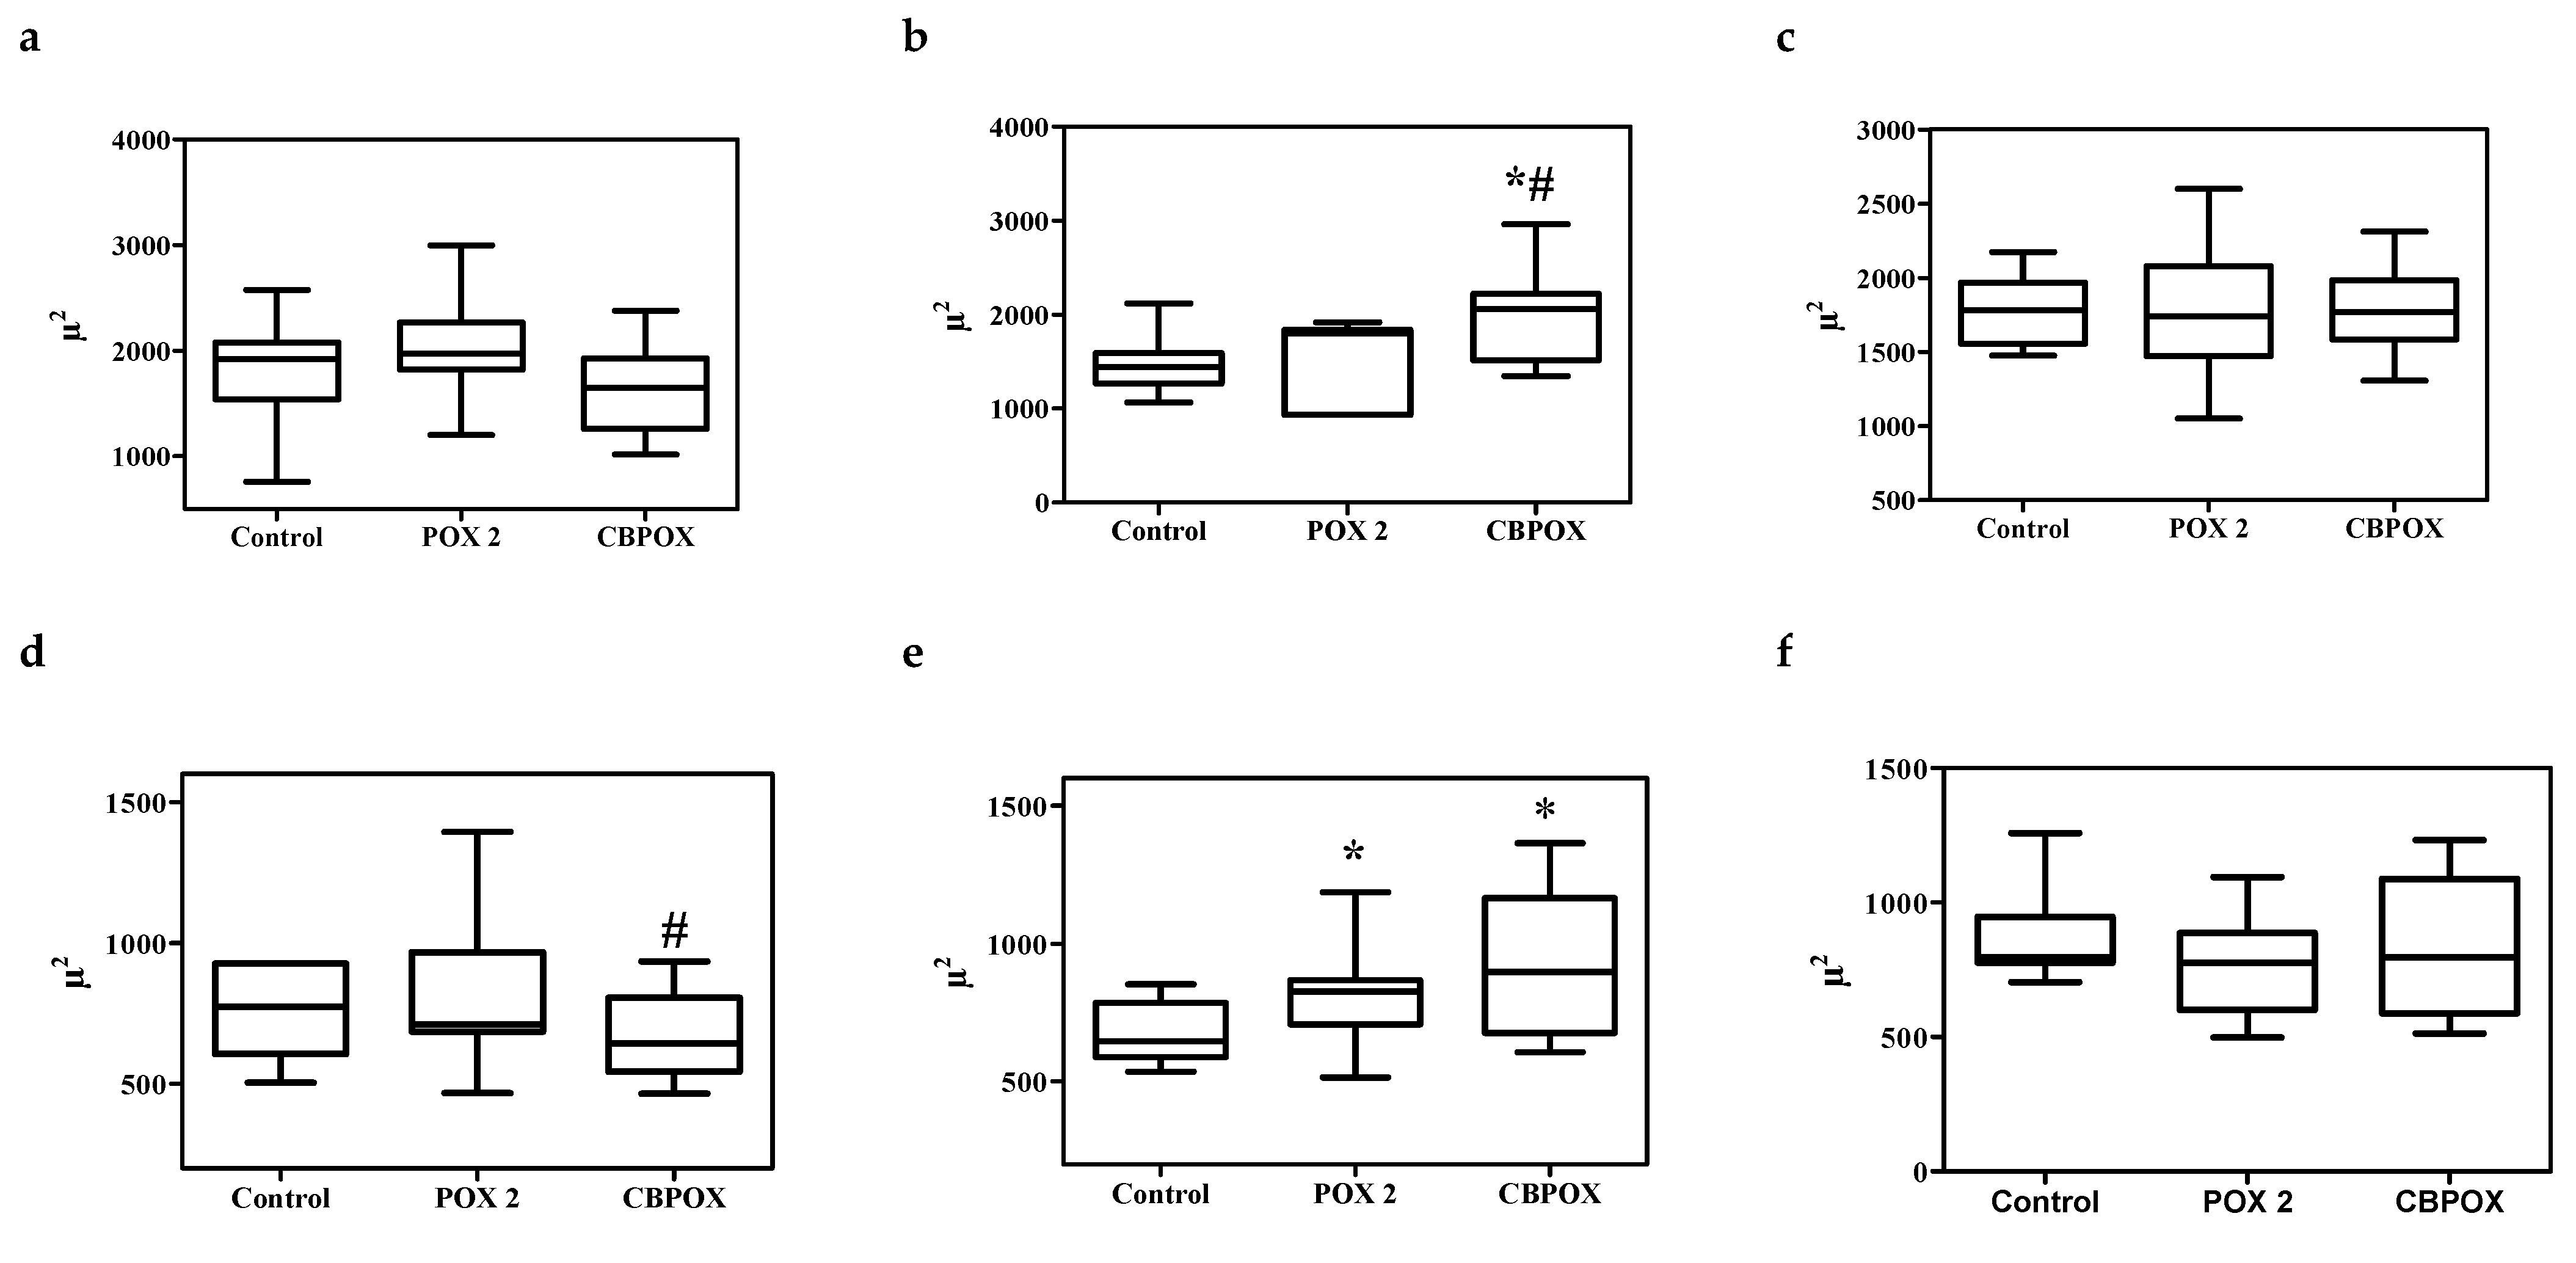
| 3 days | In urine: CS | No change | Renal glomerulus area PCT lumen diameter | |
| 7 days | In plasma: Uric acid | No change | No change | |
| CBPOX | 24 h | In plasma: Creatinine Calcium Inorganic phosphate Alkaline phosphatase In urine: GlucoseCSCreatinine clearance: ECC | No change | No change |
| 3 days | In urine: CS | In urine: Calbindin | Renal glomerulus area PCT lumen diameterDCT lumen diameter | |
| 7 days | No change | No change | PCT lumen diameter |
| Time after Poisoning | Histopathology | Ultrastructural Changes | |
|---|---|---|---|
| LD16 | 24 h | No | Not observed |
| 3 days | No | Not observed | |
| 7 days | No | Not observed | |
| LD50 | 24 h | Absence of granularity in the cytoplasm of tubule epitheliocytes; Expansion of Bowman’s capsule | Vacuolization of cytoplasm, degeneration of mitochondria of PCT epitheliocytes; Decrease in epithelial cell height in DCT |
| 3 days | Absence of granularity in the cytoplasm of tubule epitheliocytes | Vacuolization of cytoplasm, degeneration of epithelial cell mitochondria in PCT | |
| 7 days | Not observed | Blockage of tubule lumen by cellular detritus and local destruction of apical cell surfaces; GBM thickening | |
| LD84 | 24 h | Dilation of the diameter of the lumen of the tubules; Expansion of Bowman’s capsule | Vacuolization of cytoplasm, degeneration of mitochondria of epitheliocytes in PCT karyopiknosis of nuclei; Decrease in epithelial cell height in DCT |
| 3 days | Narrowing of tubule lumen diameter | Vacuolization of cytoplasm, degeneration of mitochondria of epitheliocytes in PCT; Increased height of the epithelium in the PCT | |
| 7 days | Not observed | Partial blocking of tubule lumen by cellular detritus; local destruction of apical cell surfaces; GBM thickening |
Publisher’s Note: MDPI stays neutral with regard to jurisdictional claims in published maps and institutional affiliations. |
© 2021 by the authors. Licensee MDPI, Basel, Switzerland. This article is an open access article distributed under the terms and conditions of the Creative Commons Attribution (CC BY) license (https://creativecommons.org/licenses/by/4.0/).
Share and Cite
Sobolev, V.E.; Sokolova, M.O.; Jenkins, R.O.; Goncharov, N.V. Nephrotoxic Effects of Paraoxon in Three Rat Models of Acute Intoxication. Int. J. Mol. Sci. 2021, 22, 13625. https://doi.org/10.3390/ijms222413625
Sobolev VE, Sokolova MO, Jenkins RO, Goncharov NV. Nephrotoxic Effects of Paraoxon in Three Rat Models of Acute Intoxication. International Journal of Molecular Sciences. 2021; 22(24):13625. https://doi.org/10.3390/ijms222413625
Chicago/Turabian StyleSobolev, Vladislav E., Margarita O. Sokolova, Richard O. Jenkins, and Nikolay V. Goncharov. 2021. "Nephrotoxic Effects of Paraoxon in Three Rat Models of Acute Intoxication" International Journal of Molecular Sciences 22, no. 24: 13625. https://doi.org/10.3390/ijms222413625
APA StyleSobolev, V. E., Sokolova, M. O., Jenkins, R. O., & Goncharov, N. V. (2021). Nephrotoxic Effects of Paraoxon in Three Rat Models of Acute Intoxication. International Journal of Molecular Sciences, 22(24), 13625. https://doi.org/10.3390/ijms222413625