
Three-Dimensional Osteogenic Differentiation of Bone Marrow Mesenchymal Stem Cells Promotes Matrix Metallopeptidase 13 (MMP13) Expression in Type I Collagen Hydrogels

 ,
,  ,
,
Abstract
1. Introduction
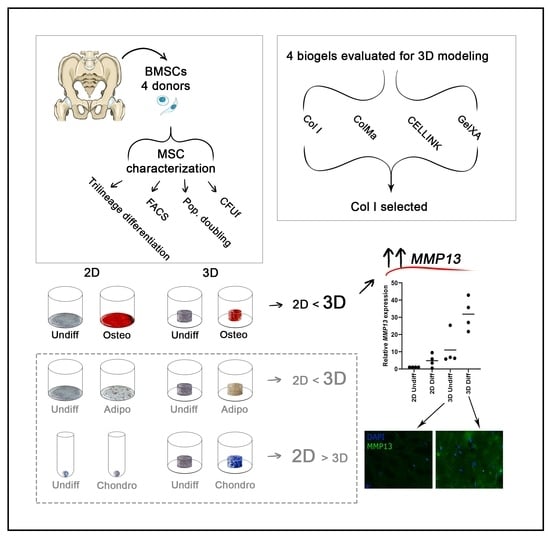
2. Results
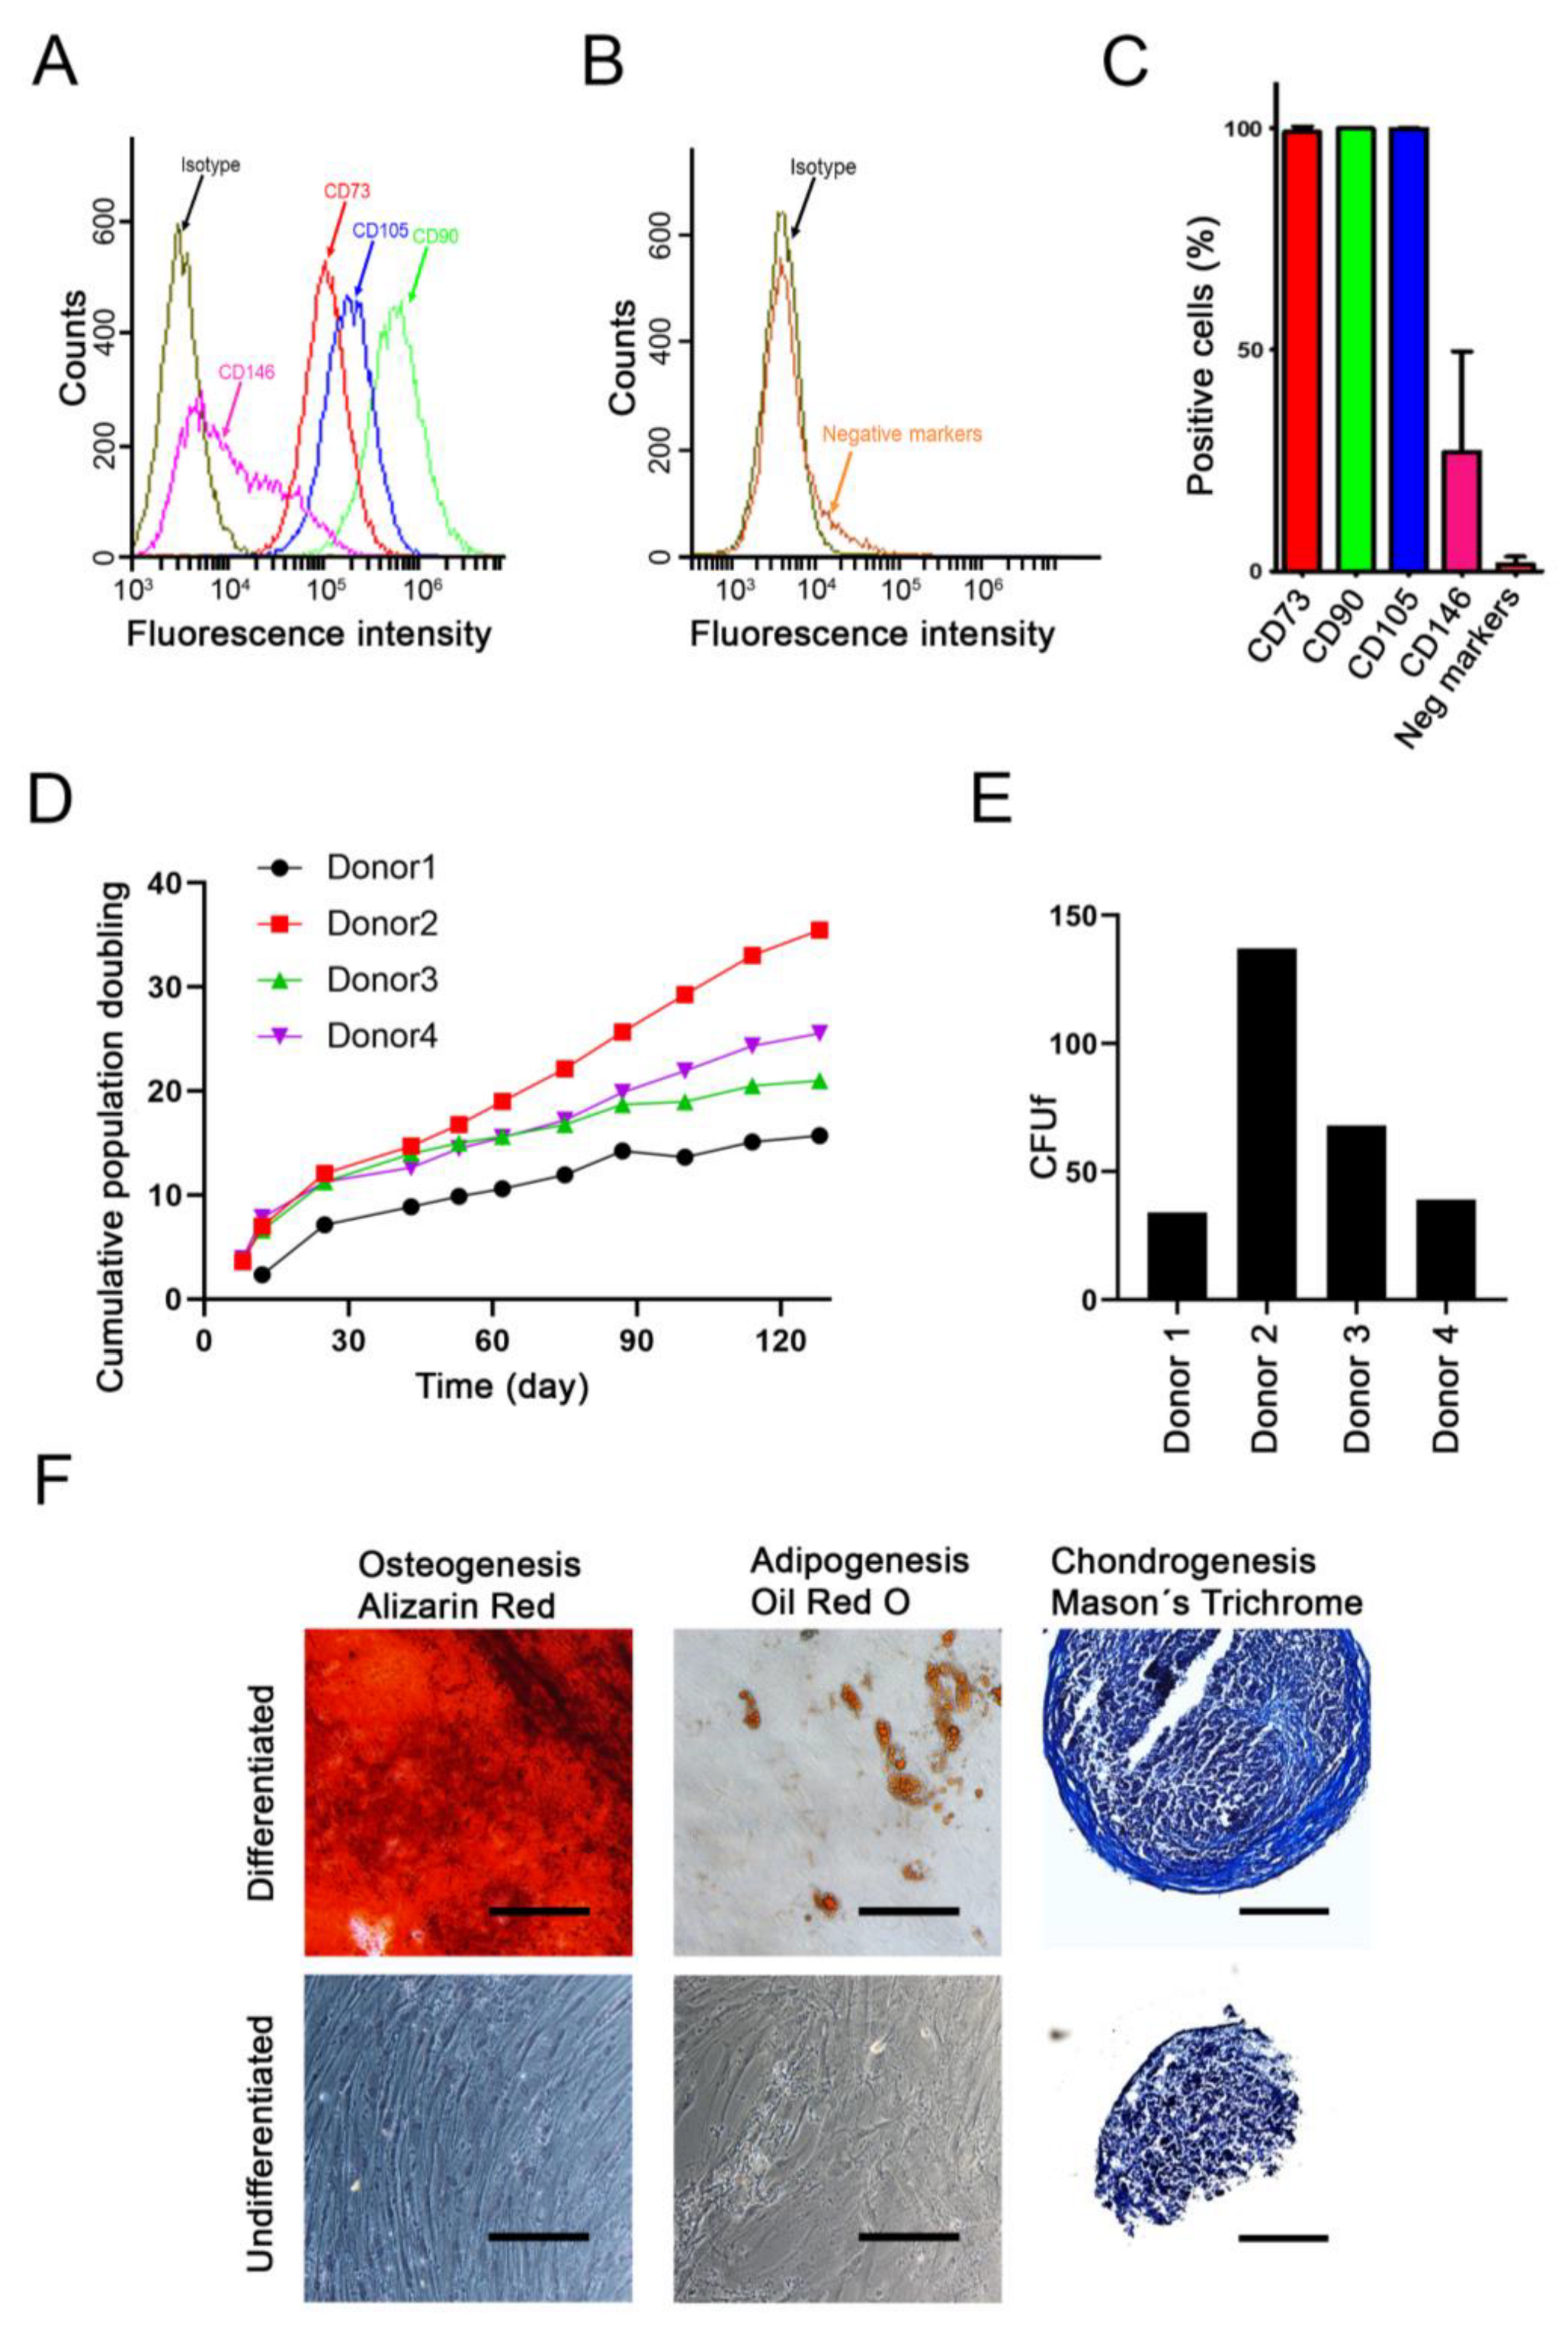
2.1. Characterization of Donor Cells
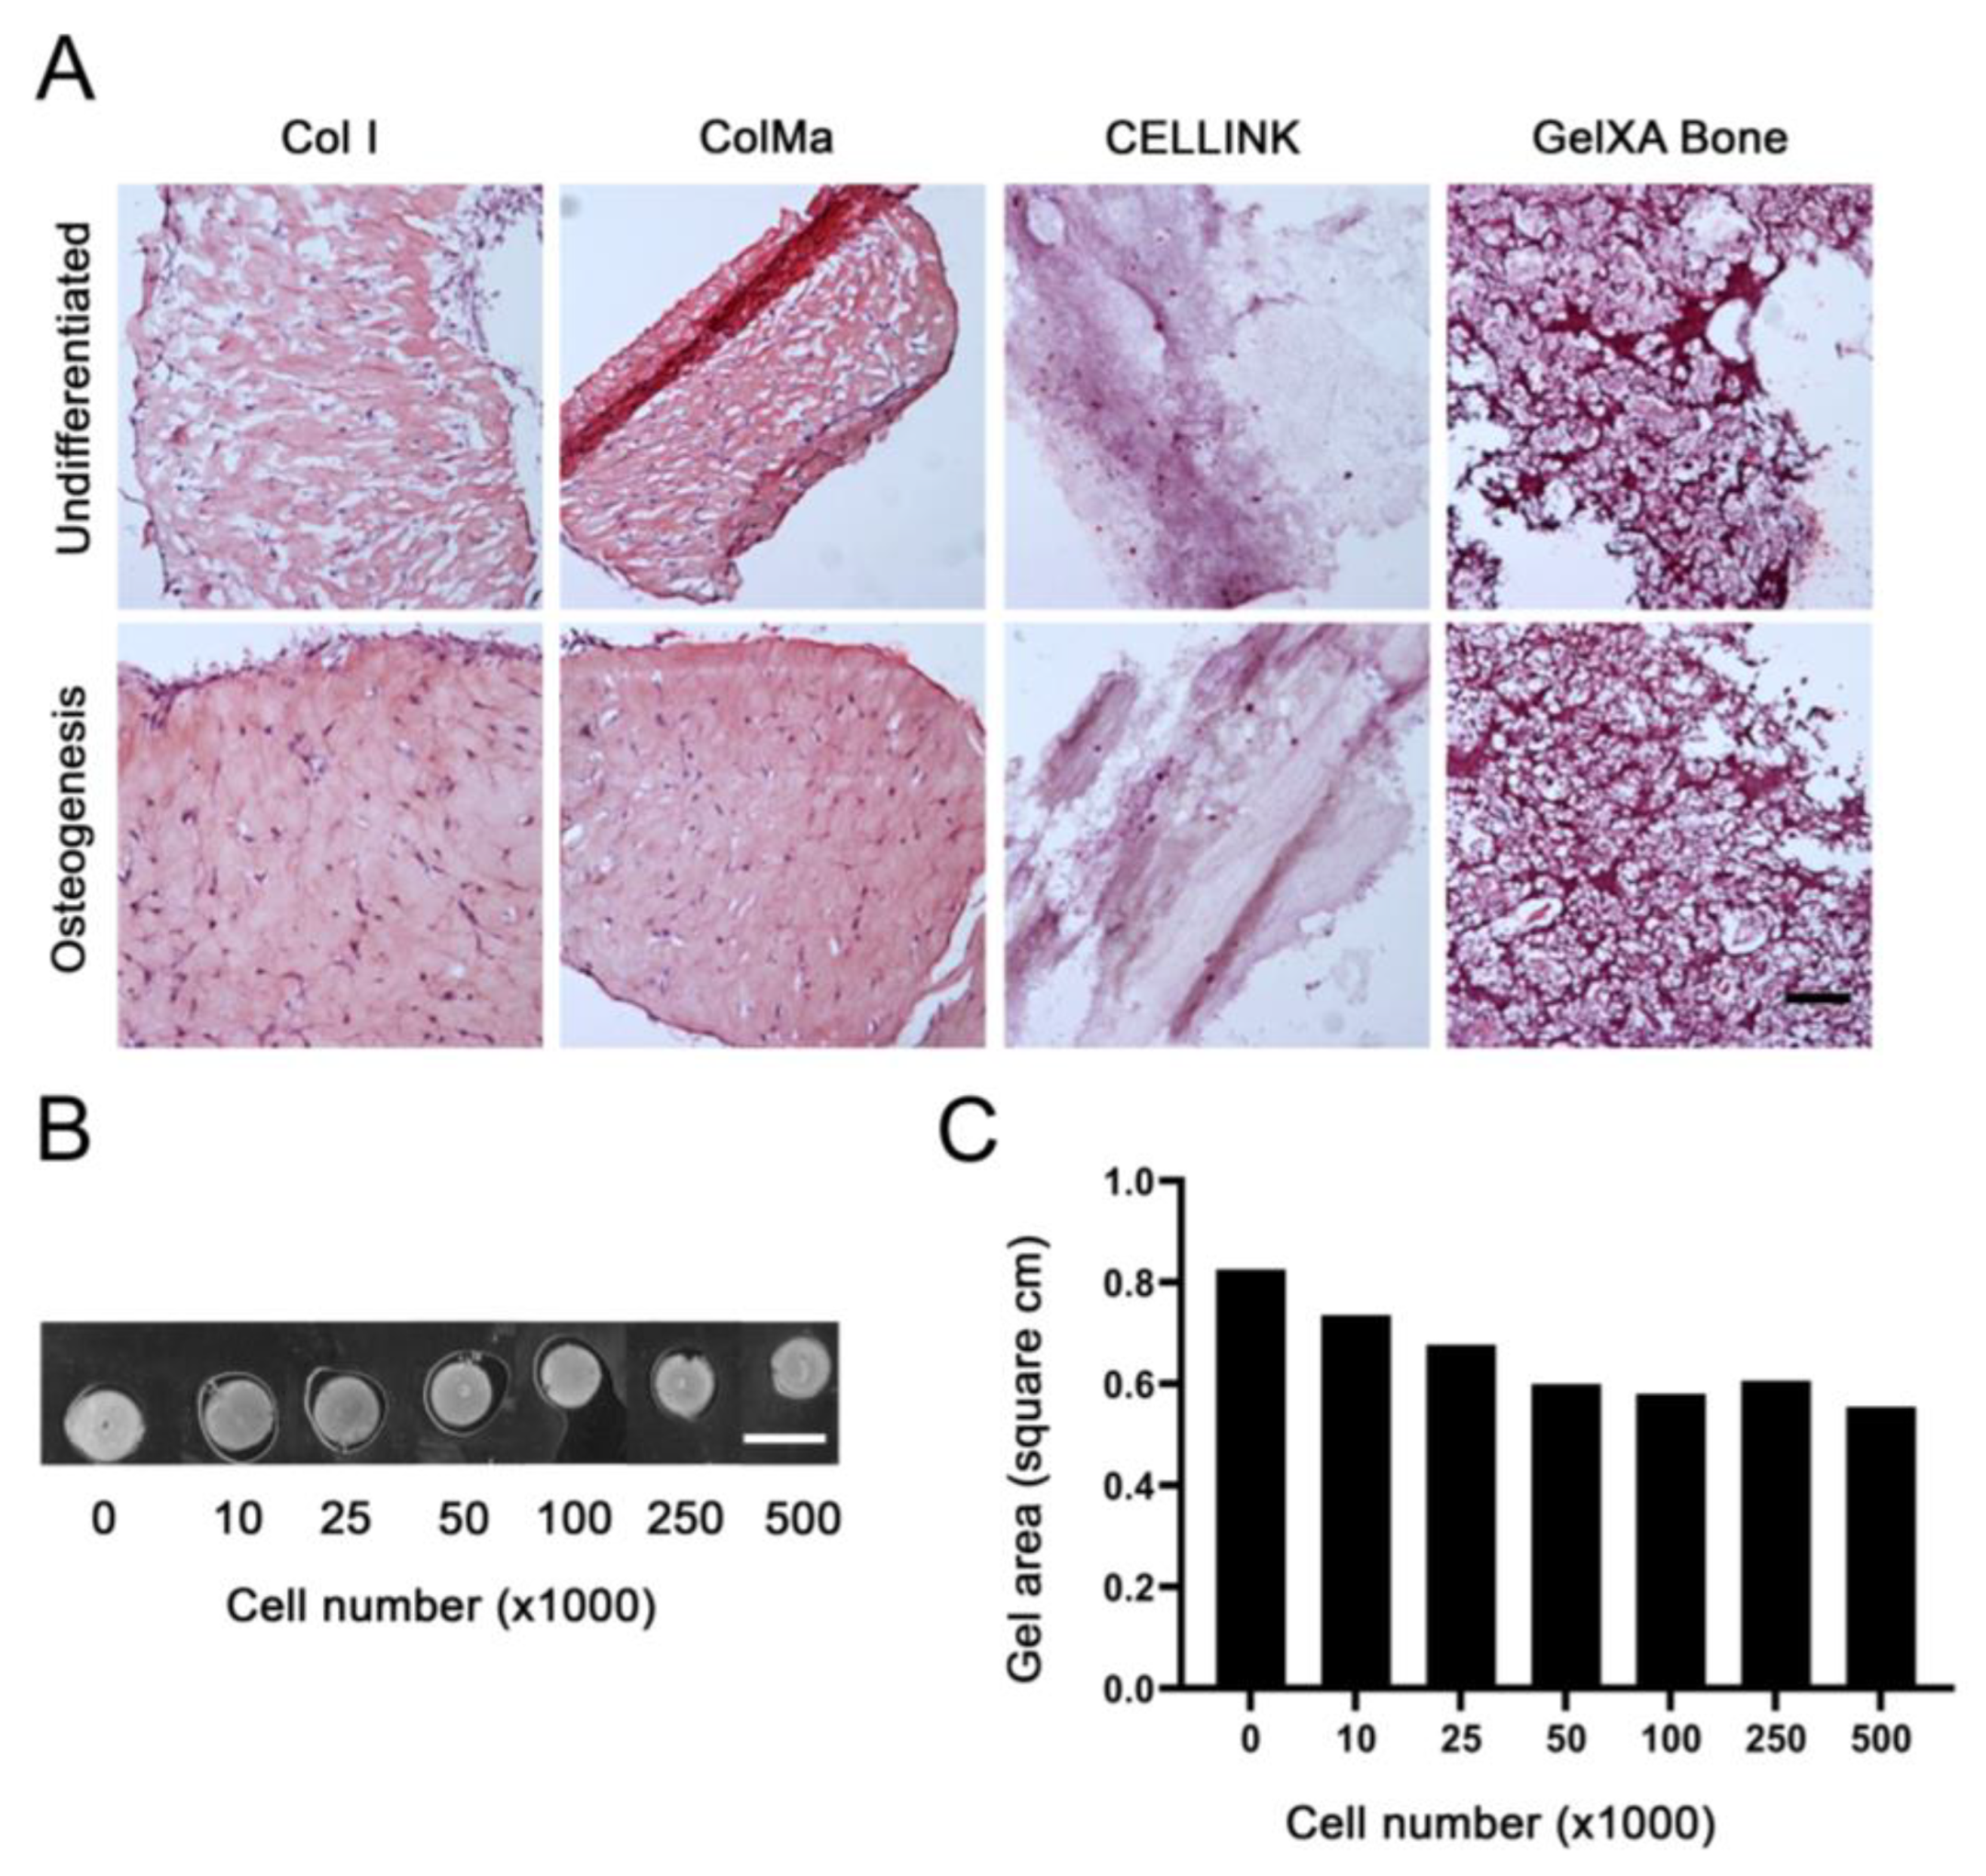
2.2. Gel Selection and Cell Number Optimization
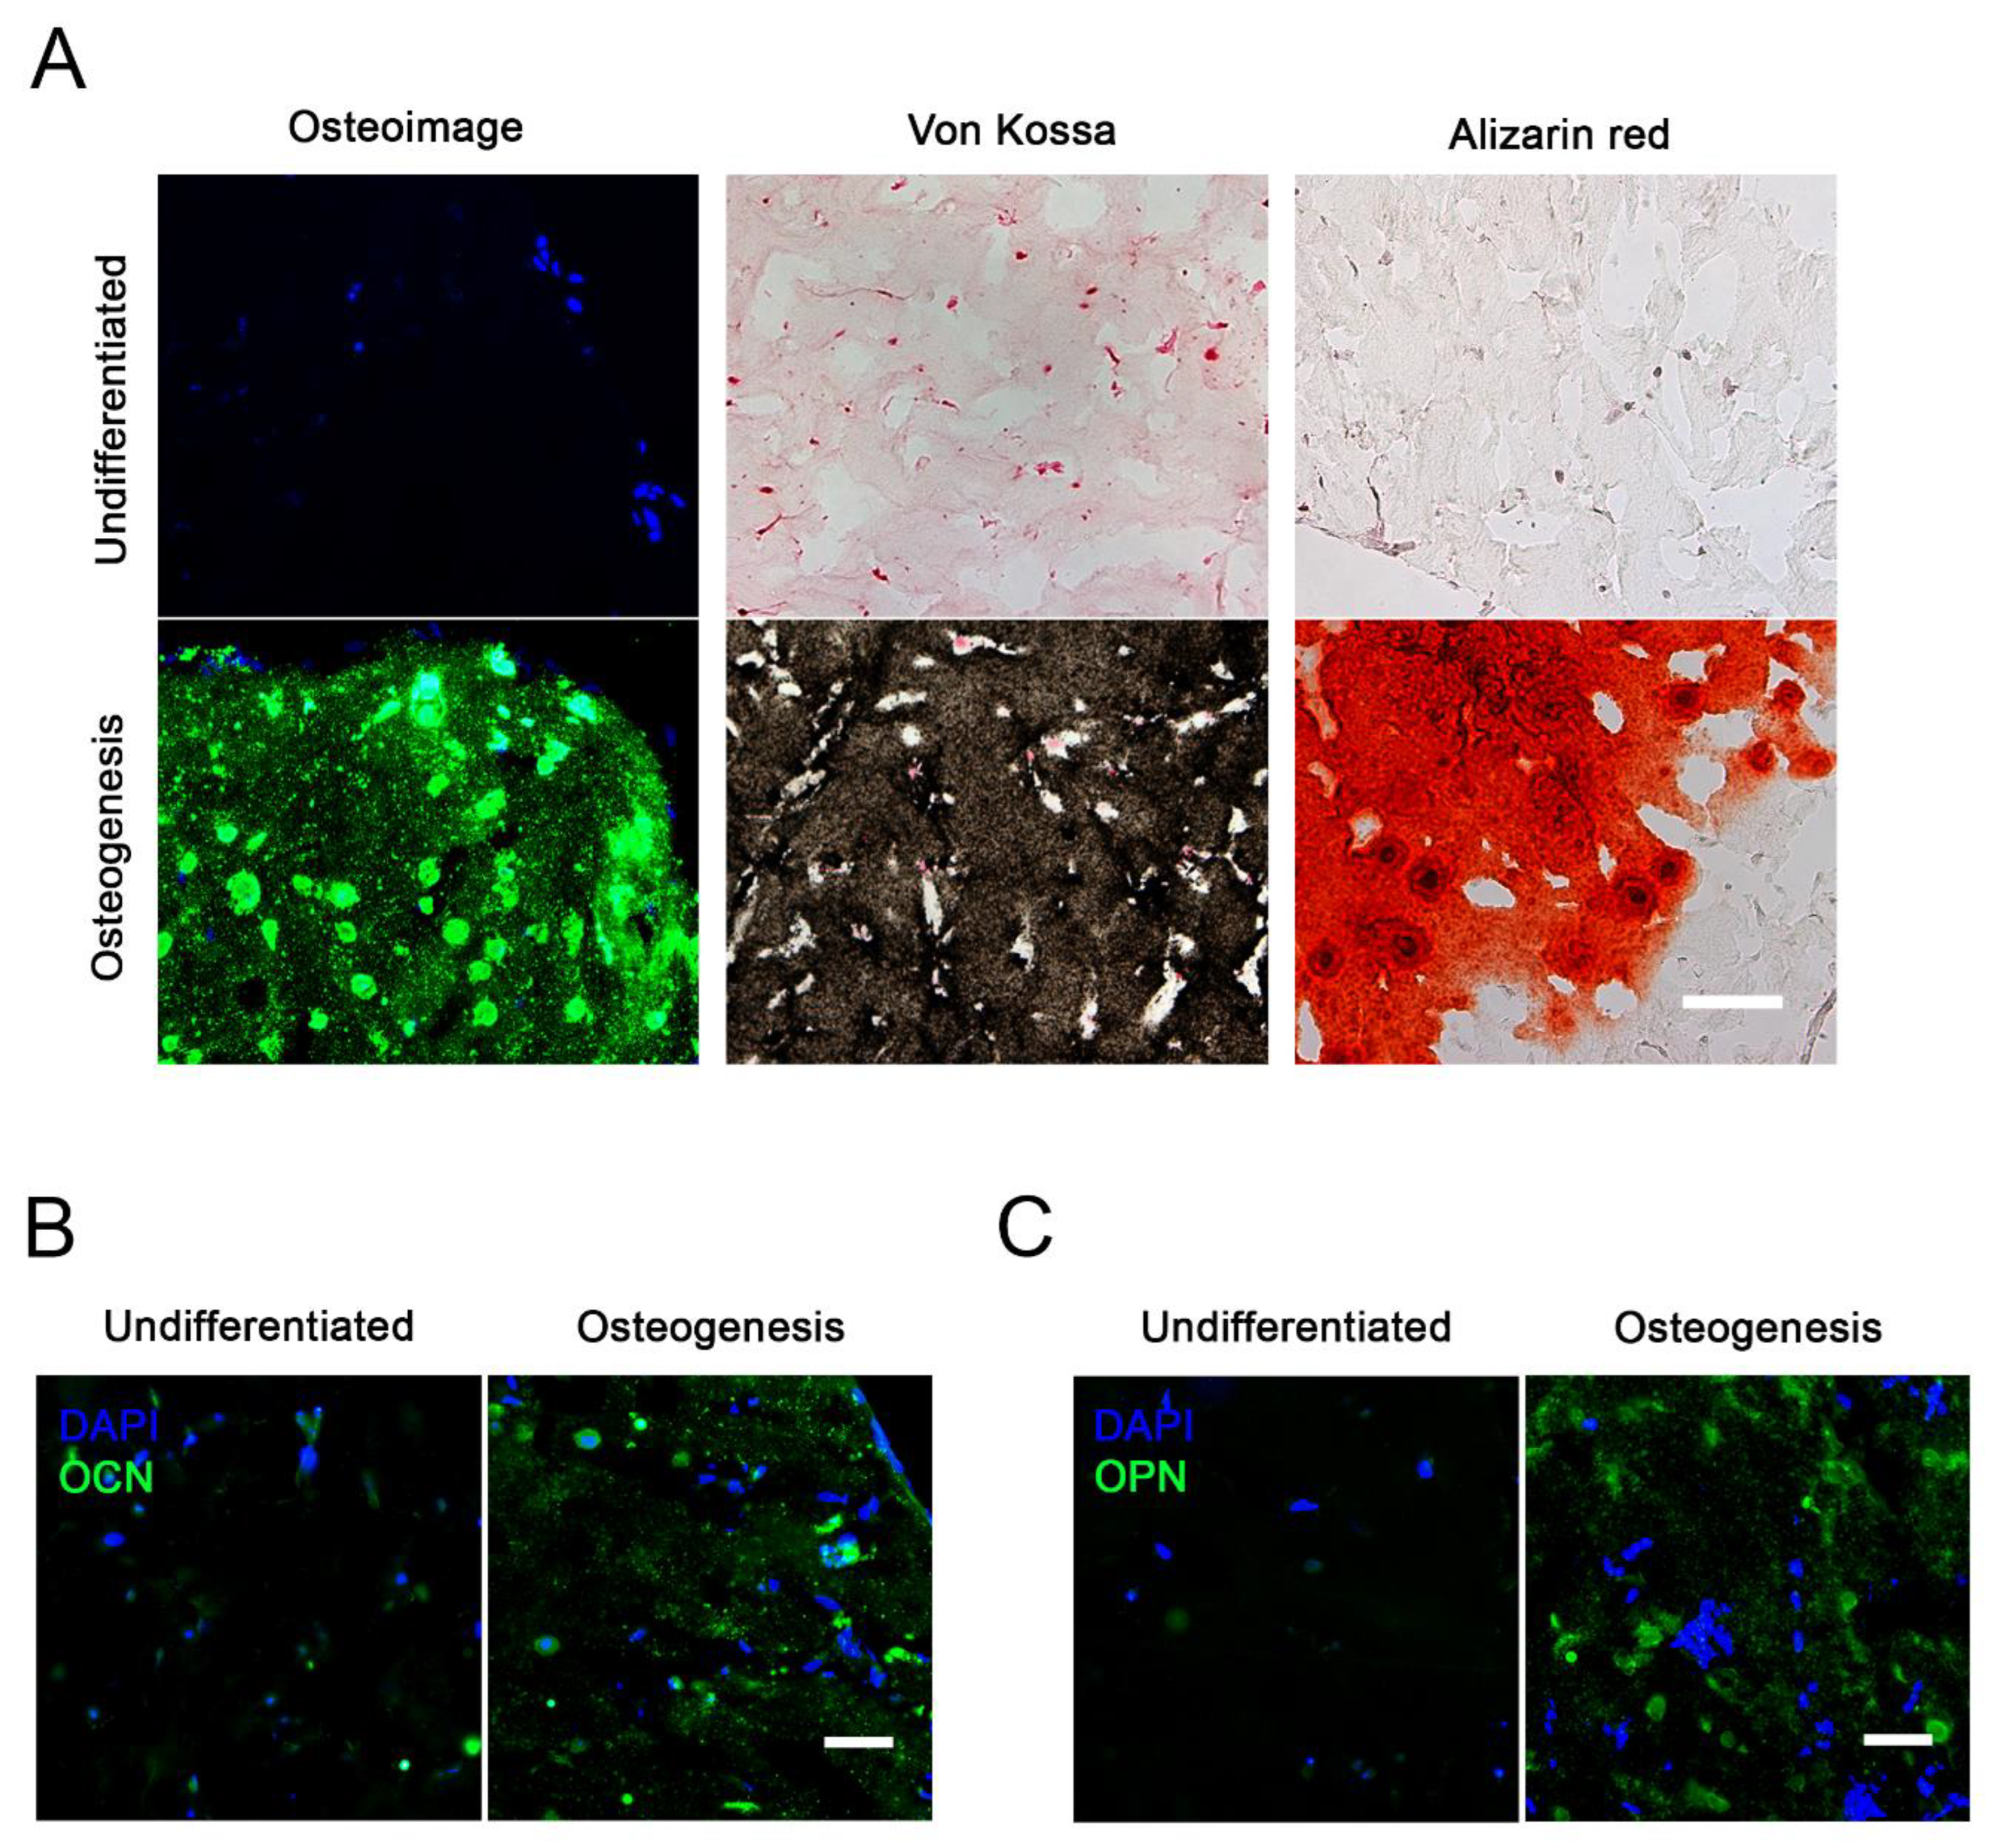
2.3. Osteogenic Differentiation in 3D
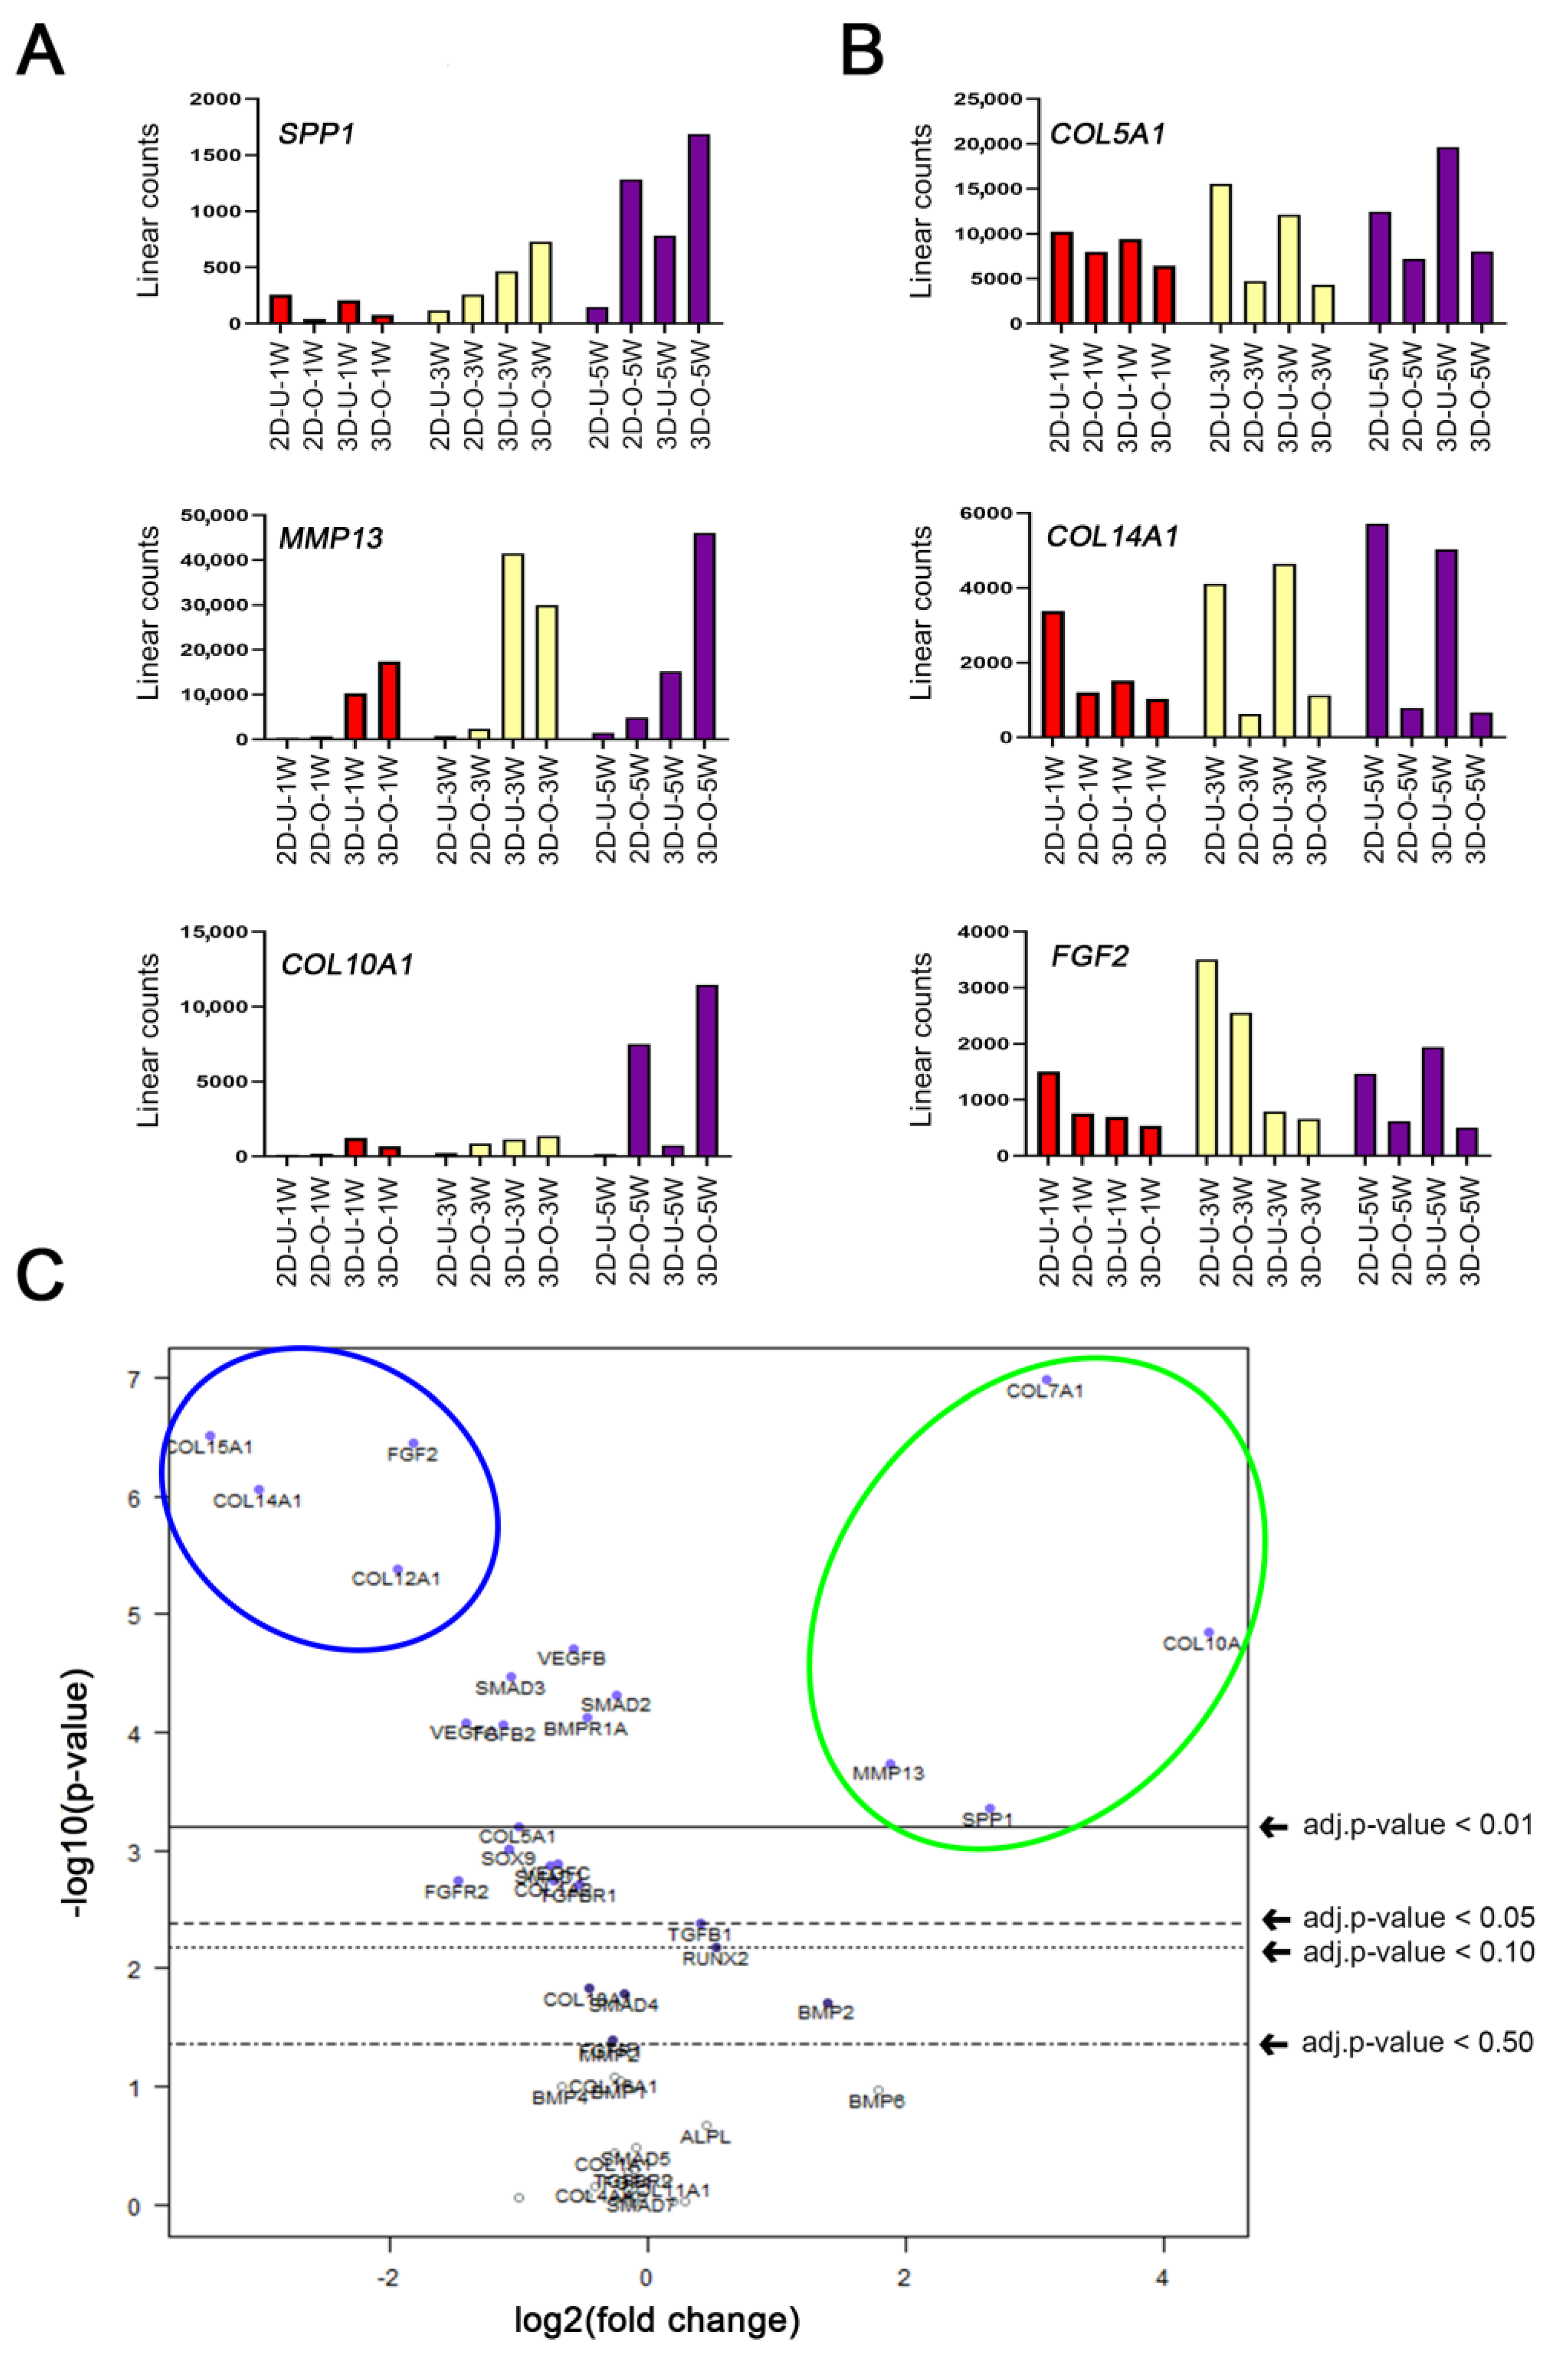
2.4. Time Course and Quantitative Analysis of Osteogenic Gene Expression
2.5. Enhanced MMP13 Expression Due to 3D Osteogenic Differentiation
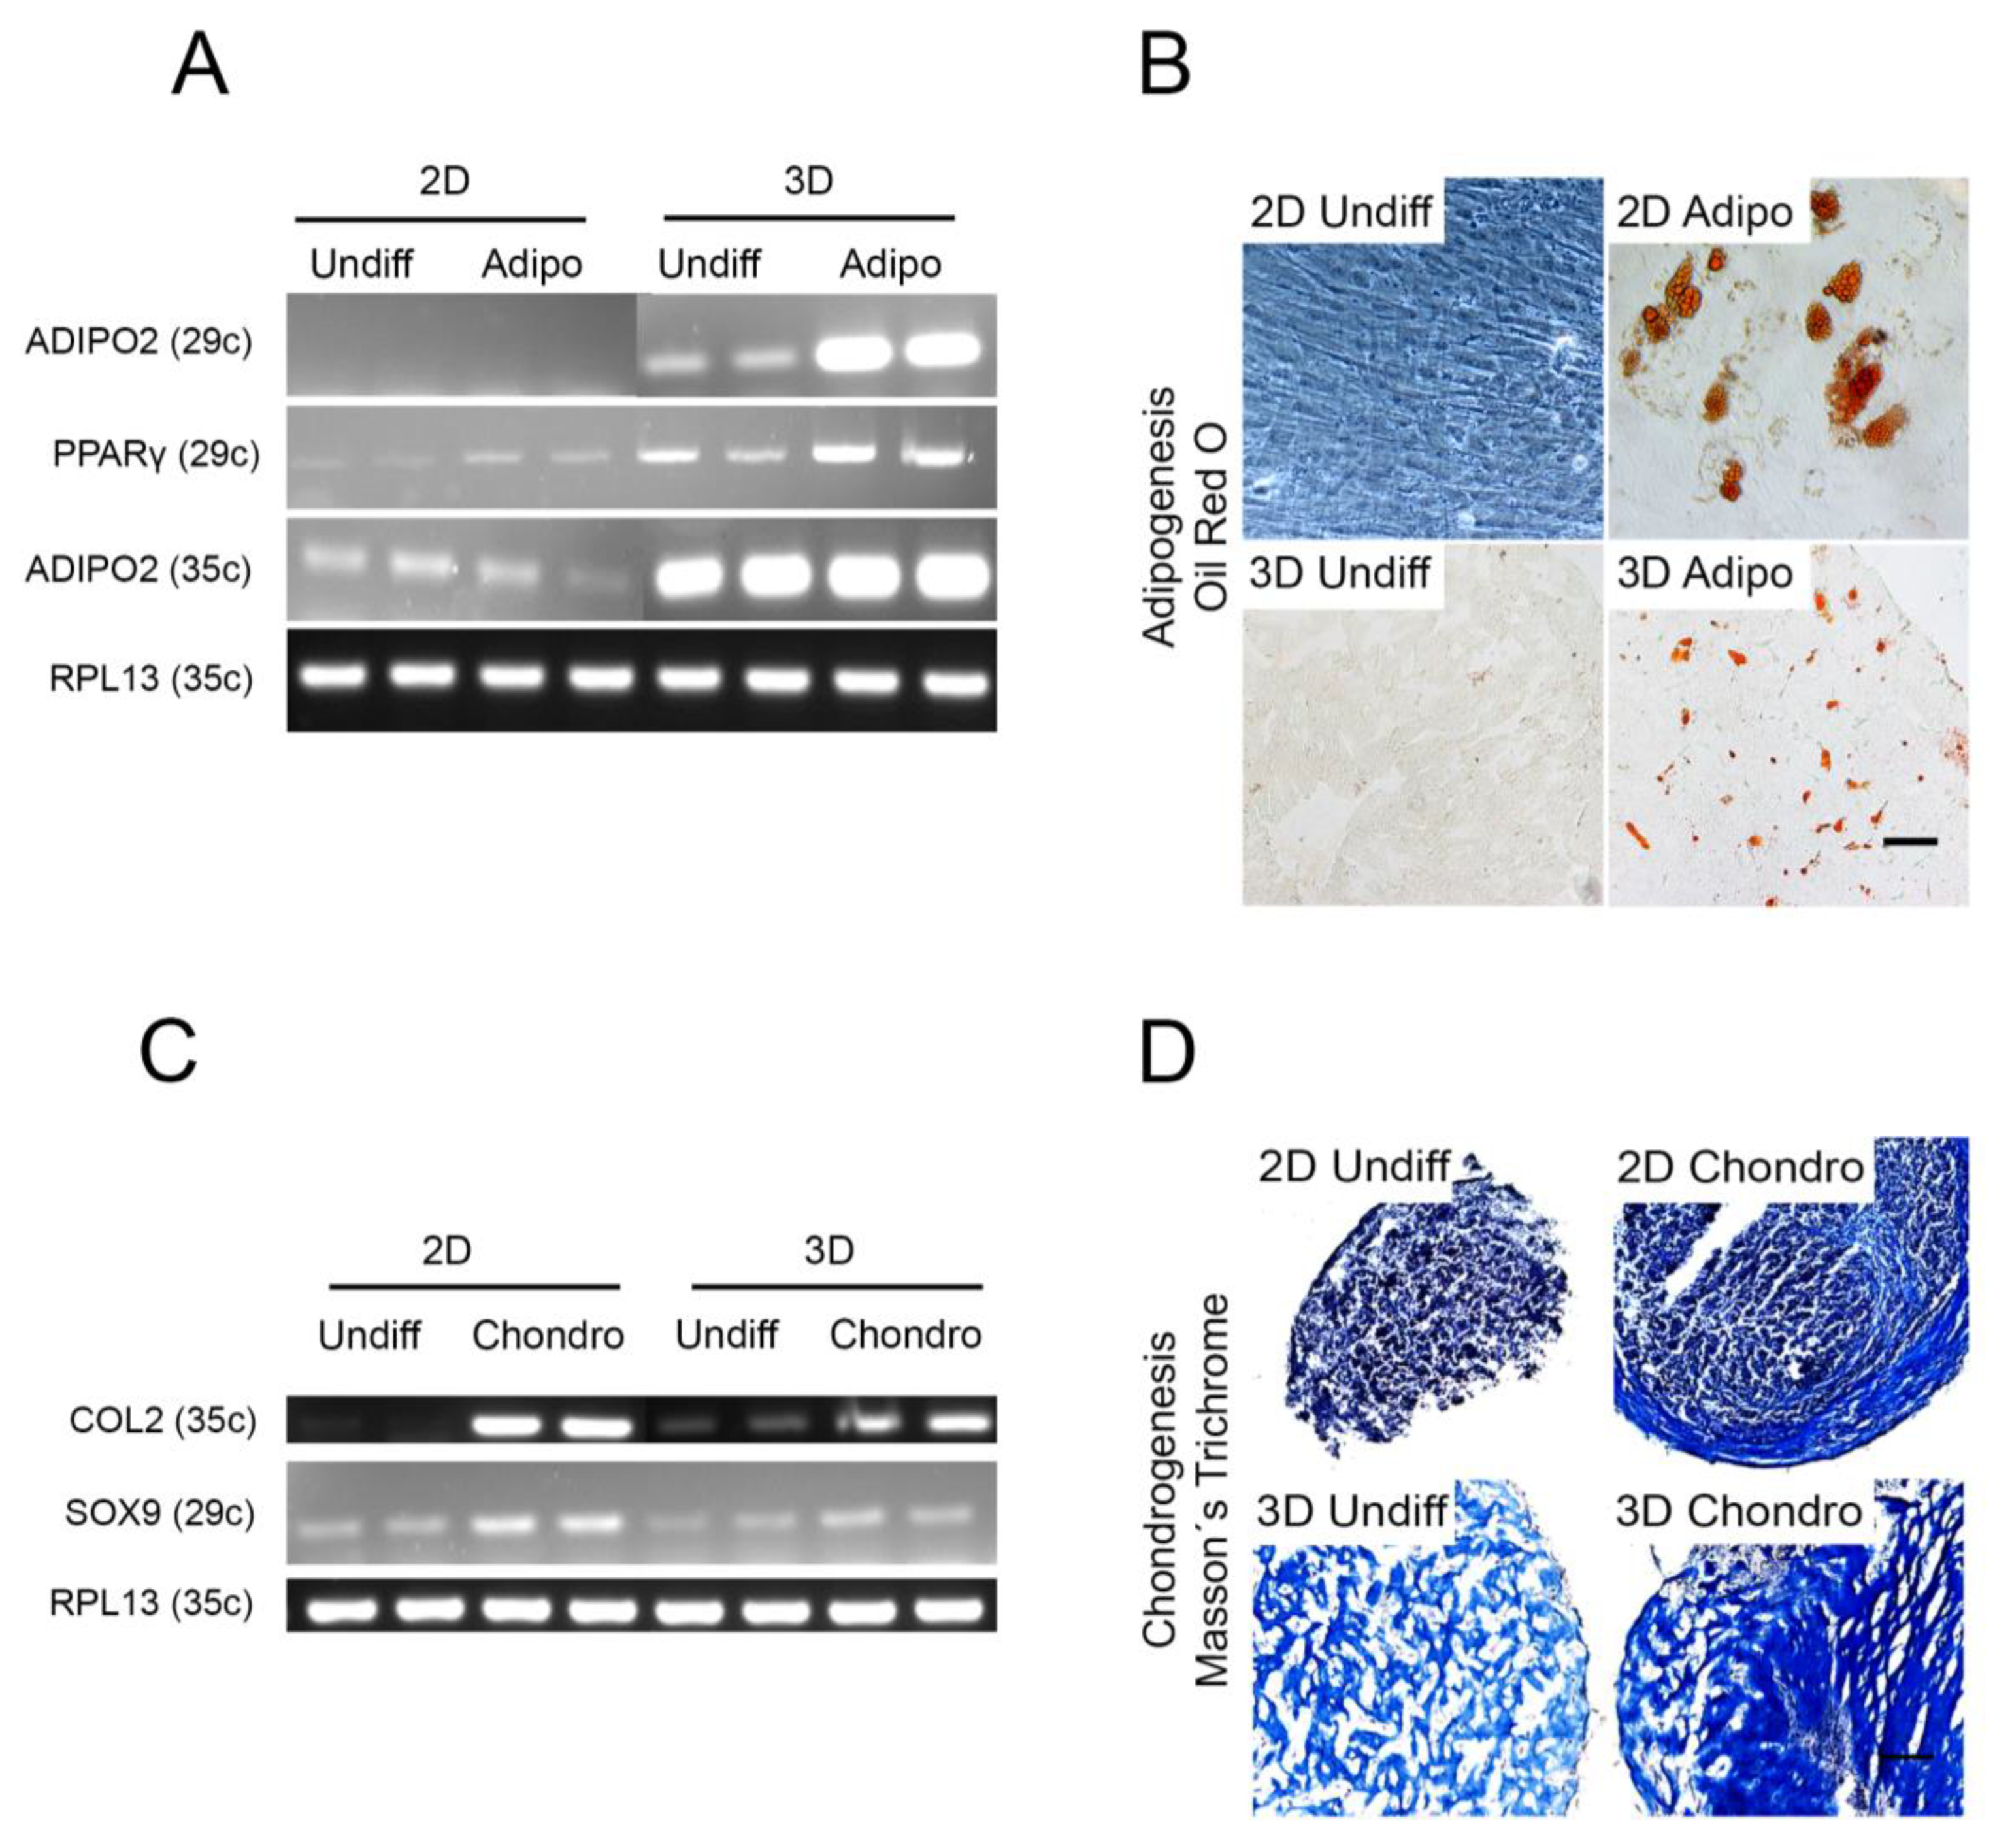
2.6. Other Cell Lineages
3. Discussion
4. Materials and Methods
4.1. Tissue Harvest, Cell Isolation and Culture
4.2. Cell Proliferation and Colony-Forming UNIT Assay
4.3. Cell Characterization by Flow Cytometry
4.4. Commercial Gel Selection
4.5. Gel-Cell Optimization
4.6. Gel Casting, Differentiation, and Harvest
4.7. Histochemistry
4.8. Immunohistochemistry (IHC)
4.9. Semi-Quantitative and Quantitative RT-PCR
4.10. NanoString nCounter Human Bone-Related Gene Expression Analysis
4.11. Statistical Analysis
Supplementary Materials
Author Contributions
Funding
Institutional Review Board Statement
Informed Consent Statement
Data Availability Statement
Acknowledgments
Conflicts of Interest
References
- Bodic, F.; Hamel, L.; Lerouxel, E.; Baslé, M.F.; Chappard, D. Bone loss and teeth. Jt. Bone Spine 2005, 72, 215–221. [Google Scholar] [CrossRef]
- Tonelli, P.; Duvina, M.; Barbato, L.; Biondi, E.; Nuti, N.; Brancato, L.; Rose, G.D. Bone regeneration in dentistry. Clin. Cases Miner. Bone Metab. 2011, 8, 24–28. [Google Scholar]
- Sakkas, A.; Wilde, F.; Heufelder, M.; Winter, K.; Schramm, A. Autogenous bone grafts in oral implantology—Is it still a “gold standard”? A consecutive review of 279 patients with 456 clinical procedures. Int. J. Implant Dent. 2017, 3, 23. [Google Scholar] [CrossRef] [PubMed]
- Schmidt, A.H. Autologous bone graft: Is it still the gold standard? Injury 2021, 52, S18–S22. [Google Scholar] [CrossRef]
- Campana, V.; Milano, G.; Pagano, E.; Barba, M.; Cicione, C.; Salonna, G.; Lattanzi, W.; Logroscino, G. Bone substitutes in orthopaedic surgery: From basic science to clinical practice. J. Mater. Sci. Mater. Med. 2014, 25, 2445–2461. [Google Scholar] [CrossRef] [PubMed]
- Yamada, Y.; Boo, J.S.; Ozawa, R.; Nagasaka, T.; Okazaki, Y.; Hata, K.; Ueda, M. Bone regeneration following injection of mesenchymal stem cells and fibrin glue with a biodegradable scaffold. J. Cranio-Maxillofac. Surg. 2003, 31, 27–33. [Google Scholar] [CrossRef]
- Chen, G.; Lv, Y. Decellularized bone matrix scaffold for bone regeneration. Methods Mol. Biol. 2018, 1577, 239–254. [Google Scholar] [CrossRef] [PubMed]
- Mebarki, M.; Coquelin, L.; Layrolle, P.; Battaglia, S.; Tossou, M.; Hernigou, P.; Rouard, H.; Chevallier, N. Enhanced human bone marrow mesenchymal stromal cell adhesion on scaffolds promotes cell survival and bone formation. Acta Biomater. 2017, 59, 94–107. [Google Scholar] [CrossRef] [PubMed]
- Knight, M.N.; Hankenson, K.D. Mesenchymal stem cells in bone regeneration. Adv. Wound Care 2013, 2, 306–316. [Google Scholar] [CrossRef] [PubMed]
- Jin, Y.-Z.; Lee, J.H. Mesenchymal stem cell therapy for bone regeneration. Clin. Orthop. Surg. 2018, 10, 271–278. [Google Scholar] [CrossRef]
- Iaquinta, M.R.; Mazzoni, E.; Bononi, I.; Rotondo, J.C.; Mazziotta, C.; Montesi, M.; Sprio, S.; Tampieri, A.; Tognon, M.; Martini, F. Adult stem cells for bone regeneration and repair. Front. Cell Dev. Biol. 2019, 7, 268. [Google Scholar] [CrossRef]
- Dvořáková, J.; Trousil, J.; Podhorská, B.; Mikšovská, Z.; Janoušková, O.; Proks, V. Enzymatically Cross-linked Hydrogels Based on Synthetic Poly(α-amino acid)s Functionalized with RGD Peptide for 3D Mesenchymal Stem Cell Culture. Biomacromolecules 2021, 22, 1417–1431. [Google Scholar] [CrossRef] [PubMed]
- Vainieri, M.L.; Lolli, A.; Kops, N.; D’Atri, D.; Eglin, D.; Yayon, A.; Alini, M.; Grad, S.; Sivasubramaniyan, K.; van Osch, G.J.V.M. Evaluation of biomimetic hyaluronic-based hydrogels with enhanced endogenous cell recruitment and cartilage matrix formation. Acta Biomater. 2020, 101, 293–303. [Google Scholar] [CrossRef] [PubMed]
- Friedenstein, A.J.; Deriglasova, U.F.; Kulagina, N.N.; Panasuk, A.F.; Rudakowa, S.F.; Luria, E.A.; Ruadkow, I.A. Precursors for fibroblasts in different populations of hematopoietic cells as detected by the in vitro colony assay method. Exp. Hematol. 1974, 2, 83–92. [Google Scholar] [PubMed]
- Chieh, H.-F.; Sun, Y.; Liao, J.-D.; Su, F.-C.; Zhao, C.; Amadio, P.C.; An, K.-N. Effects of cell concentration and collagen concentration on contraction kinetics and mechanical properties in a bone marrow stromal cell-collagen construct. J. Biomed. Mater. Res. Part A 2010, 93, 1132–1139. [Google Scholar] [CrossRef] [PubMed]
- Zhao, Q.; Li, G.; Wang, T.; Jin, Y.; Lu, W.; Ji, J. Human periodontal ligament stem cells transplanted with nanohydroxyapatite/chitosan/gelatin 3D porous scaffolds promote jaw bone regeneration in swine. Stem Cells Dev. 2021, 30, 548–559. [Google Scholar] [CrossRef] [PubMed]
- Livingston, T.L.; Gordon, S.; Archambault, M.; Kadiyala, S.; McIntosh, K.; Smith, A.; Peter, S.J. Mesenchymal stem cells combined with biphasic calcium phosphate ceramics promote bone regeneration. J. Mater. Sci. Mater. Med. 2003, 14, 211–218. [Google Scholar] [CrossRef]
- Mazzoni, E.; Mazziotta, C.; Iaquinta, M.R.; Lanzillotti, C.; Fortini, F.; D’Agostino, A.; Trevisiol, L.; Nocini, R.; Barbanti-Brodano, G.; Mescola, A.; et al. Enhanced osteogenic differentiation of human bone marrow-derived mesenchymal stem cells by a hybrid hydroxylapatite/collagen scaffold. Front. Cell Dev. Biol. 2021, 8, 610570. [Google Scholar] [CrossRef]
- Carter, K.; Lee, H.J.; Na, K.S.; Fernandes-Cunha, G.M.; Blanco, I.J.; Djalilian, A.; Myung, D. Characterizing the impact of 2D and 3D culture conditions on the therapeutic effects of human mesenchymal stem cell secretome on corneal wound healing in vitro and ex vivo. Acta Biomater. 2019, 99, 247–257. [Google Scholar] [CrossRef]
- Jensen, C.; Teng, Y. Is It Time to Start Transitioning From 2D to 3D Cell Culture? Front. Mol. Biosci. 2020, 7, 33. [Google Scholar] [CrossRef] [PubMed]
- Klumpers, D.D.; Zhao, X.; Mooney, D.J.; Smit, T.H. Cell mediated contraction in 3D cell-matrix constructs leads to spatially regulated osteogenic differentiation. Integr. Biol. 2013, 5, 1174–1183. [Google Scholar] [CrossRef][Green Version]
- Kraus, K.H.; Kirker-Head, C. Mesenchymal stem cells and bone regeneration. Vet. Surg. 2006, 35, 232–242. [Google Scholar] [CrossRef] [PubMed]
- Bruder, S.P.; Jaiswal, N.; Ricalton, N.S.; Mosca, J.D.; Kraus, K.H.; Kadiyala, S. Mesenchymal stem cells in osteobiology and applied bone regeneration. Clin. Orthop. Relat. Res. 1998, 355, S247–S256. [Google Scholar] [CrossRef] [PubMed]
- Kengelbach-Weigand, A.; Thielen, C.; Bäuerle, T.; Götzl, R.; Gerber, T.; Körner, C.; Beier, J.P.; Horch, R.E.; Boos, A.M. Personalized medicine for reconstruction of critical-size bone defects—A translational approach with customizable vascularized bone tissue. NPJ Regen. Med. 2021, 6, 49. [Google Scholar] [CrossRef]
- Bou-Ghannam, S.; Kim, K.; Grainger, D.W.; Okano, T. 3D cell sheet structure augments mesenchymal stem cell cytokine production. Sci. Rep. 2021, 11, 8170. [Google Scholar] [CrossRef]
- Ricard-Blum, S. The collagen family. Cold Spring Harb. Perspect. Biol. 2011, 3, a004978. [Google Scholar] [CrossRef]
- Lee, A.; Hudson, A.R.; Shiwarski, D.J.; Tashman, J.W.; Hinton, T.J.; Yerneni, S.; Bliley, J.M.; Campbell, P.G.; Feinberg, A.W. 3D bioprinting of collagen to rebuild components of the human heart. Science 2019, 365, 482–487. [Google Scholar] [CrossRef]
- Dinescu, S.; Albu Kaya, M.; Chitoiu, L.; Ignat, S.; Kaya, D.A.; Costache, M. Collagen-Based Hydrogels and Their Applications for Tissue Engineering and Regenerative Medicine. In Cellulose-Based Superabsorbent Hydrogels; Mondal, M.I.H., Ed.; Springer International Publishing: Cham, Switzerland, 2019; pp. 1643–1664. [Google Scholar]
- Sbricoli, L.; Guazzo, R.; Annunziata, M.; Gobbato, L.; Bressan, E.; Nastri, L. Selection of Collagen Membranes for Bone Regeneration: A Literature Review. Materials 2020, 13, 786. [Google Scholar] [CrossRef] [PubMed]
- Zhu, G.; Zhang, T.; Chen, M.; Yao, K.; Huang, X.; Zhang, B.; Li, Y.; Liu, J.; Wang, Y.; Zhao, Z. Bone physiological microenvironment and healing mechanism: Basis for future bone-tissue engineering scaffolds. Bioact. Mater. 2021, 6, 4110–4140. [Google Scholar] [CrossRef] [PubMed]
- Kon, T.; Cho, T.J.; Aizawa, T.; Yamazaki, M.; Nooh, N.; Graves, D.; Gerstenfeld, L.C.; Einhorn, T.A. Expression of osteoprotegerin, receptor activator of NF-κB ligand (osteoprotegerin ligand) and related proinflammatory cytokines during fracture healing. J. Bone Miner. Res. 2001, 16, 1004–1014. [Google Scholar] [CrossRef]
- Anton, K.; Banerjee, D.; Glod, J. Macrophage-associated mesenchymal stem cells assume an activated, migratory, pro-inflammatory phenotype with increased IL-6 and CXCL10 secretion. PLoS ONE 2012, 7, e35036. [Google Scholar] [CrossRef] [PubMed]
- Chang, M.K.; Raggatt, L.J.; Alexander, K.A.; Kuliwaba, J.S.; Fazzalari, N.L.; Schroder, K.; Maylin, E.R.; Ripoll, V.M.; Hume, D.A.; Pettit, A.R. Osteal tissue macrophages are intercalated throughout human and mouse bone lining tissues and regulate osteoblast function in vitro and in vivo. J. Immunol. 2008, 181, 1232–1244. [Google Scholar] [CrossRef] [PubMed]
- Bielby, R.; Jones, E.; McGonagle, D. The role of mesenchymal stem cells in maintenance and repair of bone. Injury 2007, 38 (Suppl. 1), S26–S32. [Google Scholar] [CrossRef] [PubMed]
- Li, X.; Jin, L.; Tan, Y. Different roles of matrix metalloproteinase 2 in osteolysis of skeletal dysplasia and bone metastasis (Review). Mol. Med. Rep. 2021, 23, 70. [Google Scholar] [CrossRef] [PubMed]
- Tokuhara, C.K.; Santesso, M.R.; de Oliveira, G.S.N.; da Silva Ventura, T.M.; Doyama, J.T.; Zambuzzi, W.F.; de Oliveira, R.C. Updating the role of matrix metalloproteinases in mineralized tissue and related diseases. J. Appl. Oral Sci. 2019, 27, e20180596. [Google Scholar] [CrossRef]
- Zhang, C.; Tang, W.; Li, Y. Matrix metalloproteinase 13 (MMP13) is a direct target of osteoblast-specific transcription factor osterix (Osx) in osteoblasts. PLoS ONE 2012, 7, e50525. [Google Scholar] [CrossRef]
- Almalki, S.G.; Agrawal, D.K. Effects of matrix metalloproteinases on the fate of mesenchymal stem cells. Stem Cell Res. Ther. 2016, 7, 129. [Google Scholar] [CrossRef]
- Arai, Y.; Choi, B.; Kim, B.J.; Park, S.; Park, H.; Moon, J.J.; Lee, S.H. Cryptic ligand on collagen matrix unveiled by MMP13 accelerates bone tissue regeneration via MMP13/Integrin α3/RUNX2 feedback loop. Acta Biomater. 2021, 125, 219–230. [Google Scholar] [CrossRef]
- Tang, S.Y.; Herber, R.P.; Ho, S.P.; Alliston, T. Matrix metalloproteinase-13 is required for osteocytic perilacunar remodeling and maintains bone fracture resistance. J. Bone Miner. Res. 2012, 27, 1936–1950. [Google Scholar] [CrossRef] [PubMed]
- Ortega, N.; Wang, K.; Ferrara, N.; Werb, Z.; Vu, T.H. Complementary interplay between matrix metalloproteinase-9, vascular endothelial growth factor and osteoclast function drives endochondral bone formation. Dis. Models Mech. 2010, 3, 224–235. [Google Scholar] [CrossRef] [PubMed]
- Jiang, L.; Sheng, K.; Wang, C.; Xue, D.; Pan, Z. The effect of MMP-2 inhibitor 1 on osteogenesis and angiogenesis during bone regeneration. Front. Cell Dev. Biol. 2021, 8, 596783. [Google Scholar] [CrossRef] [PubMed]
- Franch, J.; Barba, A.; Rappe, K.; Maazouz, Y.; Ginebra, M.-P. Use of three-dimensionally printed β-tricalcium phosphate synthetic bone graft combined with recombinant human bone morphogenic protein-2 to treat a severe radial atrophic nonunion in a Yorkshire terrier. Vet. Surg. 2020, 49, 1626–1631. [Google Scholar] [CrossRef] [PubMed]
- Liu, B.; Yin, N.B.; Xiao, R.; Li, B.H.; Li, H.D.; Chen, S.X.; Li, S.L.; Wang, Y.Q. Evaluating the efficacy of recombinant human bone morphogenic protein-2 in the treatment of alveolar clefts with autologous bone grafting using computer-aided engineering techniques. Br. J. Oral Maxillofac. Surg. 2021, 59, 757–762. [Google Scholar] [CrossRef]
- Hankenson, K.D.; Gagne, K.; Shaughnessy, M. Extracellular signaling molecules to promote fracture healing and bone regeneration. Adv. Drug Deliv. Rev. 2015, 94, 3–12. [Google Scholar] [CrossRef] [PubMed]
- Kolar, M.K.; Itte, V.N.; Kingham, P.J.; Novikov, L.N.; Wiberg, M.; Kelk, P. The neurotrophic effects of different human dental mesenchymal stem cells. Sci. Rep. 2017, 7, 12605. [Google Scholar] [CrossRef]
- Pettersson, L.F.; Kingham, P.J.; Wiberg, M.; Kelk, P. In Vitro Osteogenic Differentiation of Human Mesenchymal Stem Cells from Jawbone Compared with Dental Tissue. Tissue Eng. Regen. Med. 2017, 14, 763–774. [Google Scholar] [CrossRef]


| Antibody | Brand | Clone Number |
|---|---|---|
| CD73 | BD Pharmingen™ | Mouse IgG1, κ AD2 |
| CD90 | BD Pharmingen™ | Mouse BALB/c IgG1, κ 5E10 |
| CD105 | BD Pharmingen™ | Mouse BALB/c IgG1, κ, 266 |
| CD146 | BD Pharmingen™ | Mouse IgG1, κ, P1H12 |
| PE mouse IgG1, κ isotype control | BD Pharmingen™ | Mouse IgG1, κ MOPC-21 |
| PE hMSC negative cocktail | BD Stemflow™ | Mouse IgG1, κ CD34 (Clone 581) CD11b PE (Clone: ICRE44) CD19 PE (Clone: HIB19) CD45 PE (Clone: HI30) HLA-DR PE (Clone G46–6) |
| PE hMSC negative isotype control cocktail | BD Stemflow™ | Mouse IgG1, κ, PE (Clone × 40) |
| Type | Antibody | Reference | Dilution |
|---|---|---|---|
| Primary | Mouse monoclonal anti MMP13 | R&D Biosystems, MAB511 | 1:50 |
| Primary | Mouse monoclonal, anti-OCN | Novus Biologicals, H00000632-M01 | 1:100 |
| Primary | Mouse monoclonal, anti-OPN | Novus Biologicals, NB110-89062 | 1:100 |
| Secondary | Alexa FluorTM 488 Goat anti mouse | ThermoFisher, A11029 | 1:1000 |
| Primer | Forward (5′-3′) | Reverse (5′-3′) | Annealing Temperature (°C) |
|---|---|---|---|
| OPN | GCCGACCAAGGAAAACTCACT | GGCACAGGTGATGCCTAGGA | 64.7 |
| OCN | AGCAAAGGTGCAGCCTTTGT | GCGCCTGGGTCTCTTCACT | 63.2 |
| ADIPO2 | GGTGGTGGAATGCGTCATG | CAACGTCCCTTGGCTTATGC | 64.1 |
| ALP | GGAACTCCTGACCCTTGACC | TCCTGTTCAGCTCGTACTGC | 65.2 |
| PPARγ | CCGAGAAGGAGAAGCTGTTG | TCGGATATGAGAACCCCATC | 60.8 |
| RPL13a | AAGTACCAGGCAGT GACAG | CCTGTTTCCGTAGCCTCATG | 58 |
| SOX9 | GACTTCCGCGACGTGGAC | GTTGGGCGGCAGGTACTG | 57.5 |
| COL2A | AGACTGGCGAGACTTGCGTCTA | ATCTGGACGTTGGCAGTGTTG | 57.3 |
Publisher’s Note: MDPI stays neutral with regard to jurisdictional claims in published maps and institutional affiliations. |
© 2021 by the authors. Licensee MDPI, Basel, Switzerland. This article is an open access article distributed under the terms and conditions of the Creative Commons Attribution (CC BY) license (https://creativecommons.org/licenses/by/4.0/).
Share and Cite
Oliveros Anerillas, L.; Kingham, P.J.; Lammi, M.J.; Wiberg, M.; Kelk, P. Three-Dimensional Osteogenic Differentiation of Bone Marrow Mesenchymal Stem Cells Promotes Matrix Metallopeptidase 13 (MMP13) Expression in Type I Collagen Hydrogels. Int. J. Mol. Sci. 2021, 22, 13594. https://doi.org/10.3390/ijms222413594
Oliveros Anerillas L, Kingham PJ, Lammi MJ, Wiberg M, Kelk P. Three-Dimensional Osteogenic Differentiation of Bone Marrow Mesenchymal Stem Cells Promotes Matrix Metallopeptidase 13 (MMP13) Expression in Type I Collagen Hydrogels. International Journal of Molecular Sciences. 2021; 22(24):13594. https://doi.org/10.3390/ijms222413594
Chicago/Turabian StyleOliveros Anerillas, Luis, Paul J. Kingham, Mikko J. Lammi, Mikael Wiberg, and Peyman Kelk. 2021. "Three-Dimensional Osteogenic Differentiation of Bone Marrow Mesenchymal Stem Cells Promotes Matrix Metallopeptidase 13 (MMP13) Expression in Type I Collagen Hydrogels" International Journal of Molecular Sciences 22, no. 24: 13594. https://doi.org/10.3390/ijms222413594
APA StyleOliveros Anerillas, L., Kingham, P. J., Lammi, M. J., Wiberg, M., & Kelk, P. (2021). Three-Dimensional Osteogenic Differentiation of Bone Marrow Mesenchymal Stem Cells Promotes Matrix Metallopeptidase 13 (MMP13) Expression in Type I Collagen Hydrogels. International Journal of Molecular Sciences, 22(24), 13594. https://doi.org/10.3390/ijms222413594