
On the Dependence of Prion and Amyloid Structure on the Folding Environment

 ,
,  , and
, and
Abstract
:1. Introduction
2. Results
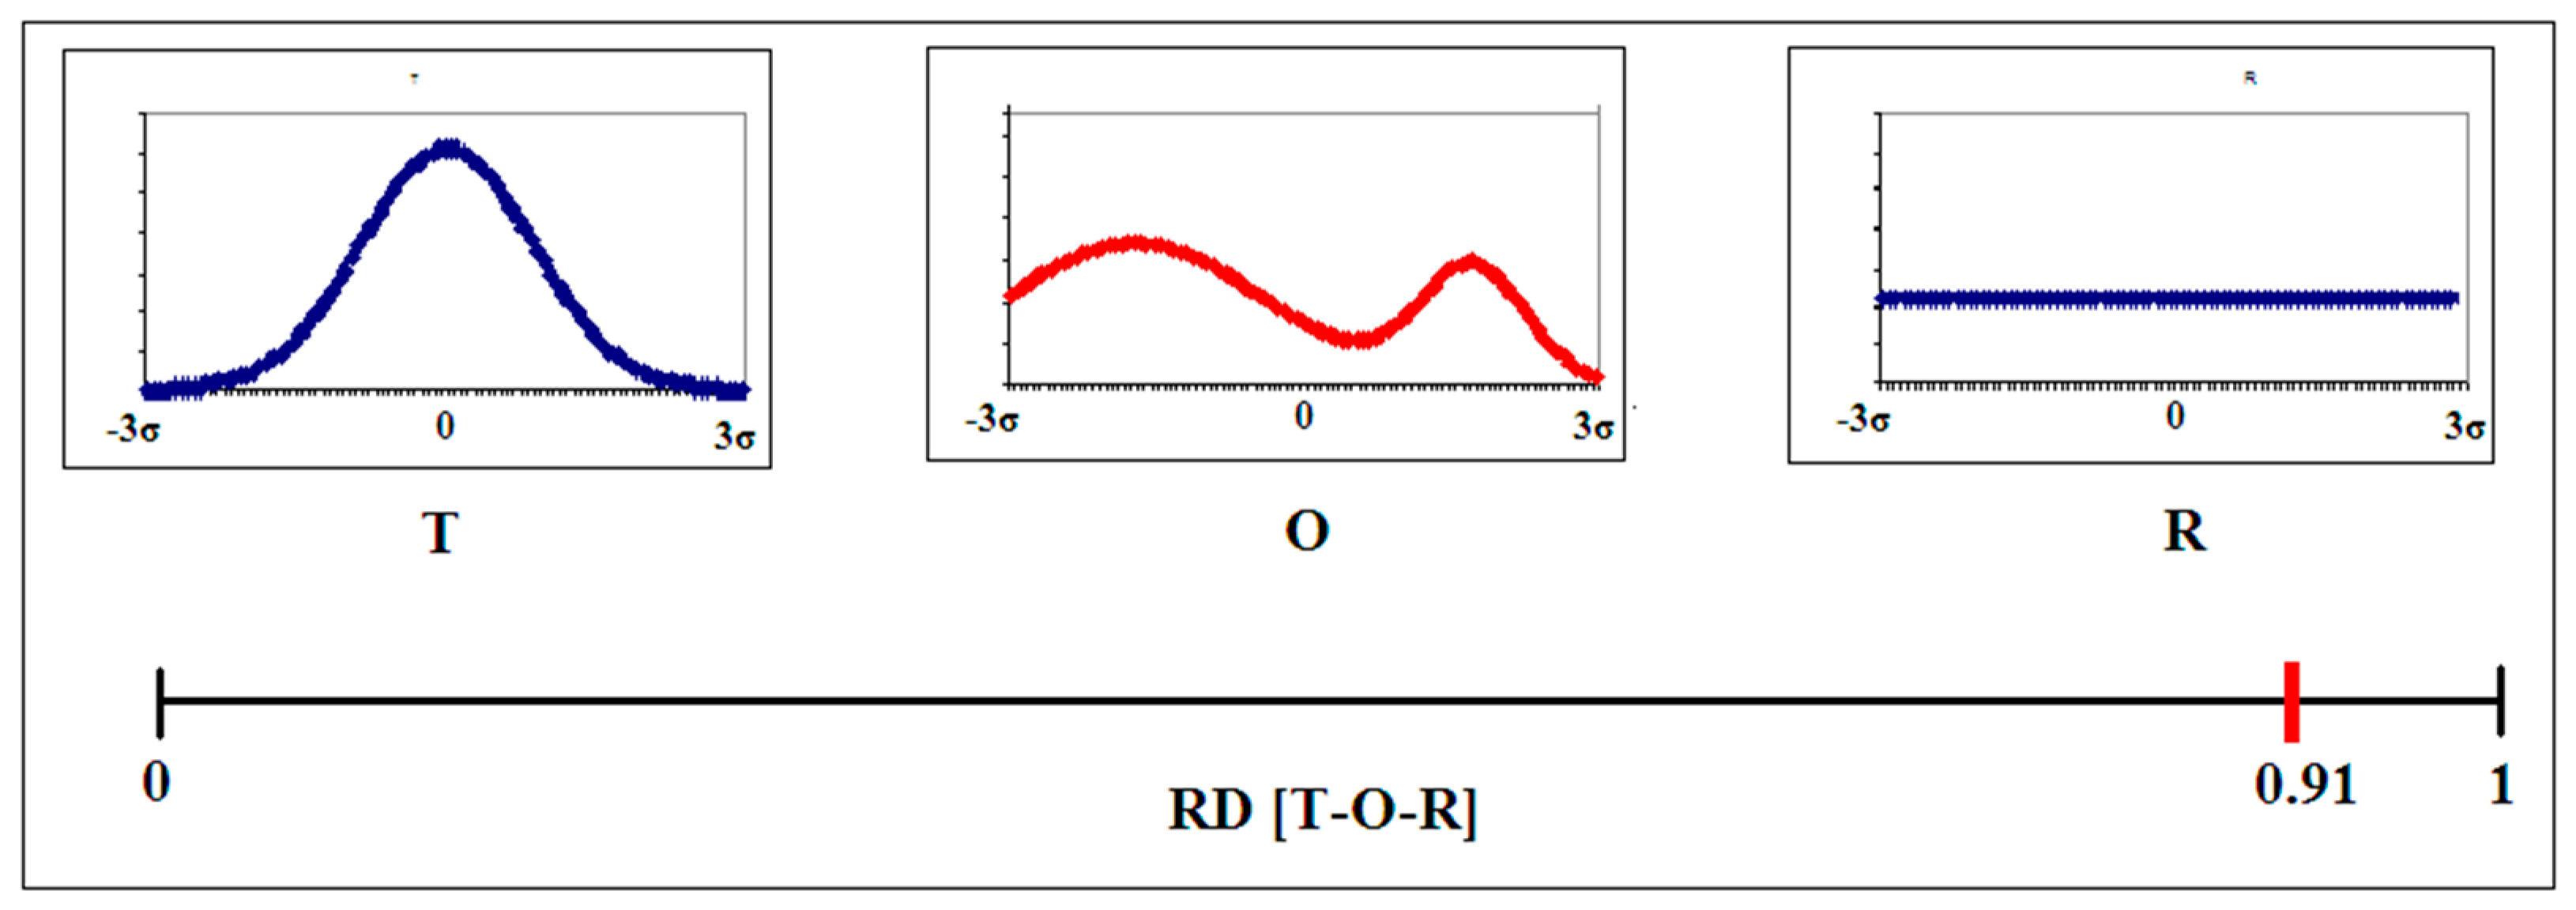
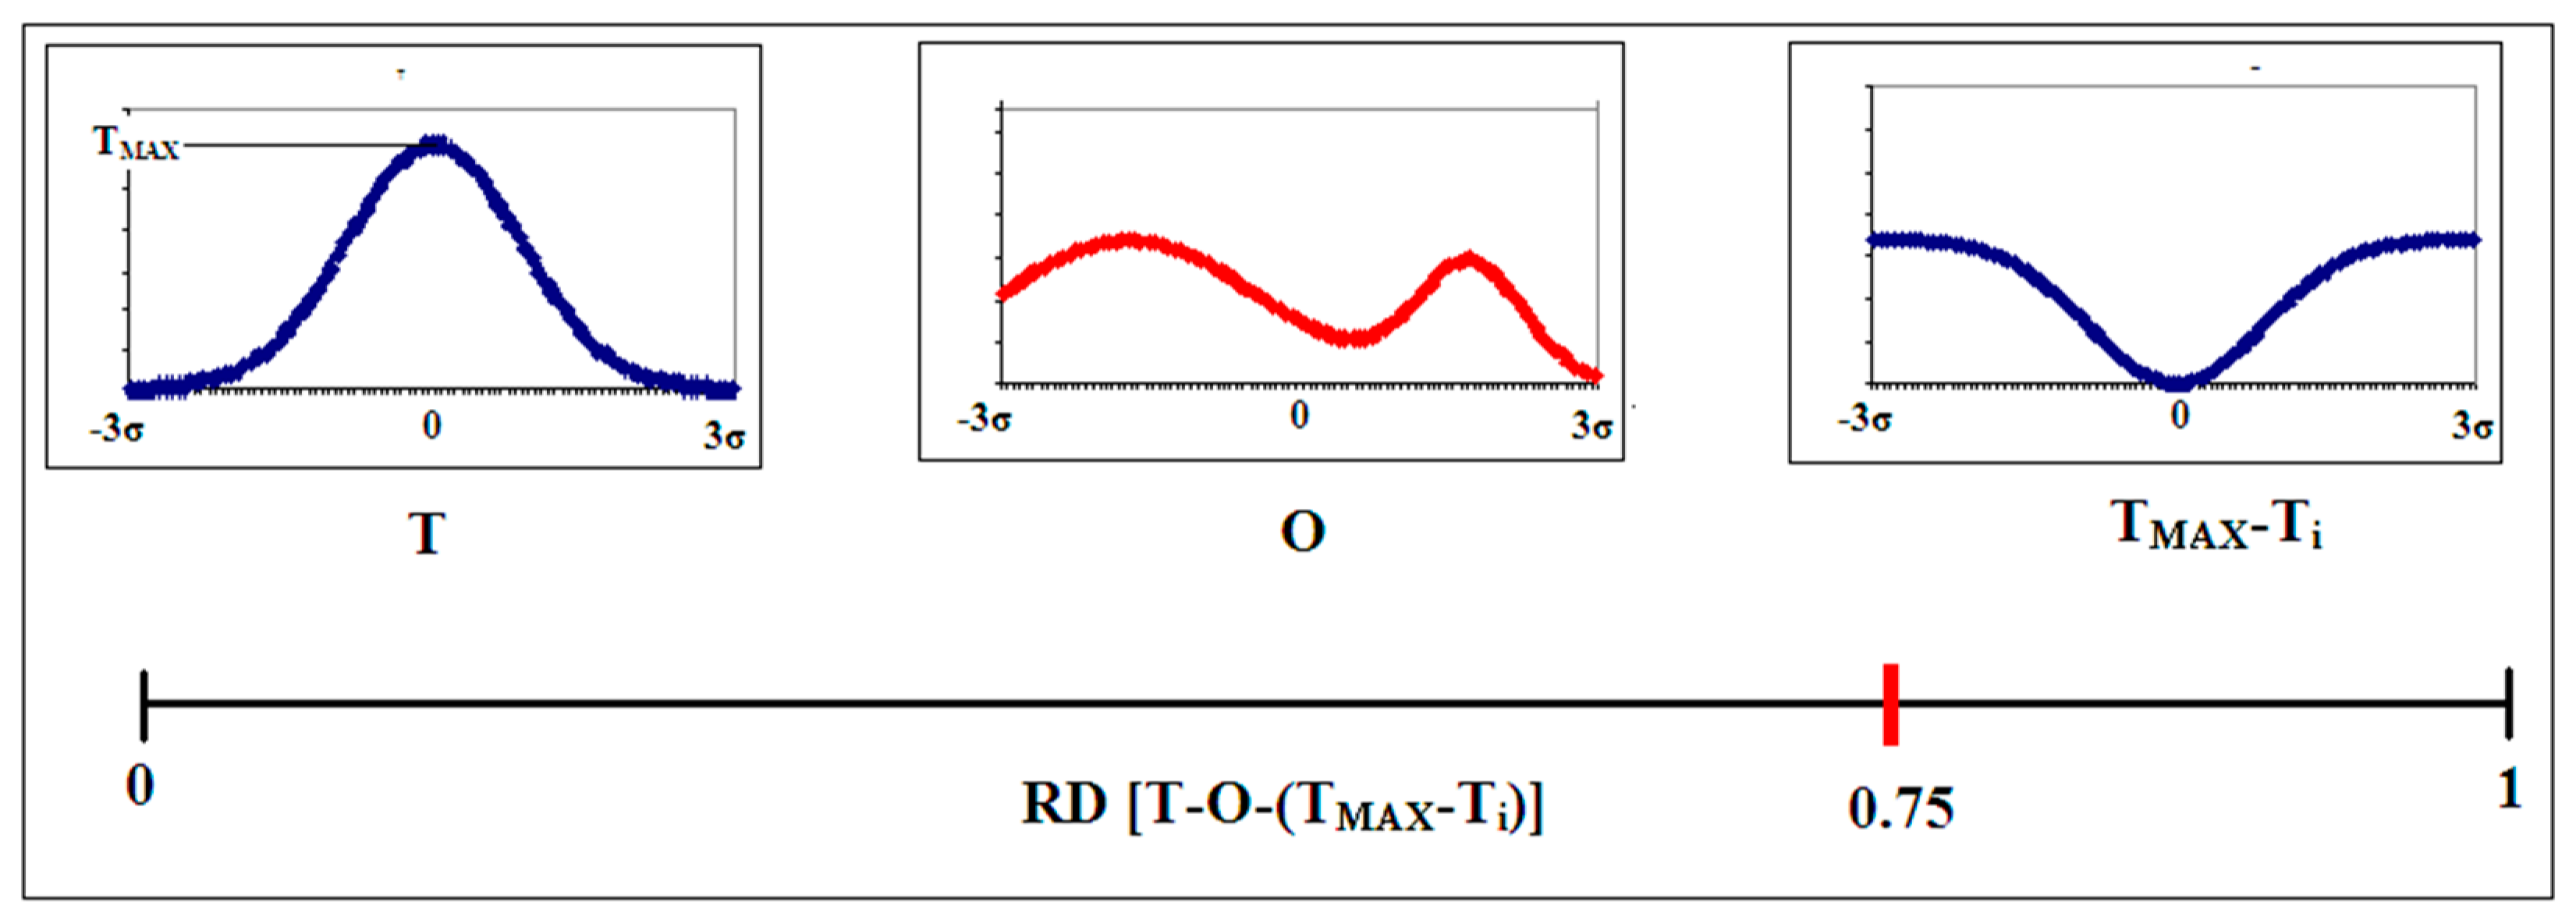
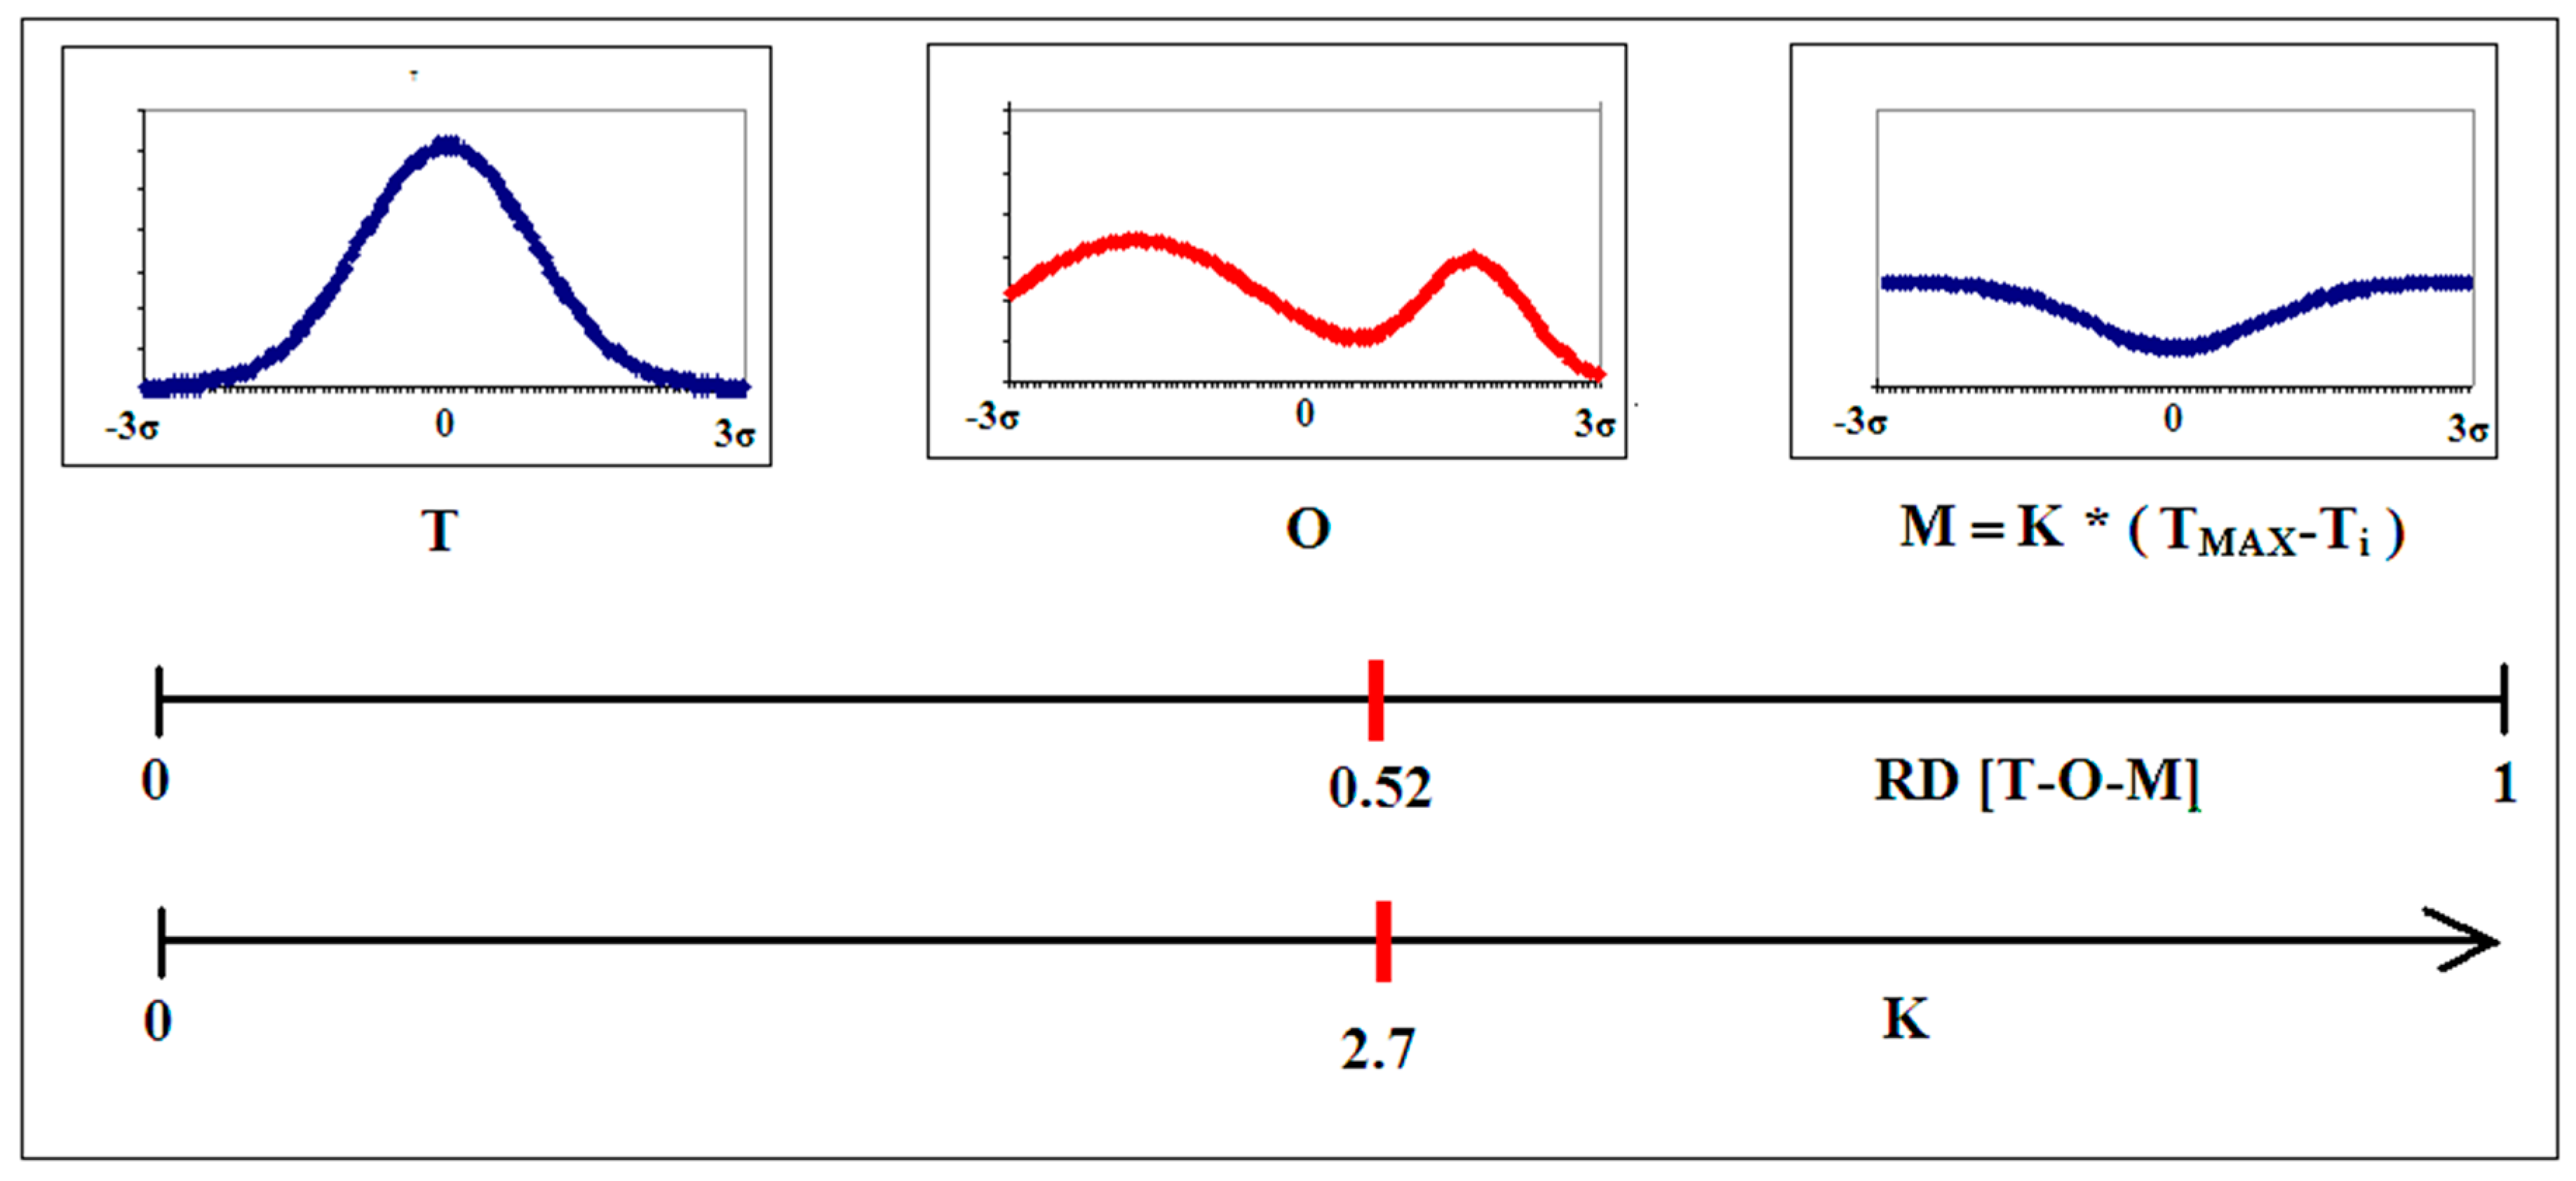
2.1. Description of the Model Used—The Fuzzy Oil Drop Model
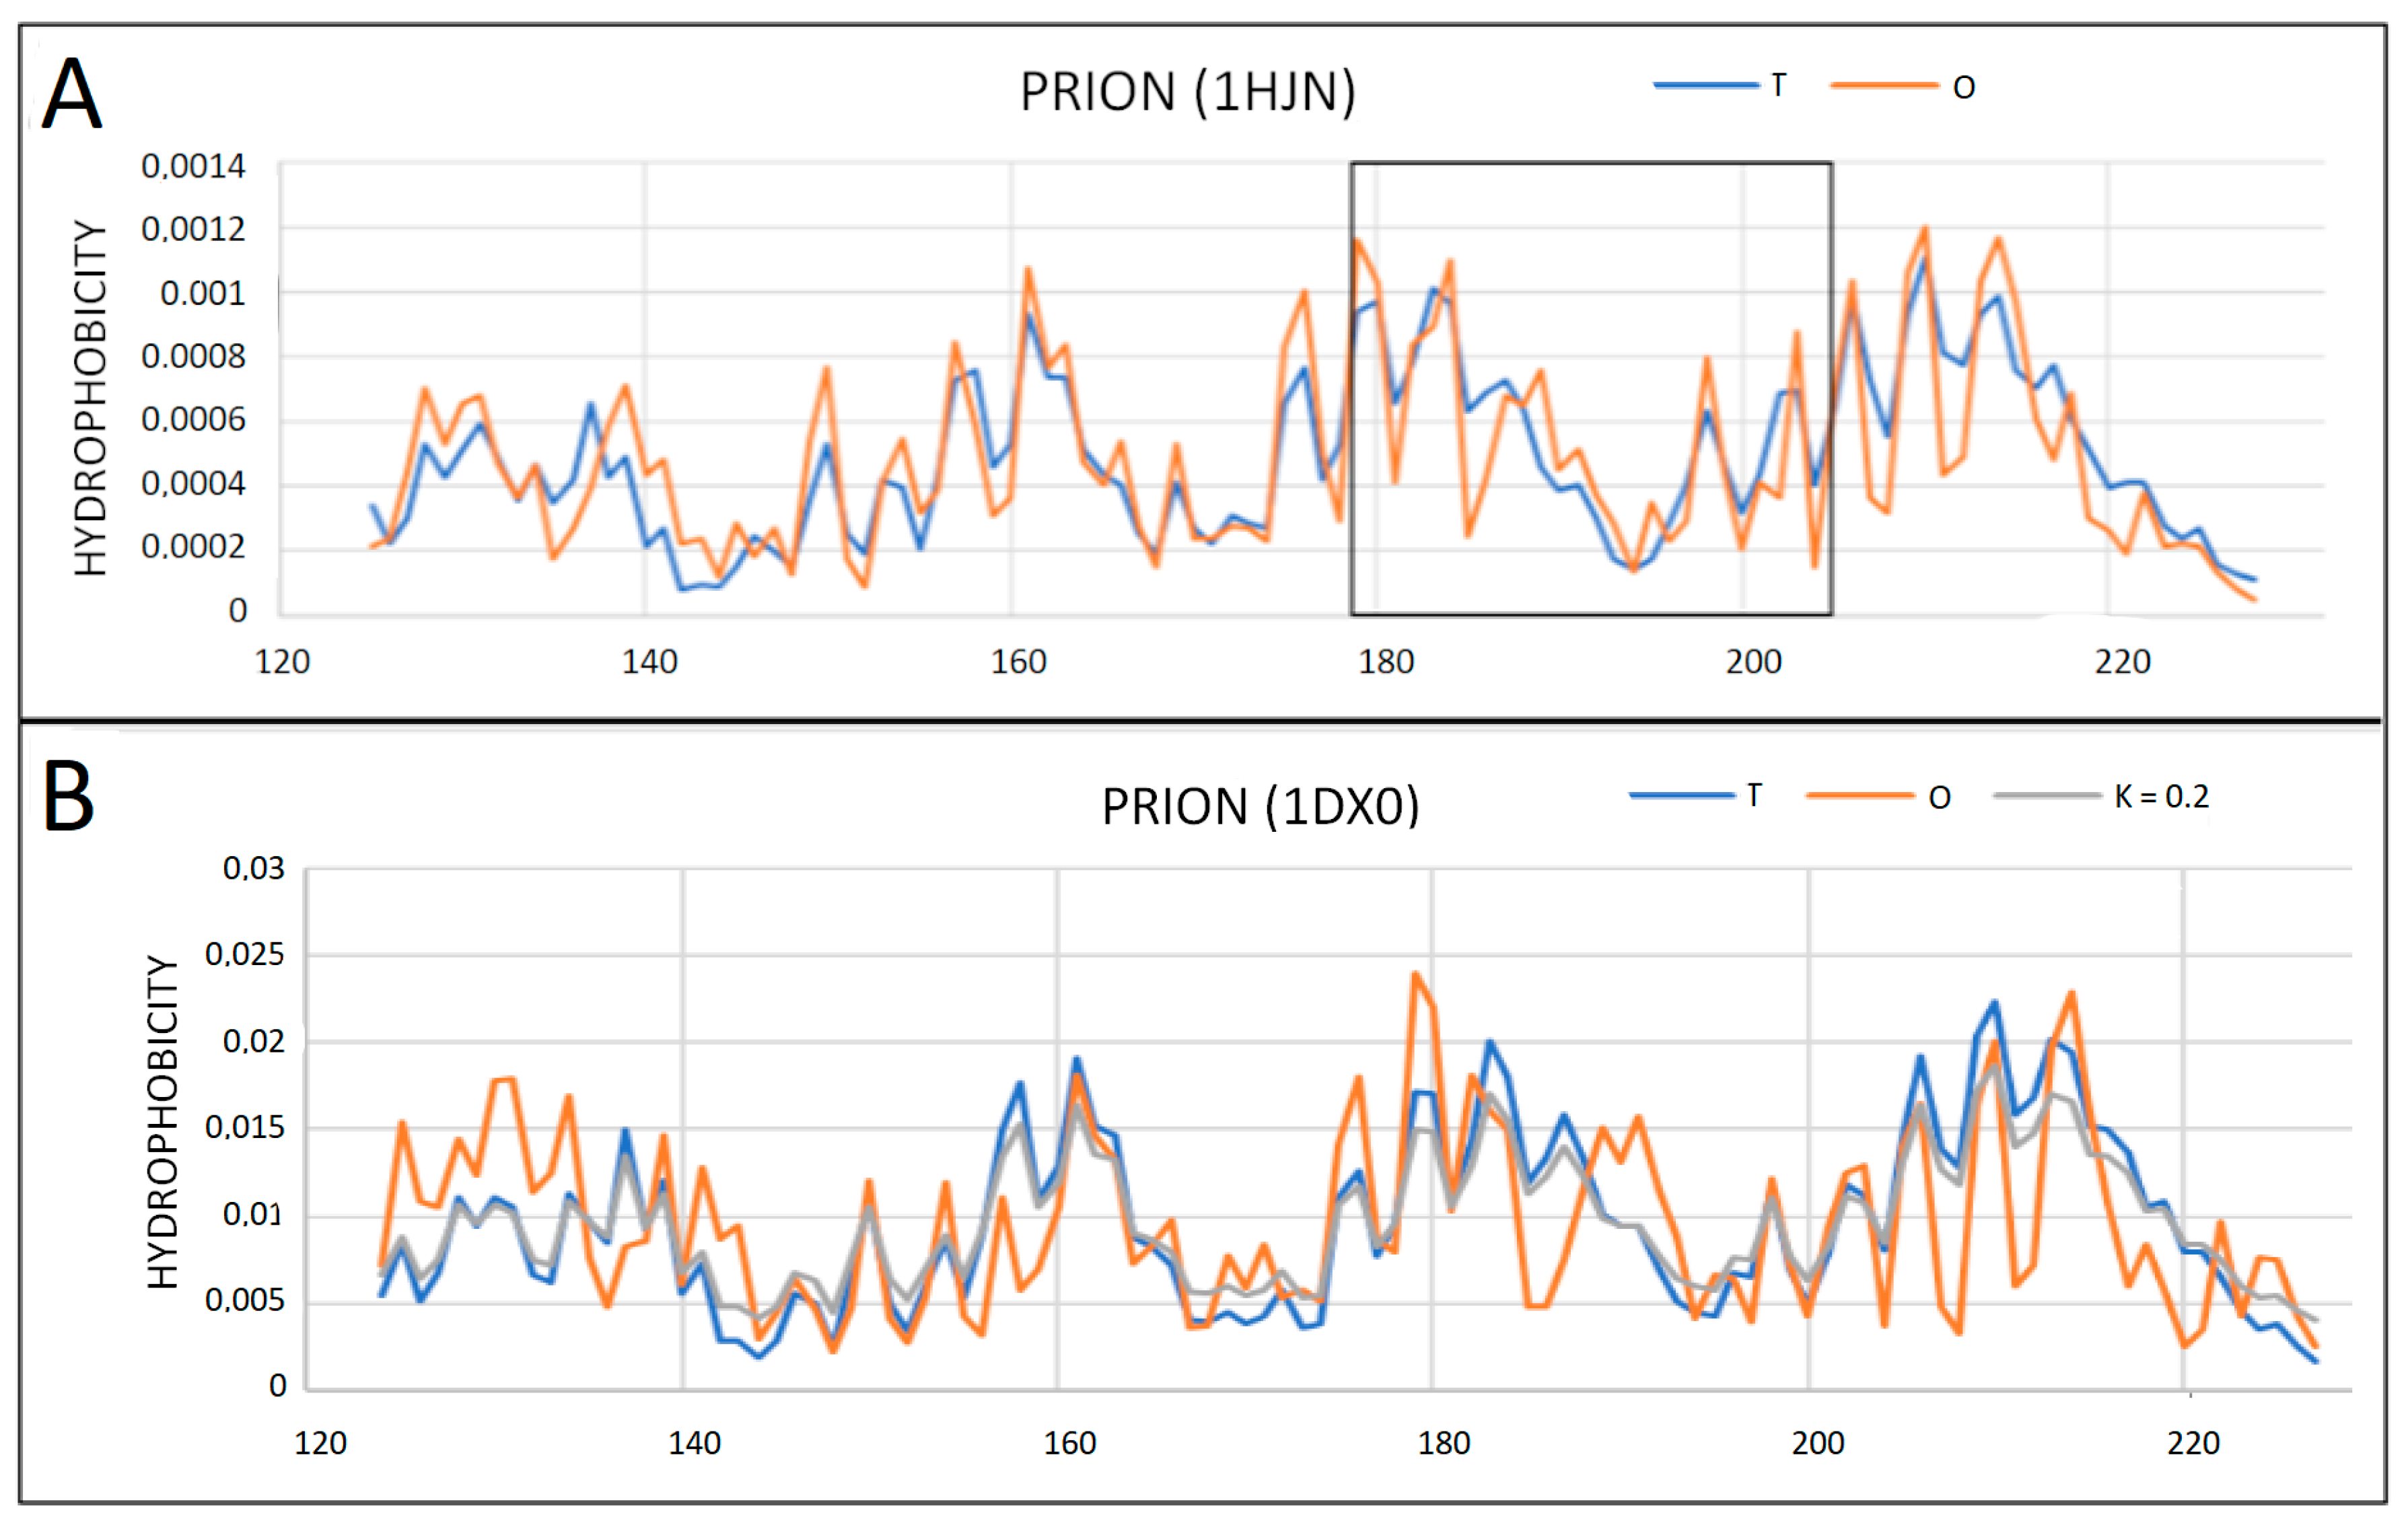
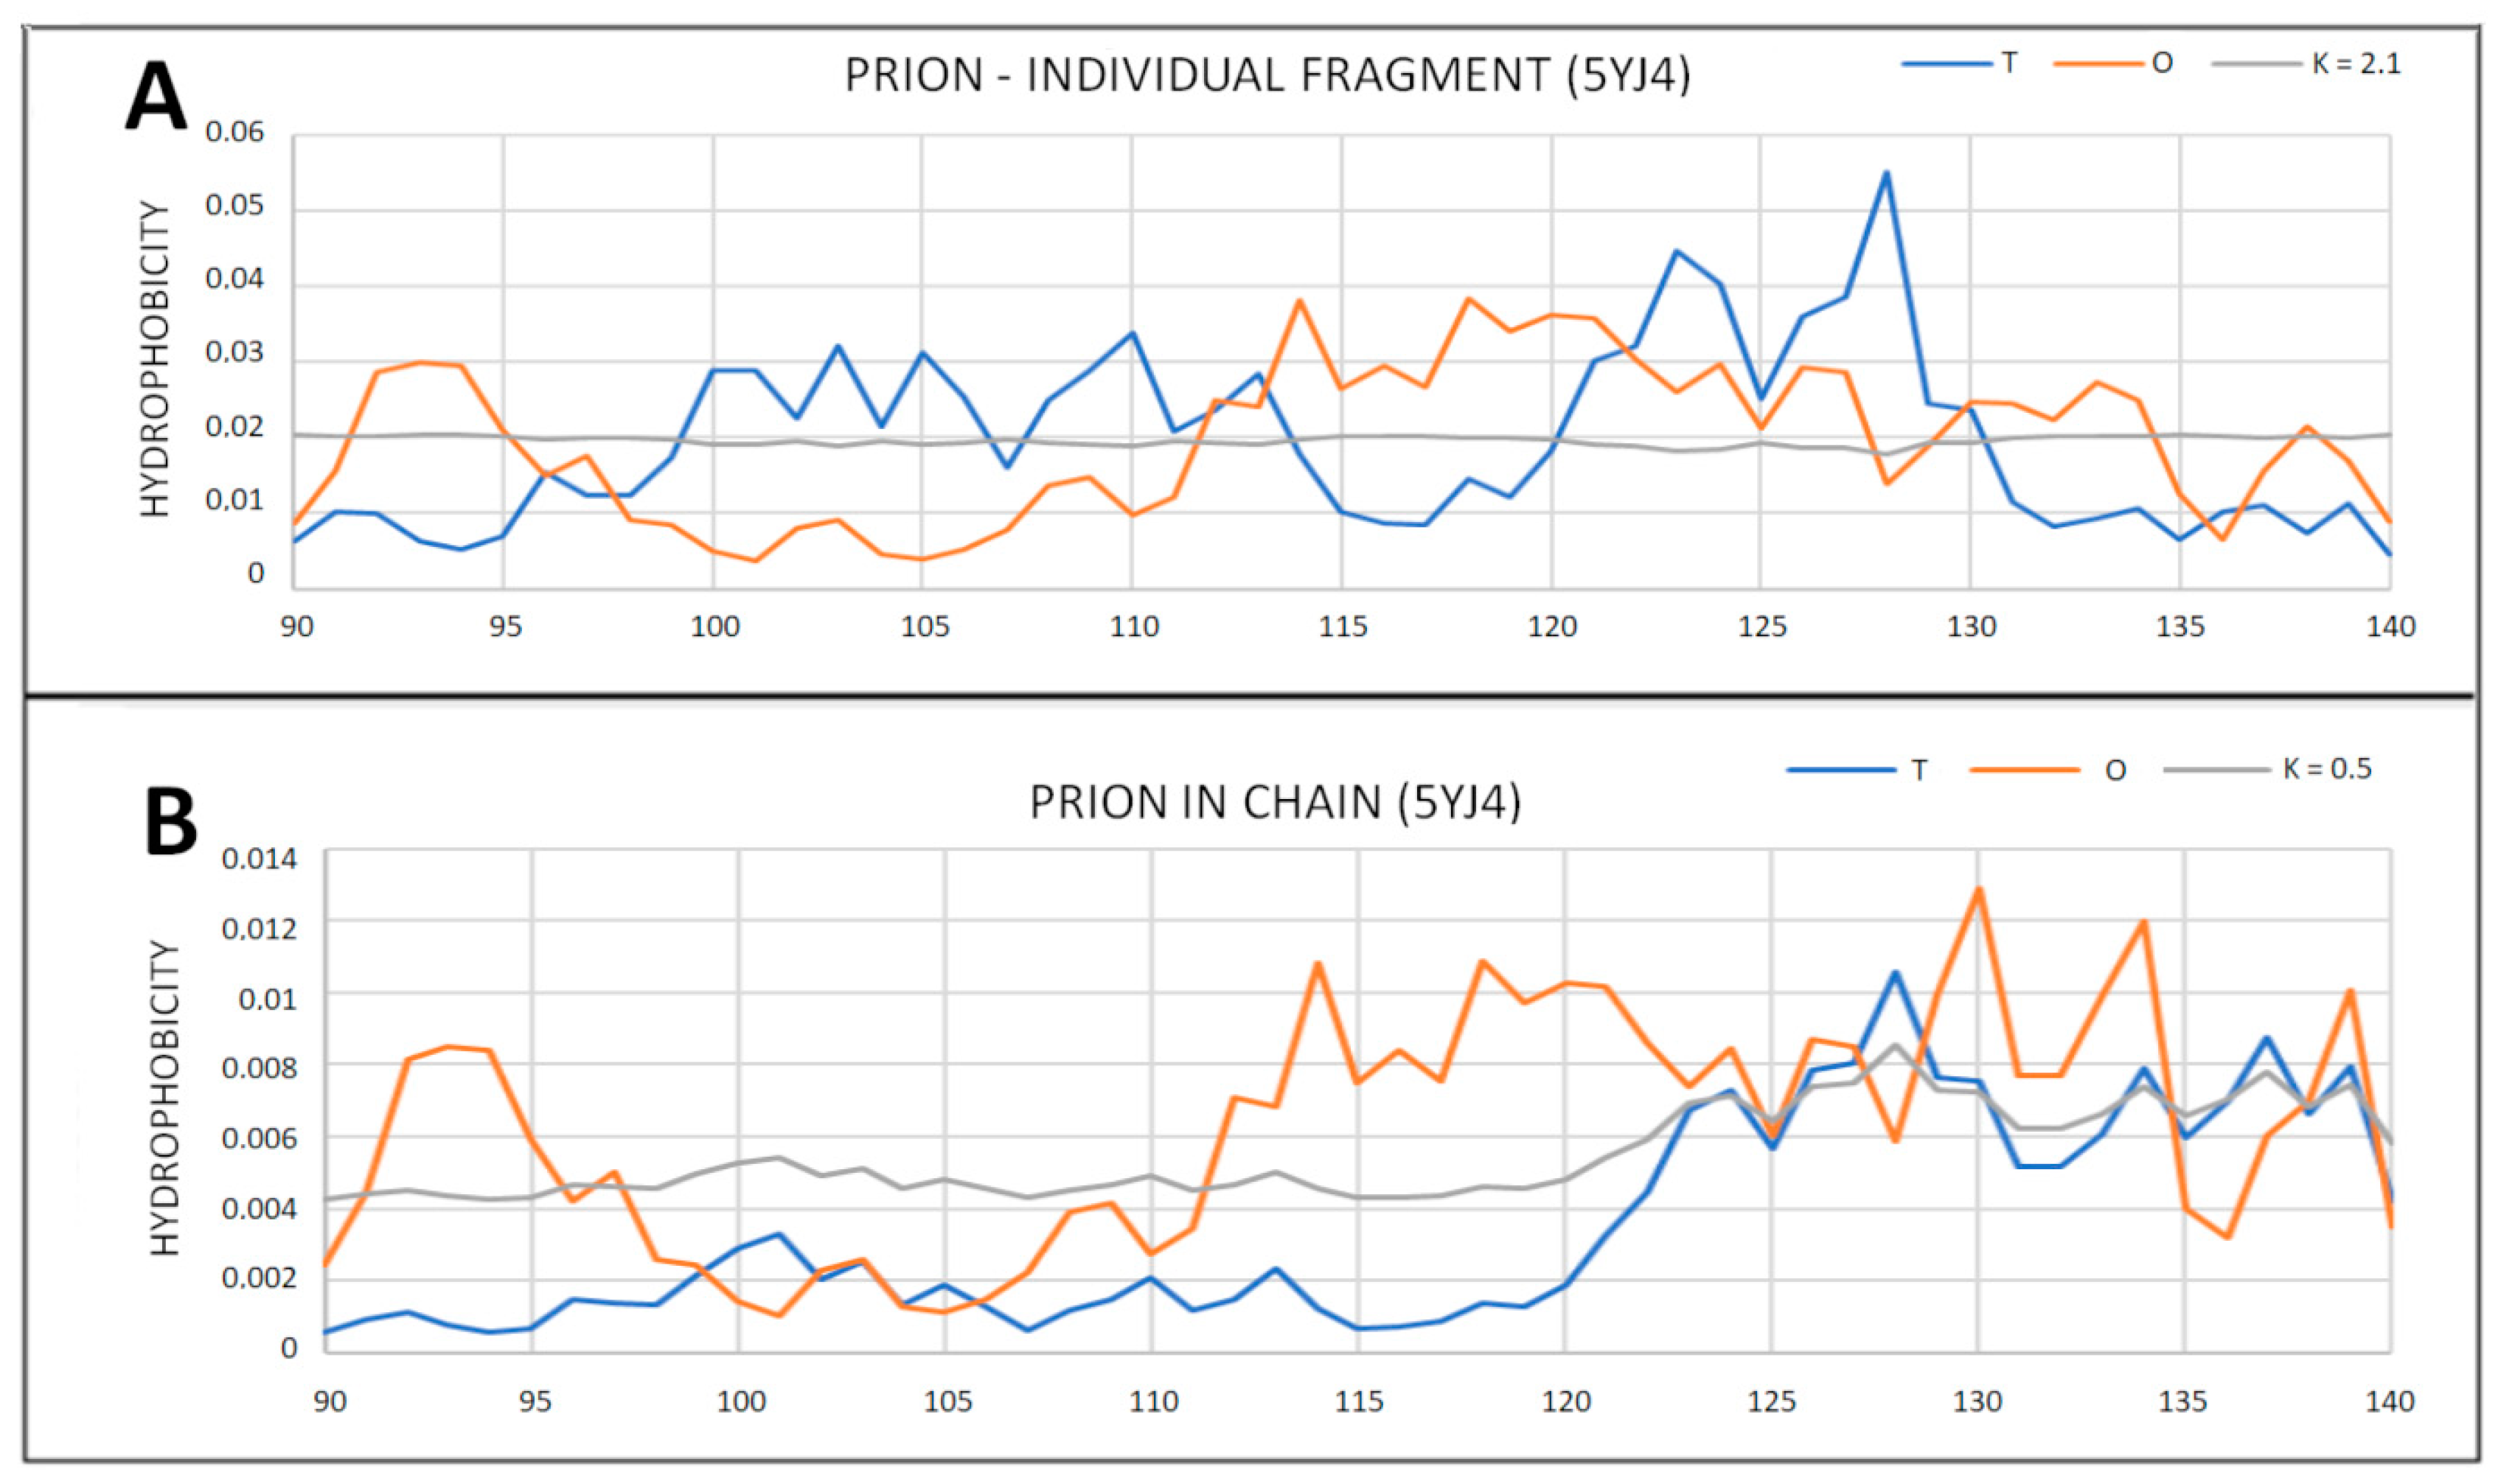
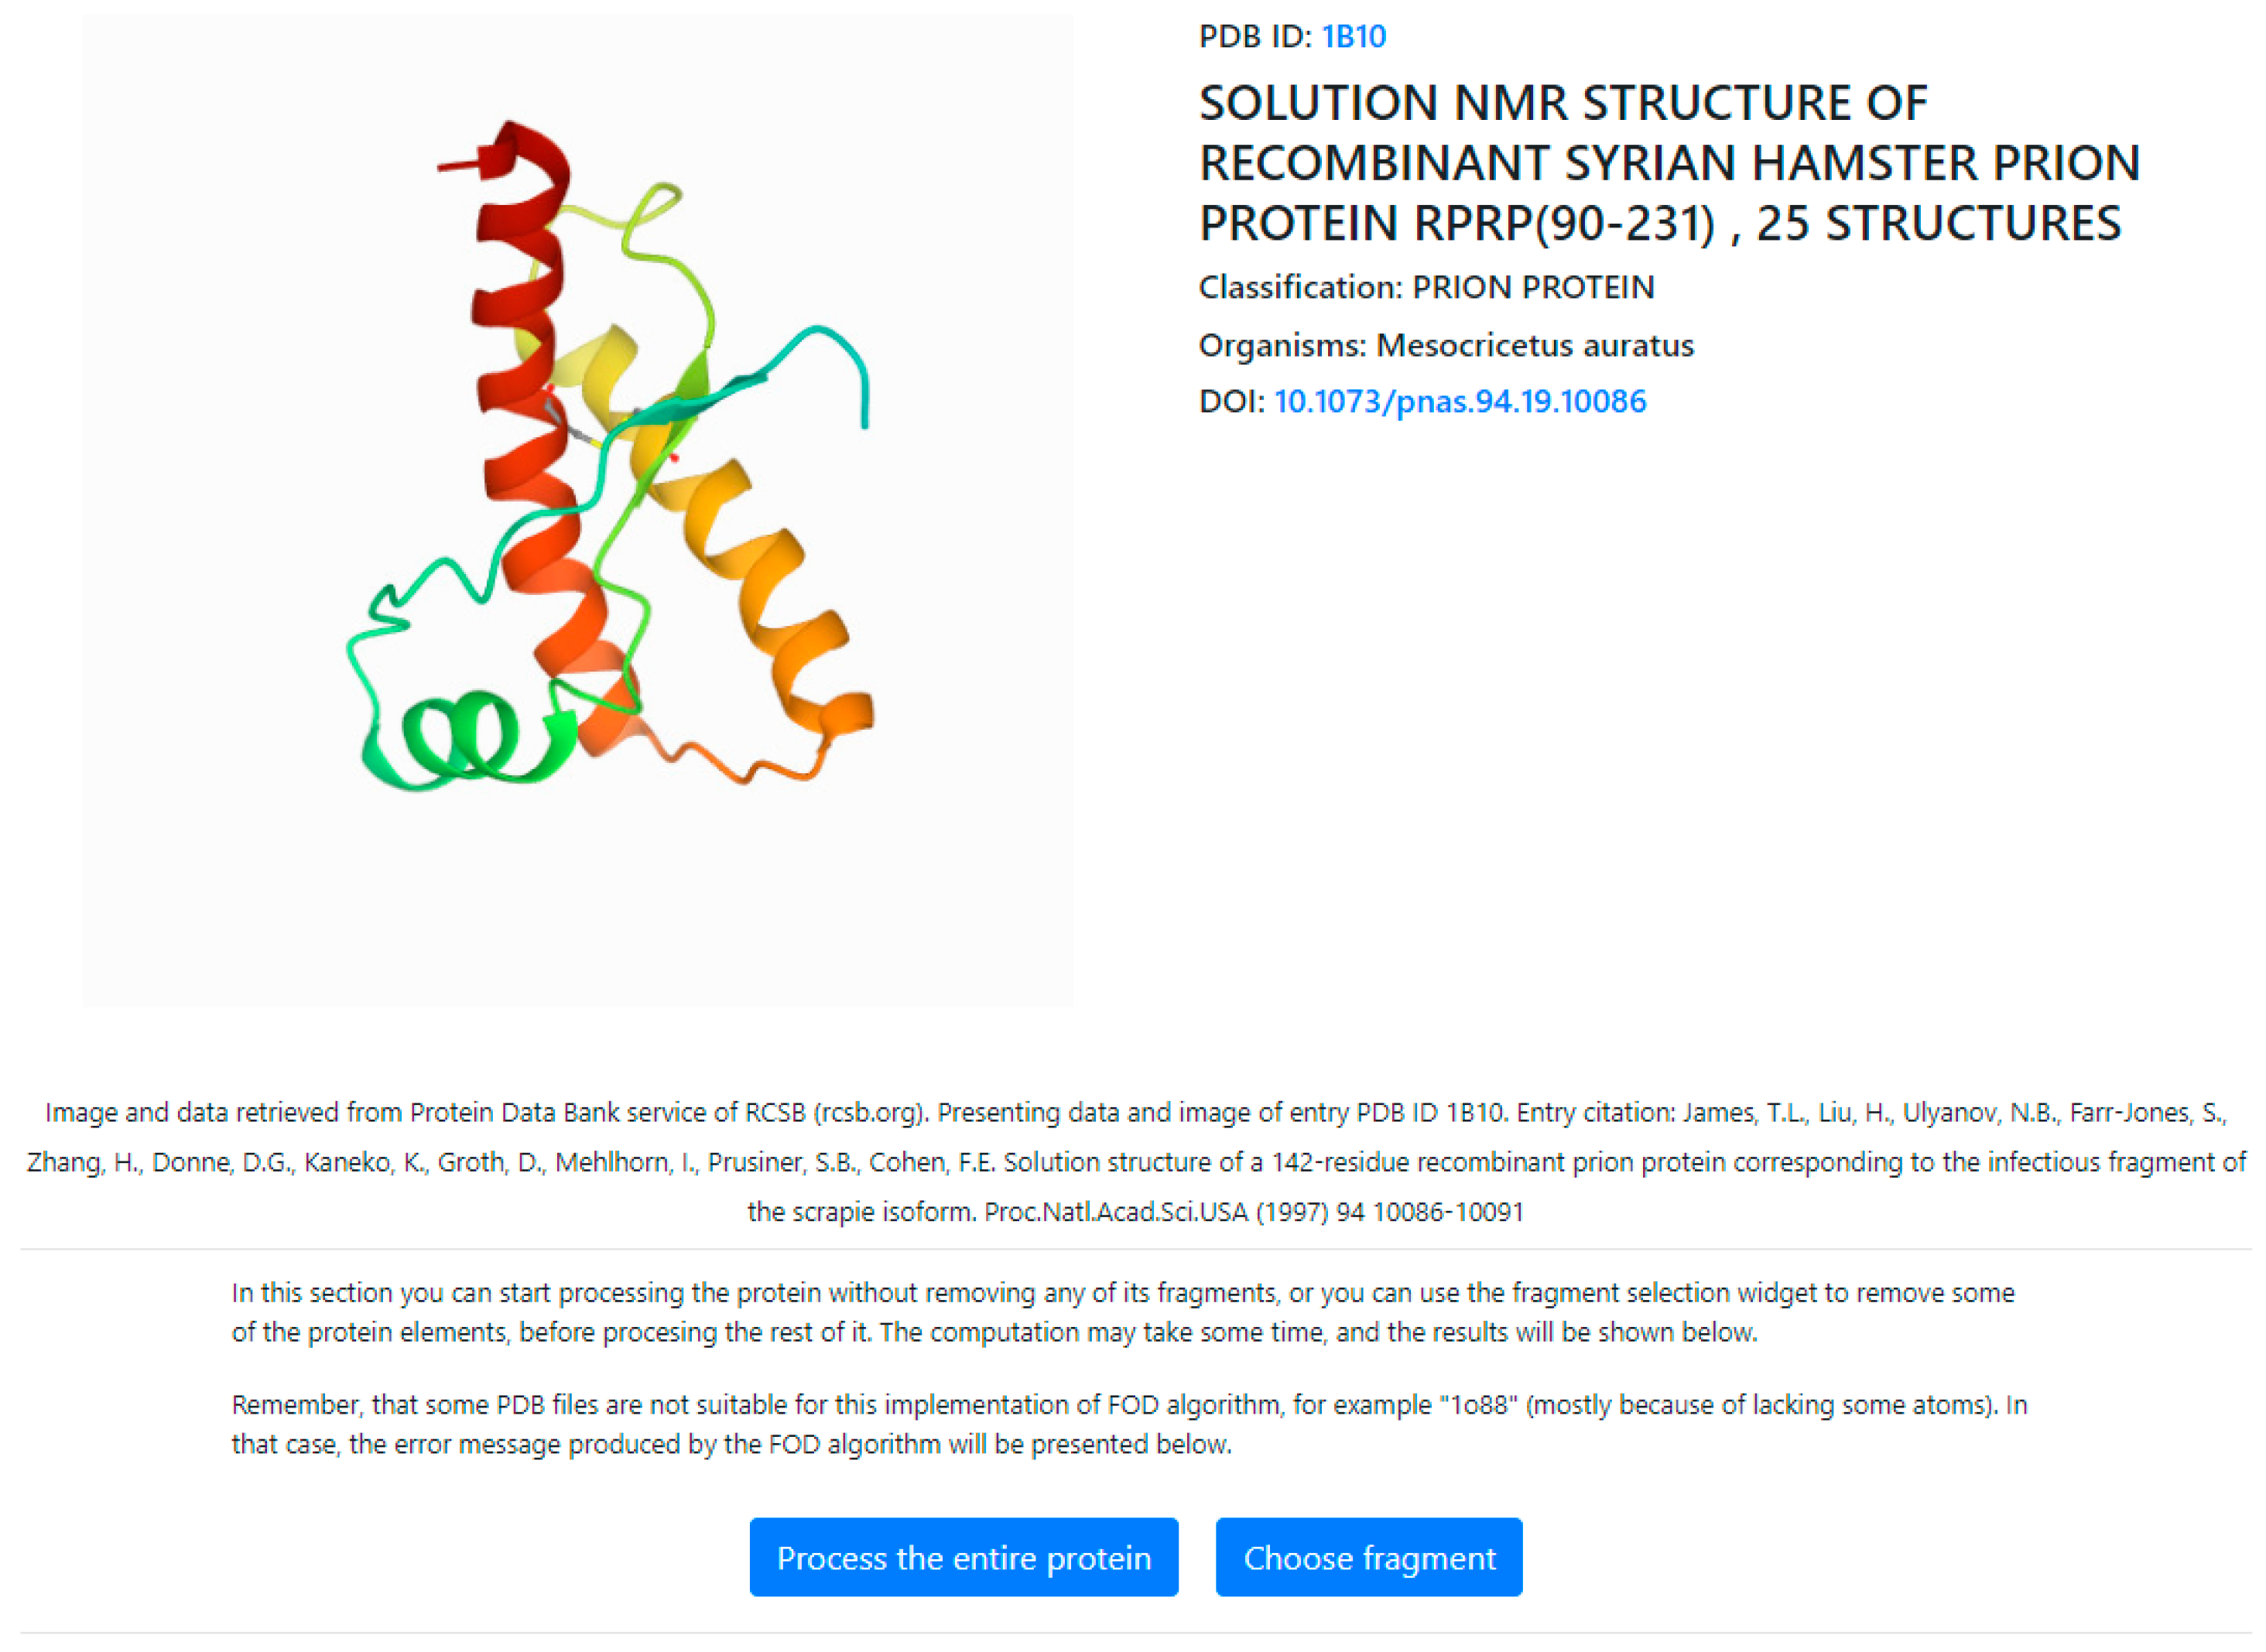
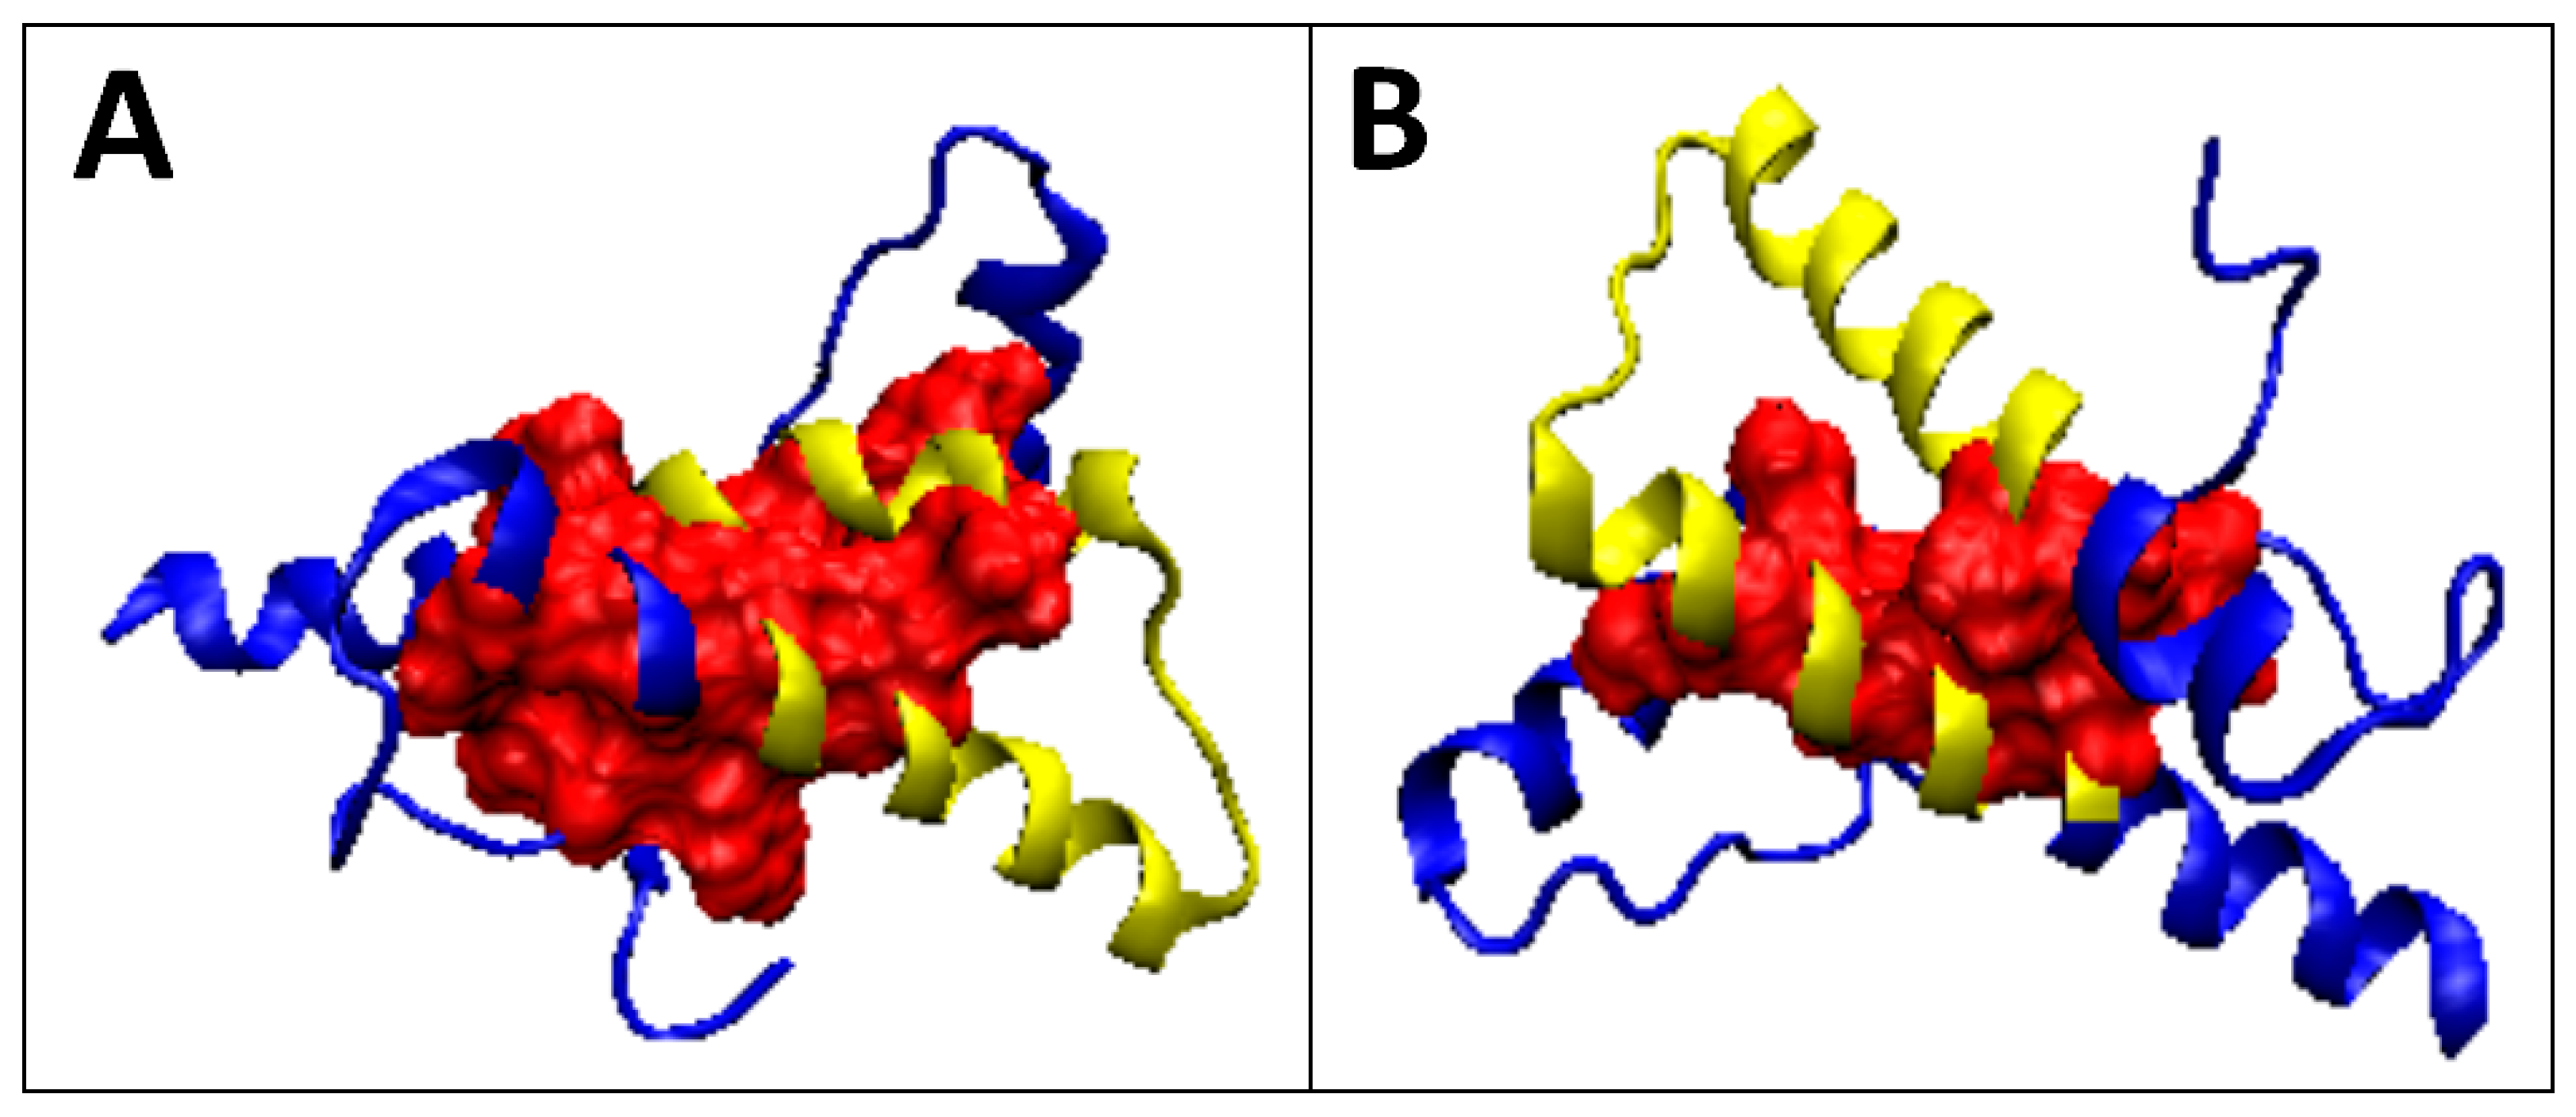
2.2. Prions
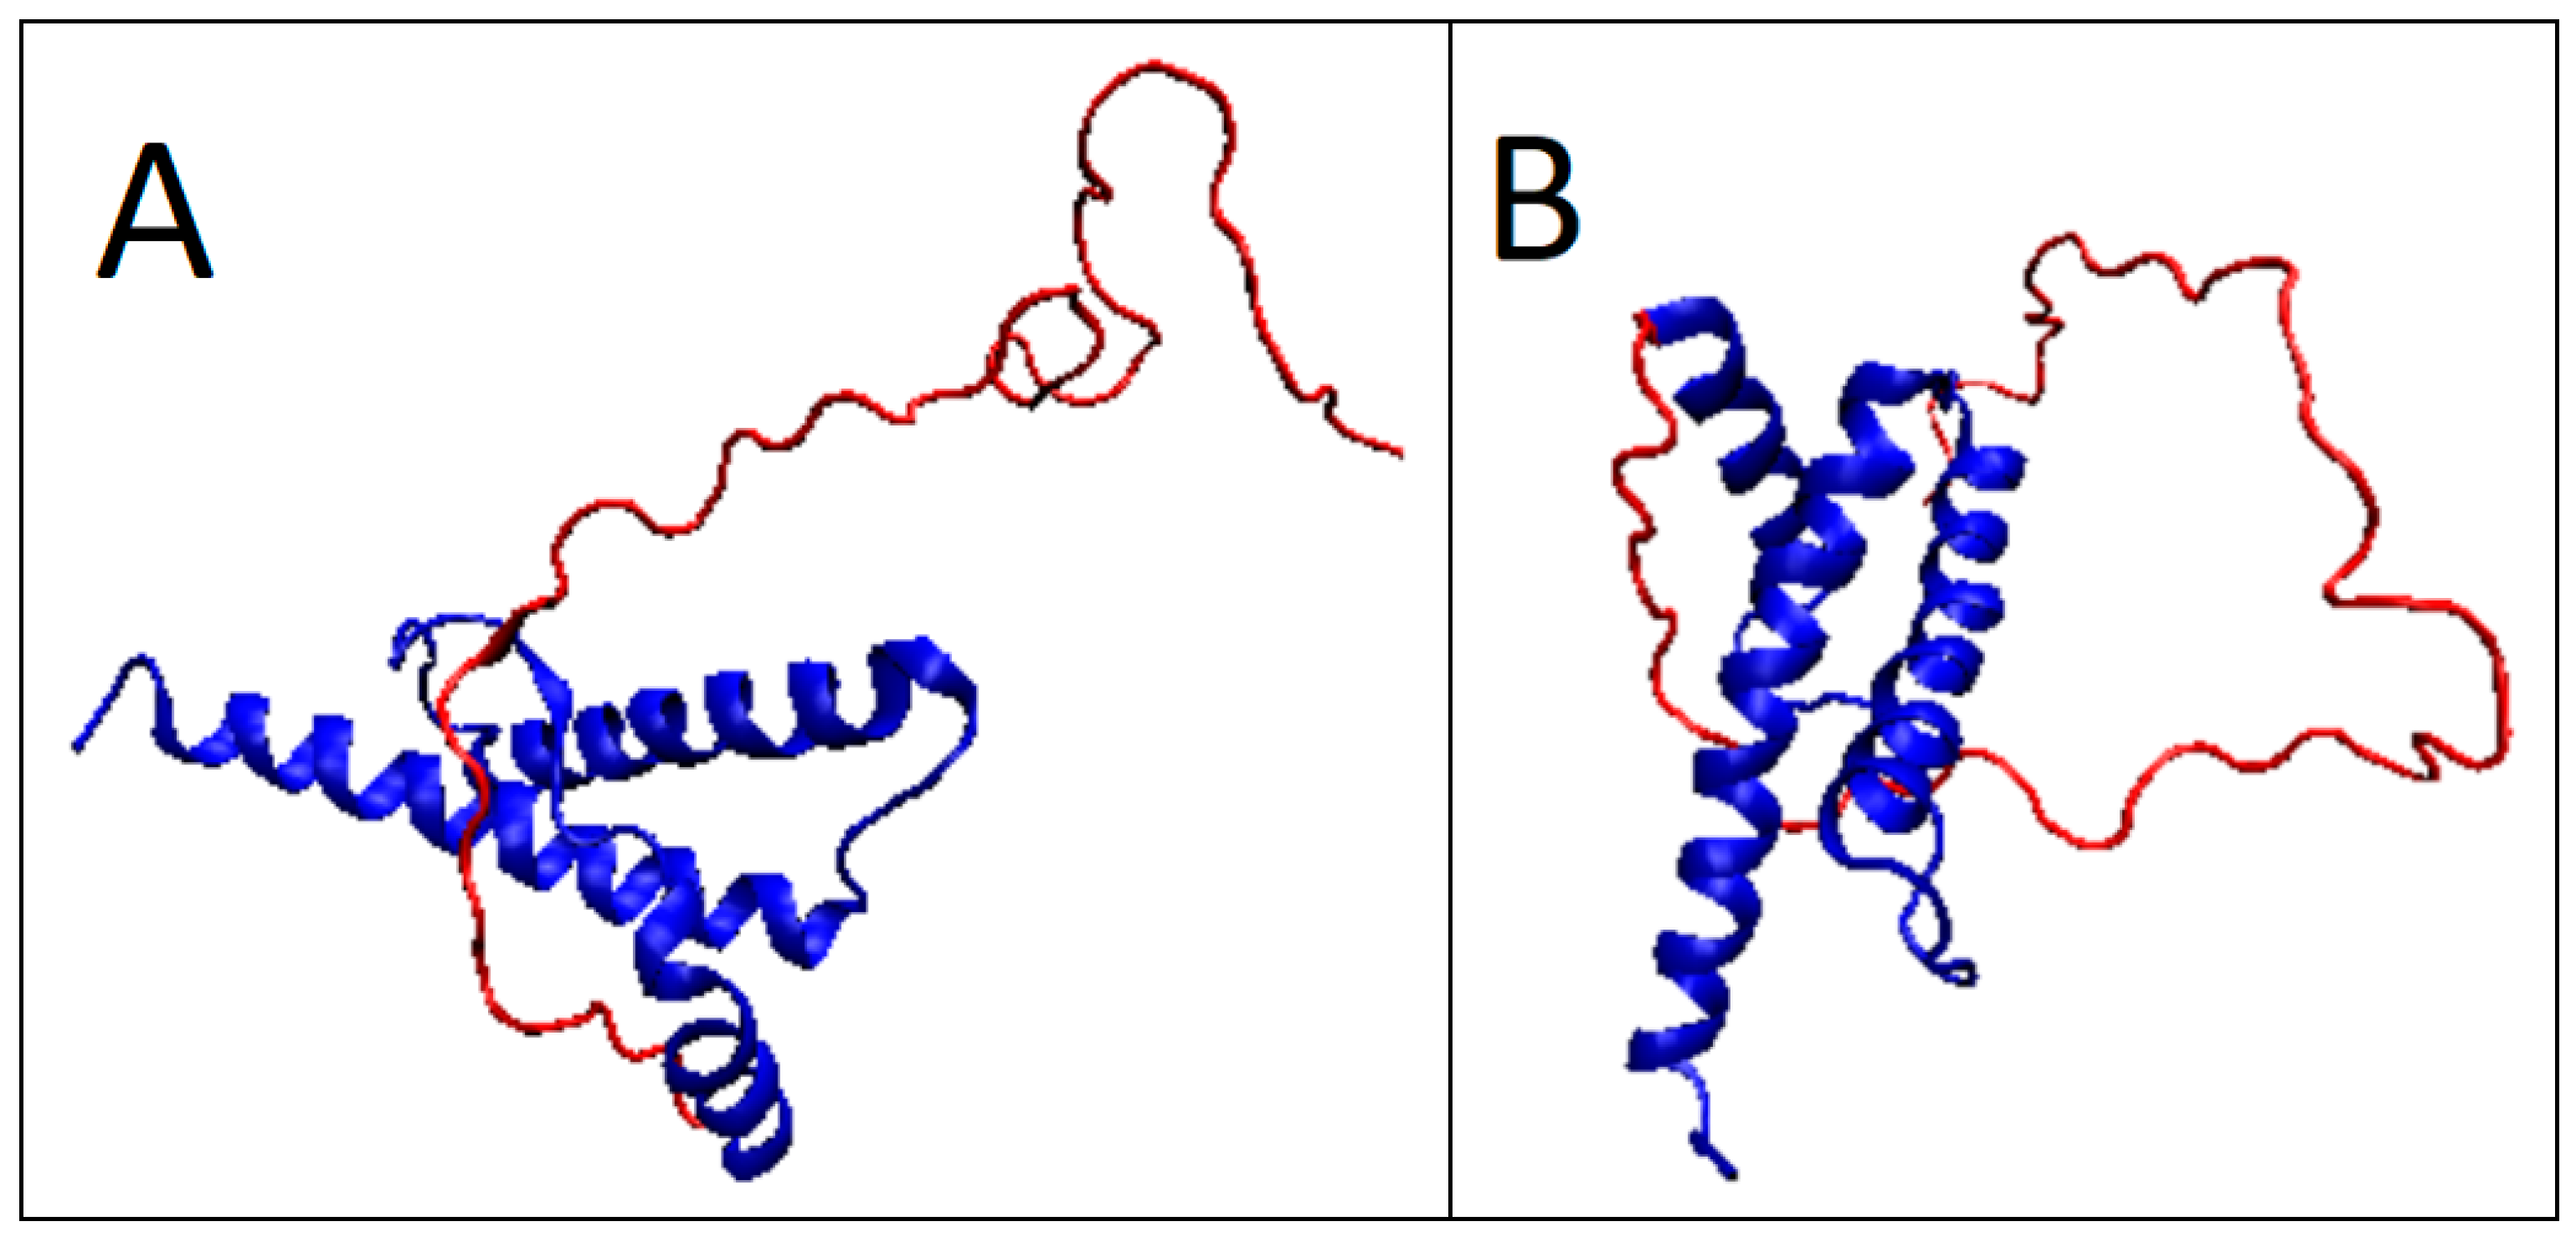
2.3. Partially Unfolded Prion Proteins
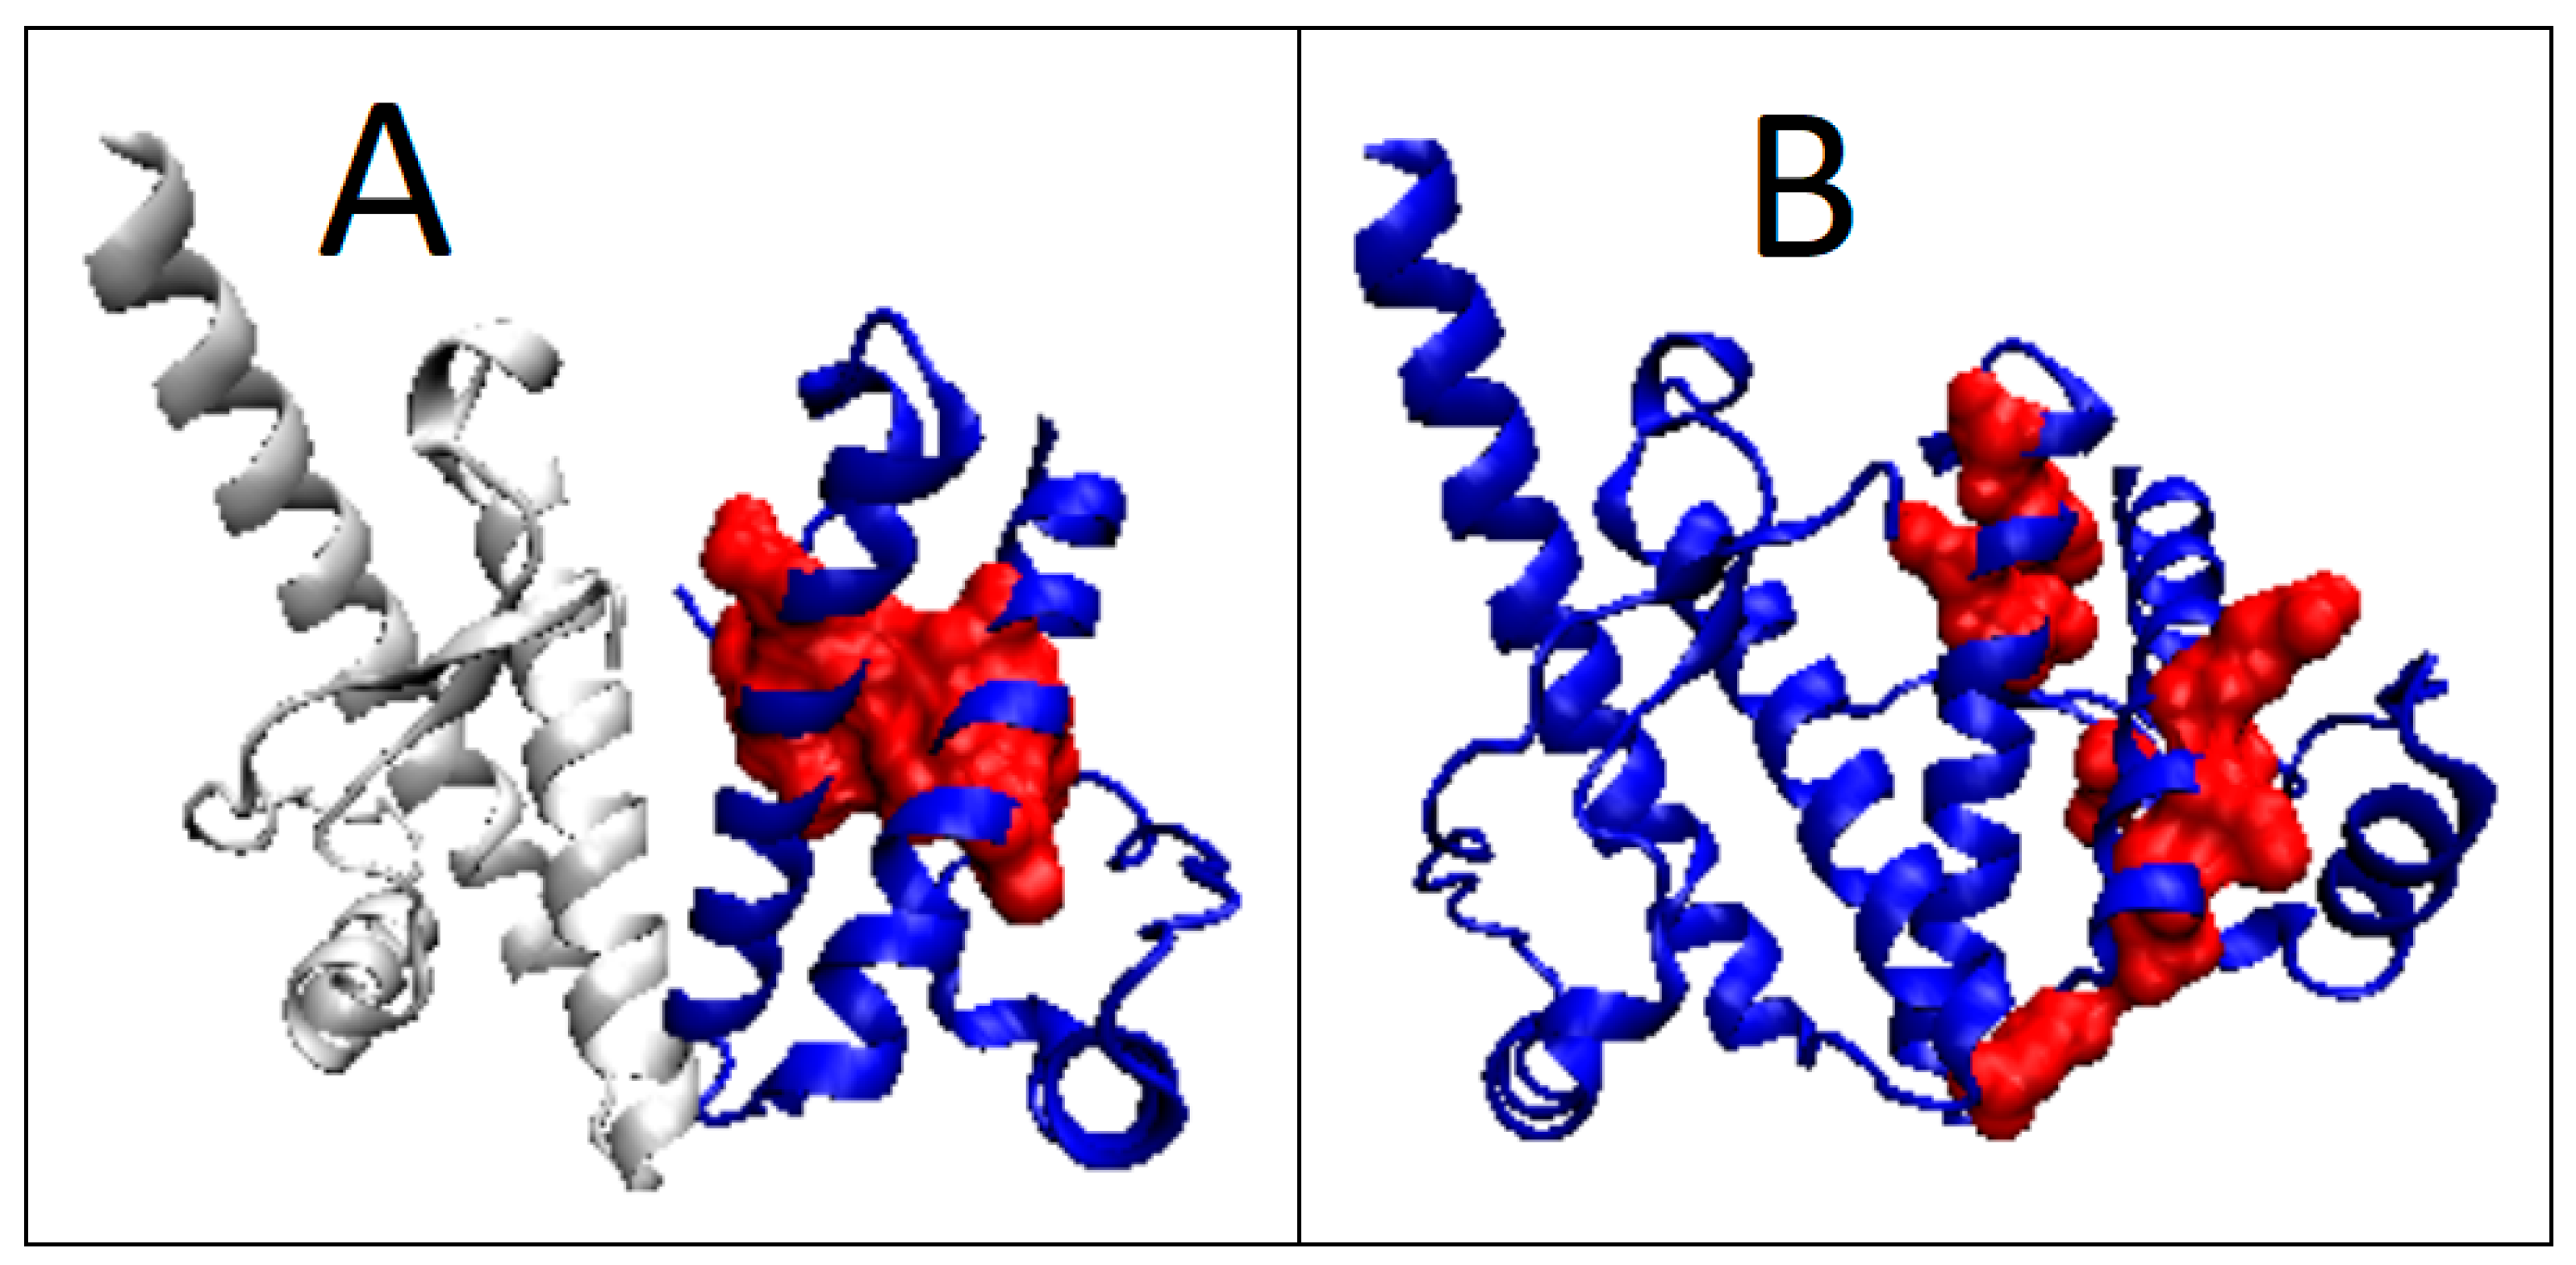
2.4. Prion Protein in Form of Dimers
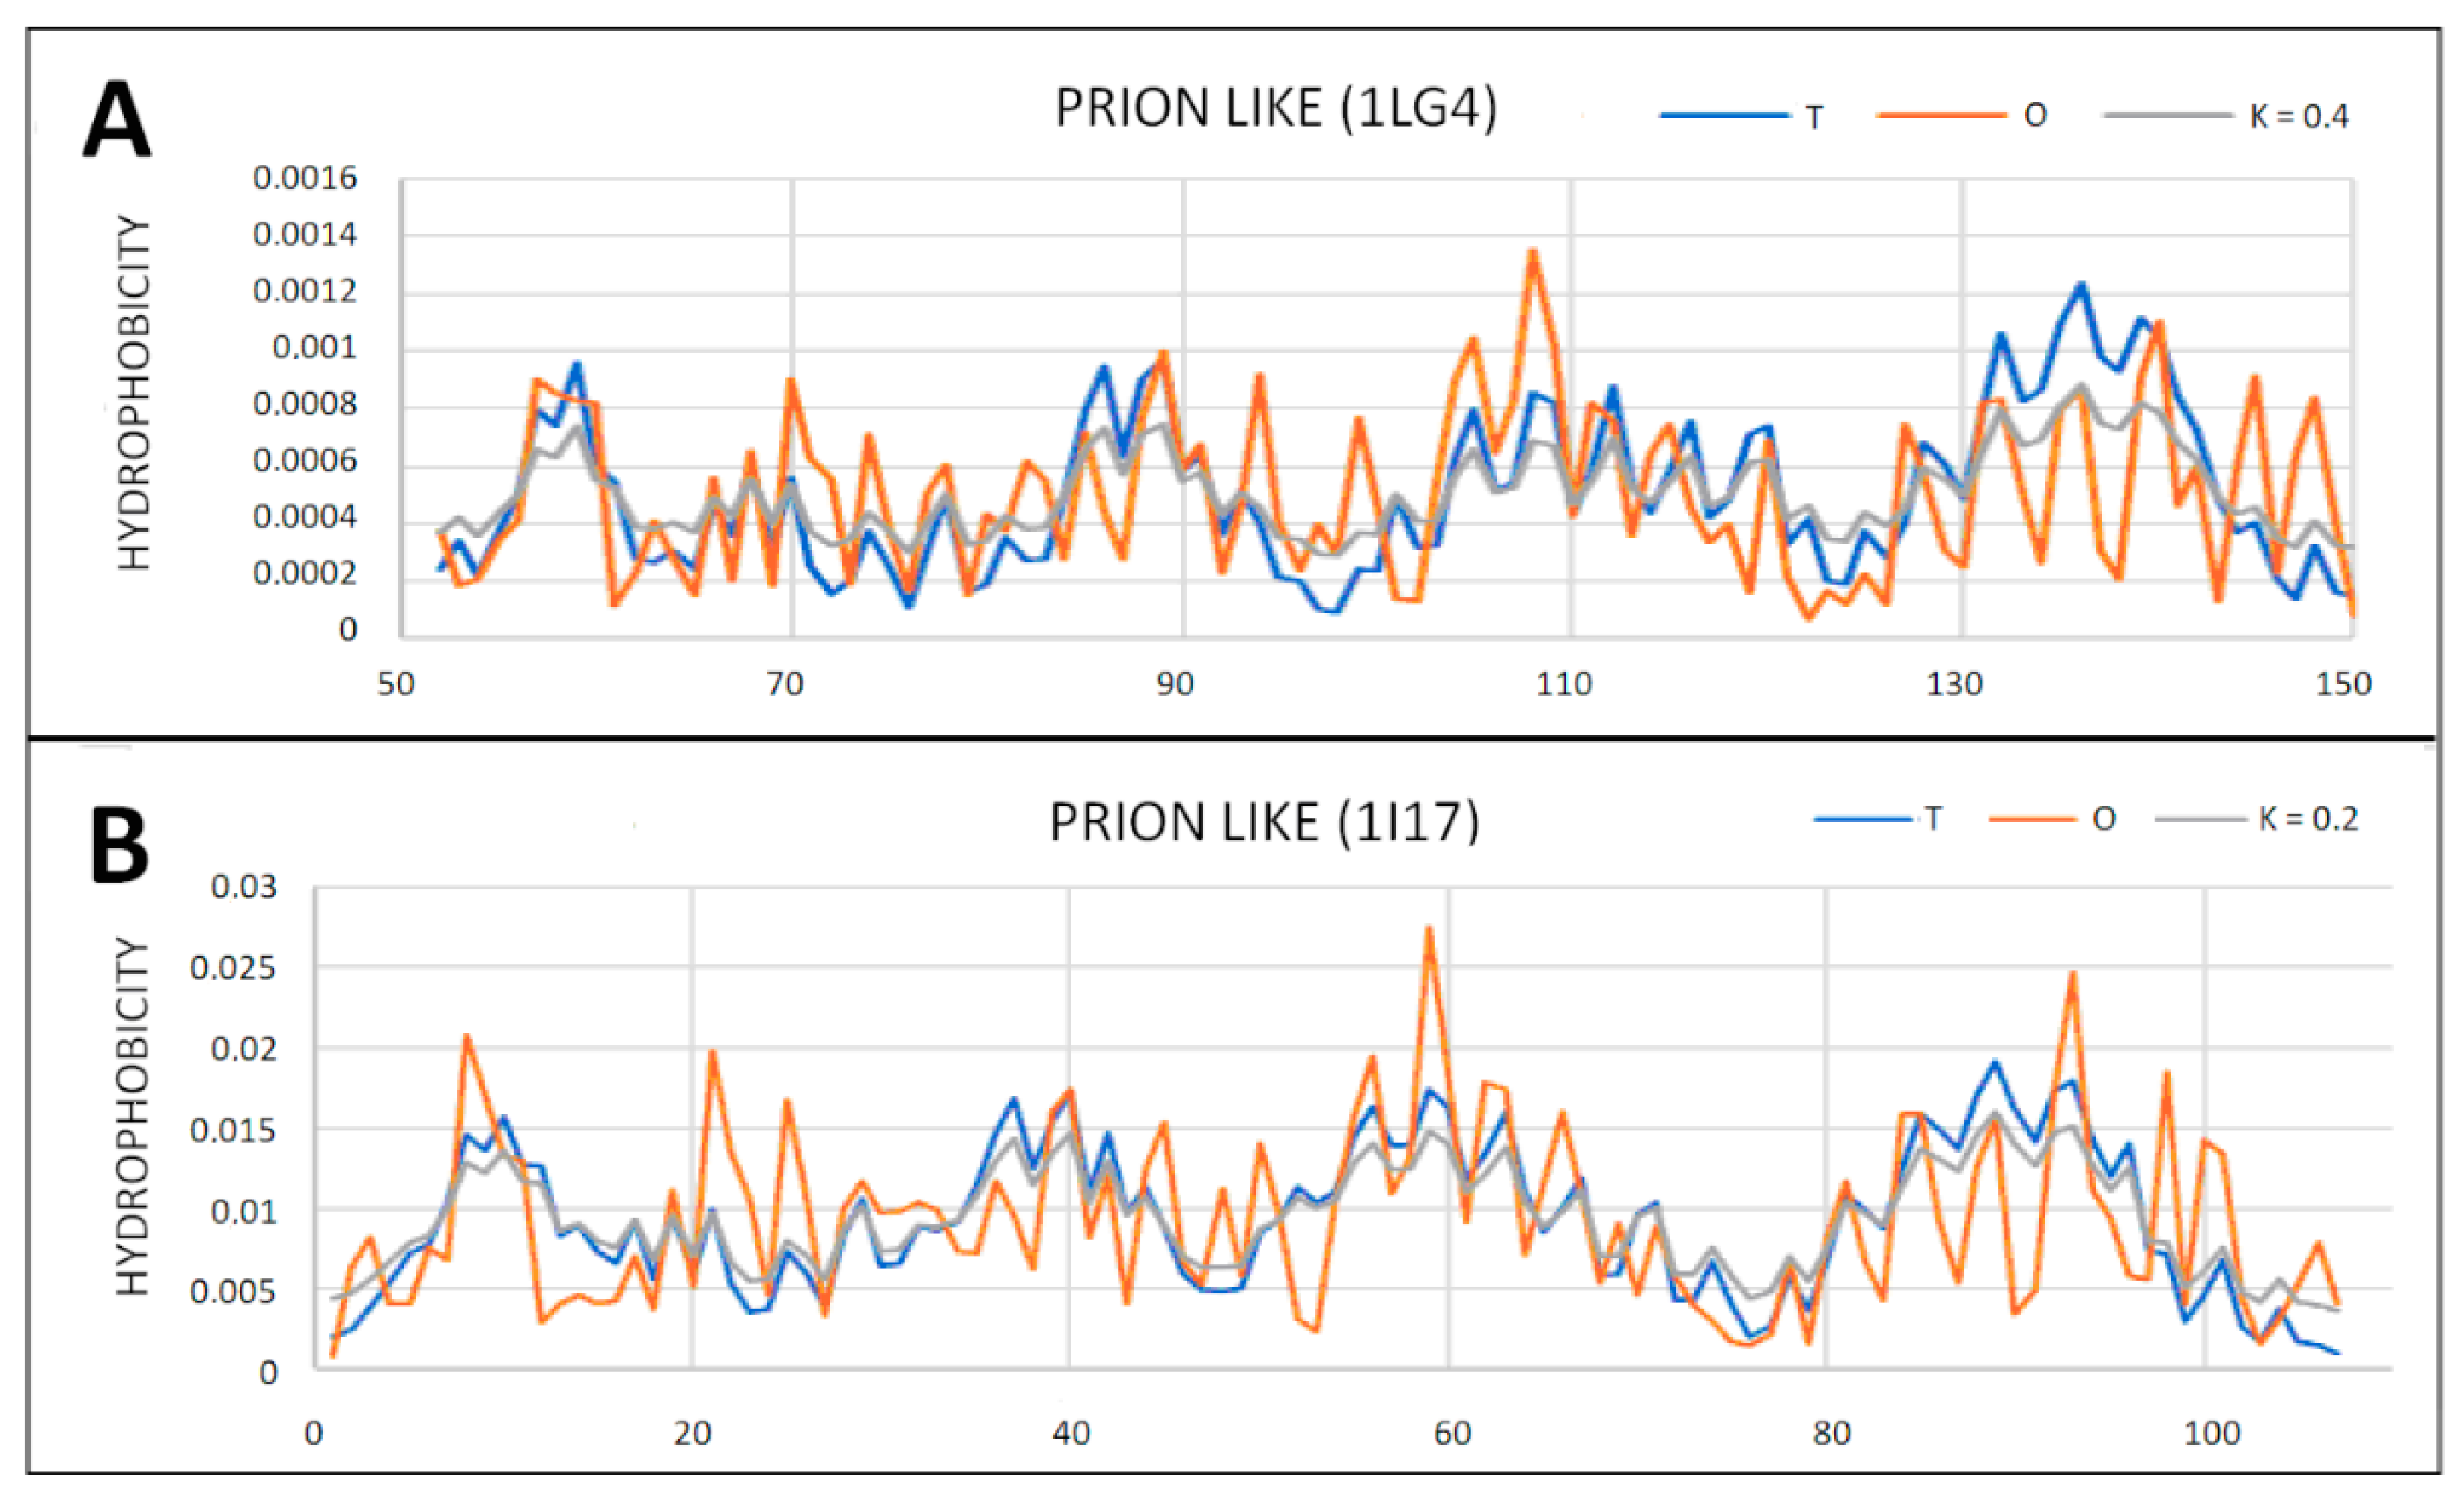
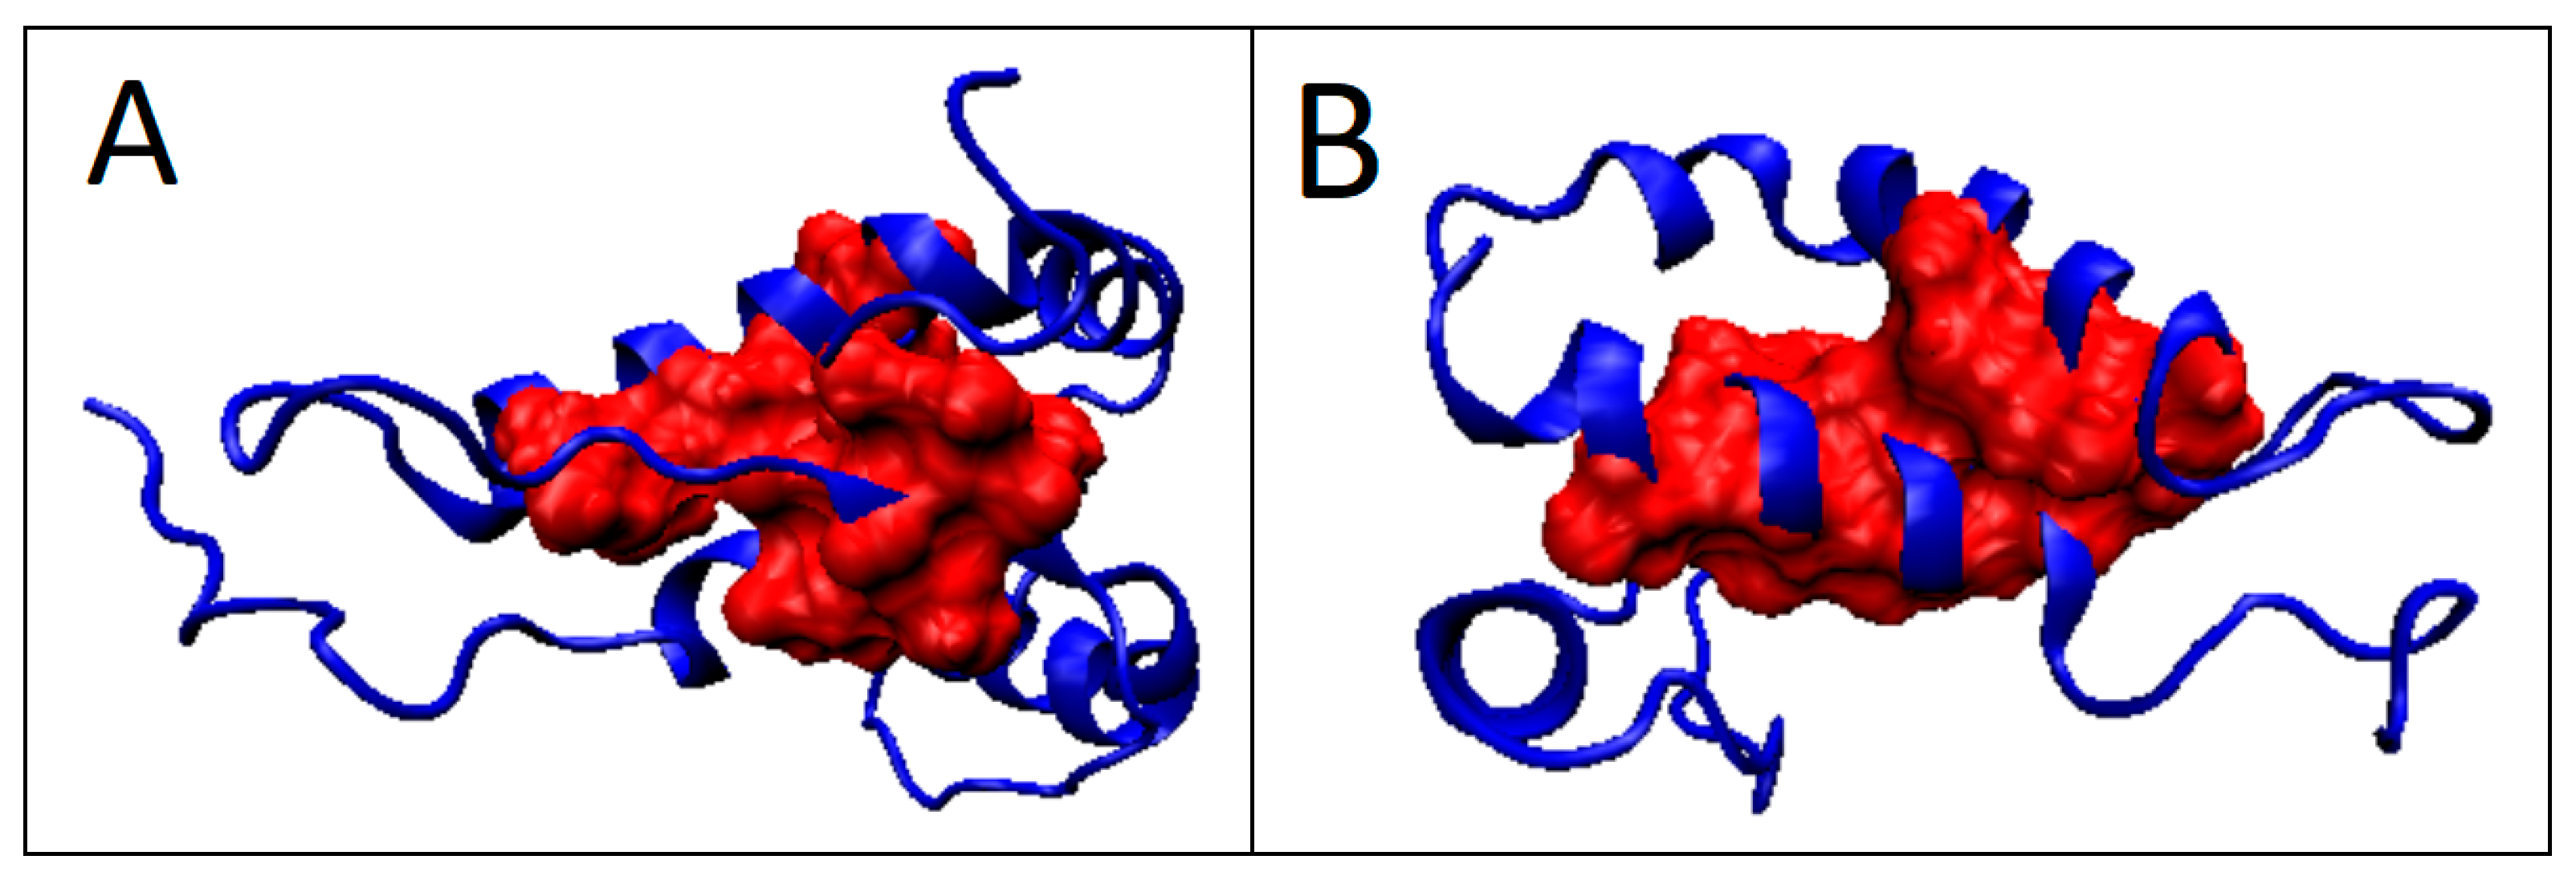
2.5. Prion-like Proteins
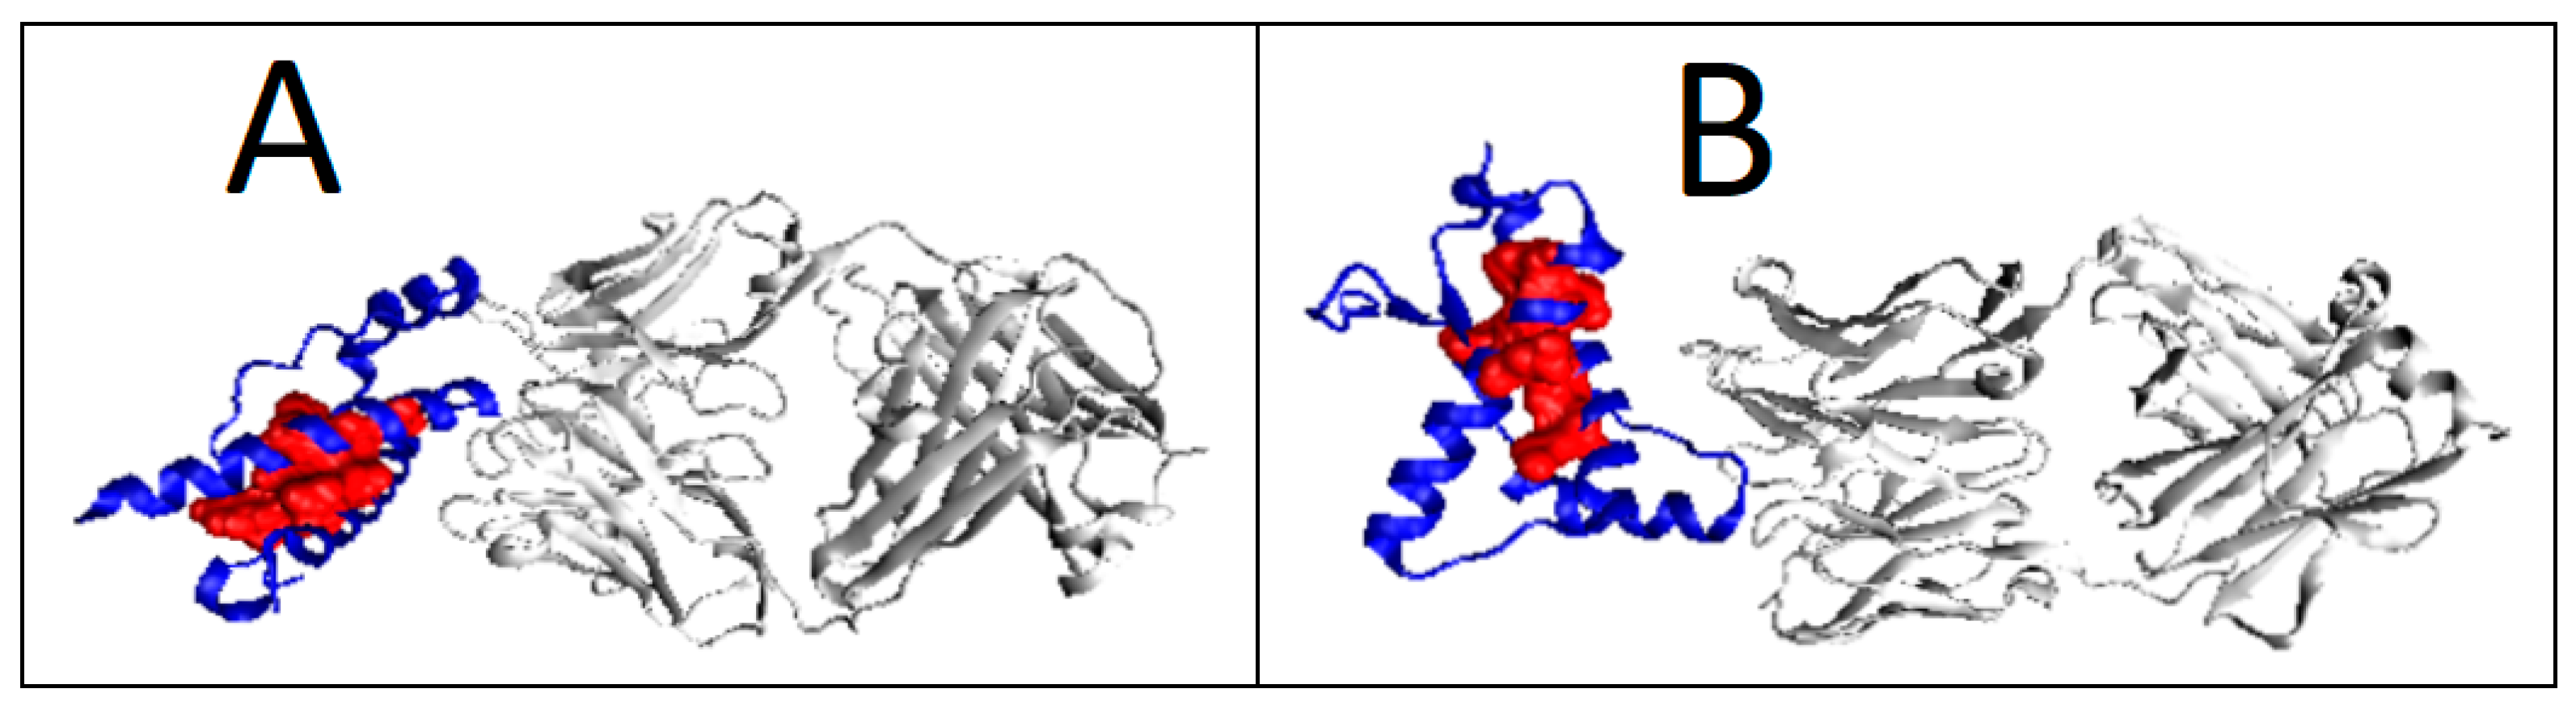
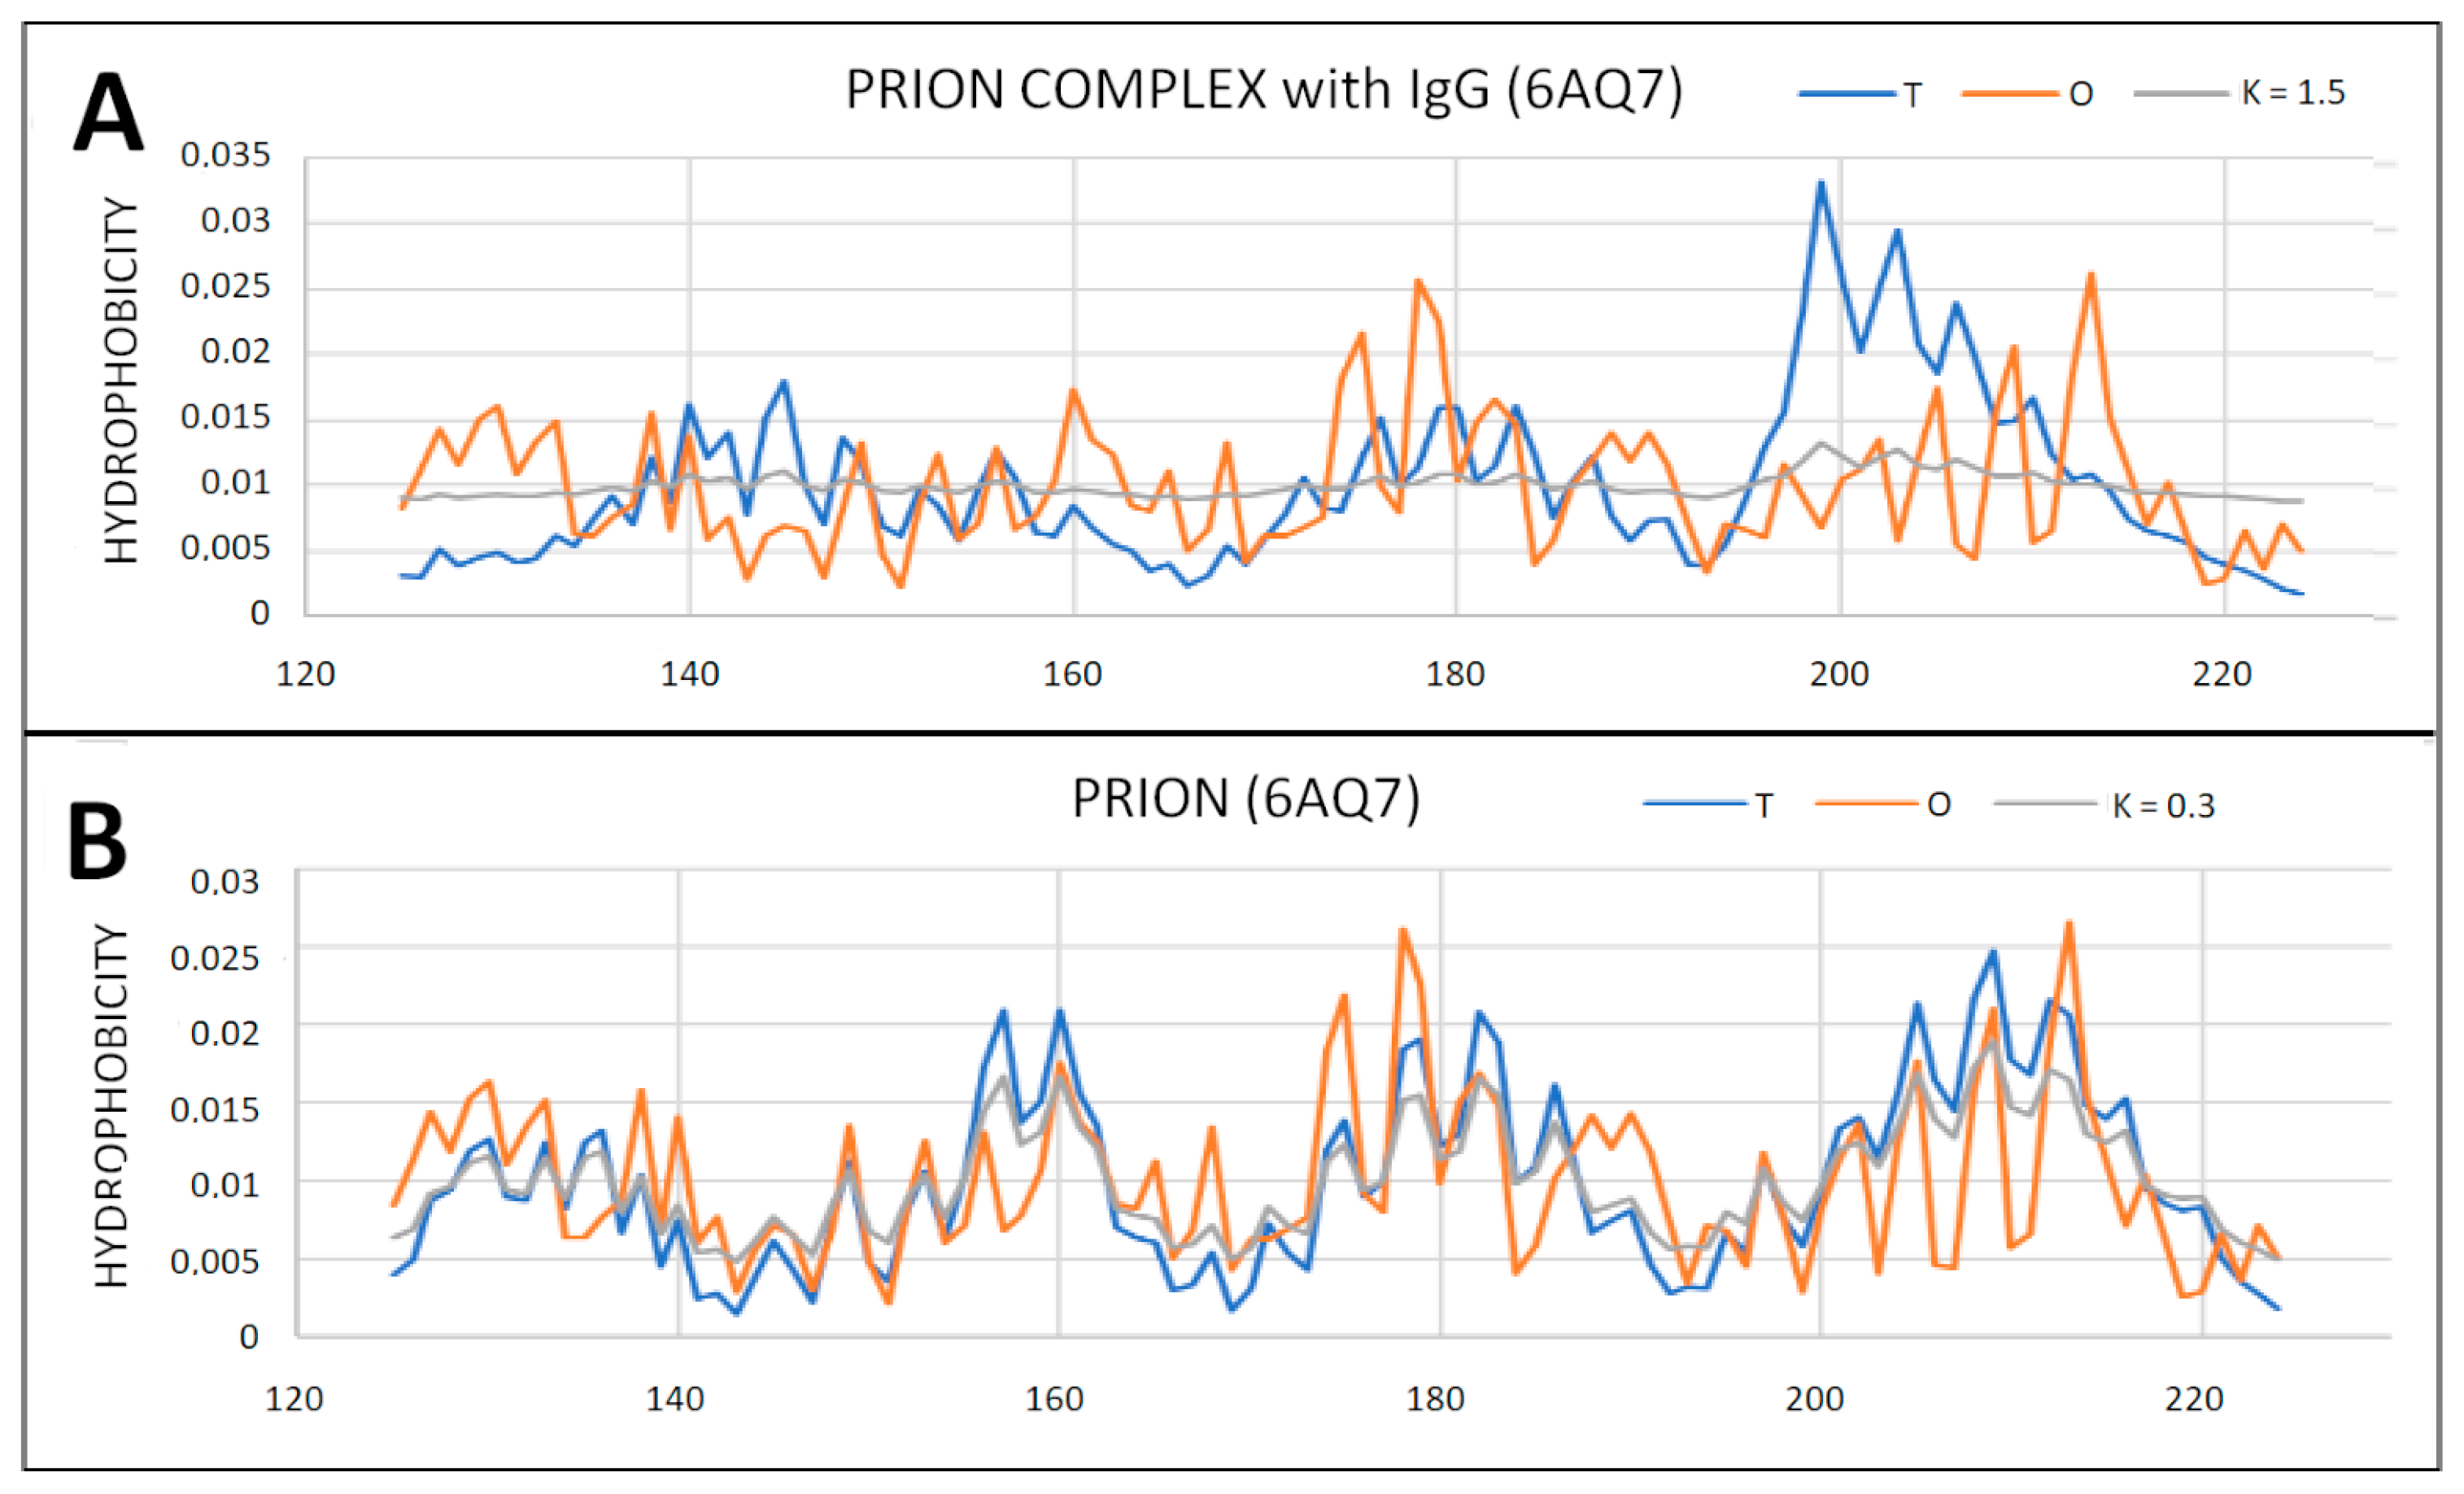
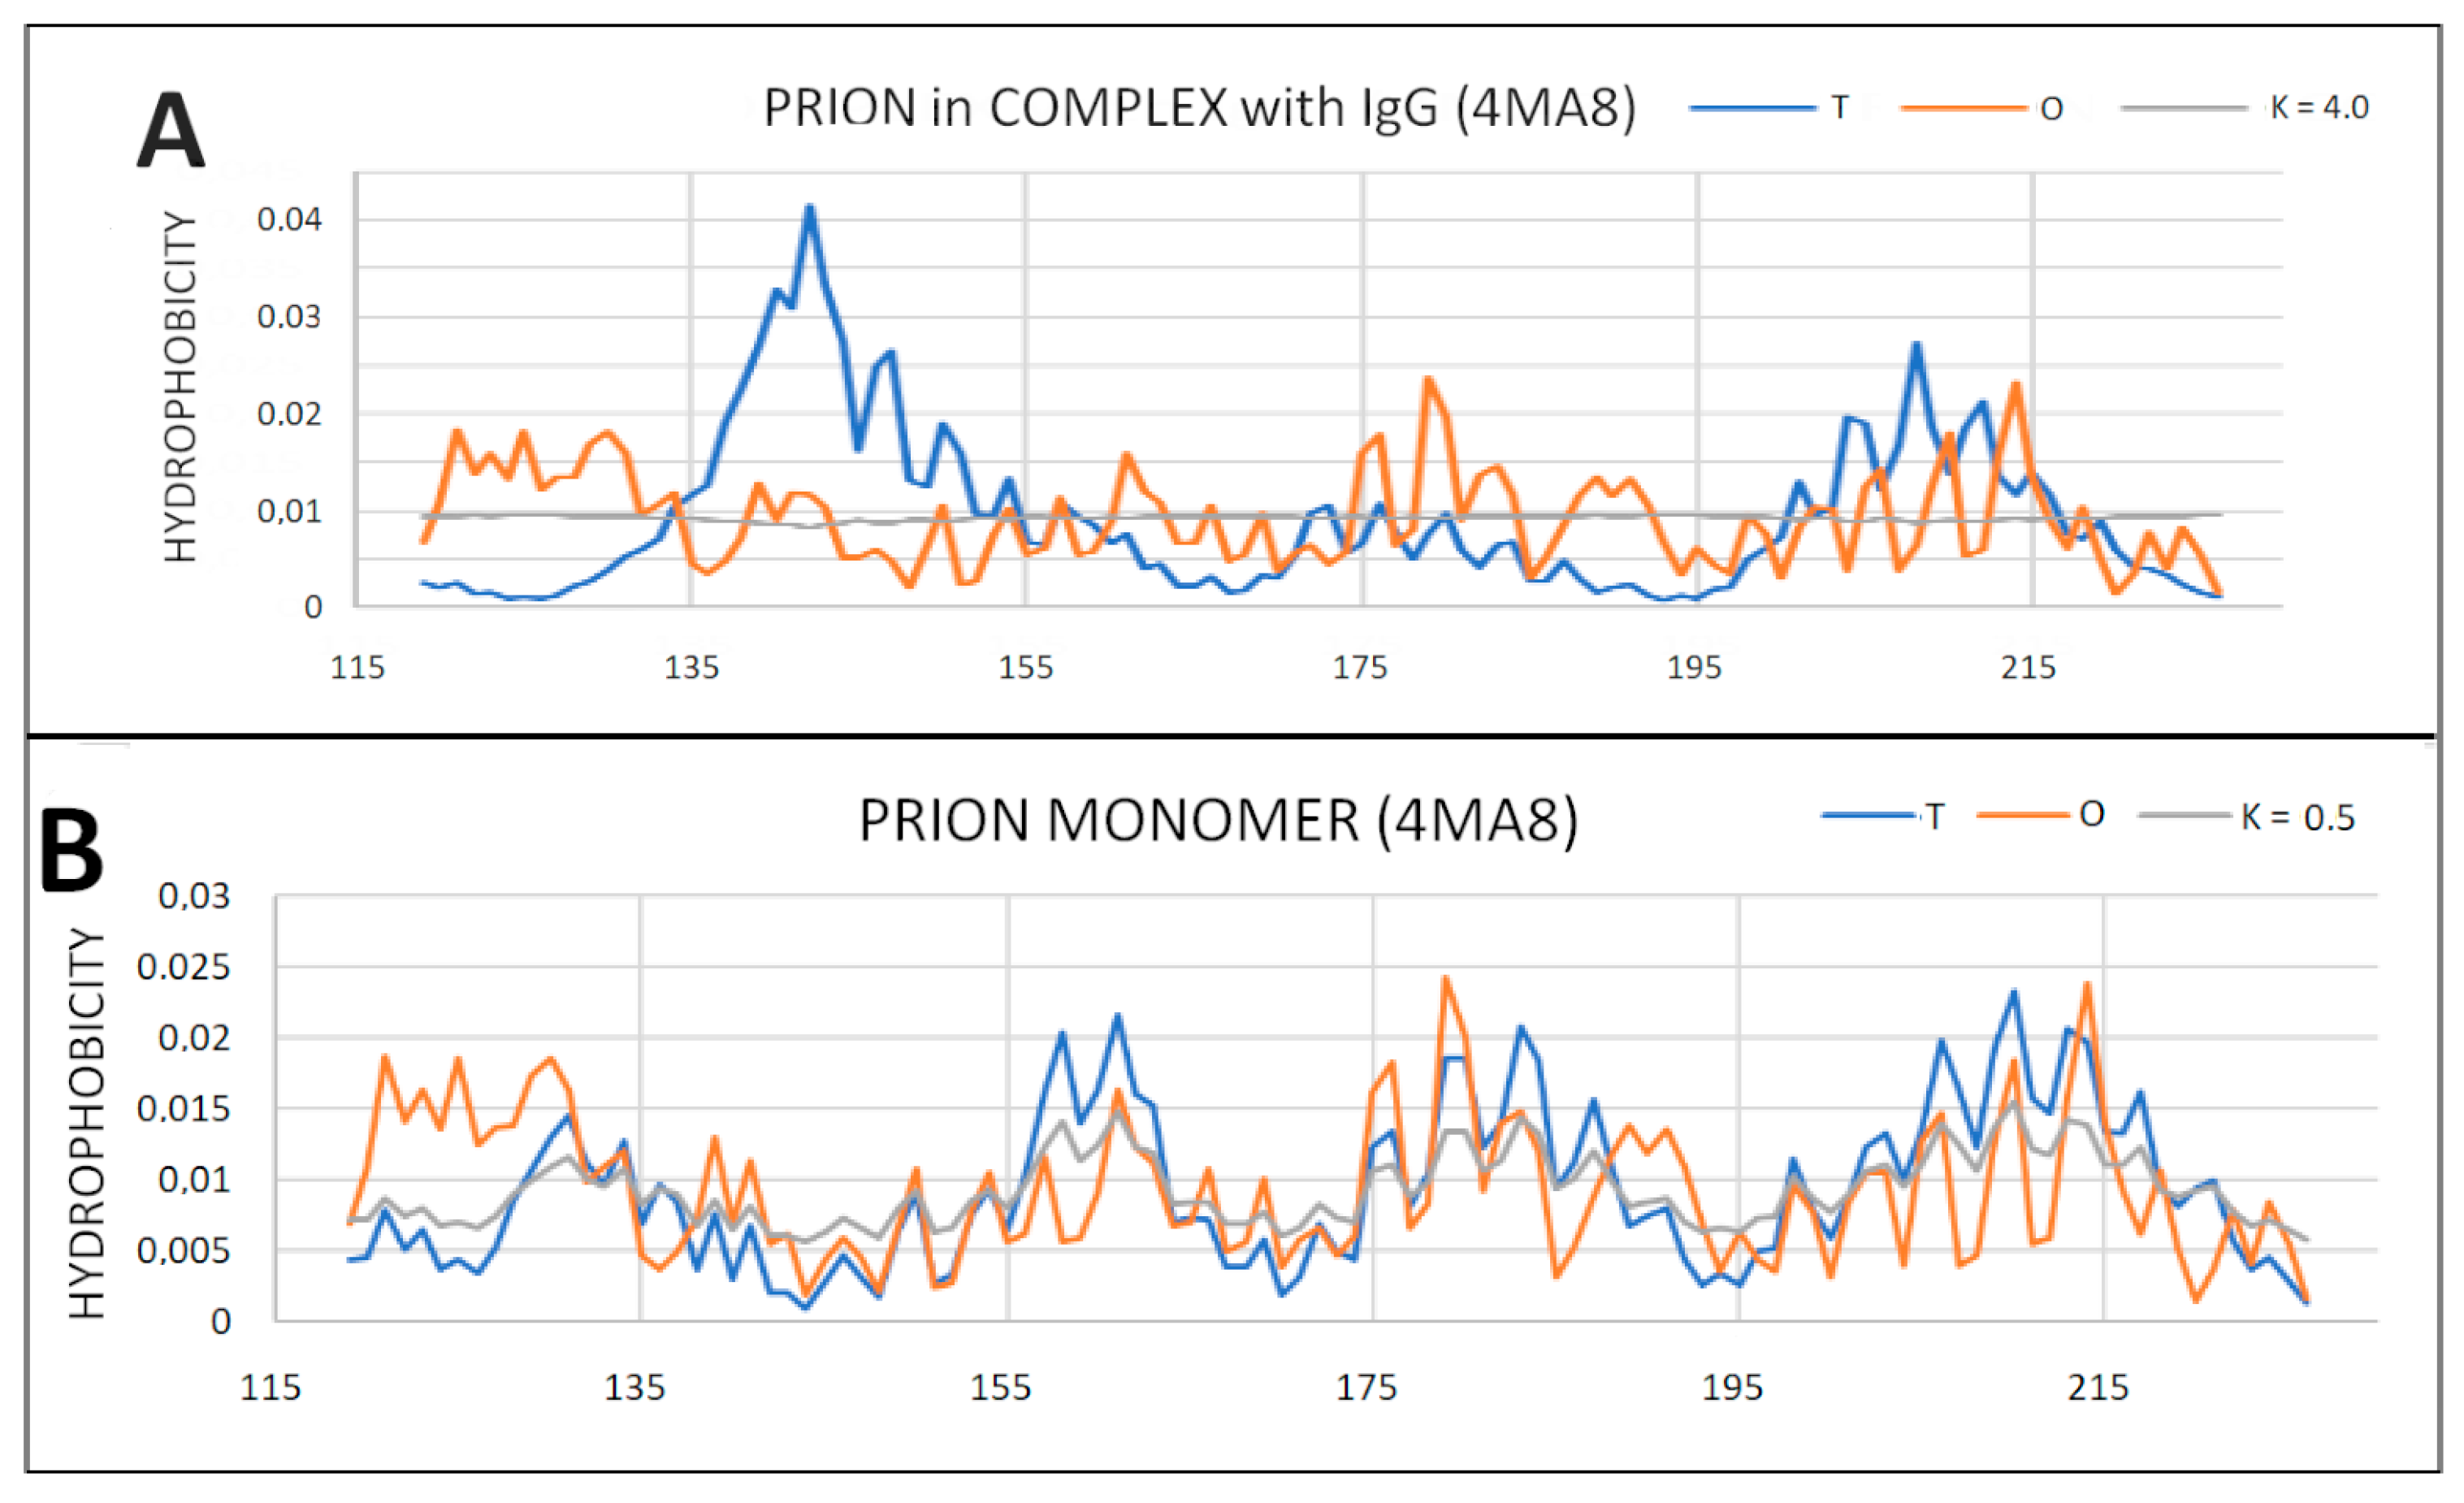
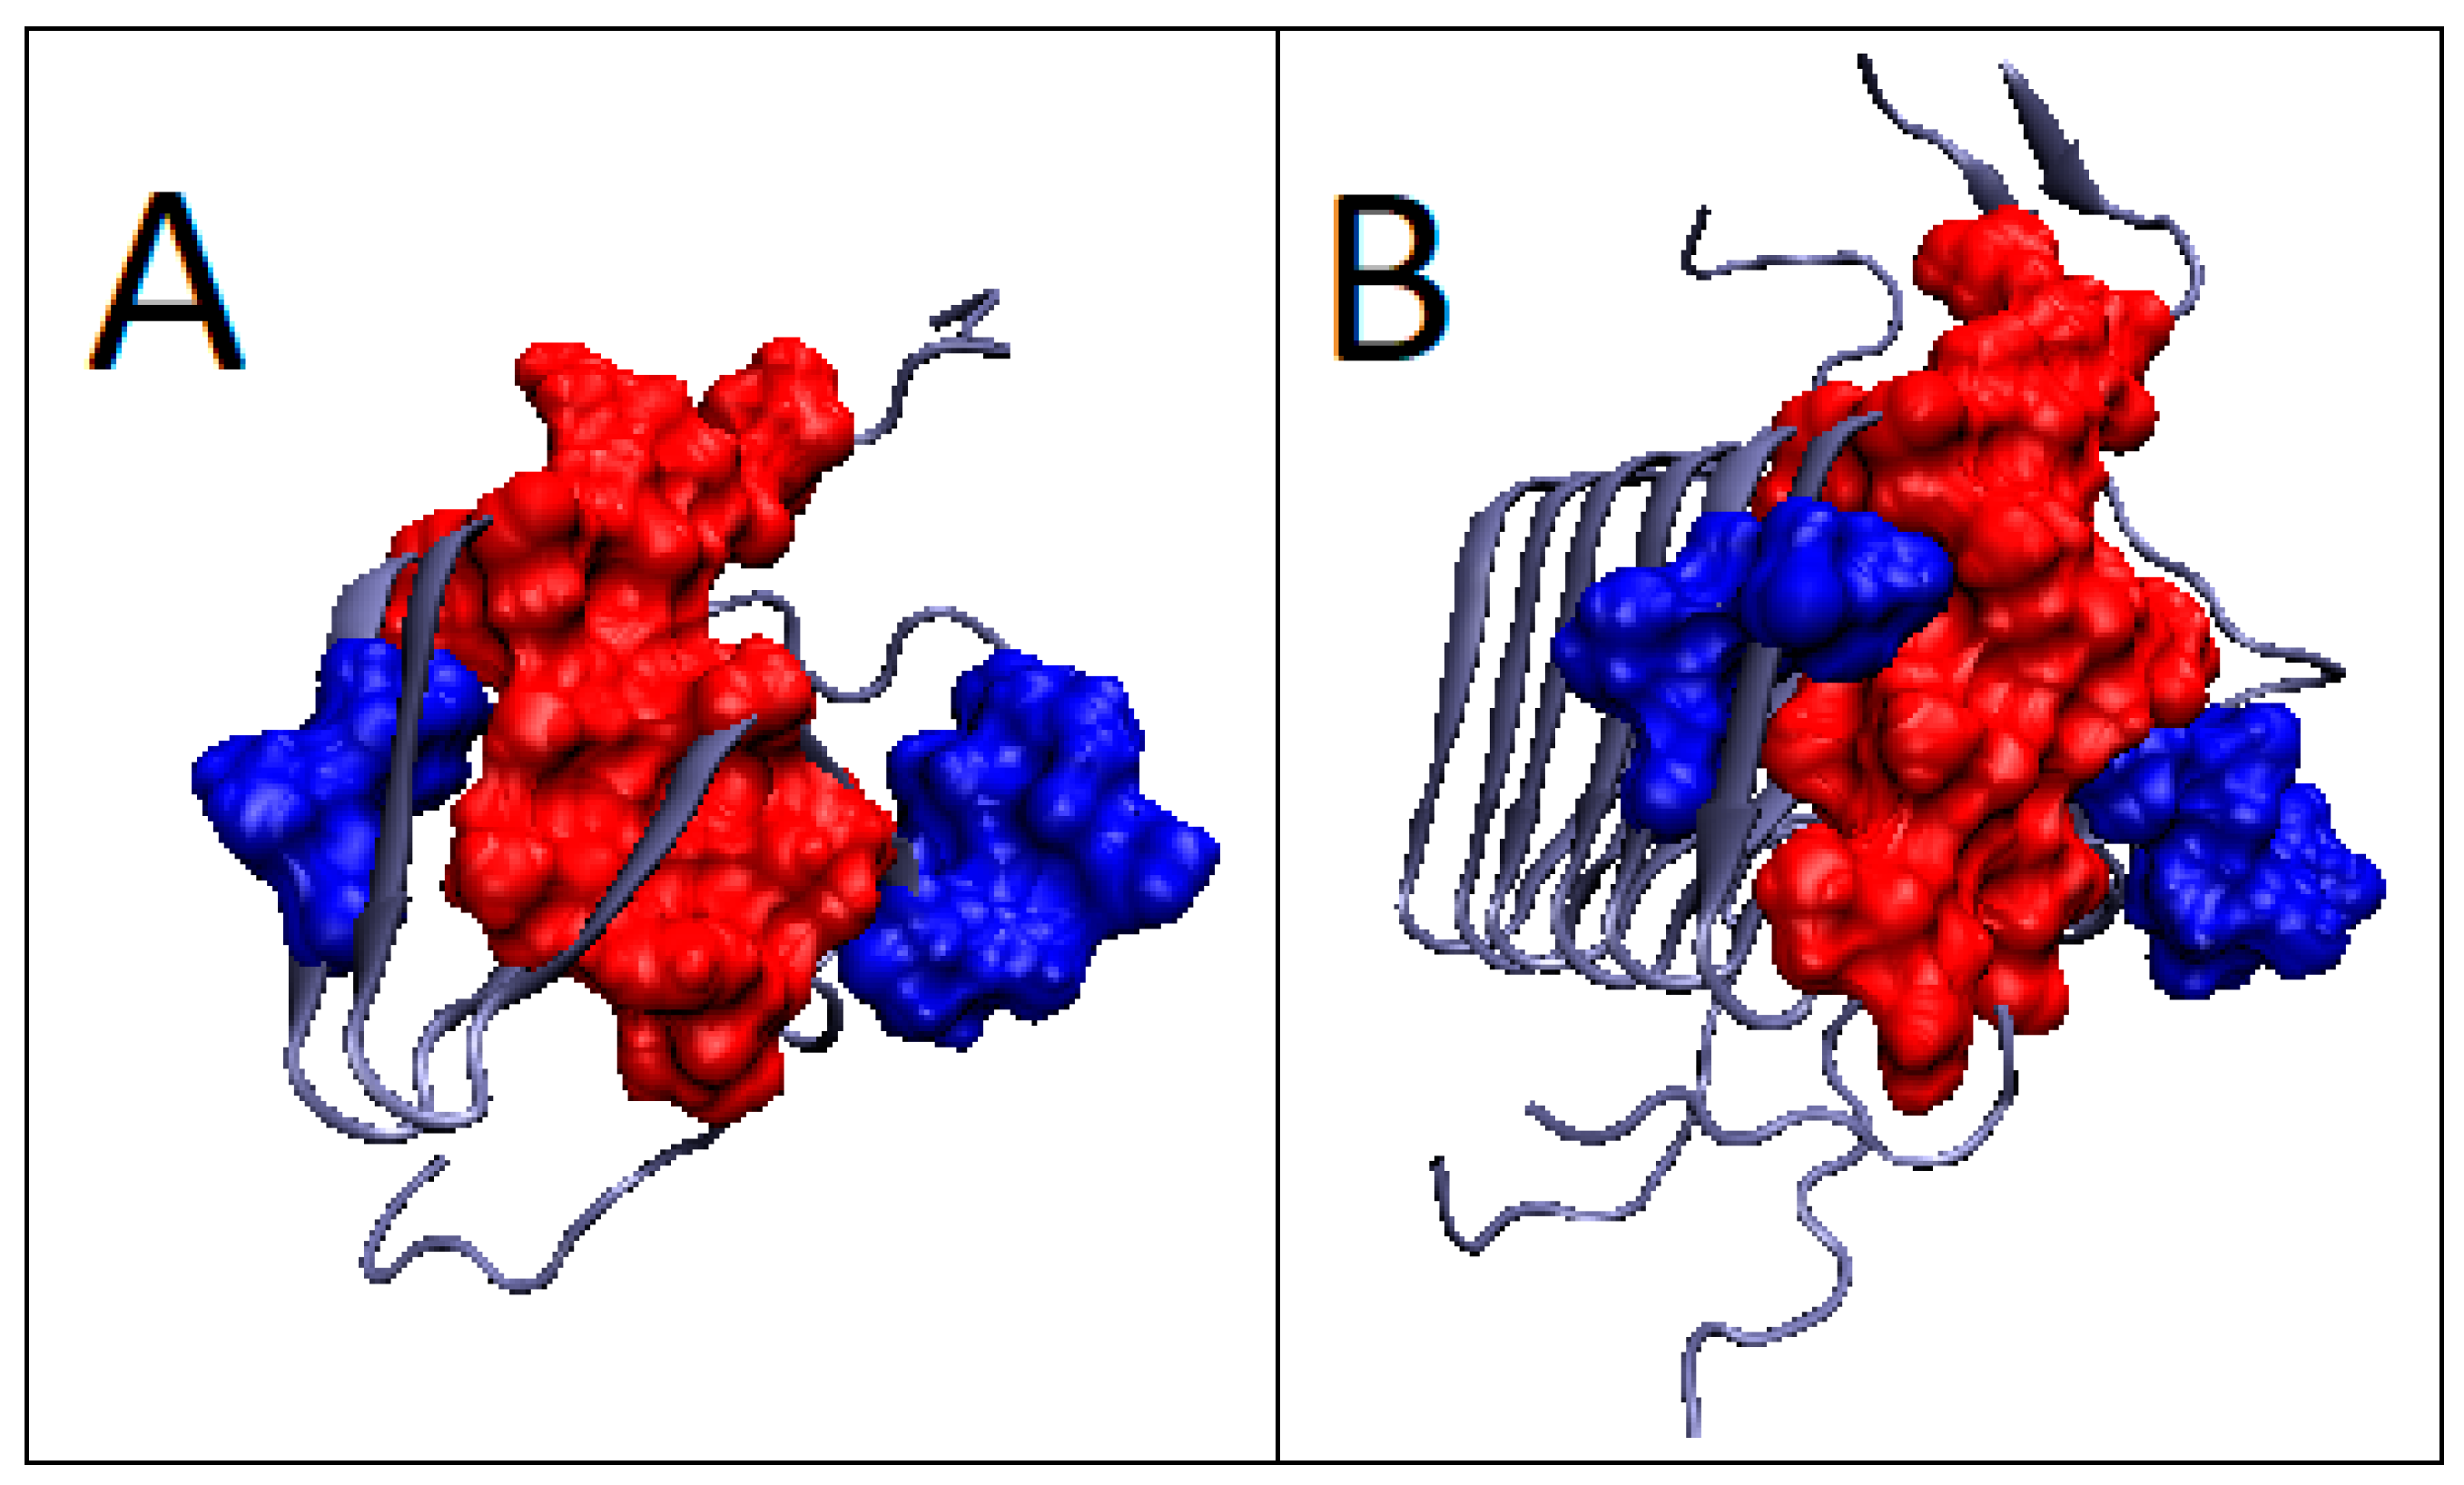
2.6. Prion Proteins in Form of Complexes with Fab Fragments of IgG
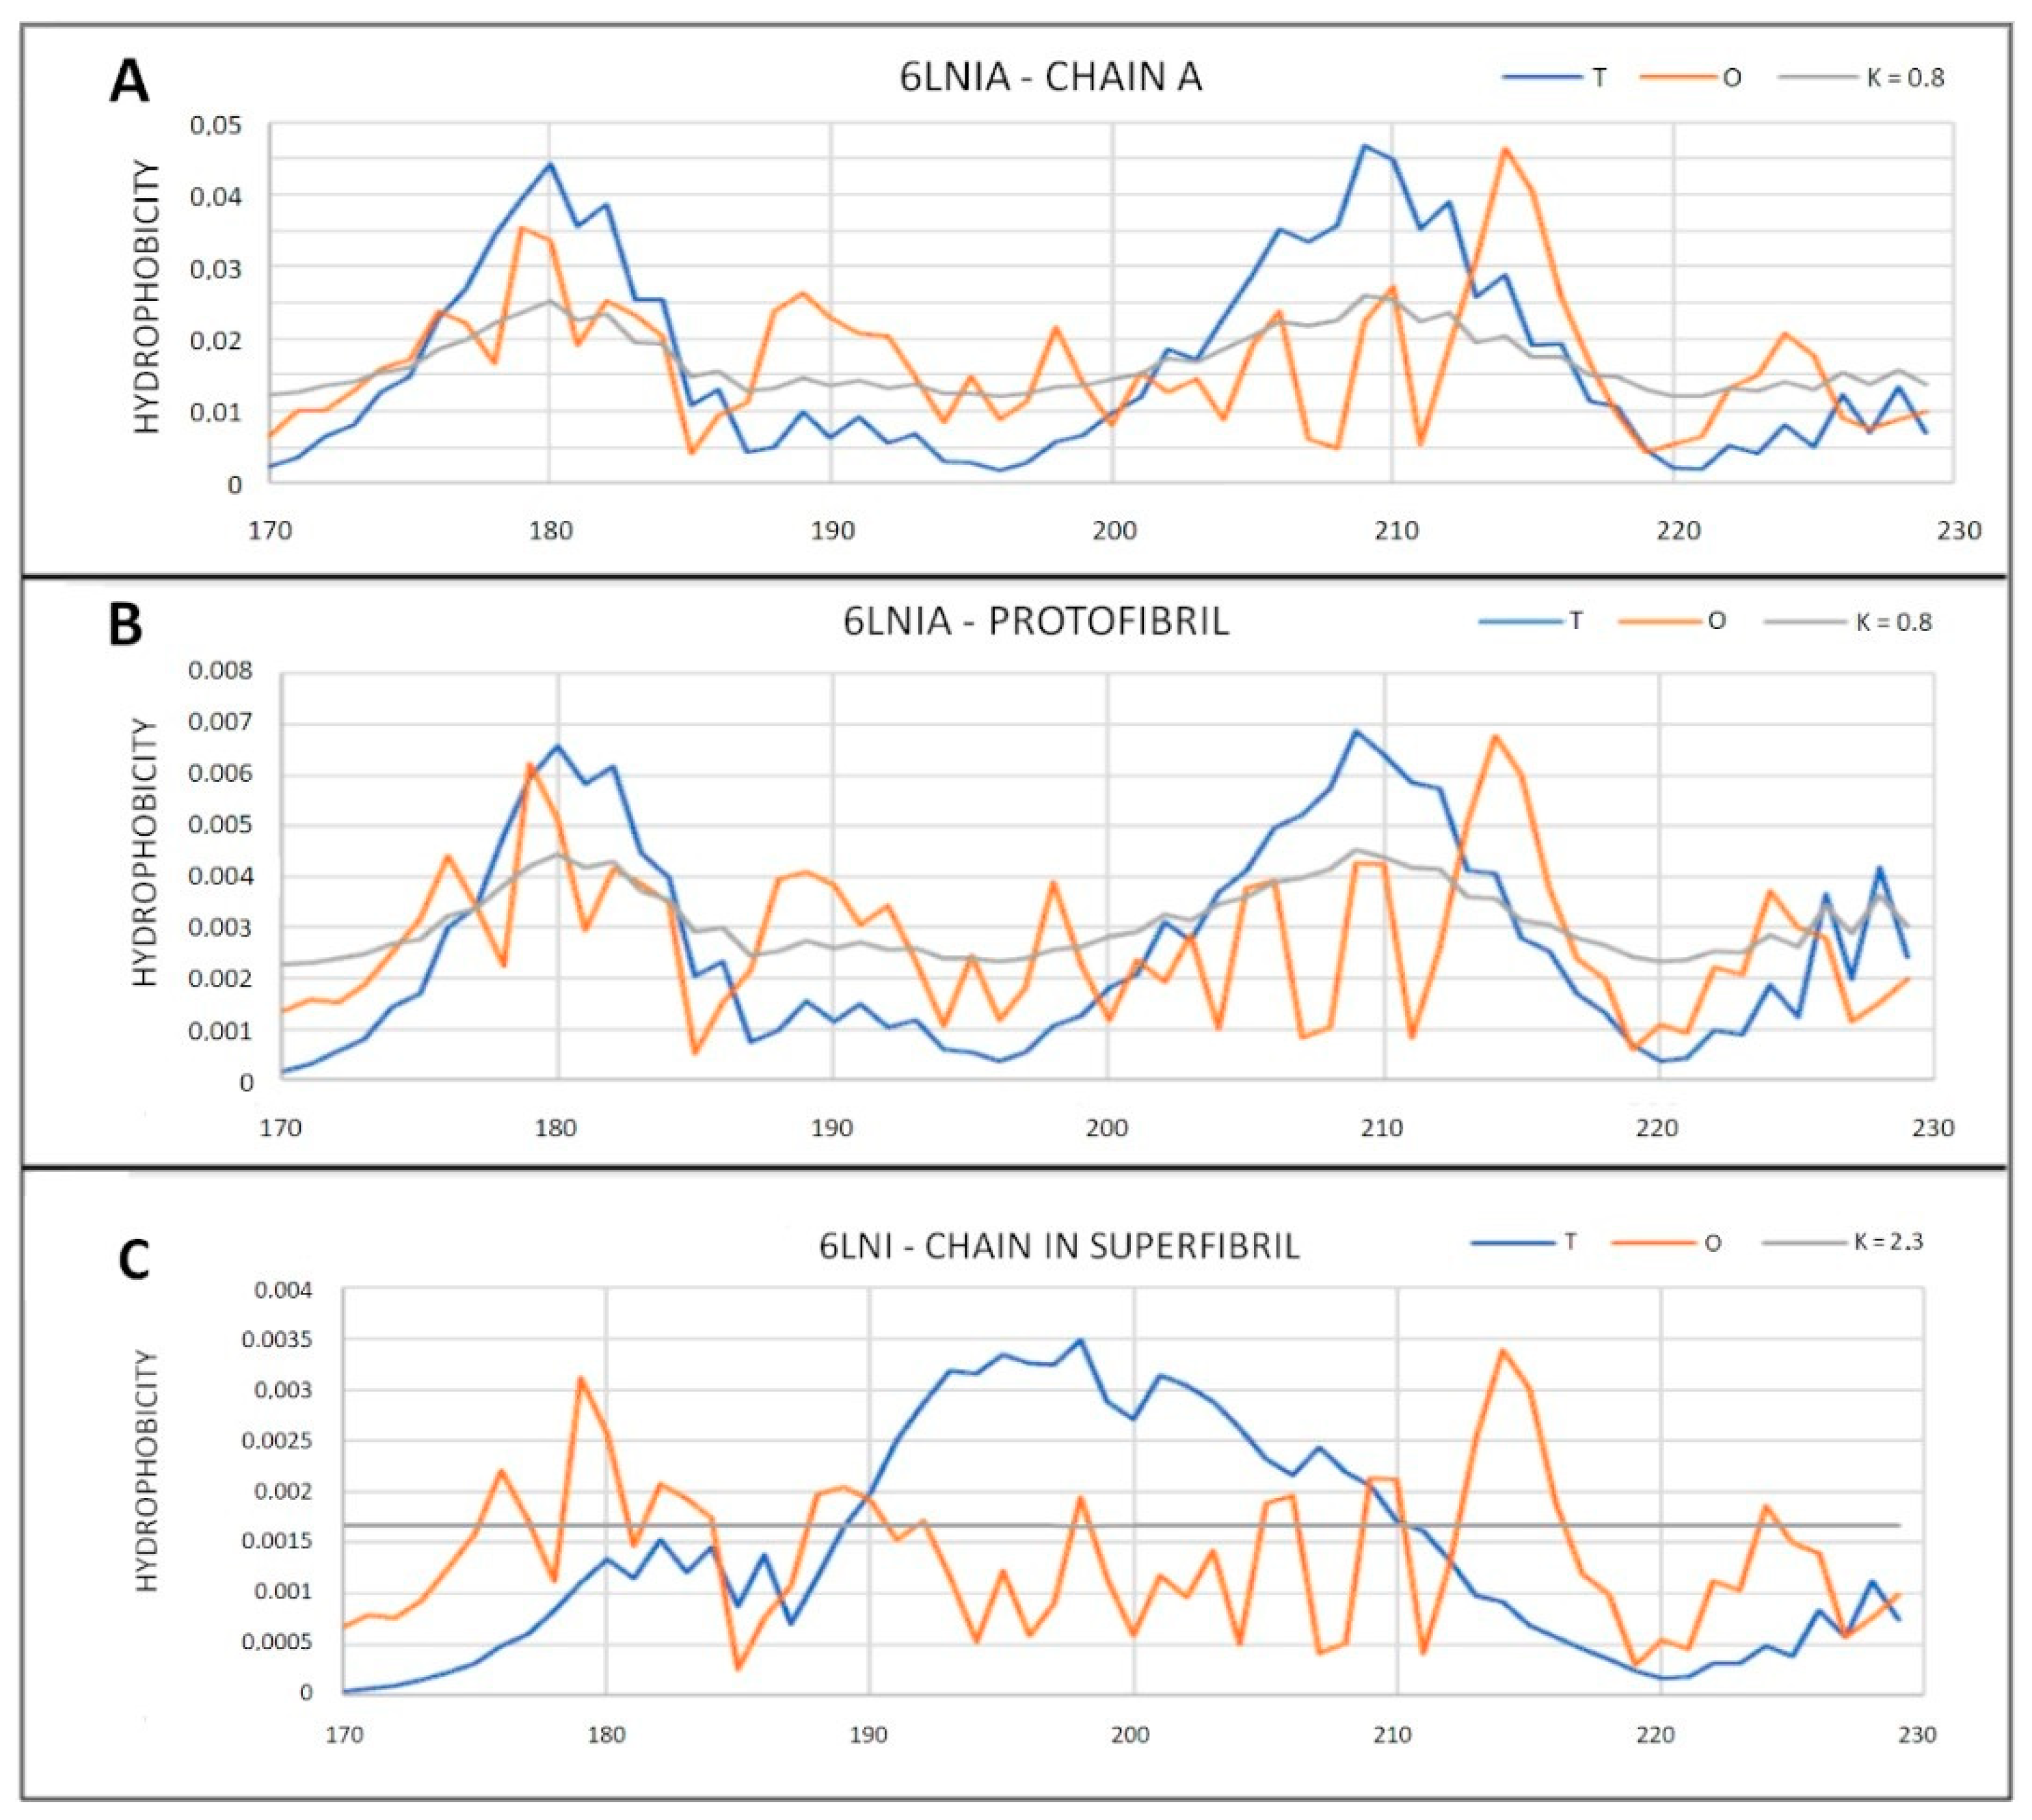
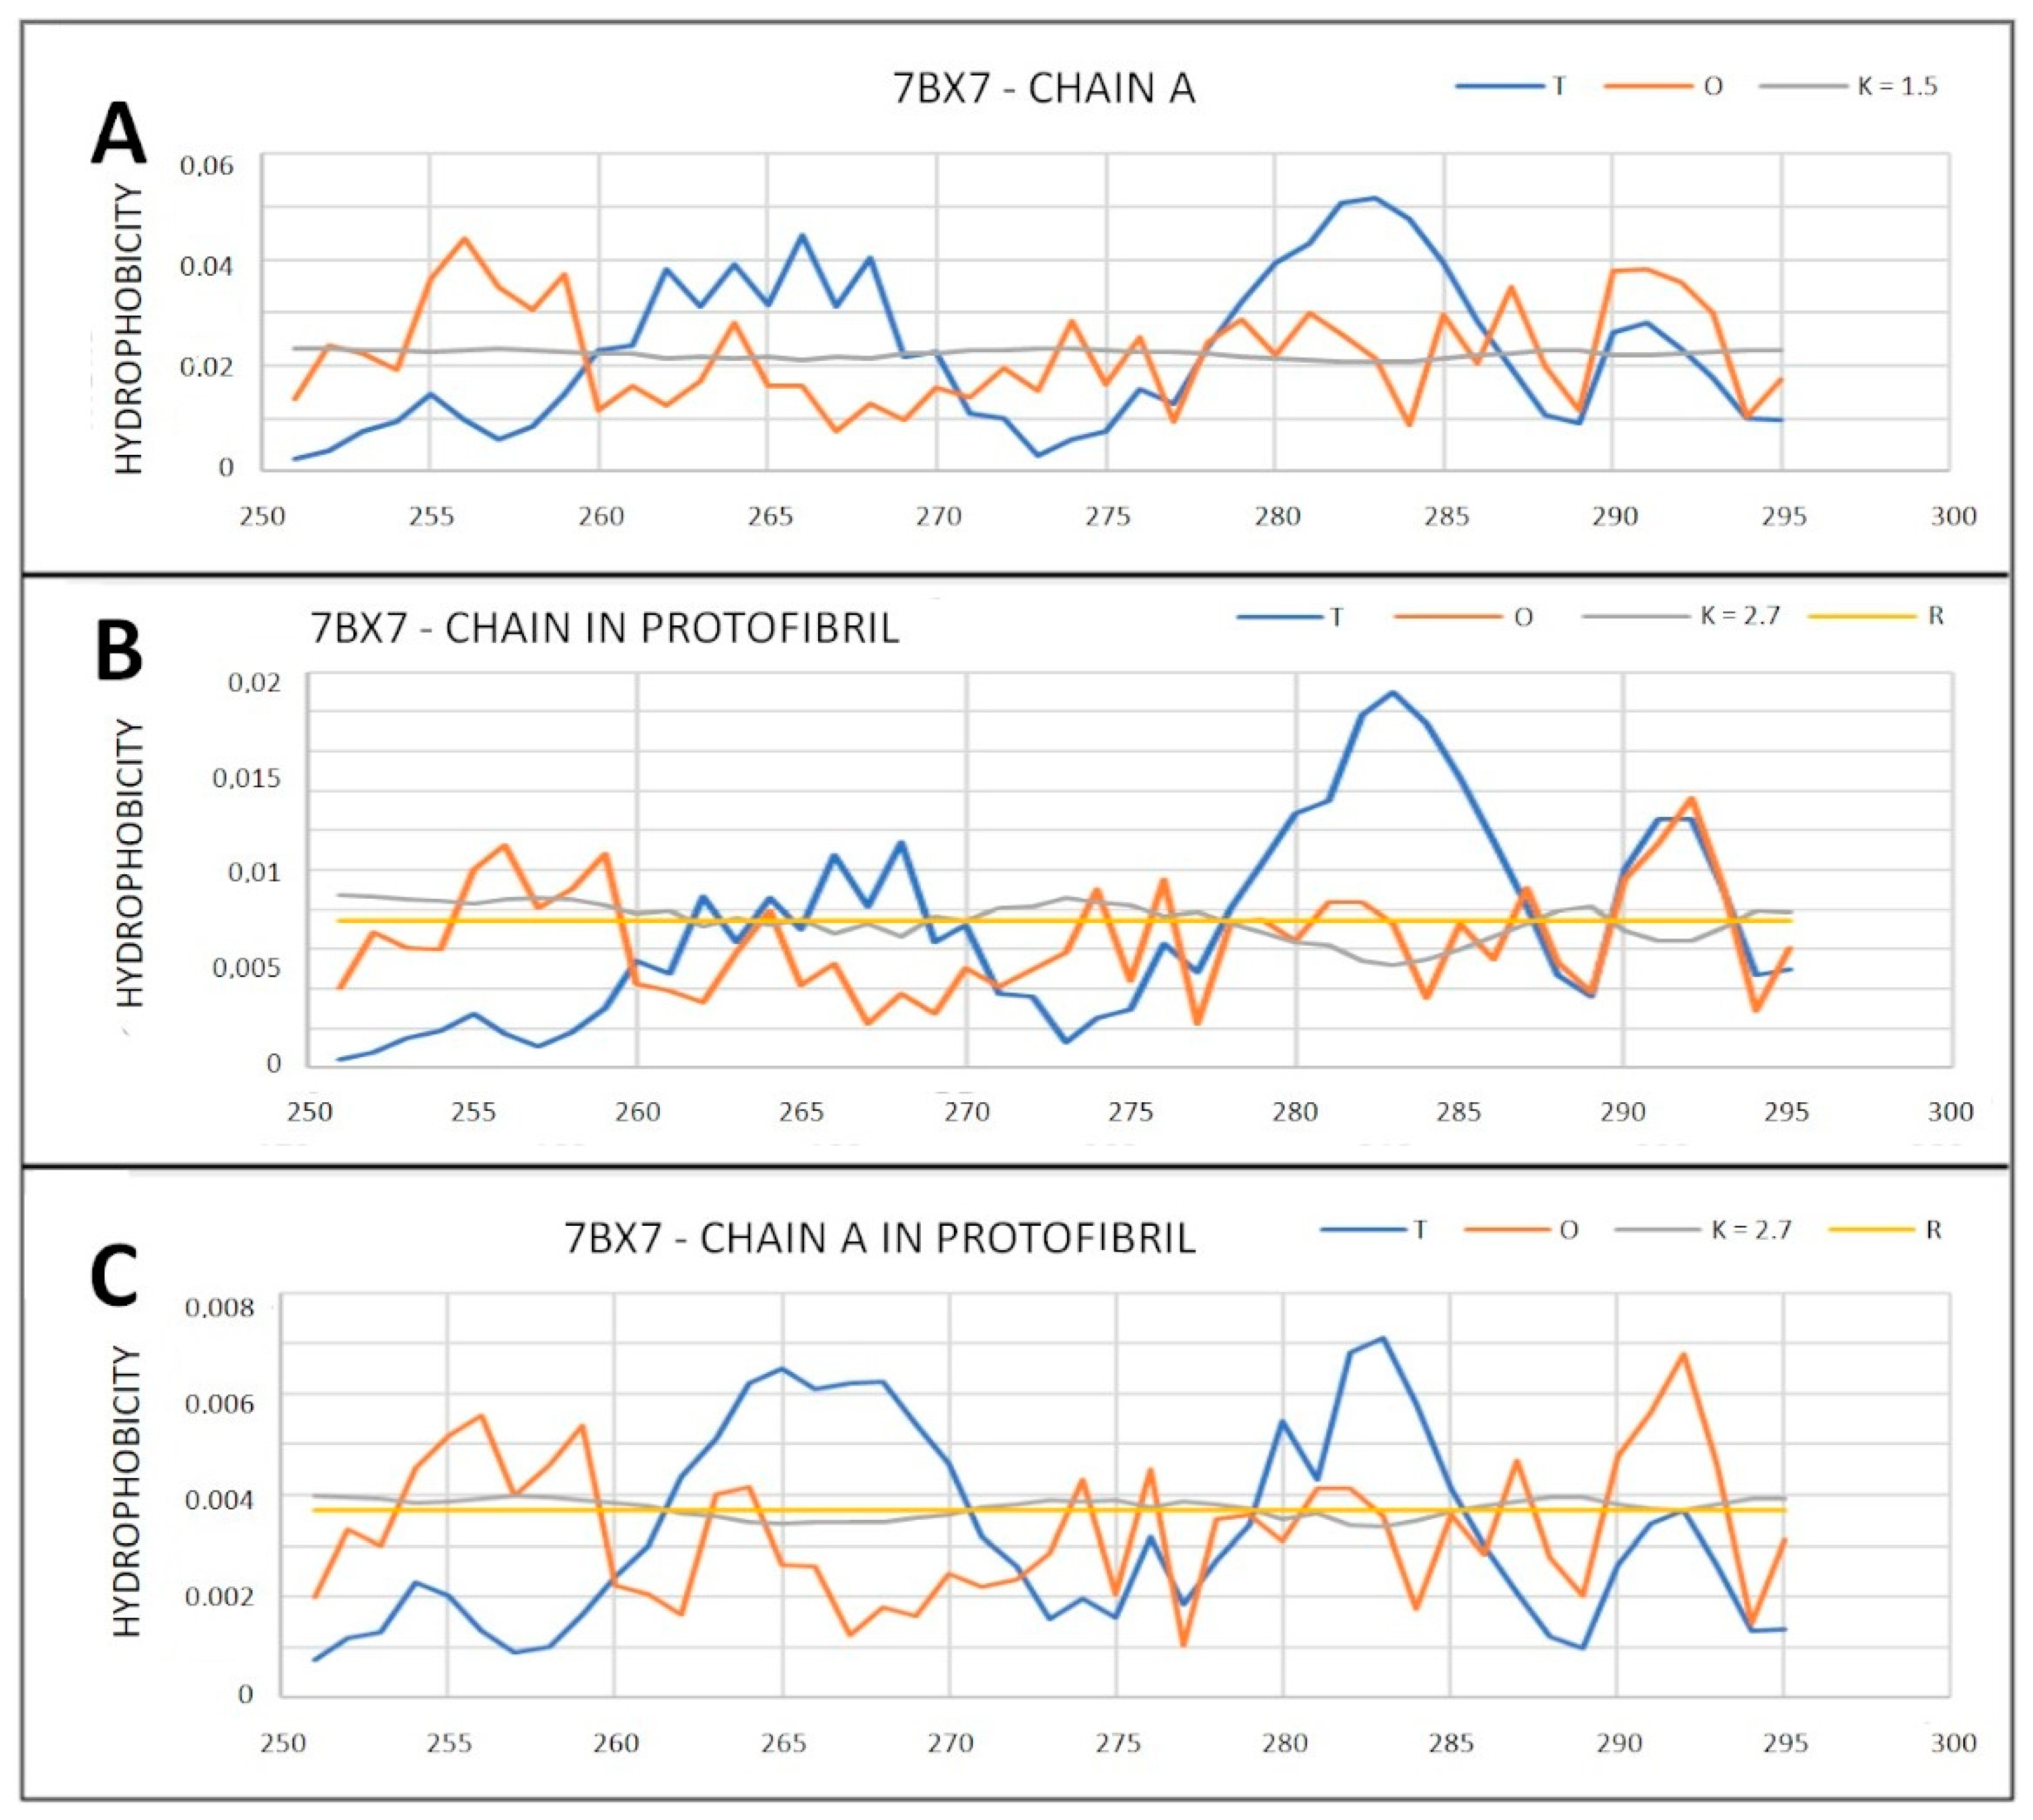
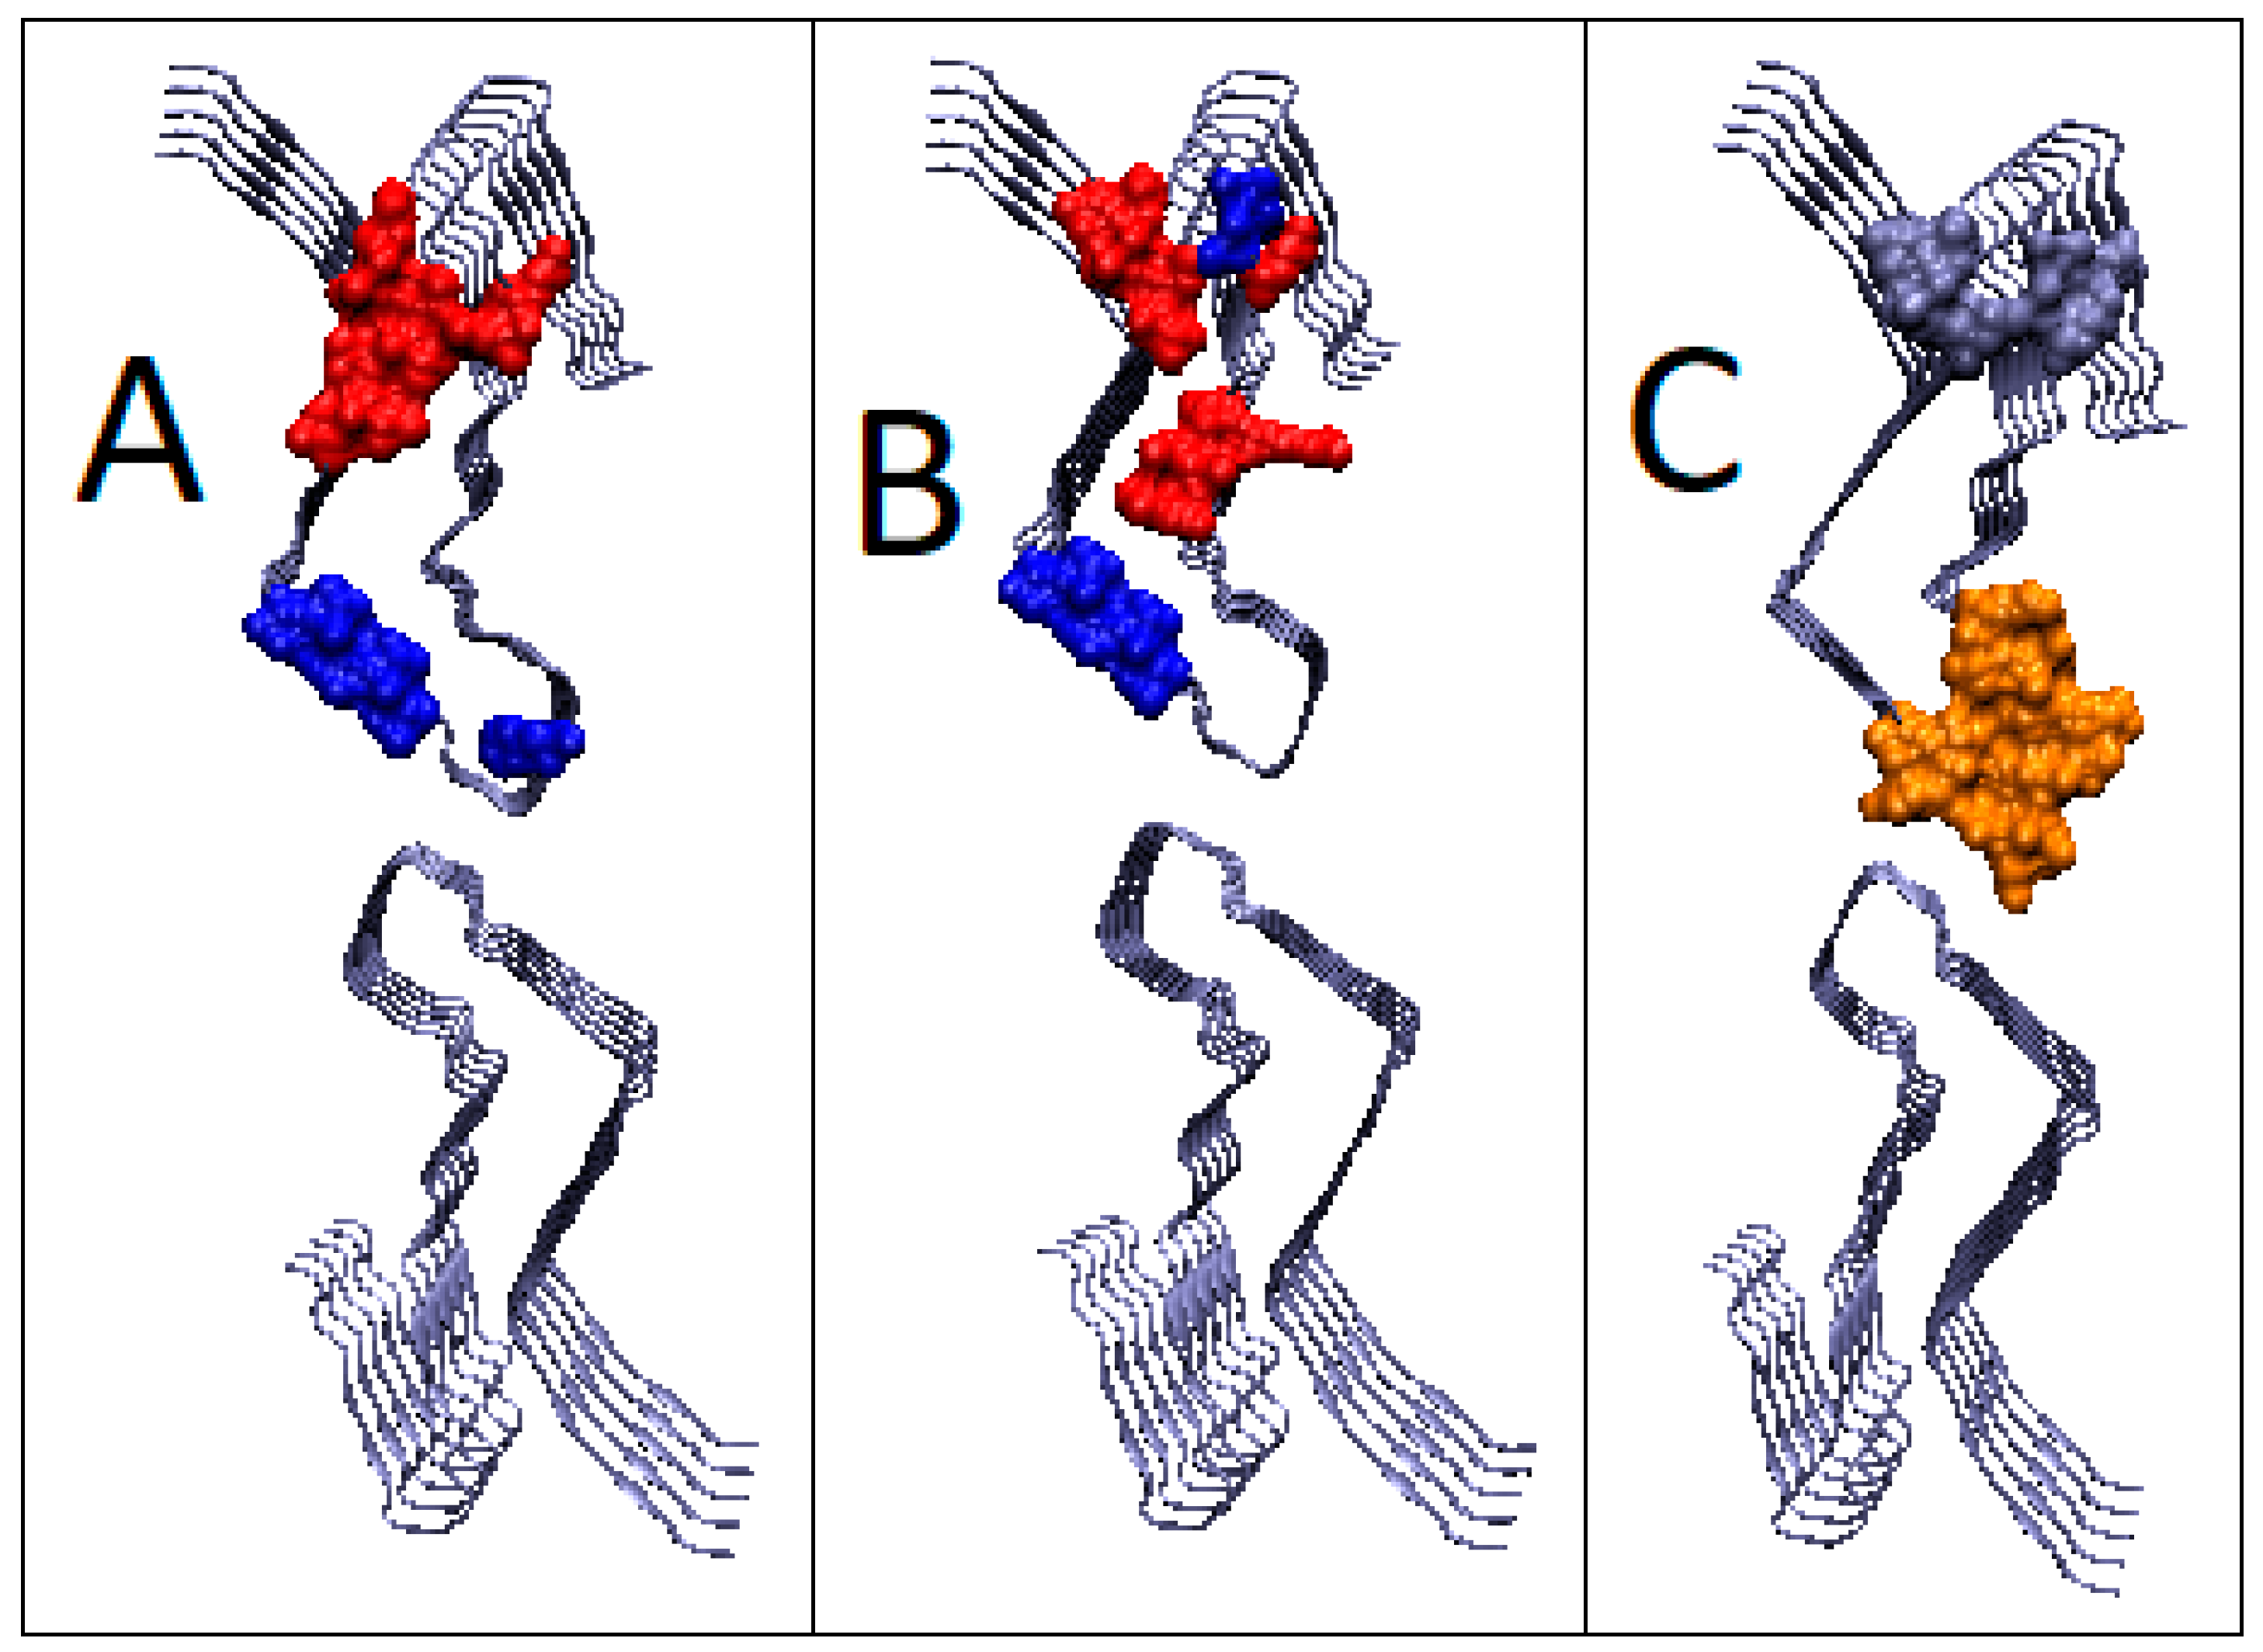
2.6.1. Amyloids
2.6.2. Super-Fibrillary Amyloids
3. Discussion
4. Materials and Methods
4.1. Programs Used
- The program allowing calculation of RD is accessible upon request on CodeOcean platform: [66] https://codeocean.com/capsule/3084411/tree. Please contact the corresponding author to obtain access to your private program instance.
- In order to ensure reproducibility of results and provide easy access to the computations discussed in this paper, the authors have also implemented an online tool where the FOD computations can be performed on arbitrary protein structures, including the structures discussed in this paper. The application—implemented in collaboration with the Sano Centre for Computational Medicine (https://sano.science, accessed on November 2021) and running on resources contributed by ACC Cyfronet AGH (https://www.cyfronet.pl, accessed on November 2021) in the framework of the PL-Grid Infrastructure (https://plgrid.pl, accessed on December 2021)—provides a web wrapper for the abovementioned computational component, and it is freely available at [67] https://hphob.sano.science—the dialog window shown in Figure 21.
4.2. Data
5. Conclusions
- Fundamental change in the strategy of creating large-molecular structures by amyloids in relation to protein complexes;
- Participation of the environment in the discussed process, resulting in the conclusion that the modification of the environment may result in amyloid transformation of almost any protein [56].
Supplementary Materials
Author Contributions
Funding
Institutional Review Board Statement
Informed Consent Statement
Data Availability Statement
Acknowledgments
Conflicts of Interest
References
- Dill, K.A.; Ozkan, S.B.; Shell, M.S.; Weikl, T.R. The Protein Folding Problem. Annu. Rev. Biophys. 2008, 37, 289–316. [Google Scholar] [CrossRef]
- Dill, K.A.; MacCallum, J.L. The Protein-Folding Problem, 50 Years on. Science 2012, 338, 1042–1046. [Google Scholar] [CrossRef] [PubMed] [Green Version]
- Makhatadze, G.I.; Privalov, P.L. On the Entropy of Protein Folding. Protein Sci. 1996, 5, 507–510. [Google Scholar] [CrossRef] [Green Version]
- Dear, A.J.; Michaels, T.C.T.; Meisl, G.; Klenerman, D.; Wu, S.; Perrett, S.; Linse, S.; Dobson, C.M.; Knowles, T.P.J. Kinetic Diversity of Amyloid Oligomers. Proc. Natl. Acad. Sci. USA 2020, 117, 12087–12094. [Google Scholar] [CrossRef]
- Schonbrun, J.; Dill, K.A. Fast Protein Folding Kinetics. Proc. Natl. Acad. Sci. USA 2003, 100, 12678–12682. [Google Scholar] [CrossRef] [Green Version]
- Dobson, C.M. The Amyloid Phenomenon and Its Links with Human Disease. Cold Spring Harb. Perspect Biol. 2017, 9, a023648. [Google Scholar] [CrossRef] [Green Version]
- Ke, P.C.; Zhou, R.; Serpell, L.C.; Riek, R.; Knowles, T.P.J.; Lashuel, H.A.; Gazit, E.; Hamley, I.W.; Davis, T.P.; Fändrich, M.; et al. Half a Century of Amyloids: Past. Present and Future. Chem. Soc. Rev. 2020, 49, 5473–5509. [Google Scholar] [CrossRef]
- Fändrich, M.; Dobson, C.M. The Behaviour of Polyamino Acids Reveals an Inverse Side Chain Effect in Amyloid Structure Formation. EMBO J. 2002, 21, 5682–5690. [Google Scholar] [CrossRef] [Green Version]
- Papp, D.; Szigyártó, I.C.; Nordén, B.; Perczel, A.; Beke-Somfai, T. Structural Water Stabilizes Protein Motifs in Liquid Protein Phase: The Folding Mechanism of Short β-Sheets Coupled to Phase Transition. Int. J. Mol. Sci. 2021, 22, 8595. [Google Scholar] [CrossRef]
- Urbic, T.; Dill, K.A. Water Is a Cagey Liquid. J. Am. Chem. Soc. 2018, 140, 7106–17113. [Google Scholar] [CrossRef]
- Banach, M.; Stapor, K.; Konieczny, L.; Fabian, P.; Roterman, I. Downhill, Ultrafast and Fast Folding Proteins Revised. Int. J. Mol. Sci. 2020, 21, 7632. [Google Scholar] [CrossRef]
- Roterman, I.; Banach, M.; Konieczny, L. Application of the Fuzzy Oil Drop Model Describes Amyloid as a Ribbonlike Micelle. Entropy 2017, 19, 167. [Google Scholar] [CrossRef] [Green Version]
- Roterman, I.; Stapor, K.; Fabian, P.; Konieczny, L. In Silico Modeling of the Influence of Environment on Amyloid Folding Using FOD-M Model. Int. J. Mol. Sci. 2021, 22, 10587. [Google Scholar] [CrossRef]
- Kelly, J.W. The Environmental Dependency of Protein Folding Best Explains Prion and Amyloid Diseases. Proc. Natl. Acad. Sci. USA 1998, 95, 930–932. [Google Scholar] [CrossRef] [Green Version]
- Serpell, L.C. Alzheimer’s Amyloid Fibrils: Structure and Assembly. Biochim. Biophys. Acta 2000, 1502, 16–30. [Google Scholar] [CrossRef] [Green Version]
- Galvagnion, C.; Buell, A.K.; Meisl, G.; Michaels, T.C.T.; Vendruscolo, M.; Knowles, T.P.J.; Dobson, C.M. Lipid Vesicles Trigger α-Synuclein Aggregation by Stimulating Primary Nucleation. Nat. Chem. Biol. 2015, 11, 229–234. [Google Scholar] [CrossRef] [Green Version]
- Fusco, G.; Chen, S.W.; Williamson, P.T.F.; Cascella, R.; Perni, M.; Jarvis, J.A.; Cecchi, C.; Vendruscolo, M.; Chiti, F.; Cremades, N.; et al. Structural Basis of Membrane Disruption and Cellular Toxicity by α-Synuclein Oligomers. Science 2017, 358, 1440–1443. [Google Scholar] [CrossRef] [Green Version]
- van Rooijen, B.D.; Claessens, M.M.A.E.; Subramaniam, V. Membrane Interactions of Oligomeric Alpha-Synuclein: Potential Role in Parkinson’s Disease. Curr. Protein Pept. Sci. 2010, 11, 334–342. [Google Scholar] [CrossRef]
- Cecchi, C.; Stefani, M. The Amyloid-Cell Membrane System. The Interplay between the Biophysical Features of Oligomers/Fibrils and Cell Membrane Defines Amyloid Toxicity. Biophys. Chem. 2013, 182, 30–43. [Google Scholar] [CrossRef]
- Berman, H.M.; Westbrook, J.; Feng, Z.; Gilliland, G.; Bhat, T.N.; Weissig, H.; IShindyalov, I.N.; Bourne, P.E. The Protein Data Bank. Nucleic. Acid. Res. 2000, 28, 235–242. [Google Scholar] [CrossRef] [Green Version]
- Fraser, P.E. Prions and Prion-like Proteins. J. Biol. Chem. 2014, 289, 19839–19840. [Google Scholar] [CrossRef] [Green Version]
- Halliday, M.; Radford, H.; Mallucci, G.R. Prions: Generation and Spread Versus Neurotoxicity. J. Biol. Chem. 2014, 289, 19862–19868. [Google Scholar] [CrossRef] [Green Version]
- Carlson, G.A.; Prusiner, S.B. How an Infection of Sheep Revealed Prion Mechanisms in Alzheimer’s Disease and Other Neurodegenerative Disorders. Int. J. Mol. Sci. 2021, 22, 4861. [Google Scholar] [CrossRef]
- Rambaran, R.N.; Serpell, L.C. Amyloid Fibrils: Abnormal Protein Assembly. Prion 2008, 2, 112–117. [Google Scholar] [CrossRef]
- Calzolai, L.; Zahn, R. Influence of pH on NMR Structure and Stability of the Human Prion Protein Globular Domain. J. Biol. Chem. 2003, 278, 35592–35596. [Google Scholar] [CrossRef] [Green Version]
- Calzolai, L.; Lysek, D.A.; Guntert, P.; von Schroetter, C.; Riek, R.; Zahn, R.; Wüthrich, K. NMR Structures of Three Single-Residue Variants of the Human Prion Protein. Proc. Natl. Acad. Sci. USA 2000, 97, 8340–8345. [Google Scholar] [CrossRef] [Green Version]
- López Garcia, F.L.; Zahn, R.; Riek, R.; Wüthrich, K. NMR Structure of the Bovine Prion Protein. Proc. Natl. Acad. Sci. USA 2000, 97, 8334–8339. [Google Scholar] [CrossRef] [Green Version]
- Nonato, M.C.; Rangel, V.L.; Pavlovici, F.A. Crystal Structure of Human Prion Protein 90-231. PDB 2019. [Google Scholar] [CrossRef]
- Zahn, R.; Liu, A.; Lührs, T.; Riek, R.; von Schroetter, C.; López García, F.; Billeter, M.; Calzolai, L.; Wider, G.; Wüthrich, K. NMR Solution Structure of the Human Prion Protein. Proc. Natl. Acad. Sci. USA 2000, 97, 145–150. [Google Scholar] [CrossRef] [Green Version]
- Zhang, Y.; Swietnicki, W.; Zagorski, M.Z.; Surewicz, W.K.; Sönnichsen, F.D. Solution Structure of the E200K Variant of Human Prion Protein. Implications for the Mechanism of Pathogenesis in Familial Prion Diseases. J. Biol. Chem. 2000, 275, 33650–33654. [Google Scholar] [CrossRef] [Green Version]
- Riek, R.; Hornemann, S.; Wider, G.; Billeter, M.; Glockshuber, R.; Wüthrich, K. NMR Structure of the Mouse Prion Protein Domain PrP(121-231). Nature 1996, 382, 180–182. [Google Scholar] [CrossRef] [PubMed]
- Zheng, Z.; Zhang, M.; Wang, Y.; Ma, R.; Guo, C.; Feng, L.; Wu, J.; Yao, H.; Lin, D. Structural Basis for the Complete Resistance of the Human Prion Protein Mutant G127V to Prion Disease. Sci. Rep. 2018, 8, 13211. [Google Scholar] [CrossRef]
- Slapsak, U.; Ilc, G.; Plavec, J. Solution Structure of Mule Deer Prion Protein with Polymorphism s138. PDB 2019. [Google Scholar] [CrossRef]
- Kovač, V.; Zupančič, B.; Ilc, G.; Plavec, J.; Šerbec, V.C. Truncated Prion Protein PrP226*-A Structural View on Its Role in Amyloid Disease. Biochem. Biophys. Res. Commun. 2017, 484, 45–50. [Google Scholar] [CrossRef]
- Sweeting, B.; Brown, E.; Khan, M.Q.; Chakrabartty, A.; Pai, E.F. N-Terminal Helix-Cap in α-Helix 2 Modulates β-State Misfolding in Rabbit and Hamster Prion Proteins. PLoS ONE 2013, 8, e63047. [Google Scholar] [CrossRef] [Green Version]
- Lührs, T.; Riek, R.; Güntert, P.; Wüthrich, K. NMR Structure of the Human Doppel Protein. J. Mol. Biol. 2003, 326, 1549–1557. [Google Scholar] [CrossRef]
- Mo, H.; Moore, R.C.; Cohen, F.E.; Westaway, D.; Prusiner, S.B.; Wright, P.E.; Dyson, H.J. Two Different Neurodegenerative Diseases Caused by Proteins with Similar Structures. Proc. Natl. Acad. Sci. USA 2001, 98, 2352–2357. [Google Scholar] [CrossRef] [Green Version]
- Baral, P.K.; Swayampakula, M.; Aguzzi, A.; James, M.N.G. Structural Characterization of POM6 Fab and Mouse Prion Protein Complex Identifies Key Regions for Prions Conformational Conversion. FEBS J. 2018, 285, 1701–1714. [Google Scholar] [CrossRef] [Green Version]
- Baral, P.K.; Swayampakula, M.; Rout, M.K.; Kav, N.N.V.; Spyracopoulos, L.; Aguzzi, A.; James, M.N.G. Structural Basis of Prion Inhibition by Phenothiazine Compounds. Structure 2014, 22, 291–303. [Google Scholar] [CrossRef] [PubMed] [Green Version]
- Baral, P.K.; Swayampakula, M.; Aguzzi, A.; James, M.N.G. X-ray Structural and Molecular Dynamical Studies of the Globular Domains of Cow, Deer, Elk and Syrian Hamster Prion Proteins. J. Struct. Biol. 2015, 192, 37–47. [Google Scholar] [CrossRef] [PubMed]
- Van Melckebeke, H.; Wasmer, C.; Lange, A.; Ab, E.; Loquet, A.; Böckmann, A.; Meier, B.H. Atomic-Resolution Three-Dimensional Structure of HET-s(218-289) Amyloid Fibrils by Solid-State NMR Spectroscopy. J. Am. Chem. Soc. 2010, 132, 13765–13775. [Google Scholar] [CrossRef] [Green Version]
- Wasmer, C.; Lange, A.; Van Melckebeke, H.; Siemer, A.B.; Riek, R.; Meier, B.H. Amyloid Fibrils of the HET-s(218-289) Prion Form a Beta Solenoid with a Triangular Hydrophobic Core. Science 2008, 319, 1523–1526. [Google Scholar] [CrossRef]
- Herrmann, U.S.; Schütz, A.K.; Shirani, H.; Huang, D.; Saban, D.; Nuvolone, M.; Li, B.; Ballmer, B.; Åslund, A.K.O.; Mason, J.J.; et al. Structure-Based Drug Design Identifies Polythiophenes as Antiprion Compounds. Sci. Transl. Med. 2015, 7, 299ra123. [Google Scholar] [CrossRef] [PubMed]
- Schütz, A.K.; Soragni, A.; Hornemann, S.; Aguzzi, A.; Ernst, M.; Böckmann, A.; Meier, B.H. The Amyloid-Congo Red Interface at Atomic Resolution. Angew. Chem. Int. Ed. Engl. 2011, 50, 5956–5960. [Google Scholar] [CrossRef] [PubMed]
- Kraus, A.; Hoyt, F.; Schwartz, C.L.; Hansen, B.; Hughson, A.G.; Artikis, E.; Race, B.; Caughey, B. High-Resolution Structure and Strain Comparison of Infectious Mammalian Prions. Mol. Cell 2021, 81, 4540–4551. [Google Scholar] [CrossRef]
- Murray, D.T.; Kato, M.; Lin, Y.; Thurber, K.R.; Hung, I.; McKnight, S.L.; Tycko, R. Structure of FUS Protein Fibrils and Its Relevance to Self-Assembly and Phase Separation of Low-Complexity Domains. Cell 2017, 171, 615–627. [Google Scholar] [CrossRef] [Green Version]
- Martinez, D.; Daskalov, A.; Andreas, L.; Bardiaux, B.; Coustou, V.; Stanek, J.; Berbon, M.; Noubhani, M.; Kauffmann, B.; Wall, J.S.; et al. Solid-state MAS NMR structure of the HELLF prion amyloid fibrils. PDB 2018. [Google Scholar] [CrossRef]
- Glynn, C.; Sawaya, M.R.; Ge, P.; Gallagher-Jones, M.; Short, C.W.; Bowman, R.; Apostol, M.; Zhou, Z.H.; Eisenberg, D.S.; Rodriguez, J.A. Cryo-EM Structure of a Human Prion Fibril with a Hydrophobic, Protease-Resistant Core. Nat. Struct. Mol. Biol. 2020, 27, 417–423. [Google Scholar] [CrossRef] [PubMed]
- Bansal, A.; Schmidt, M.; Rennegarbe, M.; Haupt, C.; Liberta, F.; Stecher, S.; Puscalau-Girtu, I.; Biedermann, A.; Fändrich, M. AA Amyloid Fibrils from Diseased Tissue Are Structurally Different from in vitro Formed SAA Fibrils. Nat. Commun. 2021, 12, 1013. [Google Scholar] [CrossRef]
- Wang, L.-Q.; Zhao, K.; Yuan, H.-Y.; Wang, Q.; Guan, Z.; Tao, J.; Li, X.-N.; Sun, Y.; Yi, C.-W.; Chen, J.; et al. Cryo-EM Structure of an Amyloid Fibril Formed by Full-Length Human Prion Protein. Nat. Struct. Mol. Biol. 2020, 27, 598–602. [Google Scholar] [CrossRef]
- Hervas, R.; Rau, M.J.; Park, Y.; Zhang, W.; Murzin, A.G.; Fitzpatrick, J.A.; Scheres, S.H.; Si, K. Cryo-Em Structure of a Neuronal Functional Amyloid Implicated in Memory Persistence in Drosophila. Science 2020, 367, 1230–1234. [Google Scholar] [CrossRef] [PubMed]
- Sun, Y.; Zhao, K.; Xia, W.; Feng, G.; Gu, J.; Ma, Y.; Gui, X.; Zhang, X.; Fang, Y.; Sun, B.; et al. The Nuclear Localization Sequence Mediates hnRNPA1 Amyloid Fibril Formation Revealed by cryoEM Structure. Nat. Commun. 2020, 11, 6349. [Google Scholar] [CrossRef]
- Myers, J.; Moore, S.A.; Shamoo, Y. Structure-Based Incorporation of 6-Methyl-8-(2-Deoxy-Beta-Ribofuranosyl) Isoxanthopteridine into the Human Telomeric Repeat DNA as a Probe for UP1 Binding and Destabilization of G-Tetrad Structures. J. Biol. Chem. 2003, 278, 42300–42306. [Google Scholar] [CrossRef] [PubMed] [Green Version]
- Levitt, M. A Simplified Representation of Protein Conformations for Rapid Simulation of Protein Folding. J. Mol. Biol. 1976, 104, 59–107. [Google Scholar] [CrossRef]
- Kullback, S.; Leibler, R.A. On Information and Sufficiency. Ann. Math. Stat. 1951, 22, 79–86. [Google Scholar] [CrossRef]
- Chiti, F.; Webster, P.; Taddei, N.; Clark, A.; Stefani, M.; Ramponi, G.; Dobson, C.M. Designing Conditions for in vitro Formation of Amyloid Protofilaments and Fibrils. Proc. Natl. Acad. Sci. USA 1999, 96, 3590–3594. [Google Scholar] [CrossRef] [Green Version]
- Fabian, P.; Banach, M.; Stapor, K.; Konieczny, L.; Ptak-Kaczor, M.; Roterman, I. The Structure of Amyloid Versus the Structure of Globular Proteins. Int. J. Mol. Sci. 2020, 21, 4683. [Google Scholar] [CrossRef]
- Marshall, K.E.; Vadukul, D.M.; Dahal, L.; Theisen, A.; Fowler, M.W.; Al-Hilaly, Y.; Ford, L.; Kemenes, G.; Day, I.J.; Staras, K.; et al. A Critical Role for the Self-Assembly of Amyloid-β1-42 in Neurodegeneration. Sci. Rep. 2016, 6, 30182. [Google Scholar] [CrossRef] [Green Version]
- He, Y.; Chen, Y.; Alexander, P.A.; Bryan, P.N.; Orban, J. Mutational Tipping Points for Switching Protein Folds and Functions. Structure 2012, 20, 283–291. [Google Scholar] [CrossRef] [PubMed] [Green Version]
- Banach, M.; Fabian, P.; Stapor, K.; Konieczny, L.; Roterman, I. Structure of the Hydrophobic Core Determines the 3D Protein Structure—Verification by Single Mutation Proteins. Biomolecules 2020, 10, 767. [Google Scholar] [CrossRef]
- Urbic, T.; Dill, K.A. Analytical Theory of the Hydrophobic Effect of Solutes in Water. Phys. Rev. E 2017, 96, 032101. [Google Scholar] [CrossRef] [Green Version]
- Lukšič, M.; Urbic, T.; Hribar-Lee, B.; Dill, K.A. Simple Model of Hydrophobic Hydration. J. Phys. Chem. B 2012, 116, 6177–6186. [Google Scholar] [CrossRef] [Green Version]
- Fennell, C.J.; Kehoe, C.W.; Dill, K.A. Modeling Aqueous Solvation with Semi-Explicit Assembly. Proc. Natl. Acad. Sci. USA 2011, 108, 3234–3239. [Google Scholar] [CrossRef] [PubMed] [Green Version]
- Coskuner-Weber, O.; Uversky, V.N. Insights into the Molecular Mechanisms of Alzheimer’s and Parkinson’s Diseases with Molecular Simulations: Understanding the Roles of Artificial and Pathological Missense Mutations in Intrinsically Disordered Proteins Related to Pathology. Int. J. Mol. Sci. 2018, 19, 336. [Google Scholar] [CrossRef] [Green Version]
- Korsak, M.; Kozyreva, T. Beta Amyloid Hallmarks: From Intrinsically Disordered Proteins to Alzheimer’s Disease. Adv. Exp. Med. Biol. 2015, 870, 401–421. [Google Scholar] [CrossRef] [PubMed]
- CodeOcean. Available online: https://codeocean.com/capsule/3084411/tree (accessed on 15 December 2021).
- HPHOB. Available online: https://hphob.sano.science (accessed on 15 November 2021).
- VMD (Visual Molecular Dynamics). Available online: https://www.ks.uiuc.edu/Research/vmd/ (accessed on 15 December 2021).
- Hsin, J.; Arkhipov, A.; Yin, Y.; Stone, J.E.; Schulten, K. Using VMD: An Introductory Tutorial. Curr. Protoc. Bioinform. 2008, 24, 5–7. [Google Scholar] [CrossRef] [PubMed] [Green Version]
- Mentré, P. Water in the Orchestration of the Cell Machinery. Some Misunderstandings: A Short Review. J. Biol. Phys. 2012, 38, 13–26. [Google Scholar] [CrossRef] [Green Version]
- Eulitz, M.; Weiss, D.T.; Solomon, A. Immunoglobulin Heavy-Chain-Associated Amyloidosis. Proc. Natl. Acad. Sci. USA 1990, 87, 6542–6546. [Google Scholar] [CrossRef] [Green Version]
- Ferreira, N.; Gonçalves, N.P.; Jan, A.; Jensen, N.M.; van der Laan, A.; Mohseni, S.; Vægter, C.B.; Jensen, P.H. Trans-Synaptic Spreading of Alpha-Synuclein Pathology through Sensory Afferents Leads to Sensory Nerve Degeneration and Neuropathic Pain. Acta Neuropathol. Commun. 2021, 9, 31. [Google Scholar] [CrossRef]
- van Den Berge, N.; Ferreira, N.; Gram, H.; Mikkelsen, T.W.; Alstrup, A.K.O.; Casadei, N.; Tsung-Pin, P.; Riess, O.; Nyengaard, J.R.; Tamgüney, G.; et al. Evidence for Bidirectional and Trans-Synaptic Parasympathetic and Sympathetic Propagation of Alpha-Synuclein in Rats. Acta Neuropathol. 2019, 138, 535–550. [Google Scholar] [CrossRef] [Green Version]
- Ferreira, N.; Gram, H.; Sorrentino, Z.A.; Gregersen, E.; Schmidt, S.I.; Reimer, L.; Betzer, C.; Perez-Gozalbo, C.; Beltoja, M.; Nagaraj, M.; et al. Multiple System Atrophy-Associated Oligodendroglial Protein p25α Stimulates Formation of Novel α-Synuclein Strain with Enhanced Neurodegenerative Potential. Acta Neuropathol. 2021, 142, 87–115. [Google Scholar] [CrossRef] [PubMed]
- Peng, C.; Gathagan, R.J.; Covell, D.J.; Medellin, C.; Stieber, A.; Robinson, J.L.; Zhang, B.; Pitkin, R.M.; Olufemi, M.F.; Luk, K.C.; et al. Cellular Milieu Imparts Distinct Pathological α-Synuclein Strains in α-Synucleinopathies. Nature 2018, 557, 558–563. [Google Scholar] [CrossRef] [PubMed]


| PDB-ID | Chain | Fragment Limited by SS-Bond | ||
|---|---|---|---|---|
| RD | K | RD | K | |
| 1HJN | 0.232 | 0.0 | 0.255 | 0.1 |
| 1HJM | 0.373 | 0.2 | 0.376 | 0.1 |
| 6FNV | 0.385 | 0.0 | 0.469 | 0.0 |
| 1E1W | 0.388 | 0.2 | 0.352 | 0.1 |
| 1DX0 | 0.412 | 0.2 | 0.393 | 0.0 |
| 6DU9 | 0.425 | 0.3 | 0.413 | 0.2 |
| 1QM3 | 0.441 | 0.3 | 0.413 | 0.2 |
| 1FKC | 0.448 | 0.3 | 0.470 | 0.3 |
| 1DX1 | 0.452 | 0.3 | 0.396 | 0.1 |
| 1AG2 | 0.454 | 0.3 | 0.455 | 0.3 |
| 1DWZ | 0.457 | 0.3 | 0.394 | 0.1 |
| 1QLZ | 0.471 | 0.3 | 0.472 | 0.2 |
| Protein | Chain | Fragment Limited by SS-Bond | ||
|---|---|---|---|---|
| RD | K | RD | K | |
| 5YJ5 | 0.539 | 0.5 | 0.466 | 0.0 |
| 90–145 | 0.751 | 2.3 | ||
| 145–231 | 0.513 | 0.4 | 0.524 | 0.3 |
| 6FNV | 0.583 | 0.5 | 0.536 | 0.3 |
| 90–145 | 0.765 | 3.2 | ||
| 145–233 | 0.491 | 0.4 | 0.506 | 0.3 |
| 5L6R | 0.622 | 0.5 | 0.456 | 0.0 |
| 90–130 | 0.776 | 2.1 | ||
| 130–234 | 0.512 | 0.3 | 0.547 | 0.3 |
| 5YJ4 | 0.639 | 0.5 | 0.372 | 0.4 |
| 90–140 | 0.712 | 2.1 | ||
| 140–231 | 0.416 | 0.2 | 0.352 | 0.1 |
| PDB-ID | Dimer/Monomer | Status as Part of Complex | Fragment Limited by SS-Bond | |||
|---|---|---|---|---|---|---|
| RD | K | RD | K | RD | K | |
| 4HLS—AB | 0.547 | 0.4 | ||||
| A | 0.413 | 0.3 | 0.536 | 0.5 | 0.445 | 0.2 |
| B | 0.440 | 0.3 | 0.555 | 0.4 | 0.361 | 0.1 |
| 4HMM—AB | 0.544 | 0.4 | ||||
| A | 0.418 | 0.3 | 0.543 | 0.5 | 0.449 | 0.25 |
| B | 0.428 | 0.3 | 0.543 | 0.4 | 0.357 | 0.1 |
| 4HMR—AB | 0.530 | 0.4 | ||||
| A | 0.434 | 0.3 | 0.520 | 0.4 | 0.451 | 0.2 |
| B | 0.429 | 0.3 | 0.539 | 0.4 | 0.360 | 0.1 |
| PDB-ID | Chain | Fragment Limited by SS-Bond | ||
|---|---|---|---|---|
| RD | K | RD | K | |
| 1LG4 | 0.484 | 0.4 | 0.494 | 0.3 |
| 1I17 | 0.427 | 0.2 | 0.373 | 0.1 |
| PDB-ID | Complex/Monomer | Status as Part of Complex | Fragment Limited by SS-Bond | |||
|---|---|---|---|---|---|---|
| RD | K | RD | K | RD | K | |
| 6AQ7 | 0.717 | |||||
| 6AQ7-P | 0.466 | 0.3 | 0.655 | 1.5 | 0.438 | 0.2 |
| 4YXL | 0.752 | |||||
| 4YXL-P | 0.500 | 0.4 | 0.761 | 2.7 | 0.438 | 0.2 |
| 4MA7 | 0.759 | |||||
| 4MA7-P | 0.481 | 0.4 | 0.766 | 2.4 | 0.434 | 0.2 |
| 4MA8 | 0.779 | |||||
| 4MA8-P | 0.525 | 0.5 | 0.812 | 4.0 | 0.447 | 0.2 |
| PDB-ID | Super-Fibril | Proto-Fibril | One Level | Chain—Individual | ||||
|---|---|---|---|---|---|---|---|---|
| RD | K | RD | K | RD | K | RD | K | |
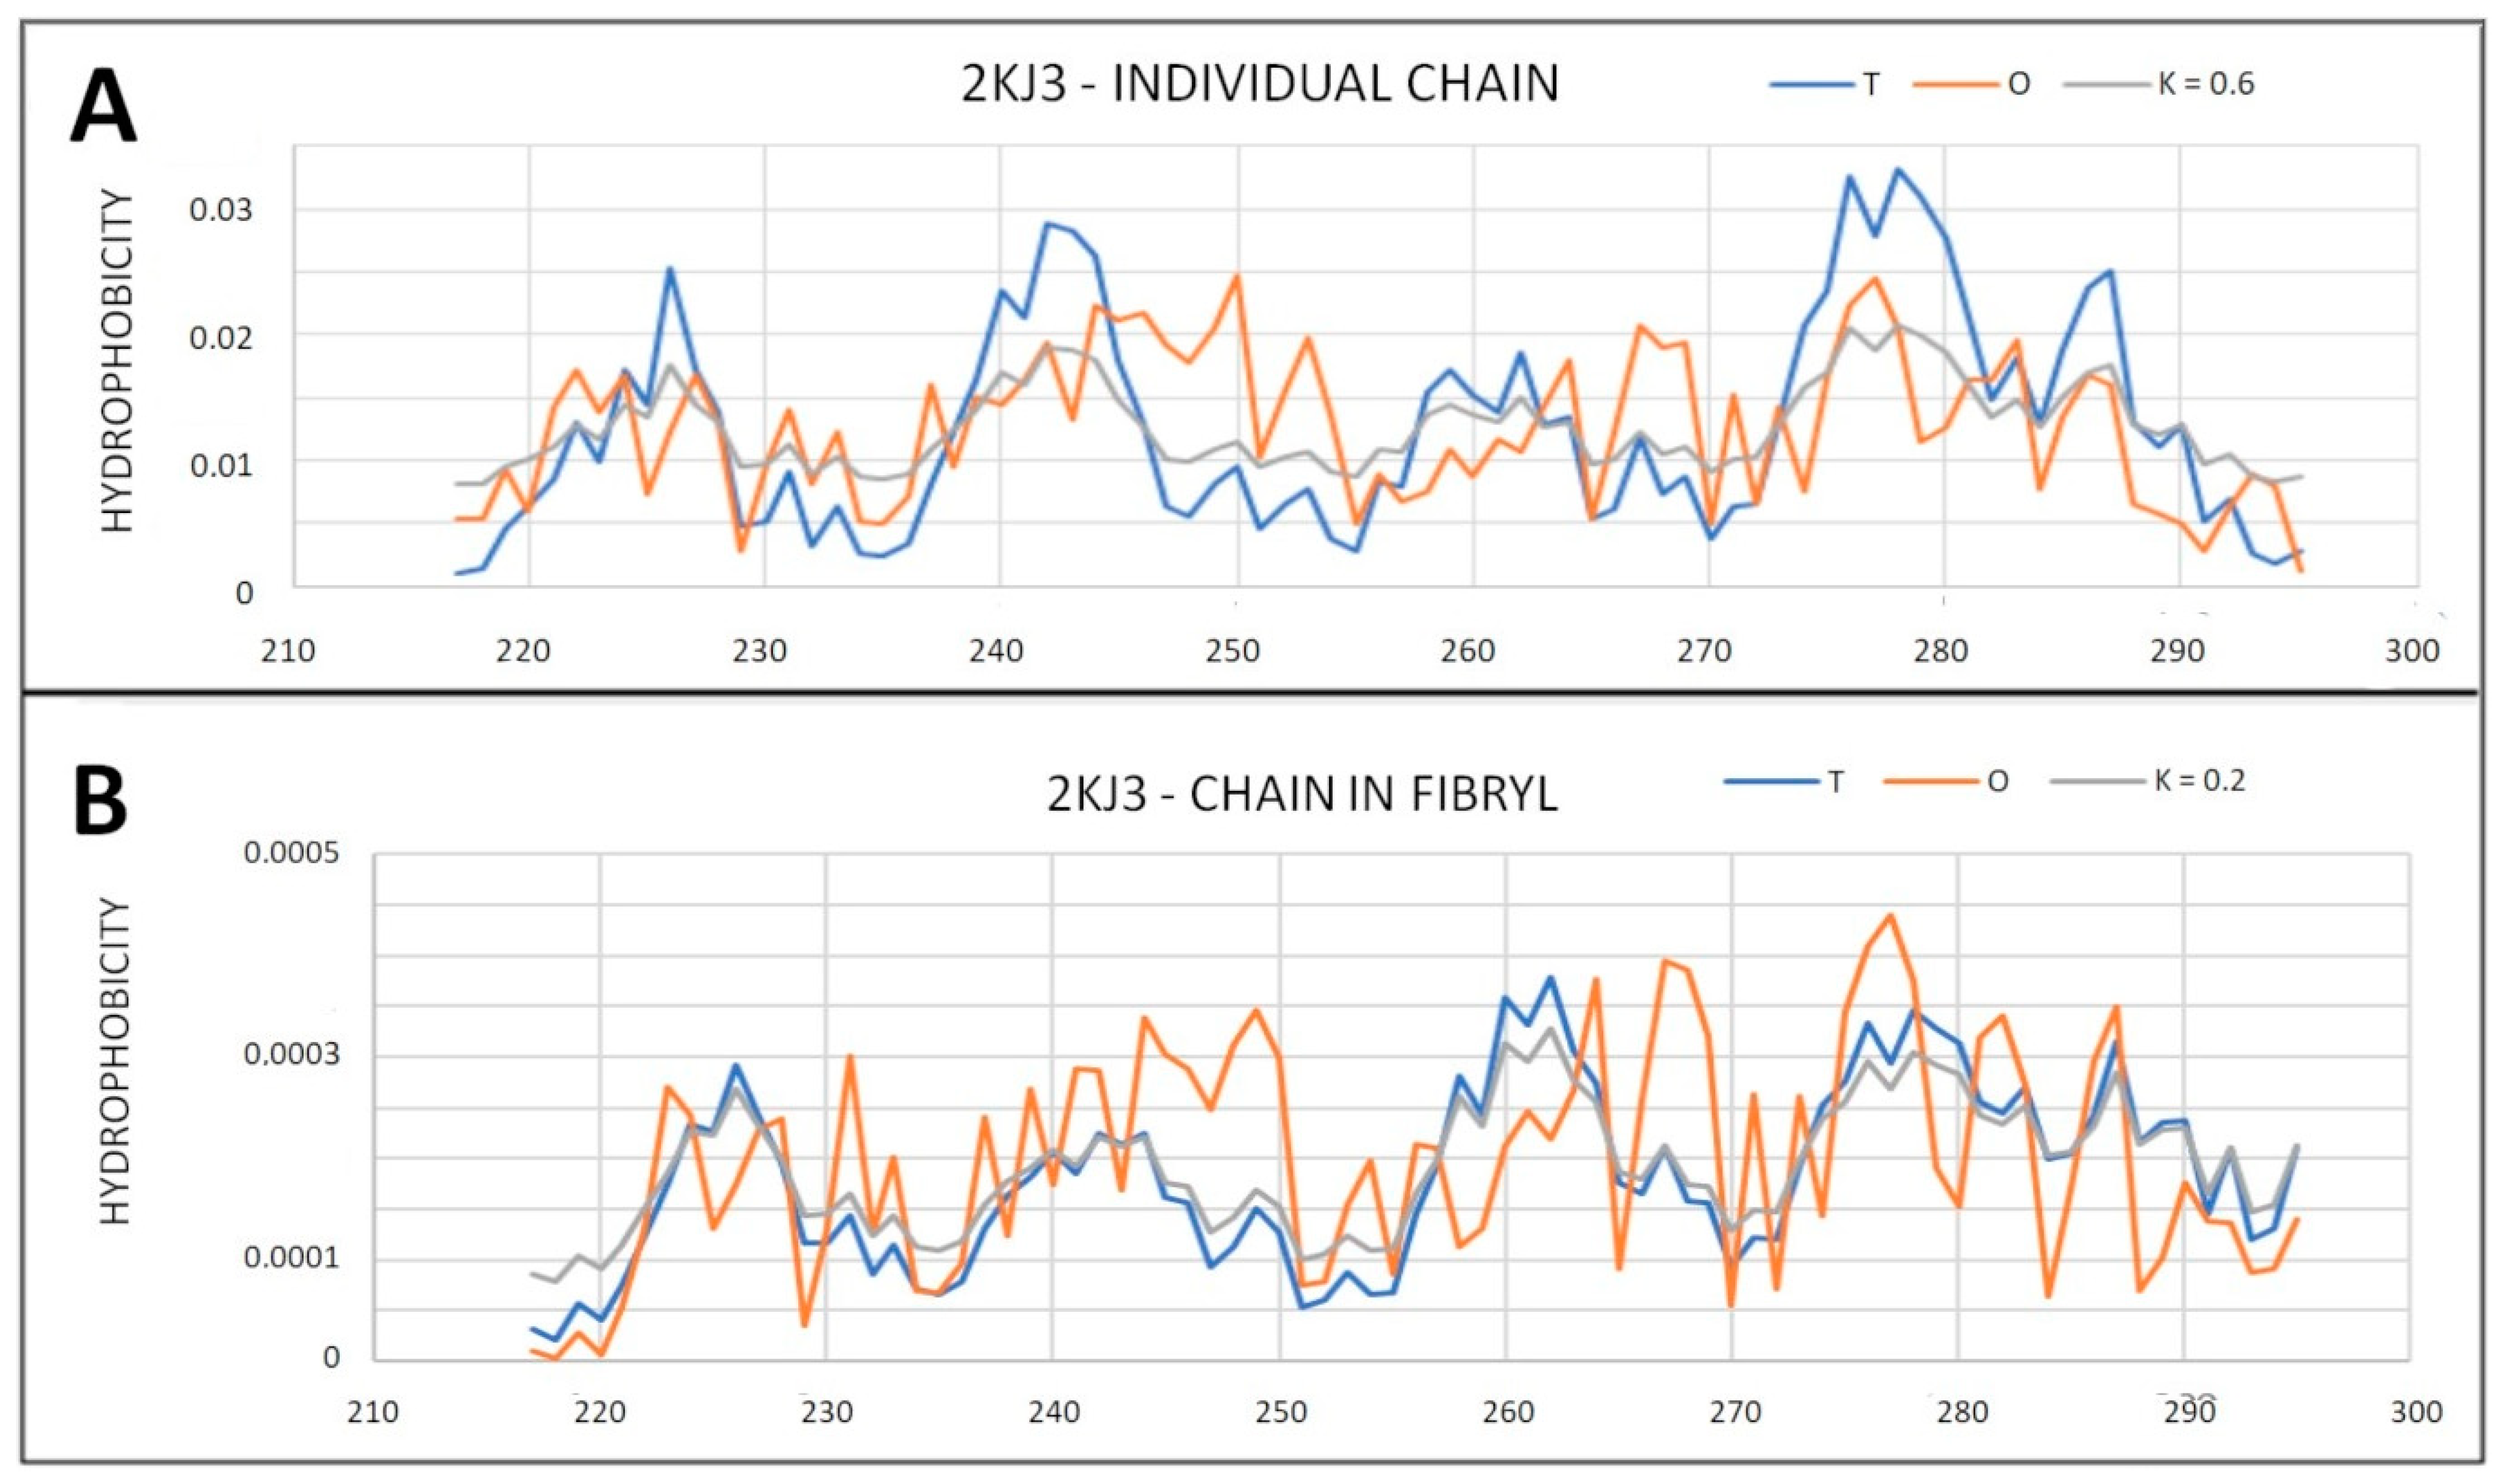
| 2KJ3 | 0.418 | 0.2 | 0.618 | 0.6 | ||||
| 2RNM | 0.446 | 0.3 | 0.644 | 0.8 | ||||
| 2MUS | 0.596 | 0.6 | 0.636 | 0.6 | ||||
| 2LBU | 0.604 | 0.6 | 0.652 | 0.8 | ||||
| 7LNA | 0.612 | 0.6 | 0.568 | 0.5 | ||||
| 5W3N | 0.641 | 0.6 | 0.749 | 0.7 | ||||
| 6EKA | 0.666 | 0.9 | 0.660 | 0.7 | ||||
| 6UUR | 0.668 | 0.7 | 0.745 | 1.0 | 0.659 | 0.6 | 0.730 | 0.8 |
| 6ZCF (2) | 0.716 | 1.5 | 0.620 | 0.8 | 0.756 | 1.6 | 0.695 | 1.0 |
| 6ZCG (4) | 0.778 | 2.0 | 0.623 | 0.9 | 0.828 | 2.1 | 0.673 | 0.9 |
| 6LNI (2) | 0.794 | 2.3 | 0.624 | 0.8 | 0.810 | 2.2 | 0.663 | 0.8 |
| 6VPS (3) | 0.814 | 1.6 | 0.790 | 1.3 | 0.827 | 1.1 | 0.806 | 1.1 |
| 7BX7 (2) | 0.823 | 2.7 | 0.790 | 2.7 | 0.831 | 2.7 | 0.789 | 1.5 |
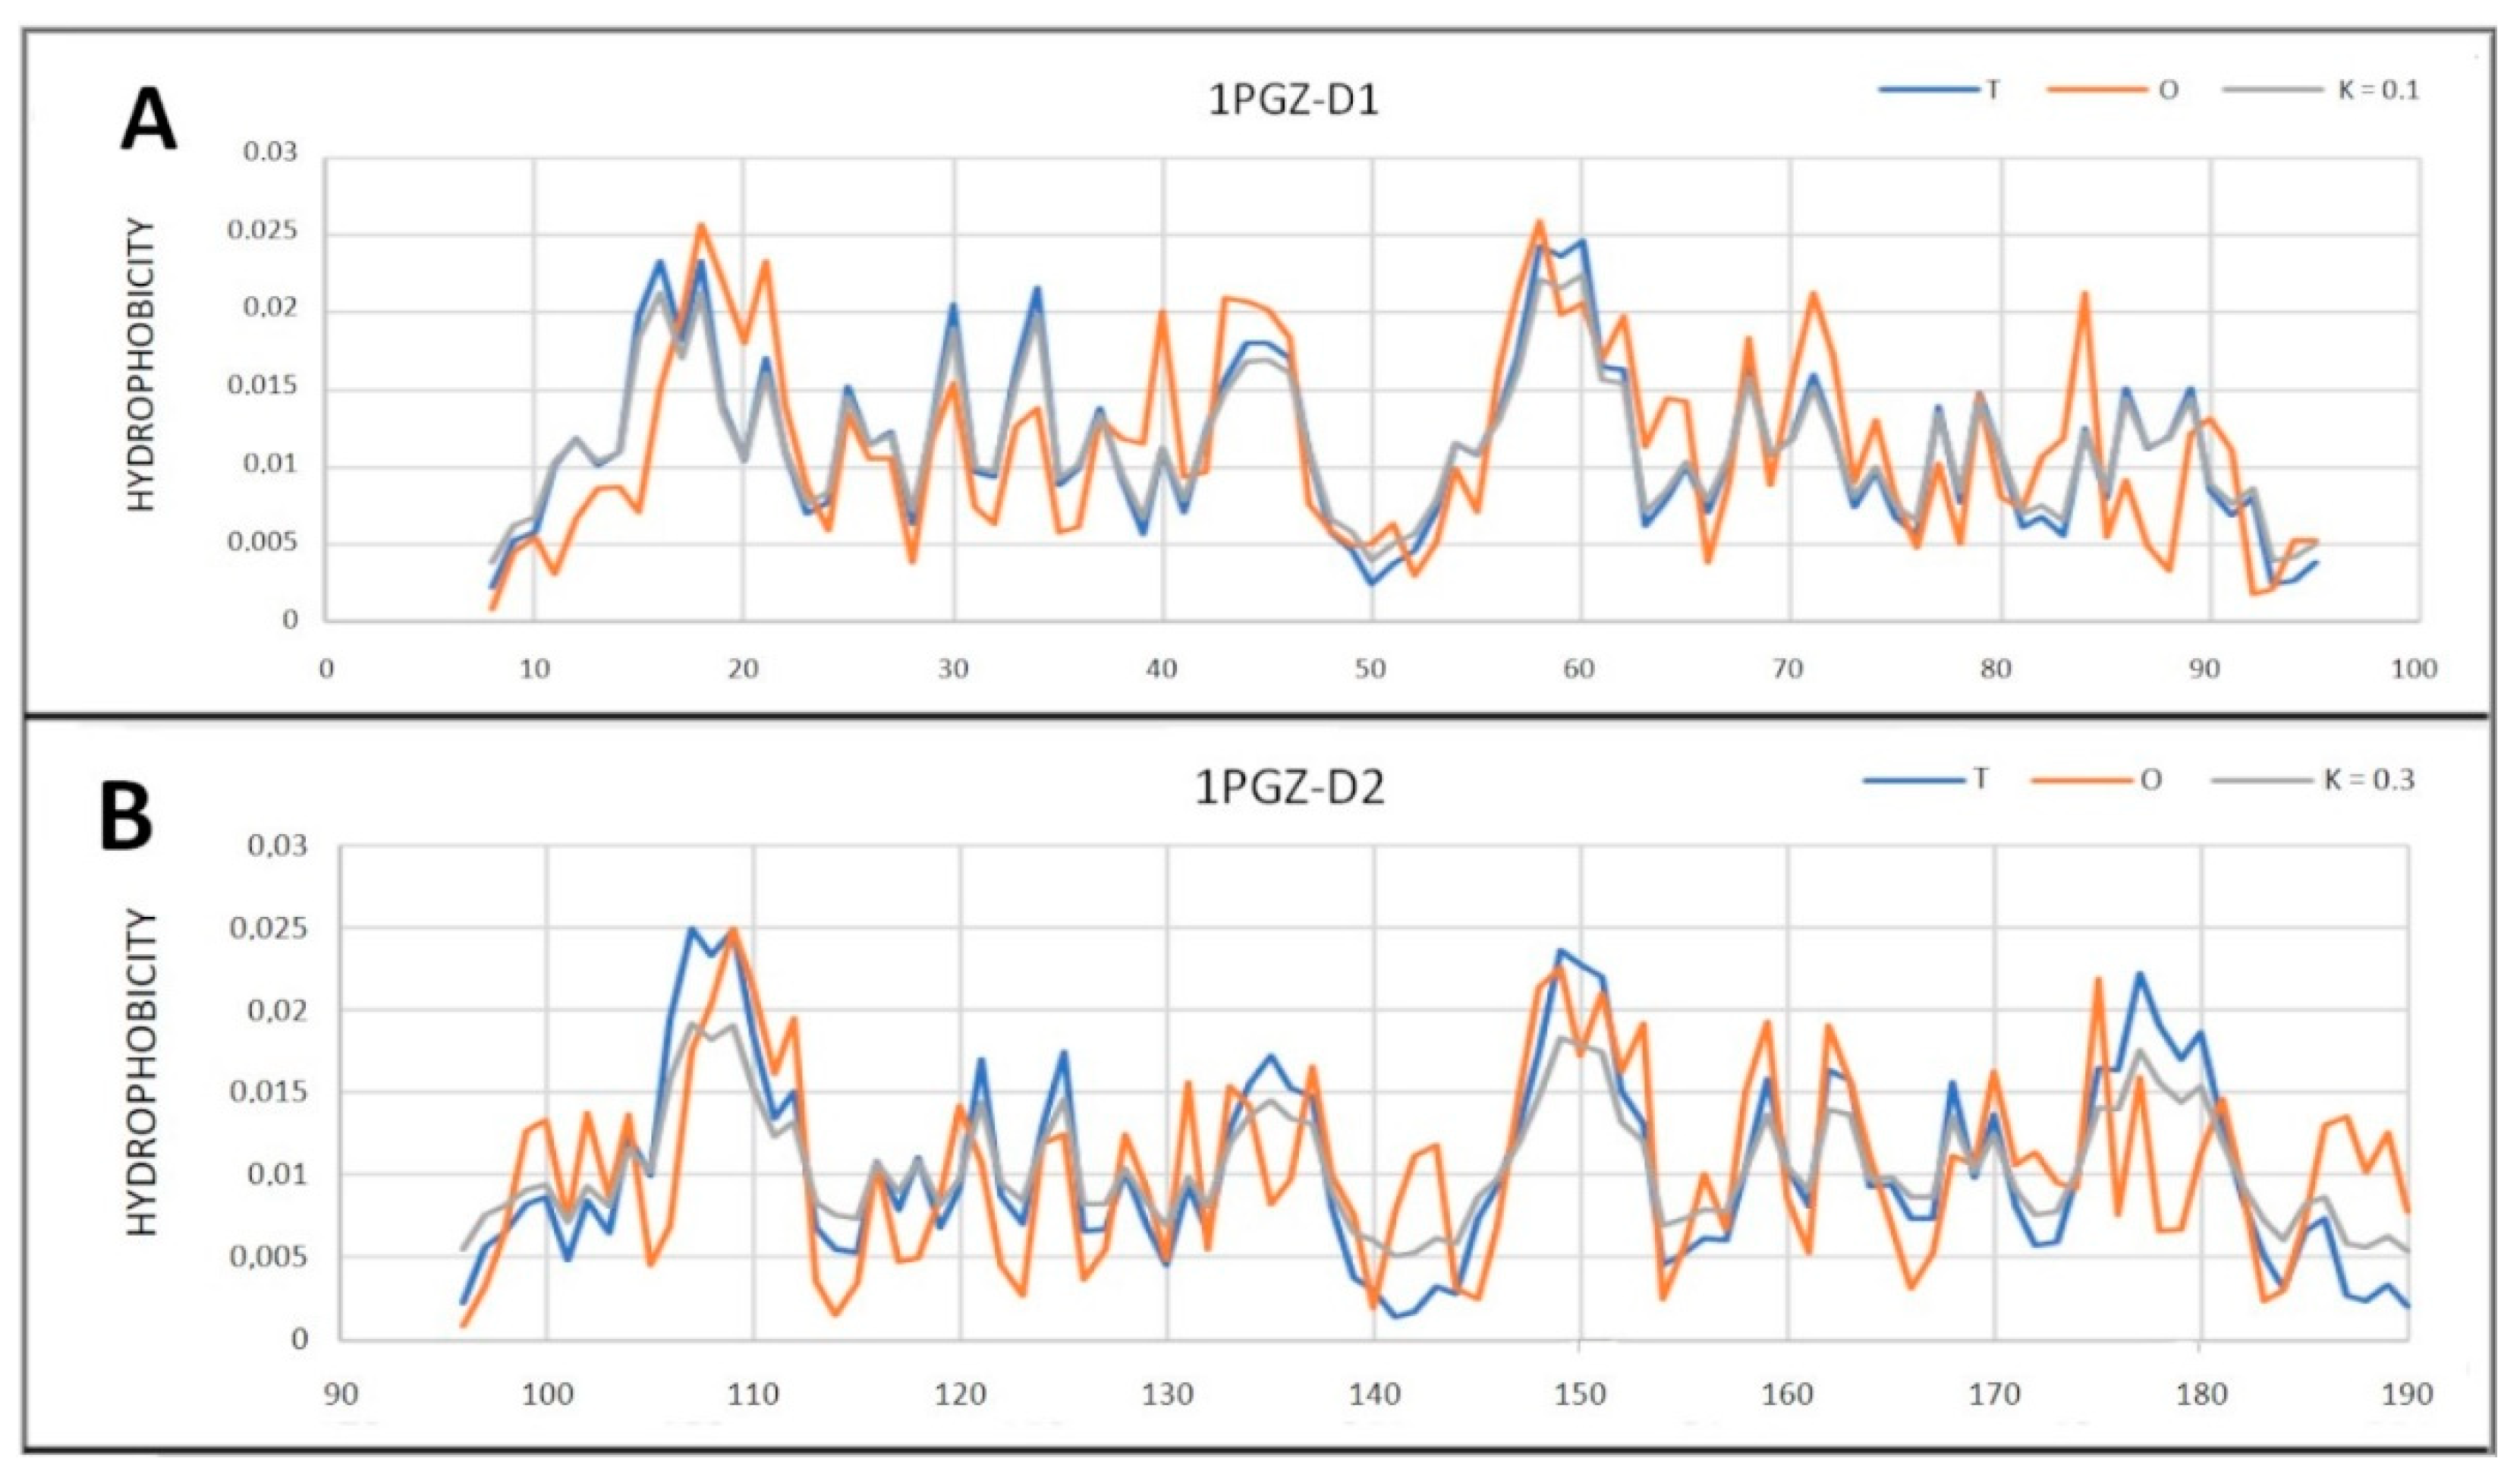
| 1PGZ | 0.582 | 0.6 | ||||||
| D1 (8–95) | 0.319 | 0.1 | ||||||
| D2 (96–190) | 0.454 | 0.3 | ||||||
| PDB-ID | Fibril Superfibril | Proto-Fibril | Chain—Individual | |||
|---|---|---|---|---|---|---|
| RD | K | RD | K | RD | K | |
| 7LNA | 0.718 | 1.0 | 0.706 | 1 | ||
| 6LNI (2) | 0.717 | 2.2 | 0.650 | 0.7 | 0.708 | 0.7 |
Publisher’s Note: MDPI stays neutral with regard to jurisdictional claims in published maps and institutional affiliations. |
© 2021 by the authors. Licensee MDPI, Basel, Switzerland. This article is an open access article distributed under the terms and conditions of the Creative Commons Attribution (CC BY) license (https://creativecommons.org/licenses/by/4.0/).
Share and Cite
Roterman, I.; Stapor, K.; Gądek, K.; Gubała, T.; Nowakowski, P.; Fabian, P.; Konieczny, L. On the Dependence of Prion and Amyloid Structure on the Folding Environment. Int. J. Mol. Sci. 2021, 22, 13494. https://doi.org/10.3390/ijms222413494
Roterman I, Stapor K, Gądek K, Gubała T, Nowakowski P, Fabian P, Konieczny L. On the Dependence of Prion and Amyloid Structure on the Folding Environment. International Journal of Molecular Sciences. 2021; 22(24):13494. https://doi.org/10.3390/ijms222413494
Chicago/Turabian StyleRoterman, Irena, Katarzyna Stapor, Krzysztof Gądek, Tomasz Gubała, Piotr Nowakowski, Piotr Fabian, and Leszek Konieczny. 2021. "On the Dependence of Prion and Amyloid Structure on the Folding Environment" International Journal of Molecular Sciences 22, no. 24: 13494. https://doi.org/10.3390/ijms222413494
APA StyleRoterman, I., Stapor, K., Gądek, K., Gubała, T., Nowakowski, P., Fabian, P., & Konieczny, L. (2021). On the Dependence of Prion and Amyloid Structure on the Folding Environment. International Journal of Molecular Sciences, 22(24), 13494. https://doi.org/10.3390/ijms222413494